Abstract
This work aimed to assess and characterize the air quality in what concerns particulate pollution in urban–industrial environments. The main objectives were to study the spatial variability of the deposition flux of particulate pollution identifying areas with higher deposition and to associate the variability with climatological variables and with possible surrounding emitting sources. The method for collecting the deposited particles was based on the standard NF X 43–007. Sampling for particulate pollution took place between April 2015 and February 2016 through seven sampling campaigns. Maps of the spatial dispersion for the particulate pollution were obtained through statistics and geostatistics techniques. Elemental identification by scanning electron microscopy (SEM) was also used but only in two sampling campaigns. The results show that the sampling campaigns that took place during hot and dry periods, 2nd and 3rd, present higher deposition flux: 2.04 g/(m2 × month) and 1.72 g/(m2 × month), respectively. Lower deposition fluxes were registered in the 6th and 7th campaigns: 0.23 g/(m2 × month) and 0.24 g/(m2 × month), respectively. A recurrent high deposition was also observed at specific sampling points that may be due to both the nearby road traffic and the presence of chimneys. SEM analysis allowed to associate repetitive element deposition, at the same sampling point, to the same emitting source.
1. Introduction
Atmospheric particles, also known as particle pollution or particulate matter (PM), is a mixture of particles and droplets in the air containing a variety of components such as organic compounds, metals, acids (such as nitrates and sulfates), soil, and dust [1].
Particle pollution is one of the six major air pollutants reported by the World Health Organization along with ground-level ozone, carbon monoxide, sulfur oxides, nitrogen oxides, and black carbon [2]. Short-term exposure to air pollutants is closely related to COPD (Chronic Obstructive Pulmonary Disease), cough, shortness of breath, wheezing, asthma, respiratory disease, and high rates of hospitalization (a measurement of morbidity). The long-term effects associated with air pollution are chronic asthma, pulmonary insufficiency, cardiovascular diseases, and cardiovascular mortality [3,4]. Concerning the damage to the environment, reduced visibility is the main perceptible problem, especially in urban areas. Particle deposition can cause damage to vegetation and watercourses, depending on the composition, concentration, toxicity, or size, and it also has a negative impact on the external appearance of buildings and architectural monuments. Additionally, it poses a serious threat to living organisms.
Particulate pollution comes from a variety of sources, which can be natural and anthropogenic. Natural sources include dust from soil and volcanoes, sprays of seawater, sand and dust from windstorms, pollens, spores, bacteria, plant fibers, etc. Air pollution from anthropogenic sources presents one of the biggest public health hazards worldwide, given that it is responsible for about 9 million deaths per year [2]. Particulate matter from anthropogenic sources results from diverse sources, but construction and demolition activities and urbanization activities increase urban dust loads with different size fractions and contaminants [5]. Paved and unpaved streets/roads, construction, and demolition activities are the largest contributors to urban dust [6,7]. Different types of dust (suspended, settling, and heavy) [3] may be present in urban environments. Other sources come from ash, tobacco smoke, soot, and other particles produced mainly by the combustion of coal and fuel oil in industry and diesel motor vehicles. Traffic sector is considered a major contributor to heavy metal emission and dust particles of 10 µm [8,9].
The relationship between adverse health effects and particle pollution exposure is well known either in acute or chronic exposure [3]. The size of particles is one of the parameters that mostly influence the potential damage to human health as their penetration in the human body is closely dependent on their size. Those particles that are of 10 micrometers in diameter or smaller, generally pass through the throat and nose and enter the lungs. Once inhaled, these particles can affect the heart and lungs and cause serious health effects. Particles smaller than 2.5 µm are the most harmful to health, as they can penetrate deeply into the lungs during breathing and accumulate there. The deposited particles cannot be excreted immediately by the clearance mechanism of the human body and remain in place for a long time. Respiratory diseases are caused by particle deposition, especially in the alveoli [10].
Epidemiological studies have shown clear evidence of particle pollution exposure associated with increased mortality from all causes, cardiovascular disease, respiratory disease, and lung cancer [11]. Exposure to street dust has been associated with adverse health effects [12] related to the toxicity of dust contents such as heavy metals [13], mineral compounds [14,15], and microorganisms [16,17].
Because of its complexity and the influence of particle size in determining the exposure and the resulting health effects, different terms are used to classify the particulate pollution. Some are related to the sampling and/or analytical technique, e.g., "suspended particulate matter", "total suspended particulates", "black smoke". In contrast, others are related to the part of the affected respiratory tract, e.g., "inhalable particles", which pass beyond the upper airways (nose and mouth), and "thoracic particles", which deposit within the lower respiratory tract [18].
According to the type, particle pollution is classified into four main groups: (i) gas contaminants, which include particulate matter in aerial masses; (ii) particulate contaminants (soot, tobacco smoke, oils smoke, fly ash, and cement dust); (iii) biological contaminants (bacteria, viruses, fungi, mold, and bacterial spores), cat allergens, house dust and allergens, and pollen; and (iv) types of dust (suspended atmospheric dust, settling dust, and heavy dust).
According to the size, particle pollution is generally referred to two main categories: (i) those with an aerodynamic diameter of 10 micrometers or less (PM10) usually found near roadways and dusty industries—the "inhalable coarse particles" and (ii) those found in smoke and haze, with a diameter of 2.5 micrometers or less (PM2.5), such as directly emitted from sources such as forest fires, associated with gases emitted from power plants, industries, and automobiles—the "fine particles". Another important characteristic is the chemical composition of particle pollution. The presence of toxic compounds such as heavy metals, polyaromatic hydrocarbons, and other carcinogenic substances are responsible for some of the adverse health effects, although compositions may change over time. Therefore, the characterization of the composition, sources, transport, and fate of aerosol particles is of utmost importance to understand the effects of particle pollution on human health and establish an effective control program [19].
The single-particle analysis provides direct information on the composition and morphology of aerosol particles [20,21,22]. There are many different particle shapes in the atmosphere (isometric particles, platelets, and fibers) but they are assumed to be spherical due to the difficulty in measuring the morphological properties [23]. Still, particles with irregular morphology can collapse into a spherical shape upon humidification [24]. Scanning Electron Microscopy (SEM) combined with Energy Dispersive Spectrometry (EDX) provides useful information about the elemental composition, size, and shape of particles, and thus is a useful technique in distinguishing particles resulting from different sources [25].
Source control is the only acceptable method for reducing particulate emissions. However, in an urban environment, particulate matter emerges from a wide range of natural and anthropogenic sources where it may be difficult to quantify the emissions and identify the sources. Furthermore, particulate matter is produced by point and nonpoint sources that are affected by climatic factors, such as wind velocity, direction, and frequency [26].
The exposure to particle pollution varies in outdoor microenvironments, the duration of stay, and the involvement in particular activities. The time spent in specific microenvironments is a decisive factor for exposure and risk level for an individual. Data collected from central monitoring stations do not accurately reflect the local exposure to air pollutants [27]. Local regular monitoring is necessary to identify these situations. Therefore, there is a need to quantify the effect of ambient particulate matter loads in particular sites and establish effective measures to reduce the exposure and constrain the health effects.
The present work is focused on the assessment and characterization of air quality on the Polo II—Asprela Campus of the University of Porto, Portugal. The characterization comprised the study of the spatial variability of particle pollution flux deposition within the campus area. Seven continuous sampling campaigns were carried out to collect atmospheric particulates in strategic locations within the campus. The main objectives were to evaluate the deposition flux in microenvironments within the campus, to determine potential contributing factors influencing the emissions and deposition, and to identify the locations with higher deposition flux to take measures to reduce the exposure.
2. Experiments
The adopted methodology followed four stages. The first stage concerns the definition of the sampling locations within the campus. The second stage involves the fieldwork developed to collect the particulate matter that was carried out in seven sampling campaigns between April 2015 and February 2016. The third stage includes the laboratory work to remove the aerosols attached to the resin, filtration, and weighing the collected material to calculate the deposition flux (mass/time x area). At the final stage, the particulate matter was analyzed by Scanning Electron Microscopy (SEM).
Statistical analysis was applied to the obtained results for the deposition flux, combined with the local meteorological data registered during each one of the sampling periods. The study involved classical statistics and geostatistics techniques to assess the directional behavior of the deposition flux as well as the behavior and interference of the variables likely to influence the deposition of particulate matter.
2.1. Study Area
The university campus of Asprela is located in the parish of Paranhos, Portugal, on the northern edge of the city of Porto, near the Circunvalação ring road (EN12) (Figure 1). The Asprela campus comprises an area of about 145 hectares (Figure 2). Currently, the Asprela campus is dominated by 21 educational, health, and research institutions, mostly composed of the faculties and research centers of Porto University. The Polytechnic Institute of Porto has also installed two of its faculties in this area, and the Portuguese Catholic University operates the Faculty of Biotechnology (ESB) also at the Asprela campus.
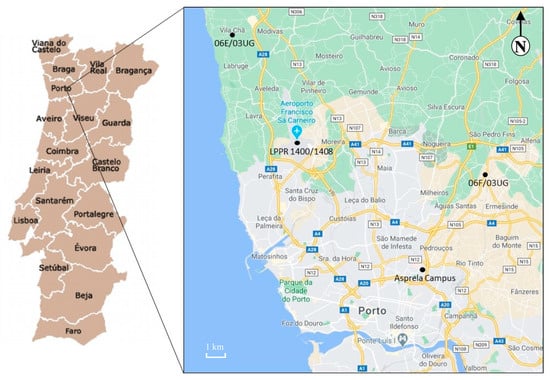
Figure 1.
Location of the university campus of Asprela, Porto, Portugal (Google Maps, 2020).
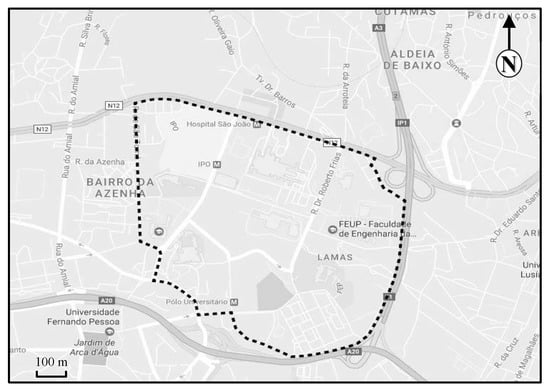
Figure 2.
Area of the university campus of Asprela (Google Earth, 2017).
In addition to university facilities, there are other services such as hospital facilities: Hospital S. João (HSJ) and Oncological Porto Institute (IPO). Both are responsible for much of the daily traffic in the area. There is high daily affluence to the campus through the accesses from the N12 ring road and the A3 and A20 motorways. Regarding access through public transport, it can be easily done by subway and bus services.
2.2. Sampling Site
The assessment of the dispersion and deposition of particulate matter focused essentially on potentially critical areas within the Asprela’s campus: campus parking lots, socializing and student’s living areas (high turnout area), outside eating facilities and athletic fields (low traffic), and low turnout area students representing the "background" site (used as the blank or control sampling points). Therefore, 35 sampling points, considered as critical within the campus area, were defined to place the particulate matter collectors (Figure 3).
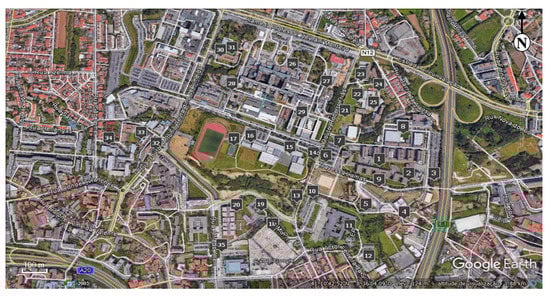
Figure 3.
Sampling area within the Asprela’s University Campus (Google Earth, 2017).
The locations of the sampling points were adapted in many cases to the field conditions (access to the locations and the existence of conditions to place the collectors) as well as the risk of being removed (some sampling points were located in inhabited areas). The identification of each sampling point and the possible emission source is presented in Table 1.

Table 1.
Identification of the sampling points (SP) and the influence of possible emission sources.
The sampling duration, as well as the starting and finishing dates, are presented in Table 2. The number of sampling campaigns was defined according to the exposure time stipulated in the dust fallout collection procedure. The primary purpose was to take continuous sampling periods as much as possible.
Table 2.
Sampling campaigns duration.
2.3. Particulate Matter Collection Methodology
The collection of particulate matter was carried out by a passive collection system following the French standard NFX43–007 (1973). This methodology consists of a 50 cm2 stainless steel slice horizontally fixed at a defined height above the ground with a silicone cover (Polydimethylsiloxane) to trap dust fallout. The same sampling procedure was carried out at sampling points selected as a control, theoretically away from the possible influence of anthropogenic sources. About 35 slices were placed in the study area at approximately 2.5 meters above the ground. This height above the ground was adopted to assure that the collectors were recovered without being damaged.
Seven sampling campaigns (SC1–SC7) were carried out in the study area between April 2015 and February 2016. Approximately, one month was chosen for the collection of the particulate matter and the determination of the deposition flux, taking into consideration the logistic factors of placing and removing the collectors. For the SC4 and SC6, the exposure time was longer than one month due to the closing of some Faculties for vacations. Sampling campaign number 5 was also longer because of the meteorological conditions, which made it impossible to remove the collectors. Sampling point Nº 35 was canceled, after SC3, because the collector disappeared twice.
After the exposure period, the aerosols attached to the resin were removed at the laboratory. The collectors were rinsed with an organic solution (dichloromethane) and filtered in a glass filtration system (Buchner funnel) over a 0.22 µm Hydrophobic Teflon membrane filters with 47 mm diameter. Filters were dried through the pressure in the vacuum pump and weighted in a precision balance to obtain the particle deposition flux expressed in weight per unit area per unit time (g m–2 month–1). Each membrane filter was previously tared.
2.4. Scanning Electron Microscopy Analysis—SEM
The SEM studies were carried out at the Scanning Electron Microscopy and Microanalysis Laboratory, Microstructure and Microanalysis Unit—IMICROS, at the Materials Center of the University of Porto (CEMUP). The equipment used was a high-resolution Environmental Scanning Electron Microscope (Schottky), with X-Ray Microanalysis and Analysis of Diffraction Patterns of Retro–fused Electrons: FEG–ESEM/EDS/EBSD (Field Emission Source (FES) - Environmental Scanning Electron Microscope (ESEM)/Energy Dispersive Spectrometer (EDS)/Electron-Backscatter Diffraction (EBSD).
The methodology adopted for SEM samples preparation consisted of selecting the region of each filter, with the most substantial amount of particles. Sections of 1.5 mm by 1.5 mm were cut with scissors from this region and mounted with double-sided tape on a copper plate.
The SEM analysis was carried out in two sessions for the particulate matter collected during SC2 and SC3. For the first session, 33 samples from SC2 were analyzed and for the second session, seven samples from SC3 were selected. These two sampling campaigns were selected based on the amount of particulate matter collected.
2.5. Meteorological Data
Meteorological data were continuously collected from three fixed stations located a few kilometers from the campus: 06F/03UG (~7 km, Ermesinde: 41.221, –8.559); LPPR 1400/1408 (~9 km, Francisco Sá Carneiro airport: 41.248, –8.681); and 06E/03UG (~19 km, Vila Chã: 41.296, –8.716) (Figure 1). These stations are the closest to the sampling site with free available data. Daily average, maximum and minimum values were automatically extracted for temperature, rainfall, and wind velocity and direction. The WRPLOT View™ software (Lakes Environmental Software, Waterloo, Ontario, Canada) was used to generate the wind rose with the collected data.
2.6. Data Analysis Tools
Maps on the spatial distribution of the dust fallout flux were developed for the study area through the use of geostatistical interpolation technique. The ordinary kriging was applied to create the prediction maps of the spatial dispersion. This interpolation technique is probably the most widely used to estimate a value at a point of a region for which a variogram is known, using data in the neighborhood of the estimation location. The ordinary kriging was performed with Golden Software Surfer 8.0.
3. Results
3.1. Climatological Data
Data for wind direction, precipitation, and average wind speed were extracted from the meteorological stations and are presented in Table 3. For wind characteristics, rose winds were also generated per each sampling campaign. The rose winds from SC3 and SC6 data were selected (Figure 4) as representing the period of lowest wind velocity and rainfall (SC3) and the period with the highest wind velocity and rainfall (SC6).
Table 3.
Data on the meteorological characteristics verified during the sampling campaigns.
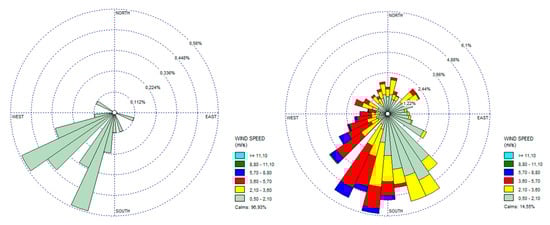
Figure 4.
Rose winds (direction and average wind speed) for SC3 and SC6 periods.
According to the climatological bulletins for Portugal, April and May 2015 (SC1) were considered very hot and dry months. Rainfall was on average of low intensity, which promoted the deposition and, therefore, had a minor effect on the washout of the deposited particulate matter. Rainfall was, on average, much lower than typical values for this time of the year, showing the drought situation occurring throughout the national territory since February. Regarding wind direction, it was predominantly from NW–N to SE–S, and the wind speed recorded during this period is characterized by its low intensity, with an average of 0.1 m/s.
June 2015 (SC2) was the warmest month in the last 10 years. The average temperature during this month was 22 °C, and in May, it was 19 °C, so this sampling period can also be characterized as hot. On average, the precipitation was 1.0 mm and, on most days, there was no precipitation at all; therefore, this period can be considered as dry. Nevertheless, the maximum value for total daily precipitation was 33.6 mm registered on June 14. This day was probably unfavorable regarding the deposition of particulate matter due to the washout. However, this effect will appear diluted in the monthly deposition flux. In this campaign, the wind direction was predominantly to the south, in particular towards Southwest (SW). The wind speed during this period was characterized, again, by its low intensity, with an average of 0.1 m/s, where for 17 days in a row the wind speed was approximately 0.0 m/s, so this campaign took place in a period characterized by "very light wind".
The SC3 was also characterized as hot and dry weather. No rainfall events occurred during this period (from 15 June to 22 July). Wind direction was predominantly from Northeast (NE) to SW. This period was characterized by calm winds and the wind velocity was 0.0 m/s for 20 days in a row (Figure 4).
The SC4 was the longest one with a duration of 85 days. This sampling period was characterized as cold and dry with a few rainfall events. Wind direction was predominantly to SW. Wind velocity was also more expressive in this sampling campaign, starting to increase, being possible to observe similar behavior for rainfall.
For SC5, the weather was also considered as warm, although this sampling campaign went throughout the autumn season. Most of the rainfall events occurred during October, and in particular at the end this month. Wind direction was predominated to SW, although in some situations the direction was also to SE. Wind velocity presented higher maximum values in this period.
In what concerns the period of SC6, it was also considered a hot or warm one with higher rainfall events, in particular, during January, where there were only four days without rainfall. The maximum rainfall value (43.2 mm) was registered during January. Concerning the wind direction, during this period, it was predominantly to the south. Higher values for the wind velocity were registered during this sampling campaign (3.60–5.70 m/s) (Figure 4).
The last sampling campaign, SC7, was carried out also through a rainy period, with 4.8 mm of precipitation, and wherein only 12 out of 35 days there was no precipitation. For the wind direction, there was a variation mostly in all directions. Wind velocity was on average 2.0 m/s during this sampling campaign.
3.2. Particulate Matter Deposition Flux
The results of the deposition flux for each sampling campaign are presented in Table 4.
Table 4.
Statistical characteristics of the calculated deposition flux.
The deposition flux was higher during SC2 and SC3 and much lower during SC6 and SC7, which can be explained by the variation of the meteorological conditions. Both sampling campaigns, SC2 and SC3, were characterized by hot and dry months, with higher temperature values than usually for the same period in previous years. Rainfall was scarce according to the meteorological drought registered for seven months with only minor rainfall events only in SC2. Wind direction was predominantly to the south, in particular towards SW, and the wind velocity was characterized by its low intensity of 0.1 m/s on average.
In SC6 and SC7, several events of heavy rainfall occurred, although the SC6 experienced higher temperatures than the normal for this season. Both campaigns were characterized by intense and sometimes continuous precipitation periods. Concerning the wind direction, it was predominantly to the south in SC6 while for SC7 it was spread through all directions. Higher values for the wind velocity were registered during SC6 and SC7, on average 4.6 m/s and 2.0 m/s, respectively.
3.3. Spatial Dispersion for Particulate Matter Deposition Flux
Data from the particulate matter collected in SC1 were not included in the spatial distribution as some filters were damaged during the laboratory procedure. The spatial distribution of the dust deposition fluxes for SC2 and SC3 are presented in Figure 5.
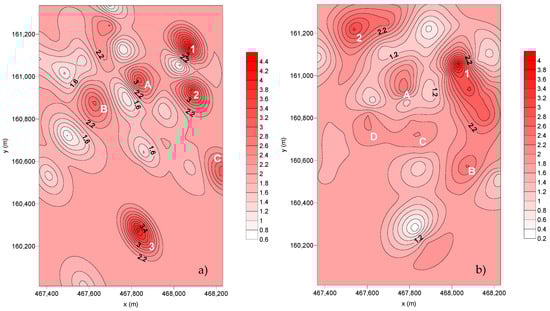
Figure 5.
Spatial distribution of the dust flux deposition (g m–2 month–1): (a) SC2 and (b) SC3.
Concerning the dispersion of the deposition flux from SC2, it is possible to observe three points with preferential deposition (1, 2, and 3) and three additional preferential deposition areas (A, B, C):
- Point Nº 1—Corresponds to SP24, placed in a green area but also near a smoking spot.
- Point Nº 2—Located in the Hospital São João (SP28). This area is highly exposed to road traffic.
- Point Nº 3—Contribution of both SP33, placed in smoking and road traffic zones, and SP34, set in a zone also influenced by the road traffic.
- A—Corresponds to SP7, the cafeteria of the Faculty of Engineering. Here, the deposition flux is influenced by the car traffic of the parking lot—P1 (SP6) and the chimneys of the cafeteria.
- B—Includes the parking lot of the Faculty of Economics (SP10) and the Crematorium of Paranhos (SP13). Both are located facing Dr Roberto Frias Street, a road with high traffic, which may be the justification for the obtained values. Regarding the Crematorium, the high deposition of particles can be explained by the presence of the incineration chimneys.
- C—Corresponds to the sampling points within the Nursery School facilities (SP30 and SP31). The high amount of particulate matter collected in this area can be justified by the road traffic and the presence of the subway line as well. During this sampling campaign, the wind direction was predominantly towards SE, where ESEP (Higher School of Education) is located.
From the dispersion of the deposition flux from SC3, it is possible to observe that there are two points with preferential deposition and four wider deposition areas (A, B, C, and D):
- Point Nº 1—Includes SP23 (parking lot ESE) and SP28.
- Point Nº 2—Corresponds to the SP7.
- A—Corresponds to SP6.
- B—Located in the Student Association of the Faculty of Engineering, SP5, which corresponds to a smoking spot.
- C—Corresponds to the Crematorium of Paranhos (SP13).
- D—Corresponds to the parking lot of the Faculty of Sports (SP16).
The spatial distribution of the deposition fluxes for SC4 and SC5 is represented in Figure 6.
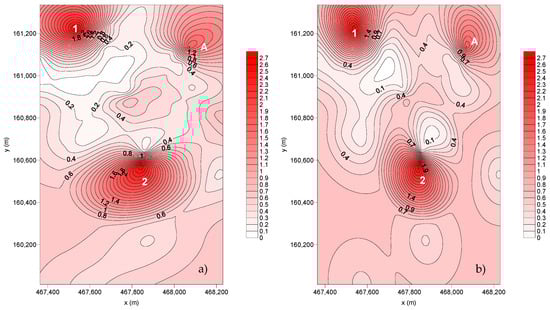
Figure 6.
Spatial distribution of the dust flux deposition (g m–2 month–1): (a) SC4 and (b) SC5.
From the dispersion of the deposition flux of SC4, it is possible to observe that are two points with preferential deposition and one wider deposition area (A):
- Point Nº 1—Corresponds to SP7.
- Point Nº 2—Corresponds to the SP18 (IPATIMUP’s building) located near a high traffic zone (parking lot and Dr Roberto Frias Street). During this sampling period, the wind direction was towards the south coincident with the location of the collector.
- A—Includes the SP25 surrounded by the canteen chimneys of the ESE.
In SC5, two points were identified as high deposition flux spots and one wider area (A):
- Point Nº 1—Corresponds to SP7.
- Point Nº 2—Corresponds to SP18.
- A—Corresponds to SP25.
The spatial distribution of the deposition fluxes for SC6 and SC7 is represented in Figure 7.
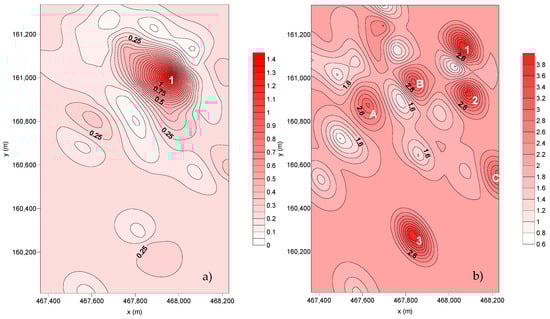
Figure 7.
Spatial distribution of the dust flux deposition (g m–2 month–1): (a) SC6 and (b) SC7.
For the dispersion of the deposition flux collected in SC6, it is possible to observe only one point with preferential deposition. For the dispersion from SC7, there are three preferential deposition points and three wider deposition areas (A, B, and C):
- Point Nº 1—includes SP23 and SP28. During this sampling campaign, there were several raining events that may have promoted the washing of the dust fallout, decreasing the collected flux.
From the last sampling campaign (SC7), it is possible to observe that there are three points with preferential deposition and three preferential deposition areas (A, B, C):
- Point Nº 1—Corresponds to SP25.
- Point Nº 2—Corresponds to SP28.
- Point Nº 3—Influenced by both SP33 and SP34.
- A—Influenced by both SP10 and SP13.
- B—Corresponds to SP7.
- C—Influenced by both SP30 and SP31.
For all sampling campaigns, higher deposition fluxes occur at the same sampling locations: SP7, SP13, SP25, and SP28 (Table 5). Lower frequencies were observed in SP10, SP18, SP23, SP30, SP31, and SP33 followed by SP5, SP6, SP16, SP24, SP32, and SP34. In some cases, higher deposition fluxes were obtained in quite different seasons: SP10, SP13, SP28, SP30, SP31, and SP33.
Table 5.
Frequency of sampling points with higher deposition flux.
3.4. Particulate Matter Analysis by SEM
Based on the elemental composition and morphology, the collected particles may be associated with different groups according to their origin: geogenic, anthropogenic, and biogenic. Geogenic particles consist of natural particles with a crustal origin. They are comprised of quartz, aluminosilicates, calcium-rich particles, chloride-based particles, and iron/titanium oxides. The anthropogenic group includes carbonaceous and industrial particles, and their origin is mostly from local emissions. Biogenic aerosols included particles of biological nature, dead or alive, such as spores, pollen, and plant debris and animal matter.
Aluminosilicates are minerals containing aluminium oxide (Al2O3) and silica (SiO2) and are present in ~72% of the total chemical compounds in Earth’s crust [28,29]. The soil-derived aluminosilicates particles are generally composed of Si and Al oxides with varying amounts of Na, K, Mg, Ca, Fe, and Ti. Aluminosilicates particles may present different shapes and sizes: triangular-shaped (biotite), trapezium-shaped (K–feldspar), soap-like (Na–feldspar), and tablet-like (Calcium magnesium aluminosilicate). They are used as a raw material in the manufacture of cement, glass, and ceramics. Aluminosilicates particles were identified in SP7, SP8, SP9, SP14, SP19, SP22, SP23, and SP35 (Figure 8a).
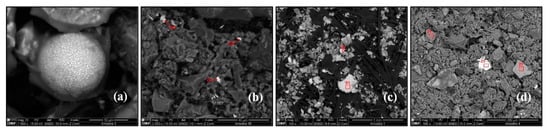
Figure 8.
Scanning electron microscopy images of (a) aluminosilicates particles, (b) biotite particle, (c) silicon particles, and (d) quartz particles.
Biotite is a common mineral in the silicate class, phyllosilicate subclass, micas group, and ferromagnesian subgroup, which contains potassium, magnesium, iron, and aluminium in its composition: K(Mg, Fe)3(OH, F)2(Al, Fe)(Si3O10). Biotite has a small number of commercial uses, it is used in the manufacture of paints, as an additive in drilling muds, in the production of rubber products, and as a non-stick surface coating on asphalt shingles and roofs. Biotite particles were identified in SP8 (Figure 8b).
Silicon (Si) is the second most abundant element on the Earth’s crust, making up more than 28% of its mass. It appears in clay, feldspar, granite, quartz, and sand, usually in the form of silicon dioxide (SiO2) and silicates. Silicon is the main component of glass, cement, ceramics, and silicones. Pure Si particles are of natural origin as well as artificial origin. In the Earth’s crust, Si is a component of sandstone and granite. Most of the construction materials are minerals that contain silicon in their composition. Silicon particles were identified at SP17, SP25, and SP37 (Figure 8c).
Quartz (SiO2) is formed by 46.7% of silicon and 53.3% of oxygen. It is an almost pure chemical compound and has constant properties. The primary origin of quartz in the atmosphere is soil, but it is also found in building materials such as cement, glass, ceramic, bricks, and clays. Quartz particles were identified in SP32 (Figure 8d). The red squares in the above figures represent the area used to quantify the mineral composition by EDS.
Zircon (ZrSiO4) is a mineral belonging to the group of nesosilicates (zirconium silicate). Heavy mineral suites, represented by zircon, provide valuable evidence about the origin of sediment and interpretation of their provenance [30]. Zircon reflects the granitic igneous rock origin. Zircon particles were identified in SP2, SP4, SP5, SP8, SP23, SP24, SP26, SP29, and SP30 (Figure 9a).
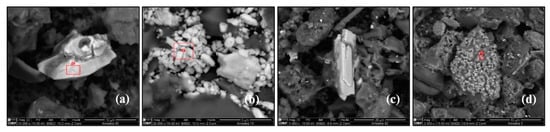
Figure 9.
Scanning electron microscopy images of (a) zircon particles, (b) barium sulfate particles, (c) strontium sulfate particles, and (d) calcium carbonate particles.
Barium sulfate is a white crystalline solid, with the chemical formula BaSO4. It is used in several industries: steel, chemical, paper, rubber, paint, plastics, glass, oil, and natural gas industries. Barium sulfate particles were identified in SP1, SP2, SP3, SP5, SP7, SP10, SP11, SP14, SP21, SP23, SP26, SP29, and SP34 (Figure 9b).
Strontium sulfate, SrSO4, is of interest as a naturally occurring precursor to other strontium compounds, which are more useful. In industry, it is converted in carbonate (to be used as a ceramic precursor) and in nitrate (to be used in pyrotechnics). Strontium sulfate particles were identified only in SP9 (Figure 9c).
Calcium carbonate (CaCO3) is the most abundant non-silicate material in arid soils and is expected to be a major constituent in mineral dust aerosol. In the atmosphere, the particles of calcium carbonate will react with acid gasses to form calcium salts, such as the reaction with nitric acid to form hygroscopic 10Ca(NO3)2. Calcium carbonate particles were identified in SP22 (Figure 9d).
Apatite is a mineral in the phosphate group, with the following variants: hydroxyapatite, fluorapatite, and chlorapatite. The generic chemical composition is Ca5(PO4)3(OH, F, Cl). It is used mainly for the production of chemical fertilizers and phosphoric acid. Apatite particles were identified in SP10.
Monazite is a phosphate mineral that contains rare-earth elements (~70% REE). Due to variability in composition, (Ce, La, Nd, Th) (PO4, SiO4), monazite is considered a group of minerals. According to dominant REE contents, monazite is divided into monazite–(Ce), monazite–(La), monazite–(Nd), and monazite–(Sm), and the first type is most common in nature. It is a naturally occurring radioactive material (due to the presence of thorium and uranium). Monazite occurs as accessory minerals in igneous, metamorphic, and sedimentary rocks. Besides, monazite is found throughout the world in placer deposits and beach sands. Monazite particles were identified in SP2, SP4, SP6, SP8, SP9, SP14, SP16, SP18, SP21, SP24, SP26, SP27, and SP33 (Figure 10a).
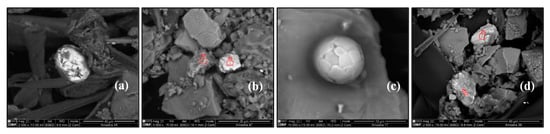
Figure 10.
Scanning electron microscopy images of (a) monazite particles, (b) xenotime particles, (c) pure copper sphere 10 µm, and (d) pyrite.
Xenotime is a rare mineral composed of yttrium phosphate (YPO4). Source rocks for xenotime are generally granites and pegmatites. When associated with classical monazite, tourmaline, rutile, and zircon, it reflects a predominantly granitic source. Xenotime is widely used in the manufacture of alloys. Xenotime was found in SP1, SP8, SP11, and SP30 (Figure 10b).
Copper is one of the essential metals at industrial level and is characterized by its red color and particular properties such as electrical conductivity. Most of its uses are based on this property or the fact that it is also a good thermal conductor. However, many of its applications also rely on one or more of its other properties (e.g., corrosion-resistant, ductile, antibacterial, etc.). In urban environments, it is used mainly in electricity for cables and wires. It is also used in civil construction in roofs, gutters, and window frames. Brake pads are responsible for a significant fraction of copper in urban dust as well. In this study, the subway which serves the campus is above ground in several parts of the line. In other cases, the coal-fired furnaces used to heat private homes may also have contributed to the collected copper particles, identified in SP23, SP24, SP25, and SP27 (Figure 10c).
Pyrite (FeS2) is an iron sulfide. In the past, pyrite was the main source of sulfur and sulfur dioxide used for bleaching, and to produce sulphuric acid. Sulphuric acid applied to phosphate rock makes superphosphate for agriculture. Pyrite particles were identified at SP7 (Figure 10d).
Chromium is a naturally occurring element in rocks, animals, plants, soil, and volcanic dust and gases. Chromium occurs in the environment primarily in two valence states, trivalent chromium (Cr III) and hexavalent chromium (Cr VI). Exposure may occur from natural or industrial sources of chromium. Air emissions of chromium are predominantly of Cr III and in the form of small particles or aerosols. The most important industrial sources of chromium in the atmosphere are those related to ferrochrome production. Ore refining, chemical and refractory processing, cement-producing plants, automobile brake lining, and catalytic converters for automobiles also contribute to the atmospheric burden of chromium [31]. Chromium particles were identified in SP28 (Figure 11a).
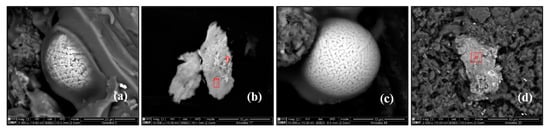
Figure 11.
Scanning electron microscopy images of (a) chromium particle, (b) tin particles, (c) iron oxide particle, and (d) zinc oxide particle.
Tin is a silvery, malleable metal, solid under environmental conditions, oxidizing easily with air, and resistant to corrosion. As a pure metal, tin is used in the construction of tubes and valves and in the manufacture of containers. The tin powder is used in the manufacture of paints and sprays. Tin particles were identified at SP5 and SP24 (Figure 11b).
Iron (III) oxide or ferric oxide, also known as hematite (Fe2O3), has a metallic content of around 65%. Most of the iron oxides have their origin in the resuspended road and soil dust. In urban environments, pulverized hematite is used for paint and polishing. Iron oxide particles were identified in SP3, SP4, SP5, SP6, SP7, SP8, SP9, SP10, SP11, SP12, SP13, SP14, SP15, SP16, SP17, SP18, SP19, SP20, SP21, SP22, SP23, SP24, SP25, SP26, SP27, SP28, and SP29 (Figure 11c).
Zinc oxide (ZnO) is an inorganic compound that appears as a white powder when pure, but in nature, it occurs as the rare mineral zincite, which usually contains manganese and other impurities that confer a yellow to red color. It is used as an additive in numerous materials and products including cosmetics, food supplements, rubbers, plastics, ceramics, glass, cement, lubricants, paints, adhesives, sealants, pigments, foods, batteries, ferrites, fire retardants, and first-aid tapes. Although it occurs naturally as the mineral zincite, most zinc oxide is produced synthetically. Zinc oxide particles were identified at SP31 (Figure 11d).
Pyrolusite (MnO2) is the most commonly occurring manganese-bearing mineral (manganese dioxide), which is the most important manganese mineral (63% manganese). Manganese does not occur naturally as a base metal but is a component of more than 100 minerals. Crustal rock is a major source of manganese found in the atmosphere. The major anthropogenic sources of environmental manganese include municipal wastewater discharges, sewage sludge, mining and mineral processing (particularly nickel), emissions from alloy, steel, and iron production, combustion of fossil fuels, and, to a much lesser extent, emissions from the combustion of fuel additives. It is widely applied in the production of steel [32] and also used in electric batteries, glass, photographs, and chemicals. Pyrolusite particles were identified at SP23 (Figure 12a).
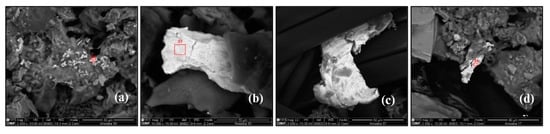
Figure 12.
Scanning electron microscopy images (a) pyrolusite particle, (b) titanium particle, (c) brass particle, and (d) stainless steel particle.
Titanium is a light metallic element, glossy and resistant to corrosion. In most cases, it is used in the form of alloys with other metals such as aluminium, iron, manganese, chromium, molybdenum, and vanadium. These applications represent 90% of the total production of titanium, and the remainder is for the construction of equipment (pumps, heat exchangers). The most important titanium compound, from an industrial point of view, is titanium dioxide, which finds wide use as a pigment in the manufacture of paints, rubber, textiles, plastics, ceramics, and cosmetics. Titanium particles were identified at SP1, SP5, SP7, SP17, SP21, SP25, SP26, SP27, and SP34 (Figure 12b).
Brass is a metallic alloy of copper and zinc. The general chemical formula of brass is Cu3Zn2. Other metals may be present, and according to their quantity and proportion, the properties of the alloy are different. Occasionally, small amounts of aluminium, tin, lead, and arsenic can be added to enhance some of the properties of this alloy depending on its application. Brass is used in the most diverse applications: condenser tubes, weapons, ammunition cartridges, radiator cores, coins, valves, car wheels, medical and surgical devices, etc. It is also an important component of disk brake systems along with copper and steel. Brass particles were identified at SP1, SP5, and SP6 (Figure 12c).
Stainless steel is a family of iron-based alloys with a minimum of 10.5% chromium, less than 1.2% carbon, and other alloying elements. Chromium produces a thin layer of oxide on the steel surface, called a "passive layer", which prevents surface corrosion; the greater the amount of chromium, the greater the corrosion resistance. Stainless steel can also contain other metals, such as nickel, molybdenum, titanium, and copper, and non-metals, such as carbon and nitrogen, which can be added to improve other properties such as strengthening malleability and increasing corrosion resistance. Stainless steel can be used in the most different applications: home appliances (large appliances and small household items), automobiles (production of parts for vehicles), construction (buildings and furniture), in the food industry, in the chemical industry, oil industry, and many others applications. Stainless steel particles were identified at all sampling points except SP8, SP12, SP15, SP16, SP17, SP22, SP25, SP27, SP28, SP30, SP32, and SP33 (Figure 12d).
4. Discussion
Particulate matter deposition strongly depends on the climatological variables and, therefore, it is expected that these variables have affected the deposition pattern during all sampling campaigns. In particular, the average air temperature registered different values throughout the seven sampling periods. The effect of air temperature on particulate matter deposition flux may be explained by the process of thermally induced convection.
During the period under analysis, on most days, there was no record of precipitation, except in the 6th and 7th sampling campaigns, which can be considered as very rainy. The dry months favored the suspension of particles in the atmosphere.
The wind speed was, on average, of low intensity and the direction was predominantly to the south, which may explain the high deposition fluxes observed in some sampling points placed in this direction (SP30, SP31, and SP18).
Sampling campaigns Nº 2 and Nº 3 were carried out during a very hot and dry period, and presented the highest deposition fluxes: 2.04 g m–2 month–1 and 1.72 g m–2 month–1, respectively. While lower deposition fluxes were registered for sampling campaign Nº 6 and Nº 7, characterized by continuous and intense rainfall events: 0.23 g m–2 month–1 and 0.24 g m–2 month–1, respectively. Besides, during the sampling campaign Nº 6, the exposure period of the collectors was longer (~65 days), which lead to the washing of the particles and also to the loss of efficiency of the resin.
In what concerns to the spatial variability of the deposition flux, a recurrent higher deposition flux at SP7 was observed, followed by SP13, SP25, and SP28. These high flux values are mostly due to car parking and road traffic and the presence of chimneys. The lower frequency was observed in SP10, SP18, SP23, SP30, SP31, and SP33. These sampling points are also affected by road traffic, smoking spots, and subway lines.
Regarding the results from the scanning electron microscopy, there are a few elements/compounds that were identified at the same sampling points for both sampling campaigns (SC2 and SC3): stainless steel—SP27; monazite—SP4, SP14, SP24, SP27; barium sulfate—SP14 and iron (III) oxide—SP27. It appears that the existence of certain elements in different locations may be an indication of the same emitting source. It was not possible to extend the SEM analysis to all sampling campaigns (time-consuming and cost) but, although inconclusive, the results can be seen as indicators of the need to carry out a complete qualitative study of particulate matter deposition in the campus.
Copper and silicon found, for example, on the collector placed in the HSJ pediatric building, may have their origin in the construction works that were taking place at the site since they are both used in civil construction and, in many cases, the construction activities and paved road dust have been identified as significant precursors of dust fallout in urban environments. Hence, it is important to analyze the material collected at the same points but from different sampling campaigns, as these construction works did not take place during all the sampling campaigns, so the result of the analysis would be different if this were the origin. The copper found at SP24 may be originated from tobacco smoke, as this is a smoking area.
Titanium dioxide, zinc oxide, barium sulfate, tin, biotite, and iron oxide are used as pigments in the manufacture of paints and, therefore, their presence can be justified by the residues of paint from the places (electricity poles, columns, waterfall tubes) where the collectors were fixed.
Stainless steel and aluminosilicate were the compounds/elements most frequently identified in the scanning electron microscopy. As they have applications in the most diverse industries, it is expected to find their presence in almost all samples.
Monazite, a mineral that corresponds to phosphate and which is a source of metals and rare earths, was found in samples located in HSJ, FEUP, FADEUP, and ESE, very close to each other. This mineral can have a natural origin because it is part of the accessory minerals of the granite of Porto (for example, degradation of monuments). Besides being common in some sands (monazite sands), these types of sands do not occur in Portugal. This mineral may also have an anthropogenic origin, for example, in the wear of road pavement. The sources of anthropogenic particles with monazite can be broken down based on their morphological and mineralogical characteristics and also grain size.
Calcium carbonate was observed in SP22 and, as previously mentioned, it is the main constituent of mortar, widely used in civil construction. This sampling point is very close to SP27, where construction works were taking place and, therefore, there may be a connection between both.
Brass was found at SP1, SP5, and SP6, locations characterized by the proximity to several car park and roads. Brass has several applications and, in this case, its source may from the structure of the vehicle passing by.
Finally, it is possible to verify the presence of titanium, and silicon particles in SP17, SP25, and SP27, which are elements used in the ceramic industry, and possibly have the same emitting source. The same can be seen at SP23, where pyrolusite, barium sulfate, and aluminosilicates were identified.
5. Conclusions
A simple passive particle collector to assess and characterize the air quality, in what concerns particulate pollution in urban–industrial environments, was used in this study to determine the deposition flux.
The spatial variability obtained by ordinary kriging allowed to identify the most problematic locations at the campus for air quality, in what concerns the amount of particulate deposition. Elemental analysis with SEM also showed the presence of several heavy metals like chromium, iron, and titanium besides others concerning elements like monazite, in the inhalable fraction of the collected particles. Adverse health effects may result from this exposure related to the toxicity of heavy metals.
The effect of the variability of the climatological variables on the deposition flux could be observed by the fact that, on average, higher deposition fluxes were obtained for the periods with lowest wind velocity and rainfall (SC3), while lower deposition fluxes were obtained for periods with higher wind velocity and rainfall (SC6). The effect of the relative humidity was not considered in this study; however, it may contribute to the dry deposition of the particles as observed in Reference [33].
Although the collection method did not allow a size–particle analysis, the collected dust includes atmospheric dust (0.01–1 µm) and settling dust (1–100 µm), both within the range PM10 and PM2.5 classification, and heavy dust (100–1000 µm).
Some of the potential sources for the collected dust were identified and some mitigation measures were proposed to reduce the exposure, such as redirect the concentration of people at some spots, like the smoking ones or outdoor waiting areas like in Hospital São João. In what concerns the road traffic, the desire would be a reduction and a limitation of vehicle access in all campuses.
The identification of emitting sources of particulate deposition in urban environments is one of the significant challenges posed by air quality assessment. Besides, data collected in central monitoring stations do not accurately reflect the local exposure to particulate pollution where the subjects are exposed to dust from multiple local sources. A local regular monitoring is necessary to identify these situations and establish effective measures to reduce the exposure and constrain the health effects.
In this study, the results raised many questions that must be further investigated in future work with a chemical analysis of all samples and particle size determination in all sampling points.
Author Contributions
Conceptualization, M.d.L.D.; methodology, M.d.L.D.; software, M.d.L.D. and M.I.G.; validation, M.d.L.D. and M.I.G.; formal analysis, M.d.L.D. and M.I.G.; investigation, M.d.L.D. and M.I.G.; resources, M.d.L.D.; data curation, M.d.L.D. and M.I.G.; writing—original draft preparation, M.d.L.D. and M.I.G.; writing—review and editing, M.d.L.D.; visualization, M.d.L.D.; supervision, M.d.L.D.; project administration, M.d.L.D.; funding acquisition, M.d.L.D. All authors have read and agreed to the published version of the manuscript.
Funding
The APC was partially funded by Base Funding - UIDB/04028/2020 of the Research Center for Natural Resources and Environment - CERENA - funded by national funds through the FCT/MCTES (PIDDAC).
Conflicts of Interest
The authors declare no conflict of interest.
References
- U.S. EPA. Integrated Science Assessment (ISA) for Particulate Matter (Final Report, 2019). EPA/600/R–19/188. Available online: https://cfpub.epa.gov/ncea/isa/recordisplay.cfm?deid=347534 (accessed on 9 September 2020).
- WHO. Air Pollution. Available online: http://www.who.int/airpollution/en/ (accessed on 17 August 2020).
- Manisalidis, I.; Stavropoulou, E.; Stavropoulos, A.; Bezirtzoglou, E. Environmental and Health Impacts of Air Pollution: A Review. J. Front. Public Health 2020, 8. [Google Scholar] [CrossRef]
- Kelishadi, R.; Poursafa, P. Air pollution and non–respiratory health hazards for children. Arch. Med. Sci. 2010, 6, 483–495. [Google Scholar] [CrossRef]
- AduGyamfi, V.; Cobbina, S.J.; Dampare, S.B.; Duwiejuah, A.B. Heavy metals concentration in road dust in the Bolgatanga municipality, Ghana. J. Environ. Pollut. Human Health 2014, 2, 74–80. [Google Scholar]
- European Environmental Agency. EEA.EMEP Air Pollutant Emission Inventory Guidebook. In Technical Guidance to Prepare National Emission Inventories; EEA Report No 13/2019; European Environmental Agency: Copenhagen, Denmark, 2019; ISSN 1977–8449. [Google Scholar]
- Amato, F.; Querol, X.; Johansson, C.; Nagl, C.; Alastuey, A. A review on the effectiveness of street sweeping, washing and dust suppressants as urban PM control methods. Sci. Total Environ. 2010, 408, 3070–3084. [Google Scholar] [CrossRef] [PubMed]
- Schauer, J.J.; Lough, G.C.; Shafer, M.M.; Christensen, W.C.; Arndt, M.F.; DeMinter, J.T.; Park, J.S. Characterization of emissions of metals emitted from motor vehicles. Research report 133. Health Effects Inst. 2006, 133, 77–88. [Google Scholar]
- Pant, P.; Harrison, R.M. Estimation of the contribution of road traffic emissions to particulate matter concentrations from field measurements: A review. Atmos. Environ. 2013, 77, 78–97. [Google Scholar] [CrossRef]
- Xing, Y.F.; Xu, Y.H.; Shi, M.H.; Lian, Y.X. The impact of PM2.5 on the human respiratory system. J. Thorac. Dis. 2016, 8, E69–E74. [Google Scholar] [CrossRef] [PubMed]
- Chen, J.; Hoek, G. Long–term exposure to PM and all–cause and cause–specific mortality: A systematic review and meta–analysis. Environ. Int. 2020. [Google Scholar] [CrossRef]
- Lin., S.; Munsie, J.P.; Hwang, S.A.; Fitzgerald, E.; Cayo, M.R. Childhood asthma hospitalization and residential exposure to state route traffic. Environ. Res. 2002, 88, 73–81. [Google Scholar] [CrossRef]
- Lippmann, M.; Chen, L.C. Health effects of concentrated ambient air particulate matter (CAPs) and its components. Crit. Rev. Toxicol. 2009, 39, 865–913. [Google Scholar] [CrossRef]
- Fanning, E.; Froines, J.; Utell, M.; Lippmann, M.; Oberdorster, G.; Godleski, J.; Larson, T. Accomplishments of the particulate matter (PM) research centers (1999–2005) and the role of interdisciplinary center–based research. Environ. Health Perspect. 2009, 117, 167–174. [Google Scholar] [CrossRef] [PubMed]
- Schlesinger, R.B.; Kunzli, N.; Hidy, G.M.; Gotschi, T.; Jerrett, M. The health relevance of ambient particulate matter characteristics: Coherence of toxicological and epidemiological inferences. Inhal. Toxicol. 2006, 18, 95–125. [Google Scholar] [CrossRef] [PubMed]
- Lighthart, B. The ecology of bacteria in the alfresco atmosphere. FEMS Microbiol. Ecol. 1997, 23, 263–274. [Google Scholar] [CrossRef]
- Alghamdi, M.A.; Shamy, M.; Redal, M.A.; Khoder, M.; Awad, A.H.; Elserougy, S. Microorganisms associated particulate matter: A preliminary study. Sci. Total Environ. 2014, 479, 109–116. [Google Scholar] [CrossRef]
- World Health Organization Regional Office for Europe. Air Quality Guidelines, 2nd ed.; WHO Regional Publications: Copenhagen, Denmark, 2000; pp. 186–193. [Google Scholar]
- Kgabi, N.A.; Pienaar, J.J.; Kulmala, M. Characterisation of Inhalable Atmospheric Particulate Aerosols. In Air Pollution XVI; Brebbia, C.A., Longhurst, J.W.S., Eds.; WIT Press: Southampton, UK, 2008; pp. 323–334. [Google Scholar]
- Utsunomiya, S.; Jensen, K.A.; Keeler, G.J.; Ewing, R.C. Direct identification of trace metals in fine and ultrafine particles in the Detroit urban atmosphere. Environ. Sci. Technol. 2004, 38, 2289–2297. [Google Scholar] [CrossRef]
- Ro, C.U.; Oh, K.Y.; Kim, H.; Chun, Y.; Osán, J.; de Hoog, J.; van Grieken, R. Chemical speciation of individual atmospheric particles using low–Z electron probe X–ray microanalysis: Characterizing “Asian Dust” deposited with rainwater in Seoul, Korea. Atmos. Environ. 2001, 35, 4995–5005. [Google Scholar] [CrossRef]
- Geng, H.; Kang, H.; Jung, J.; Choel, M.; Kim, H.; Ro, C.U. Characterization of individual submicrometer aerosol particles collected in Incheon, Korea, by quantitative transmission electron microscopy energy–dispersive X–ray spectrometry. J. Geophys. Res. 2010, 115, D15306. [Google Scholar] [CrossRef]
- Reist, P.C. Aerosol Science and Technology, 2nd ed.; McGraw–Hill: New York, NY, USA, 1993. [Google Scholar]
- Shingler, T.; Sorooshian, A.; Ortega, A.; Crosbie, E.; Wonaschuetz, A.; Perring, A.E.; Beyersdorf, A.; Ziemba, L.; Jimenez, J.L.; Campuzano–Jost, P.; et al. Ambient observations of hygroscopic growth factor and f(RH) below 1: Case studies from surface and airborne measurements. J. Geophys. Res. 2016, 121, 13661–13677. [Google Scholar] [CrossRef]
- Salma, I.; Maenhaut, W.; Zemplén–Papp, E.; Záray, G. Comprehensive characterisation of atmospheric aerosols in Budapest, Hungary: Physicochemical properties of inorganic species. Atmos. Environ. 2001, 35, 4367–4378. [Google Scholar] [CrossRef]
- Colls, J.; Tiwary, A. Air Pollutants: Pollution—Measurement, Modelling and Mitigation, 3rd ed.; Routledge: Abington, UK, 2010; pp. 54–88. [Google Scholar]
- Ashok, V.; Gupta, T.; Dubey, S.; Rajmal, J. Personal exposure measurement of students to various microenvironments inside and outside the college campus. Environ. Monit. Assess. 2014, 186, 735–750. [Google Scholar] [CrossRef]
- Van Malderen, H.; van Grieken, R.; Bufetov, N.V.; Koutzenogii, K.P. Chemical Characterization of Individual Aerosol Particles in Central Siberia. Environ. Sci. Technol. 1996, 30, 312–321. [Google Scholar] [CrossRef]
- Cong, Z.Y.; Kang, S.C.; Dong, S.P.; Liu, X.D.; Qin, D.H. Elemental and individual particle analysis of atmospheric aerosols from high Himalayas. Environ. Monit. Assess. 2010, 160, 323. [Google Scholar] [CrossRef] [PubMed]
- Walkden, S.; Kelley, R.; Parrish, M.; Horstwood, A.; Indares, J.; Still, J. Determining Source of Ejecta Using Heavy Mineral Provenance Techniques; A Manicouagan Distal Ejecta Case Study. Lunar Planet. Sci. 2009, 285, 163–172. [Google Scholar]
- Zereini, F.; Wiseman, L.S. Urban Airborne Particulate Matter, Origin, Chemistry, Fate and Health Impacts, 1st ed.; Springer: Berlin/Heidelberg, Germany, 2010. [Google Scholar]
- World Health Organization Regional Office for Europe. Manganese and its Compounds: Environmental Aspects; Concise International Chemical Assessment Document 63; World Health Organization: Geneve, Switzerland, 2004. [Google Scholar]
- Hernandez, H.; Berry, T.A.; Wallis, S.L.; Poyner, D. Temperature and Humidity Effects on Particulatte Matter Concentrations in a Sub–Tropical Climate During Winter. In Proceedings of the International Conference of the Environment, Chemistry and Biology (ICECB 2017), Queensland, Australia, 10–22 November 2017; pp. 41–49. [Google Scholar]


© 2020 by the authors. Licensee MDPI, Basel, Switzerland. This article is an open access article distributed under the terms and conditions of the Creative Commons Attribution (CC BY) license (http://creativecommons.org/licenses/by/4.0/).