Article

Ice Hydrometeor Shape Estimations Using Polarimetric Operational and Research Radar Measurements

by
Sergey Y. Matrosov
Cooperative Institute for Research in Environmental Sciences, University of Colorado and NOAA Earth System Research Laboratory, Boulder, CO 80309, USA
Atmosphere 2020, 11(1), 97; https://doi.org/10.3390/atmos11010097
Submission received: 26 December 2019 / Revised: 8 January 2020 / Accepted: 10 January 2020 / Published: 14 January 2020
(This article belongs to the Special Issue Electromagetics and Polarimetric Weather Radar)

Abstract

:
A polarimetric radar method to estimate mean shapes of ice hydrometeors was applied to several snowfall and ice cloud events observed by operational and research weather radars. The hydrometeor shape information is described in terms of their aspect ratios, r, which represent the ratio of particle minor and major dimensions. The method is based on the relations between depolarization ratio (DR) estimates and aspect ratios. DR values, which are a proxy for circular depolarization ratio, were reconstructed from radar variables of reflectivity factor, Ze, differential reflectivity, ZDR, and copolar correlation coefficient ρhv, which are available from radar systems operating in either simultaneous or alternate transmutation of horizontally and vertically polarized signals. DR-r relations were developed for retrieving aspect ratios and their sensitivity to different assumptions and model uncertainties were discussed. To account for changing particle bulk density, which is a major contributor to the retrieval uncertainty, an approach is suggested to tune the DR-r relations using reflectivity-based estimates of characteristic hydrometeor size. The analyzed events include moderate snowfall observed by an operational S-band weather radar and a precipitating ice cloud observed by a scanning Ka-band cloud radar at an Arctic location. Uncertainties of the retrievals are discussed.

1. Introduction

Scanning polarimetric weather radars operating at centimeter-wavelength frequency bands, such as S (~3 GHz), C (~5 GHz) and X (~10 GHz) bands, have been long used for hydrometeor identification (HID) retrievals [1,2,3]. The HID algorithms usually utilize a fuzzy-logic approach and are based on variables from horizontal and vertical polarization radar measurements such as the equivalent radar reflectivity factor (hereafter just reflectivity), Ze, differential reflectivity, ZDR, specific differential phase KDP, and copolar correlation coefficient, ρhv. As an output, these algorithms prescribe different dominant hydrometeor types/species for cloud and precipitation particles filling the radar resolution volume. Typical ice hydrometeor species that are routinely identified using radar measurements are hail, graupel, aggregated snow, and ice crystals. Quantitative information on ice particle shapes, however, is not typically provided by the HID algorithms.
Atmospheric ice particles, however, have a great variety of habits and most commonly, they are of irregular shape [4]. In many practical applications ranging from microphysical and climate modeling studies [5,6] to snowfall quantitative precipitation estimation (QPE) methods [7], a general shape type of ice hydrometeors needs to be quantified. Usually, simple oblate spheroidal shape (for planar type crystals) or prolate spheroidal shape (for columnar type crystals) models are used for describing irregular ice particle shapes [8]. An aspect ratio defined as the ratio of particle minor and major dimensions is a general parameter-characterizing particle shape. While the spheroidal shape has limitations in describing the hexagonal structure of single pristine ice crystals, it is generally appropriate for describing a degree of non-sphericity of irregular shape particles which often are a dominant species.
A remote sensing method for estimating mean aspect ratios for relatively homogeneous horizontal layers of precipitating ice hydrometeors using direct measurements of circular depolarization or slant 45° linear depolarization ratios (CDR and SLDR, respectively) was suggested and applied to data taken by scanning millimeter-wavelength frequency (~35 and ~95 GHz) cloud radars [9,10]. CDR and SLDR measurements unlike a traditional horizontal—Vertical polarization linear depolarization ratio (LDR)—are not very sensitive to particle wobbling around preferential orientation with major dimensions in the horizontal plane, so these measurements are suitable for inferring particle shapes. Standard deviations of particle wobbling are usually smaller than about 30° [11,12]. A similar remote sensing method was also later applied for fully polarimetric Ka-band scanning radar measurements [13]. While this radar did not directly measure CDR, CDR values were reconstructed from linear polarization basis measurements as in [14]. Radar-based retrievals of particle aspect ratios in these studies agreed generally well with concurrent in-situ measurements when appropriate particle density assumptions were made.
Recently [15,16], suggested an approach to reconstruct depolarization ratio (DR) from ZDR and ρhv observations by radars operating in the simultaneous transmission-simultaneous reception (STSR) mode, which precludes direct measurements of depolarization. Later, weather radar ZDR and ρhv measurements were applied to infer aspect ratios of ice cloud hydrometeors assuming the solid ice hexagonal particles, which are characteristic of single plates or solid columns [12]. Moreover, depending on particle shapes, observed polarimetric variables also depend on particle bulk density, so density assumptions are essential for aspect ratio retrievals from depolarization [9] or combined ZDR and ρhv measurements [17]. For the soft spheroidal particle model, the particle bulk density assumption is, in essence, equivalent to an assumption of the complex dielectric constant of the ice-air mixture which dry hydrometeors are made of. Without the density assumption, only a polarizability parameter of the particles can be estimated [17]. The objective of this study was to extend depolarization-based ice hydrometeor shape retrievals to evaluate the spatial variability of their aspect ratios with approximate accounting for the effects of changing particle density.

2. Models and Methods

A logarithmic scale proxy of depolarization ratio (DR) obtainable from STSR horizontal (h) and vertical (v) polarization measurements can be expressed as [15,16]
DR(dB) = 10 log10 [(Zdr + 1 − 2 Zdr0.5 ρhv)/(Zdr + 1 + 2 Zdr0.5 ρhv)]
where Zdr is differential reflectivity in the linear scale (i.e., logarithmic scale ZDR = 10 log10(Zdr). For STSR measurements, DR depends on the transmitter phase shift between h and v polarized signals (φt), which often is not known. It has been shown [16] that this dependence is usually rather weak. While being only a proxy for cthe ircular depolarization ratio, the DR parameter has important advantages over real depolarization measurements. It does not depend on propagation phase shift as true CDR [18]. DR estimates are available in all radar resolution volumes where directly measured co-polarized signals are reliably measured. The real depolarization measurements, on the other hand, are only available when weak depolarized echoes are reliably measured, which greatly diminishes radar coverage for depolarization ratios compared to reflectivity [10]. DR estimates, in essence, combine the information contained in ZDR and ρhv for more convenient retrievals of particle aspect ratios.
Modeling the mean particle aspect ratio—DR correspondences—is performed in this study assuming oblate spheroidal particles in the Rayleigh scattering regime which is generally valid for atmospheric ice hydrometeors at S-band frequencies. An oblate general habit for snowflakes was used in many previous modeling studies [4,9,16,19]. The oblate vs. prolate general habit identification is possible using trends of radar elevation angle dependencies of DR [8,9]. Observations, however, indicate that compared to oblate planar-type habit, prolate (e.g., columnar) particle types (while not uncommon) are rarely a dominant habit of precipitating ice [20,21].
Details of calculating Zdr and ρhv for spheroidal ice particles in the STSR measurement mode are given in [15,16]. To model aspect ratio (r)-DR relations for particle populations, it was assumed that the particle size distribution (PSD), as a function of particle major dimension, D, is described by the gamma-function:
N(D) = Noexp[−(3.67 + μ)D/Dmv]
where No, μ are the intercept and width parameters (note that DR is immune to changes in No), and Dmv is the median volume particle size, which represents the characteristic PSD size. Due to aerodynamic forcing, falling particles tend to be oriented with their major dimensions in the horizontal plane, so it was assumed that the mean canting angle θ is zero. Particle wobbling around the preferential horizontal orientation was described by the Gaussian distribution with respect to θ with the standard deviation σθ.
The mass of individual particles, m, was modelled in a customary way using a power-law approximation:
m = aDb
where a and b are empirical coefficients. The corresponding bulk density was calculated by dividing particle mass by the spheroidal volume and it was capped by the solid ice density maximum value of 0.916 g cm−3. A minimum value of 0.01 g cm−3 was assumed when the use of m-D relations for larger particles resulted in values less than 0.01 g cm−3. Depending on the bulk density, the particle dielectric constant was calculated using the Maxwell–Garnet mixing rule for air-solid ice mixtures.
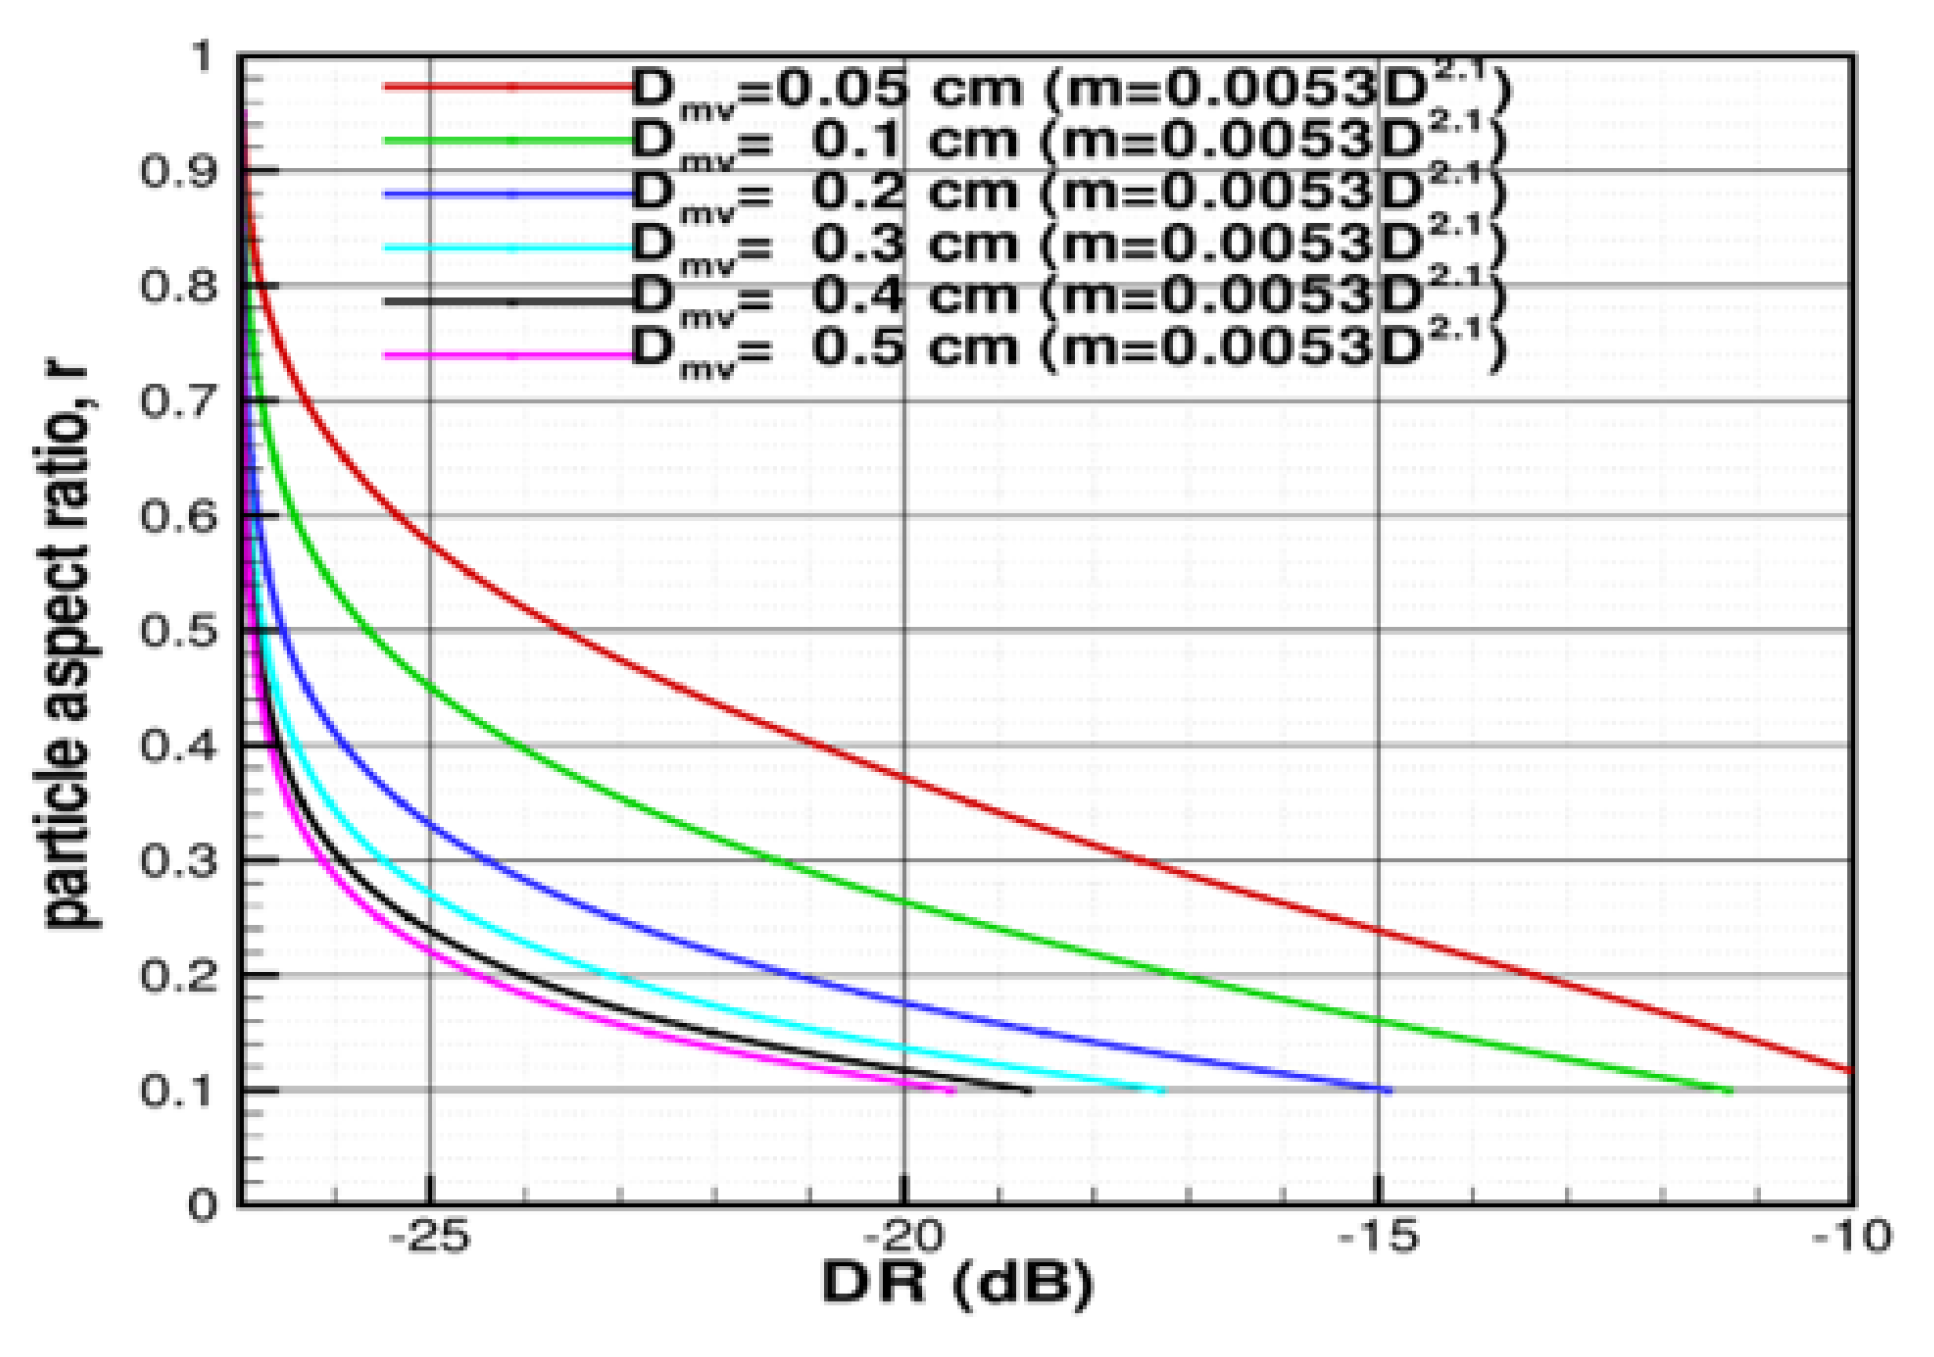
Figure 1 shows the results of modeling particle r-DR relations for the radar elevation angle α = 10°, transmitter phase shift φt = 90° (i.e., circular polarization is transmitted), the exponential particle size distribution (i.e., μ = 0) and moderate particle wobbling (σθ = 20°). The antenna polarization isolation, which is characterized by the minimal value of measurable LDR, was assumed to be −27 dB. This value is typical for many research and operational radars, including the ones used in previous studies [13]. The coefficients in the m-D relation were assumed to be a = 0.0053 and b = 2.1 (m is in grams, D is in cm). These coefficients were found to be suitable for low-to-moderately rimed snowflakes [22]. They also practically coincide with coefficients found independently [23] based on a large dataset of in situ measurements. DR for particles with r < 0.1 were not modeled. Such low aspect ratios are typically associated with single pristine crystals (e.g., dendrites, hexagonal plates).
As seen from Figure 1, there is a strong variability in the r-DR relations due to changes in Dmv. Since ice hydrometeor scattering at S-band is generally in the Rayleigh regime, this variability is due to changing particle density, as it is proportional (for a given value of particle aspect ratio) to Db−3. Denser particles of the same shape cause stronger depolarization of observed radar echoes. For given particle shapes, PSD type and the m-D relation, Dmv can be considered as a proxy for an ensemble averaged particle density, so it can be possible to account for the density effect on DR through the changes in Dmv. Independent information on particle characteristic size, however, from the sources other than radar measurements (e.g., in situ microphysical observations) is usually unavailable, except for special research radar deployments with additional sensors.
Potentially, dual-frequency ratio (DFR) radar measurements can provide information on Dmv [24]. The second radar frequency measurements, however, are also rarely available. Another practical way to estimate Dmv from single-wavelength radar measurements is through the use of empirical relations between Dmv and radar reflectivity Ze [25]. As shown in [26], there are relatively strong statistical relations between Ze and PSD size parameters. These relations are akin to widely used relations between ice water content (IWC) and Ze. One reason that reflectivity is relatively strongly correlated to both IWC and Dmv is that there is statistical correspondence between these two cloud/precipitation microphysical parameters. The corresponding correlation coefficients between Dmv and radar reflectivity Ze are around 0.85 [26]. An average Dmv-Ze relation obtained from the Global Precipitation Measurement (GPM) Cold Season Precipitation Experiment (GCPEX) dataset in that study can be approximated for S-band frequencies in the following way:
Dmv = 0.095 Ze0.31
where Dmv is in cm and Ze is in mm6m−3. As found from modeling using in-situ PSDs, the data scatter around the best power-law fit size parameter—Reflectivity relation is on average around 50% [26].
With an appropriate choice of Dmv values from (4), relations of the type shown in Figure 1 can be used for retrievals of ice hydrometeor aspect ratios from DR estimates derived from radar measurements. In addition to the variability due to Dmv (i.e., due to particle bulk density), which can be considered as a dominant source of changes in the r-DR relations, these relations are also sensitive to other radar configuration and particle microphysical parameters, such as α, φt, μ, σθ, and the coefficients in the m-D relations. 
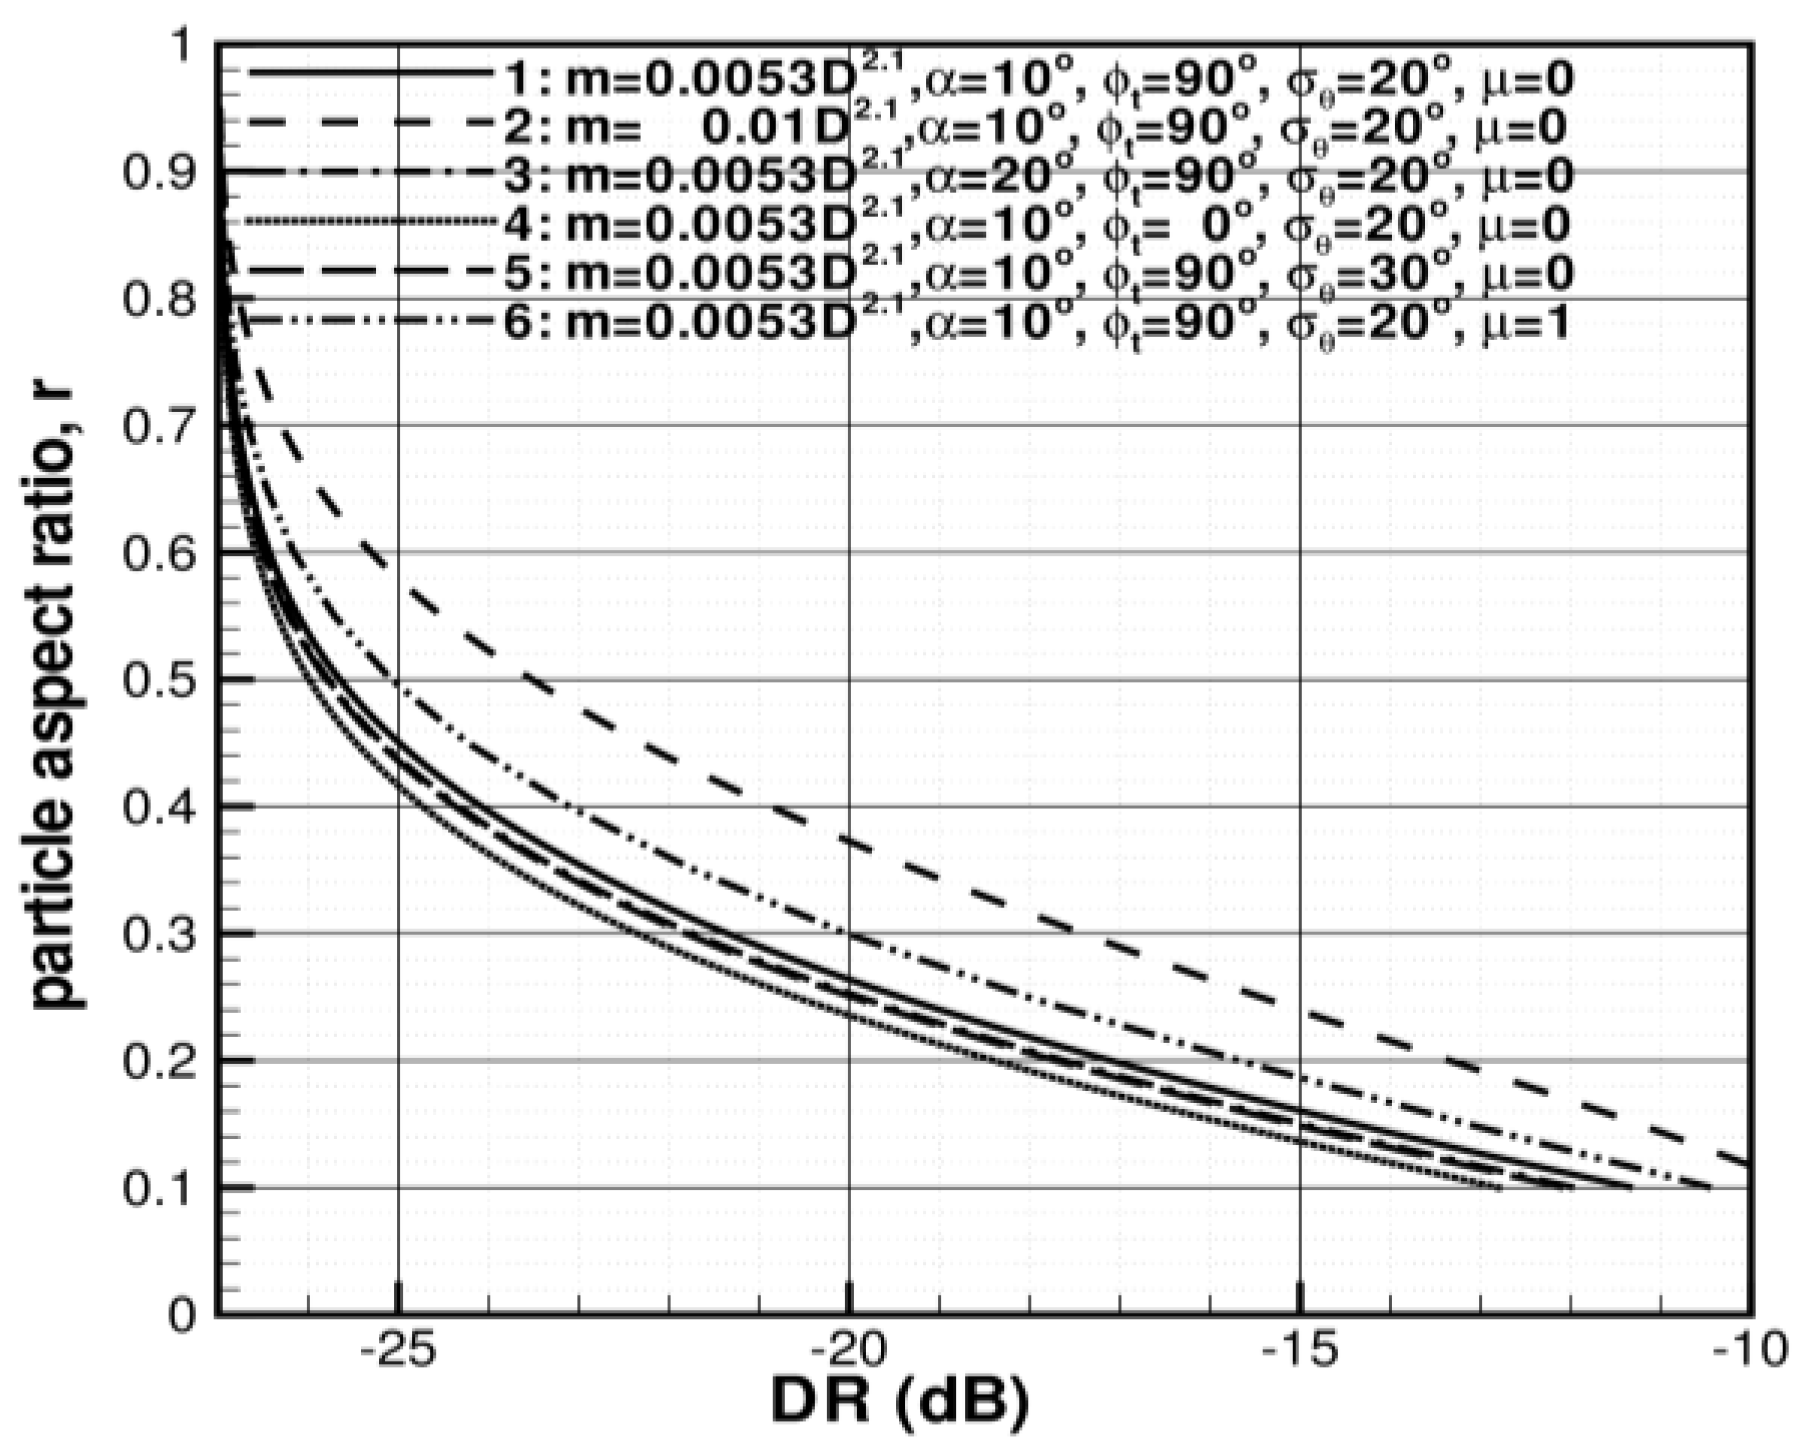
Figure 2 illustrates corresponding sensitivities.
As seen from Figure 2, changes in the horizontal-vertical polarization phase shift on transmission typically cause a rather modest variability in the r-DR relations. For a given DR values, changes in φt (curve 4 vs. curve 1 in Figure 2) from 90° (i.e., circular polarized signals are transmitted) to 0° (i.e., 45° slant linearly polarized signals are transmitted) result in the variability of particle aspect ratios of an order of only few hundredths. This is, in part, due to the fact that DR remains a good proxy for CDR corrected for propagation phase shift even though φt can change rather significantly [16]. A similarly small variability is caused by changes in the radar elevation angle α from 10° to 20° (curve 3 vs. curve 1 in Figure 2). Note that 20° is the largest elevation angle used with the Weather Surveillance Radar-1988 Doppler (WSR-88D) operational weather radar network. Unlike the transmission phase shift φt, which is often unknown, the radar elevation angle for each scan is known, so the r-DR relations can be easily adjusted for each value of α.
Compared to the radar configuration parameters, changes in particle microphysical property assumptions could cause more noticeable variability in the r-DR relations. A change in the order gamma-function PSD from μ = 0 (i.e., the exponential PSD) to μ = 1 shifts the r-DR relation by about 0.04–0.05 along the r-axis (curve 6 vs. curve 1 in Figure 2). Even larger shifts can be expected due to changes in the coefficients in the particle mass-size relation. One factor which causes these changes is particle riming. Unless the riming is so severe that a graupel stage is reached, riming processes result in an increase of the coefficient a in Equation (3) while the exponent b in this equation remains mostly unchanged [22]. Changes by about a factor of 2 in a, which corresponds to rather strong riming, shift the r-DR relation by about 0.1 along the r-axis (curve 2 vs. curve 1 in Figure 2).
The sensitivity of the r-DR relations to particle orientation wobbling is rather modest (curve 5 vs. curve 1 in Figure 2). This is an important advantage of DR over Z
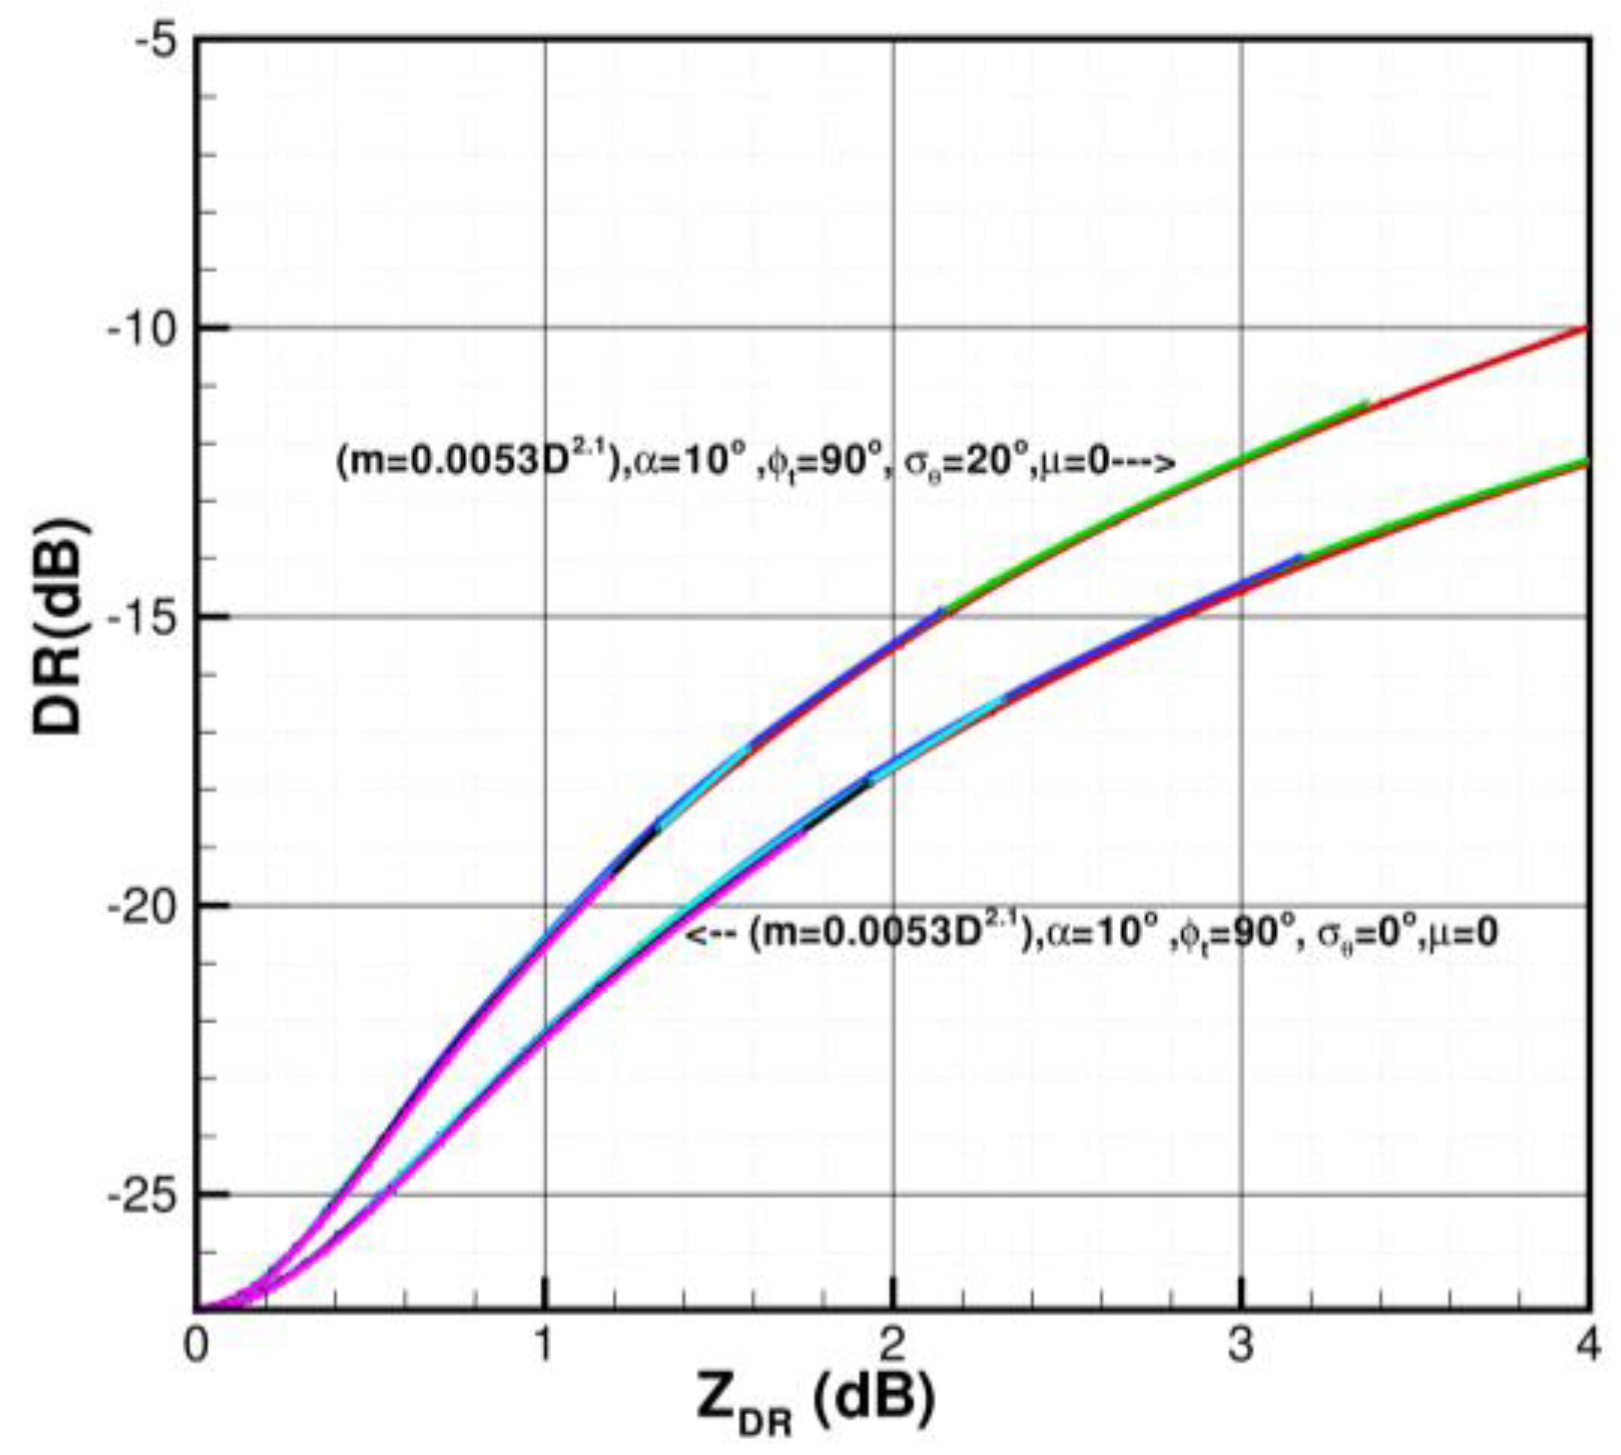
DR, which is another radar variable sensitive to particle shapes. For the same value of the particle wobbling parameter σθ, there is a one-to-one correspondence between DR and ZDR. This correspondence, however, changes with σθ, as shown in Figure 3 where modeling results of this correspondence are depicted for two sets of assumptions, which differ only by values of σθ. Compared to 
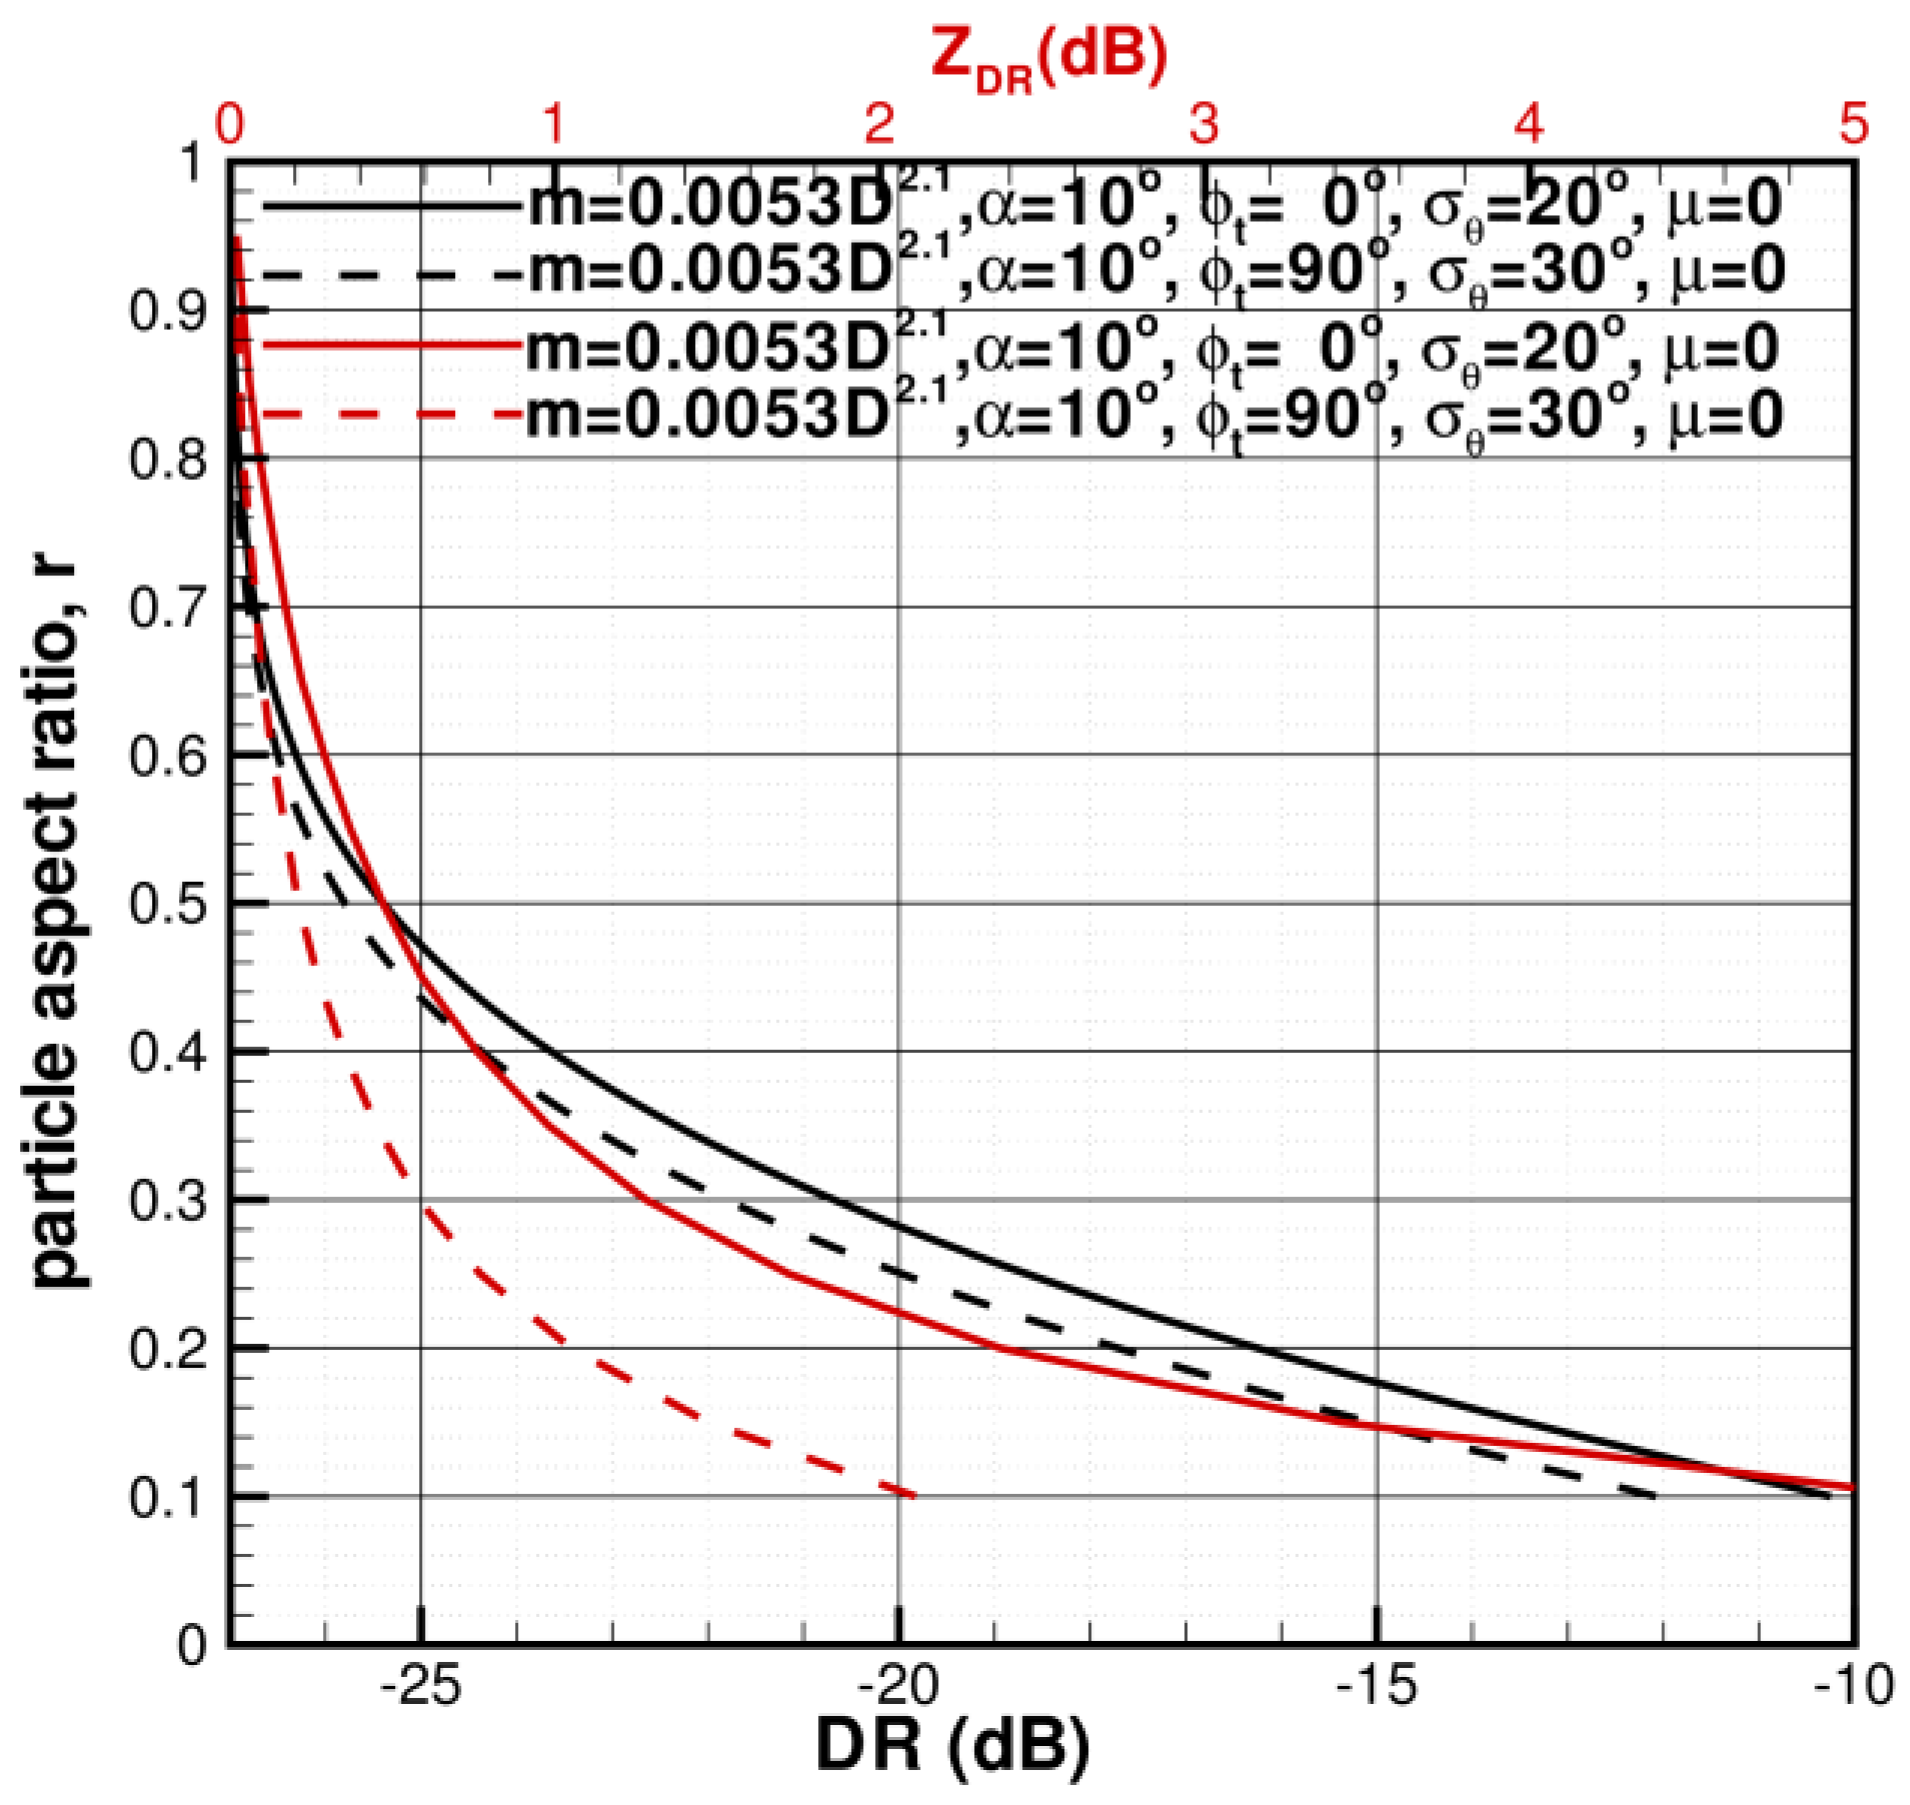
r-DR relations, there is a much stronger variability in the r-ZDR relations caused by uncertainties in σθ. This point is illustrated in Figure 4, where both relation types are shown for different assumed values of σθ. The relative insensitivity of DR to particle orientations/wobbling makes depolarization-based estimates of particle aspect ratios more robust compared to potential differential reflectivity-based aspect ratio estimates.
Different sources of retrieval errors discussed above can be considered independent. Accounting for possible magnitudes of these uncertainties and also assuming that uncertainties in inferring Dmv values from reflectivity measurements [26] could be as large as a factor of 2, it can be expected that errors of particle aspect ratio retrievals from depolarization ratio estimates could be at least 0.2 or so. This precludes the effective use of the depolarization-based method suggested here for quantitatively estimating shapes of very non-spherical ice particles such as single pristine crystals (e.g., dendrites, hexagonal plates). High depolarization ratio values (e.g., DR > −15 dB) can be indicative about the presence of such crystals in a radar resolution volume as a dominant hydrometeor type. The use of this method for estimating general shape of ice hydrometeors (as expressed by aspect ratios) of irregular ice particle, however, could be rather robust and useful for different applications when general information about particle shape is needed (e.g., polarimetric radar QPE and microphysical modeling studies).

3. Results of Retrievals

3.1. Examples of the Retrievals Using Operational Weather Radars

The next generation radar (NEXRAD) network of the United States National Weather Service (NWS) consists of about 160 WSR-88D S-band units which employ the horizontal-vertical polarization STSR measurement mode. The WSR-88D horizontal polarization reflectivity, differential reflectivity and copolar correlation coefficient Level-2 data are freely available from the National Climatic Data Center. Figure 5 shows an example of WSR-88D measurements and corresponding characteristic particle size and aspect ratio retrievals during a snowfall event which was observed on 5 March 2013 near Lake Superior. A particular NWS operational radar in this case is located at an altitude of about 430 m above mean sea level (MSL) near Duluth, Minnesota (46.83698° N, 92.21018° W) and has a four-letter identifier KDLH. The radar elevation angle measurements for an azimuthal scan depicted in Figure 5 is 4.6° and the time of the scan is 19:27 UTC. Areas of possible ground clutter contamination are manifested by very low ρhv (very high DR). Particle aspect ratio retrievals were performed with the assumptions, which were used to generate the modeling results shown in Figure 1, except that the actual radar beam elevation angle of 4.6° was accounted for. Retrieval results, however, are not very sensitive to the changes in the radar elevation angle in the range 0°–20° as compared to influencing factors affecting bulk density (e.g., m-D relation coefficients, a PSD shape), which is a major factor defining radar variables [27].
For the scan shown in Figure 5, DR based retrievals of aspect ratios at distances closer than about 40 km generally indicate moderately non-spherical particles with pockets of particles with lower aspect ratio values, which approximately coincide with regions of larger ZDR values. At further radar ranges there is a tendency for more spherical particles. These ranges correspond to higher altitudes above the ground (e.g., at the 4.6° elevation the center of the radar beam is at an altitude of about 3.2 km above the ground for a 40 km range). An exception for this general tendency is a region at about 50 km to the south-east from the radar site, where locally higher values of ZDR and lower ρhv values result in higher DR, which indicates rather non-spherical particles. Radiosonde sounding from the location in Chanhassen, MN (not shown) indicated that during radar measurements, temperatures at altitudes of about 3.2 km above ground were approximately −15 °C, which corresponds to a temperature regime favorable for the growth of dendritic crystals with low aspect ratios [28]. This might explain the transition between dominant shapes happening at radar ranges of around 40–50 km. Measurements at longer ranges, however, should be treated with some caution, as lower signal-to-noise ratios (SNRs) can cause biases in observed polarimetric variables [29]. To avoid very low SNRs, data points were considered only if reflectivities were greater than −10 dBZ.
Another example of KDLH radar measurements and corresponding particle characteristic size and aspect ratio retrievals is shown in Figure 6. The snowfall event depicted in Figure 6 was observed on 20 February 2014. It can be seen that for this event, very non-spherical particles were present in the entire area of the north-eastern quadrant (i.e., between azimuthal directions of 0° and 90°) and also at close distances in the south-west direction. High values DR and ZDR and low ρhv values observed in these areas are indicative of dendritic-type pristine crystals being a dominant hydrometeor habit. According to the radiosonde soundings, the −15 °C level for this measurement time was at about 4 km above the ground (i.e., at approximately a 50 km range from the radar site). Note also that reflectivities across these areas vary very significantly, which results in a large dynamic range of particle median volume size estimates (e.g., from about 1 mm to approximately 4 mm). Almost everywhere else in the depicted scan particles are more spherical with aspect ratios of about 0.4–0.9 which are characteristic of irregular hydrometeor shapes. As for the event shown in Figure 5, the particle mean aspect ratio data in Figure 6 at further radar ranges (and thus at higher altitudes) are near 0.9–1.0 and rather noisy, which might be, in part, due to low SNR values and the influence of particle tumbling.
Potential ZDR biases will cause uncertainties in DR calculations and thus influence aspect ratio retrievals. Modeling with the DR Estimator (1) indicates that for a 0.1 dB ZDR bias and typical values of ρhv (e.g., 0.85 < ρhv < 0.995), errors in DR estimates are generally less than about 0.5 dB for smaller ZDR values (e.g., 0.2 dB < ZDR < 1.5 dB). For larger ZDR values, these errors generally diminish. The data in Figure 1 suggest that such DR errors can correspond to an additional uncertainty of aspect ratio retrievals of the order of several hundredths.

3.2. An Example of the Retrievals Using a Research Cloud Radar

Millimeter wavelength cloud radars operating at frequencies of around 35 GHz and 95 GHz have been also used for snowfall measurements at shorter ranges [30]. Recently, mean aspect ratios of ice hydrometeors observed at a given altitude were retrieved using Ka-band (~35 GHz) radar polarimetric measurements at the U.S. Department of Energy’s (DOE) Atmospheric Radiation Measurement (ARM) Program mobile facility in Oliktok Point (70.495° N, 149.886° W), Alaska [13]. The Scanning ARM Cloud Radar (SACR) used for these retrievals transmits horizontally and vertically polarized signals alternatively, which alleviates cross-coupling effects in the differential reflectivity data, and measures horizontal-vertical polarization linear depolarization ratio (LDR) directly, thus allowing estimations of DR, which, in this case, is the proxy of true CDR without unwanted effects of the propagation phase shift [14].
The retrievals in [13] were performed for the range-height indicator (RHI) SACR measurements and 40° radar elevation angle data were used for aspect ratio retrievals. This specific elevation angle was chosen to minimize the influence of particle orientation on the aspect ratio retrievals. The use of such relatively high elevation angles is convenient for estimating the vertical variability of particle aspect ratios near the radar location but it is rather limited for the purpose of evaluating larger scale spatial variability of hydrometeor shapes as a function of the azimuthal direction and the distance from the radar site. The plan position indicator (PPI) azimuthal scans at low elevation angles, which are similar to those performed by the NEXRAD radars, are convenient for this purpose. In addition to the RHI scans, the SACR also regularly performs such PPI scans [31], which are used here to illustrate the aspect ratio retrievals for larger spatial regions using the same approach as that described above for applications with operational weather radars. It should be noted, however, that cloud radars typically have smaller maximum observational ranges but provide better spatial and angular measurement resolutions compared to operational WSR-88D observations.
An example of SACR PPI measurements and corresponding retrievals for a precipitating ice cloud observed on 21 October 2016 at around 00:52 UTC is shown in Figure 7. The color scales of radar variables and corresponding microphysical retrievals are the same as for the WSR-88D data shown in Figure 5 and Figure 6, though the SACR maximum range is significantly smaller. The SACR PPI radar elevation angle for the data in Figure 7 was 5°. There is an obvious partial radar beam blockage from local structures at a relatively narrow angle intervals centered at azimuths of about 152°, 165°, and 341°. This blockage is most pronouncedly seen in reflectivity measurements (Figure 7a). There is also an arc of ground clutter which is best seen in depolarization data (Figure 7e), as DR is also a good tool for clutter identification. The estimates of particle aspect ratios and characteristic sizes for the regions of partial beam blockage and clutter should be ignored.
Estimates of the median volume particle size (Figure 7d) were performed using the Ze-Dmv relation obtained specifically for the Ka-band frequencies from the large in situ microphysical dataset [26]. It was assumed that the particle size distribution for the event time shown in Figure 7 had an exponential form as it was indicated by closely collocated in time in situ measurements using Video Ice Particle Sampler (VIPS), which was launched on a tethered balloon near the radar site [13]. The VIPS instrument provides quantitative information on particle size distributions and shapes. As seen from Figure 7d, estimated Dmv values were generally smaller than about 1.5 mm in the larger area of observations and around 0.8–1 mm in the vicinity of the radar site. This agrees well with VIPS estimates of Dmv ≈ 0.08 mm which were obtained near the radar site at a balloon altitude of about 0.5 km at around the time of radar observations shown in Figure 7.
The particle mean aspect ratios retrieved from the SACR measurements are shown in Figure 7f. The retrievals were performed based on depolarization ratio estimates using the approach discussed in Section 2. It can be seen that there was a pronounced change in aspect ratios in the region of observations. More spherical particles were present in the north-western half of the observational area while hydrometeors with larger degree of non-sphericity (i.e., smaller aspect ratios) were present in the south-western half. Aspect ratio values in the vicinity of the radar site were around 0.4–0.5, which is in good agreement with estimates of about 0.5 from in-situ VIPS measurements at around the time of observation [13]. As is the case with the most radar-based measurements, the retrievals are generally representative for the larger particles as power radar parameters (in the scattering Rayleigh regime) are approximately proportional to the fourth moment of the particle size distribution (for typical values of exponent b ≈ 2 in Equation (3)). It should be mentioned, however, that the VIPS data indicated that there was no significant dependence of aspect ratios of individual particles on their size, as observed from in-situ measurements [13].
Maximum observed reflectivities (Figure 7a) were approximately 5 dBZ and estimated Dmv values were generally less than 1.5 mm. At these reflectivity levels, non-Rayleigh scattering effects at Ka-band are expected to be rather small [32]. For larger particle populations, however, these effects could be substantial and need to be accounted for in the retrievals. Especially important accounting for non-Rayleigh effects would be for the retrievals at W-band (~94 GHz) cloud radar frequencies [6]. Signal attenuation at W-band frequencies, however, is usually much more severe compared to lower frequencies [33], so sensible retrievals often could be available only for closer ranges.
As seen from Figure 7f (and also Figure 5f and Figure 6f), retrievals of aspect ratios are rather noisy, even though the gradual changes in mean particle shapes over the observational domain are quite identifiable. The uncertainty of the SACR-based mean aspect ratio retrievals as estimated theoretically and from comparisons with in situ observations was about 0.1–0.15 when depolarization at 40° elevation was used for retrievals [13]. For the lower elevation angle observations shown in this study, retrieval uncertainties could be higher as the effects of particle orientation/tumbling on DR values become stronger.

4. Conclusions

Quantitative information about general shapes of atmospheric ice particles is important for many practical applications such as the development of novel polarimetric snowfall QPE methods and advanced modeling of microphysical processes involving evolution of ice hydrometeors. Depolarization ratio (DR) estimates, which are less susceptible to particle orientations compared to other polarimetric variables such as differential reflectivity, can be readily deduced from polarimetric radar variables measured directly. These estimates are a convenient tool for estimating an average particle shape in terms of the mean aspect ratio, r, which represents the ratio of particle minor and major dimensions.
In addition to the particle shape, DR values strongly depend on particle bulk density; thus, density information is essential for meaningful aspect ratio retrievals. As in situ microphysical studies show, the mass of individual ice particles, m, is strongly related to their size, D. Knowing a characteristic hydrometeor size (e.g., median volume size, Dmv) representing the whole particle size distribution allows for implicit accounting for the density information in the radar-based aspect ratio retrievals. DR-r relations used in the retrievals were derived as a function of Dmv. The mass-size (m-D) relations, which are representative for unrimed and low-to-moderately rimed atmospheric ice particles, were used in these derivations.
Independent information on particle characteristic sizes (e.g., from other remote or direct sensors) could enhance aspect ratio retrievals. Due to the absence of such independent information in this study, the Dmv estimates used in the aspect ratio retrievals were obtained from the reflectivity measurements. These estimates are based on a relatively high correlation between Dmv and Ze, which was demonstrated using a wide range of in situ observations in precipitating ice clouds [26].
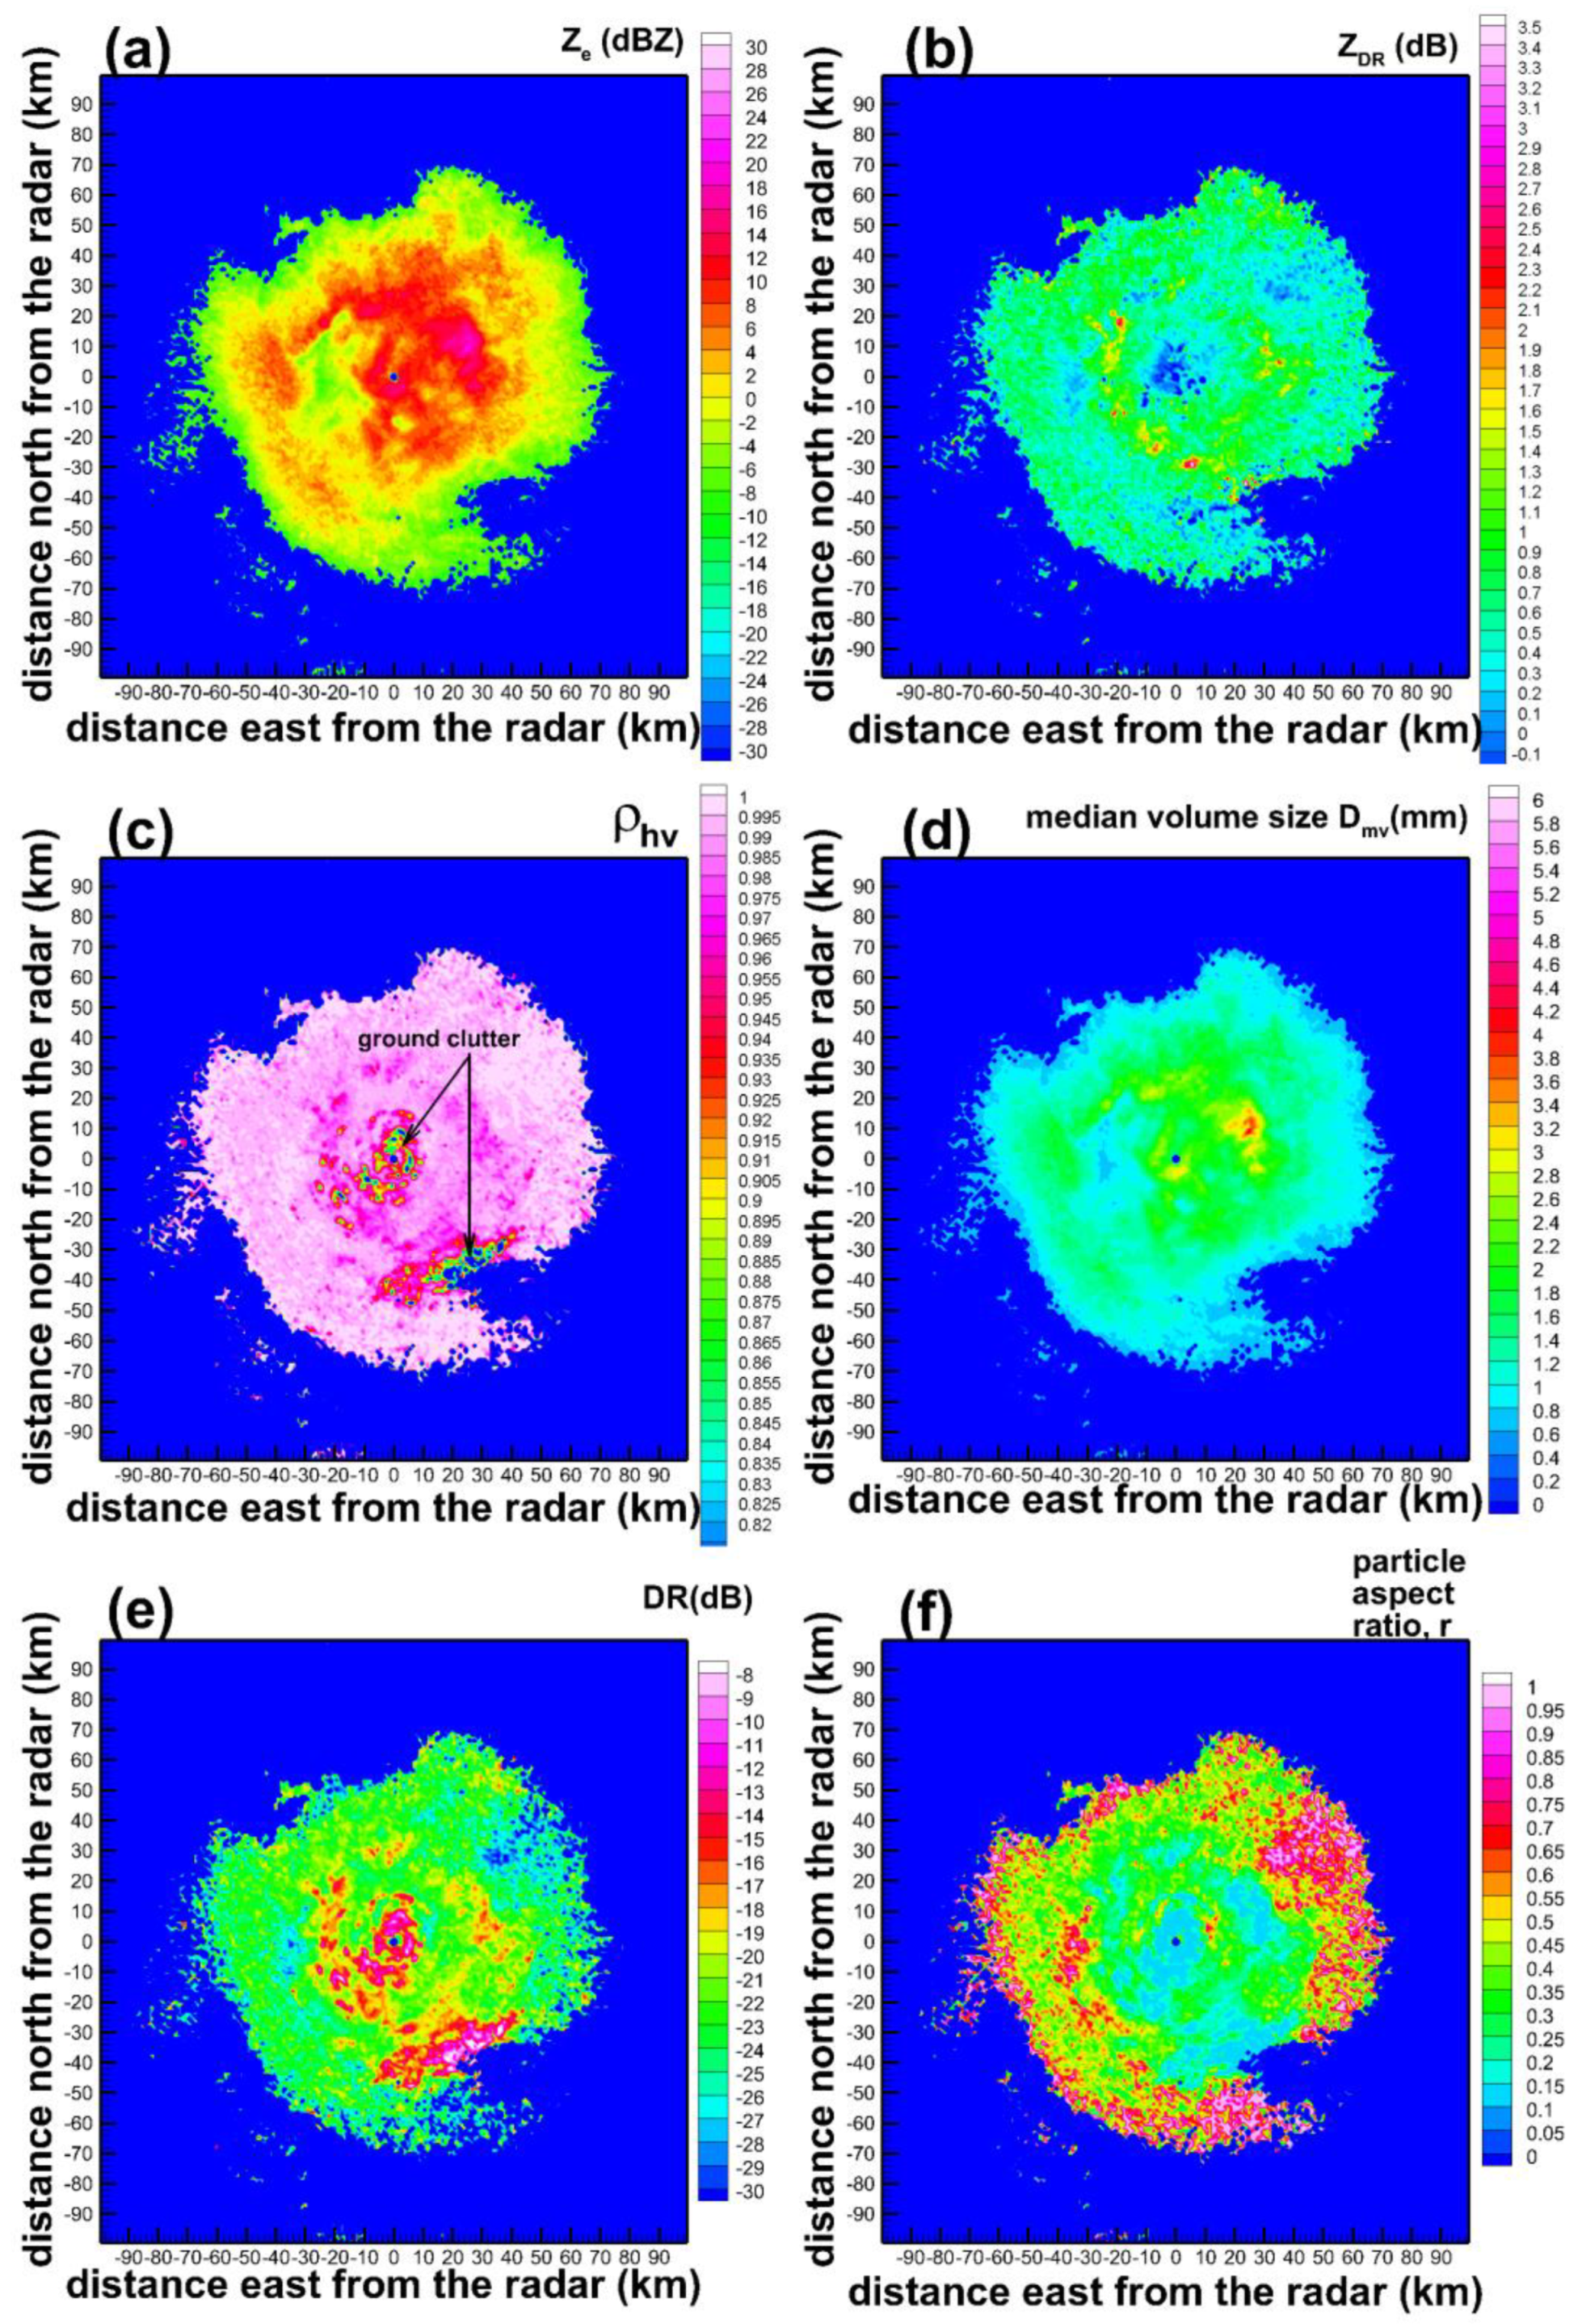
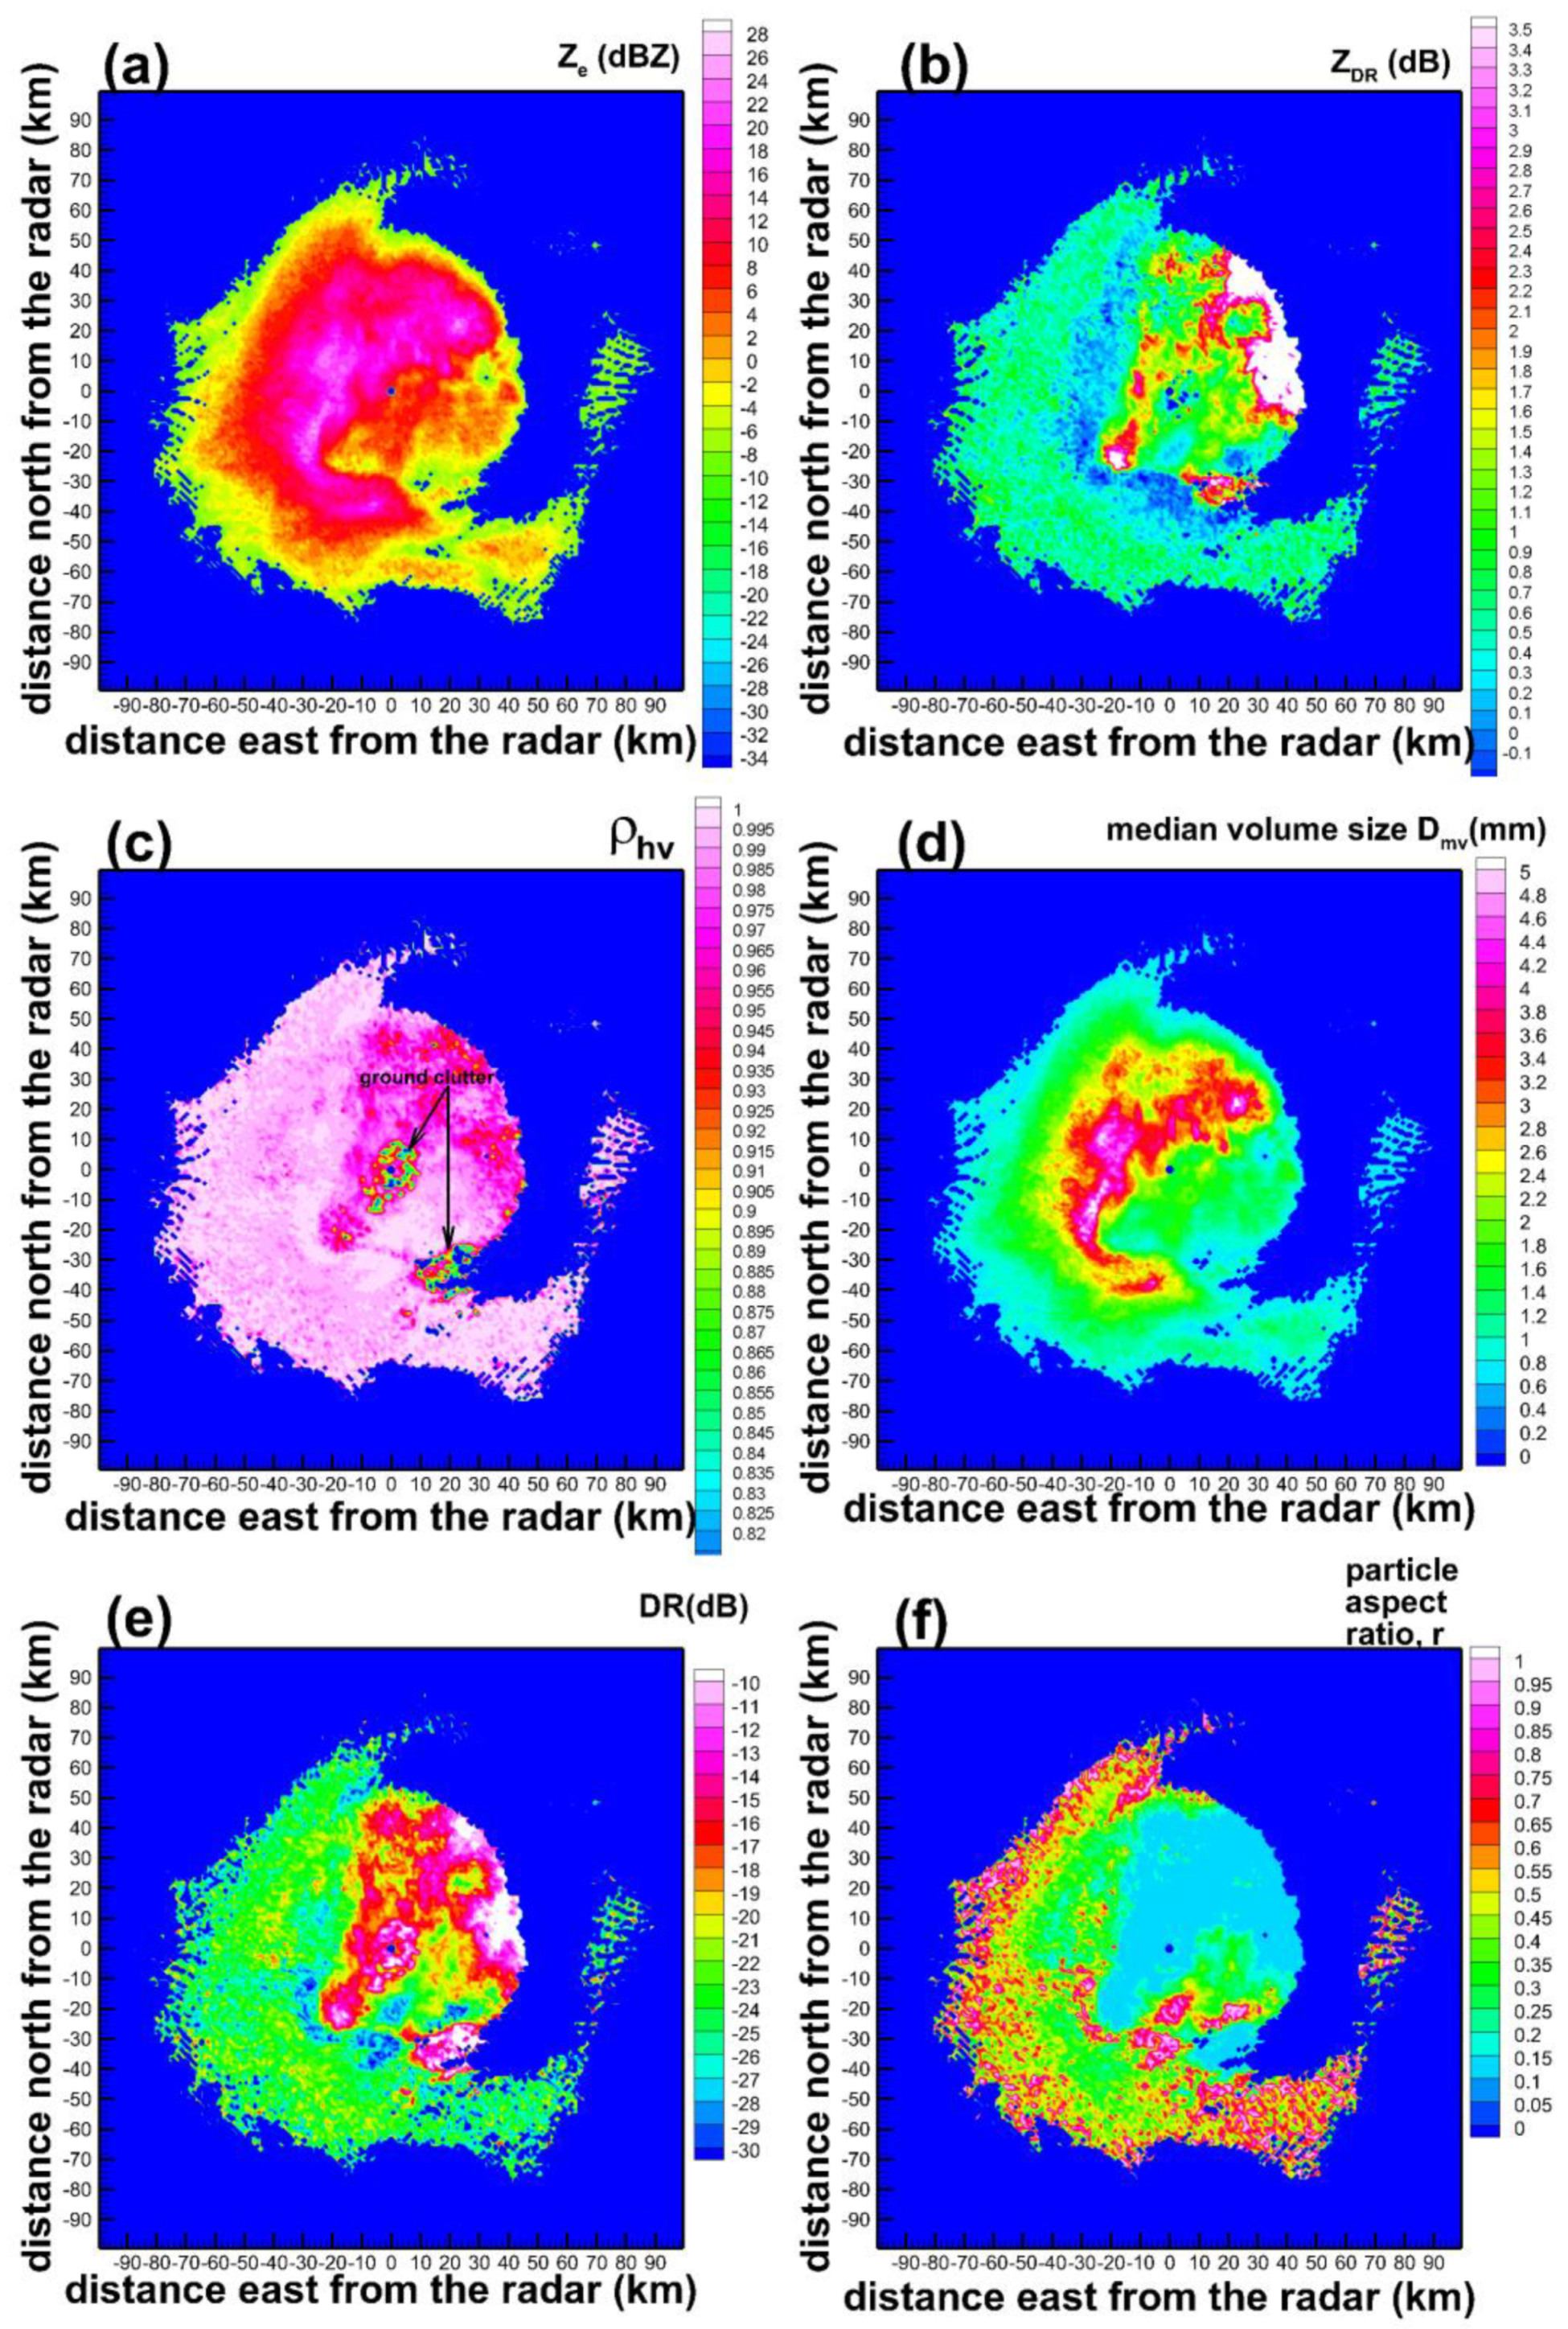
The suggested polarimetric radar-based approach for retrievals of atmospheric ice particle aspect ratios was applied to low radar elevation angle (~4.5°) azimuthal measurements from an operational WSR-88D unit located near Duluth, MN and a research scanning cloud radar deployed in Oliktok Point, AK. WSR-88D measurement examples during two different moderate snowfall events indicated a general change in particle habits from rather spherical hydrometeors with aspect ratios of around 0.6 and larger to more non-spherical particles with aspect ratios less than about 0.4 at radar ranges that approximately corresponded to the altitudes of the −15 °C isotherm, which is the temperature favorable to the dendritic ice growth. Some variability in the radar ranges (and hence altitudes above the ground) of this general particle aspect ratio transition, however, was also observed.
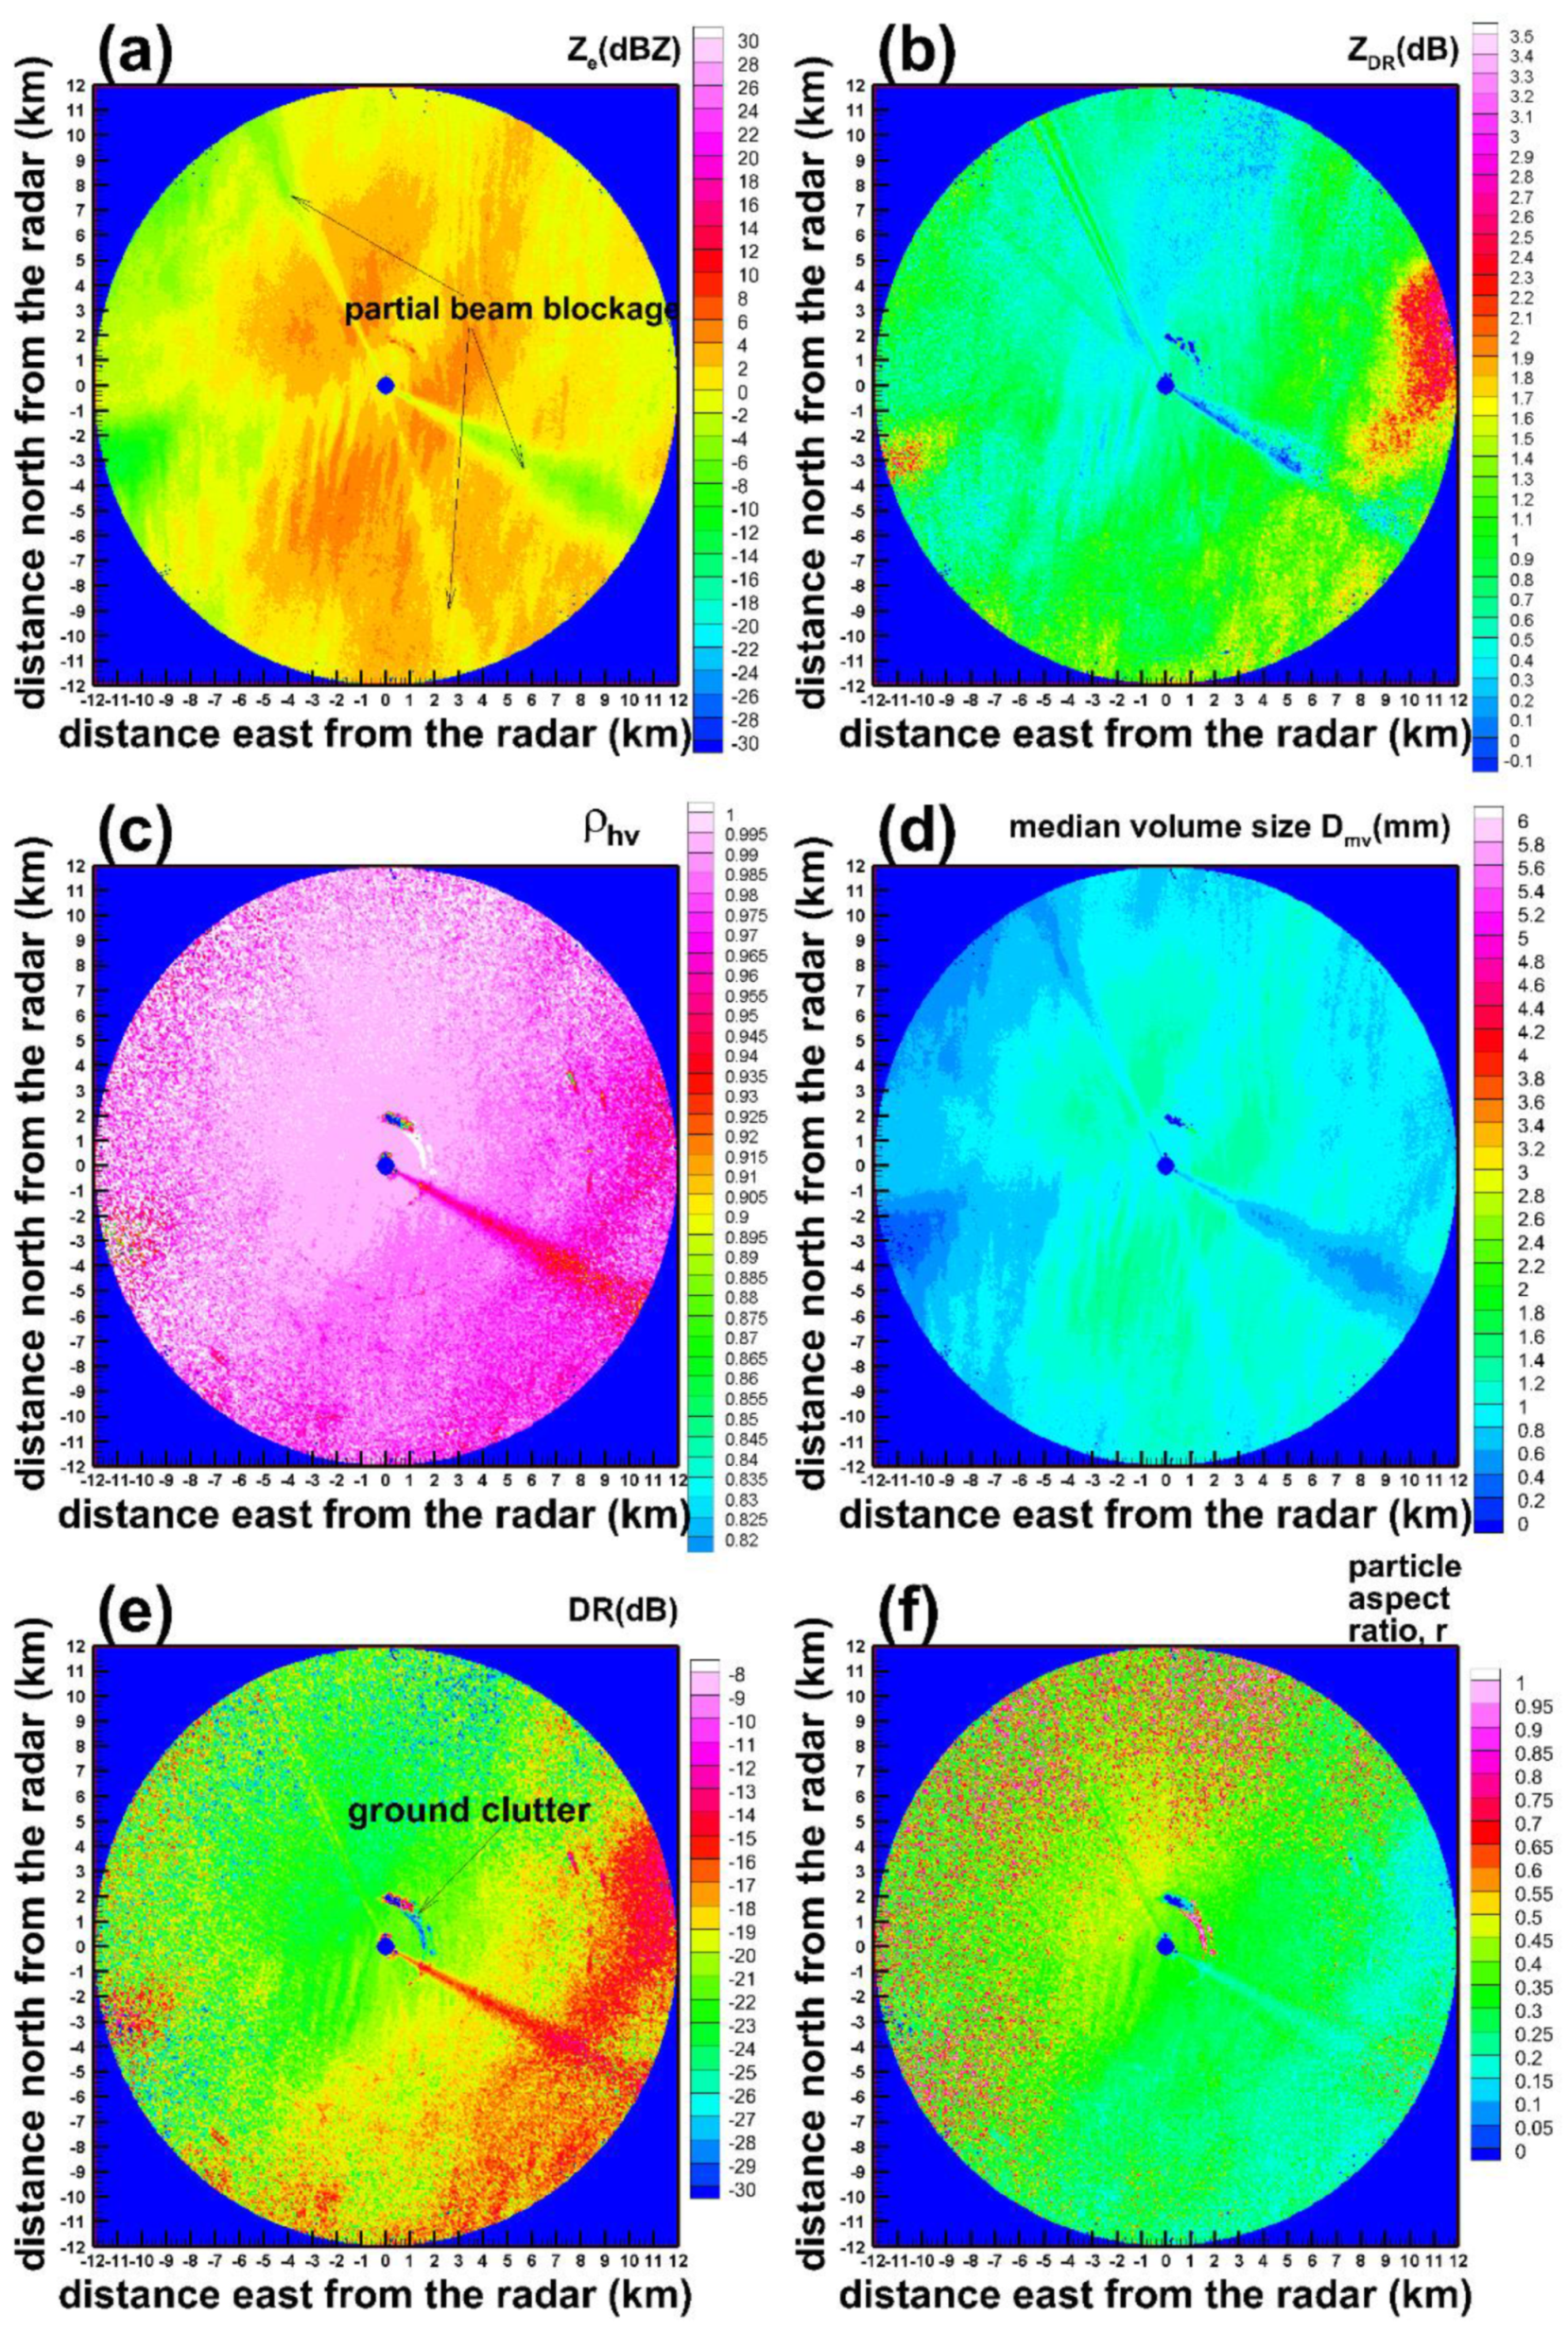
The Ka-band cloud radar observations in a precipitating ice cloud at Oliktok Point indicated a range gradient of particle dominant shapes. The retrieved aspect ratios near the radar site were around 0.4, which is in good agreement with in-situ sampling results. Overall, it can be concluded that in spite of uncertainties in the aspect ratio retrievals, which could be as high as 0.2 or so, the DR-based approach of estimating particle shapes is rather robust and can provide quantitative information on dominant ice hydrometeor shapes.

Funding

This research was funded by the US Department of Energy’s Atmospheric Systems Research (ASR) program (grant DE-SC0013306) and the National Science Foundation (grant AGS 1841260).

Conflicts of Interest

The author declares no conflicts of interest.

References

  1. Vivekanandan, J.; Zrnic, D.S.; Ellis, S.M.; Oye, R.; Ryzhkov, A.V.; Straka, J. Cloud microphysics retrievals using S-band dual-polarization radar measurements. Bull. Am. Meteorol. Soc. 1999, 80, 381–388. [Google Scholar] [CrossRef]
  2. Keenan, T. Hydrometeor classification with a C-band polarimetric radar. Aust. Meteorol. Mag. 2003, 52, 23–31. [Google Scholar]
  3. Dolan, B.; Rutledge, S.A. A theory-based hydrometeor identification algorithm for X-band polarimetric radars. J. Atmos. Ocean. Technol. 2009, 26, 2071–2088. [Google Scholar] [CrossRef] [Green Version]
  4. Hogan, R.L.; Tian, L.; Brown, P.R.A.; Westbrook, C.D.; Heymsfield, A.J.; Eastment, J.D. Radar scattering from ice aggregates using the horizontally aligned oblate spheroid approximation. J. Appl. Meteorol. Climatol. 2012, 51, 655–671. [Google Scholar] [CrossRef] [Green Version]
  5. Jensen, A.A.; Harrington, J.Y.; Morrison, H.; Milbrandt, J.A. Predicting ice shape evolution in a bulk microphysics model. J. Atmos. Sci. 2017, 74, 2081–2104. [Google Scholar] [CrossRef]
  6. Kokhanovsky, A.; Macke, A. The dependence of the radiative characteristics of optically thick media on the shape of particles. J. Quant. Spectrosc. Radiat. Transf. 1999, 63, 393–407. [Google Scholar] [CrossRef]
  7. Bukovcic, P.; Ryzhkov, A.; Zrnic´, D.; Zhang, G. Polarimetric radar relations for quantification of snow based on disdrometer data. J. Appl. Meteorol. Climatol. 2018, 57, 103–120. [Google Scholar] [CrossRef]
  8. Matrosov, S.Y. Theoretical study of radar polarization parameters obtained from cirrus clouds. J. Atmos. Sci. 1991, 48, 1062–1070. [Google Scholar] [CrossRef]
  9. Matrosov, S.Y.; Reinking, R.F.; Kropfli, R.A.; Martner, B.E.; Bartram, B.W. On the use of radar depolarization ratios for estimating shapes of ice hydrometeors in winter clouds. J. Appl. Meteorol. 2001, 40, 479–490. [Google Scholar] [CrossRef]
  10. Matrosov, S.Y.; Mace, G.G.; Marchand, R.; Shupe, M.D.; Hallar, A.G.; McCubbin, I.B. Observations of Ice crystal habits with a scanning polarimetric W-band radar at slant linear depolarization ratio mode. J. Atmos. Ocean. Technol. 2012, 29, 989–1008. [Google Scholar] [CrossRef]
  11. Matrosov, S.Y.; Reinking, R.F.; Djalalova, I.V. Inferring fall altitudes of pristine dendritic crystals from polarimetric radar data. J. Atmos. Sci. 2005, 62, 241–250. [Google Scholar] [CrossRef] [Green Version]
  12. Melnikov, V. Parameters of cloud ice particles retrieved from radar data. J. Atmos. Ocean. Technol. 2017, 34, 717–728. [Google Scholar] [CrossRef]
  13. Matrosov, S.Y.; Schmitt, C.G.; Maahn, M.; de Boer, G. Atmospheric ice particle shape estimates from polarimetric radar measurements and in situ observations. J. Atmos. Ocean. Technol. 2017, 34, 2569–2587. [Google Scholar] [CrossRef]
  14. Jameson, A.R. Relations among linear and circular polarization parameters measured in canted hydrometeors. J. Atmos. Ocean. Technol. 1987, 4, 634–645. [Google Scholar] [CrossRef] [Green Version]
  15. Melnikov, V.; Matrosov, S.Y. Estimations of aspect ratios of ice cloud particles with the WSR-88D radar. In Proceedings of the 36th Conference on Radar Meteorology, Breckenridge, CO, USA, 16–20 September 2013; American Meteorological Society: Washington, DC, USA, 2013; p. 245. Available online: https://ams.confex.com/ams/36Radar/webprogram/Paper228291.html (accessed on 21 October 2017).
  16. Ryzhkov, A.; Matrosov, S.Y.; Melnikov, V.; Zrnic, D.; Zhang, P.; Cao, Q.; Knight, M.; Simmer, C.; Troemel, S. Estimation of depolarization ratio using weather radars with simultaneous transmission /reception. J. Appl. Meteorol. Climatol. 2017, 56, 1797–1816. [Google Scholar] [CrossRef]
  17. Myagkov, A.; Seifert, P.; Wandinger, U.; Bühl, J.; Engelmann, R. Relationship between temperature and apparent shape of pristine ice crystals derived from polarimetric cloud radar observations during the ACCEPT campaign. Atmos. Meas. Tech. 2016, 9, 3739–3754. [Google Scholar] [CrossRef] [Green Version]
  18. Matrosov, S.Y. Depolarization estimates from linear H and V measurements with radar radars operating in simultaneous transmission-simultaneous receiving mode. J. Atmos. Ocean. Technol. 2004, 21, 574–583. [Google Scholar] [CrossRef]
  19. Moisseev, D.N.; Lautaportti, S.; Tyynela, J.; Lim, S. Dual-polarization radar signatures in snowstorms: Role of snowflake aggregation. J. Geophys. Res. 2015, 120, 12644–12655. [Google Scholar] [CrossRef] [Green Version]
  20. Reinking, R.F.; Matrosov, S.Y.; Kropfli, R.A.; Bartram, B.W. Evaluation of a slant 45° slant quasi-liner radar polarization for distinguishing drizzle droplets, pristine ice crystals, and less regular ice particles. J. Atmos. Ocean. Technol. 2002, 19, 296–321. [Google Scholar] [CrossRef]
  21. Marchand, R.; Mace, G.G.; Hallar, A.G.; McCubbin, I.B.; Matrosov, S.Y.; Shupe, M.D. Enhanced radar backscattering due to oriented ice particles at 95 GHz during Storm-VEx. J. Atmos. Ocean. Technol. 2013, 30, 2336–2351. [Google Scholar] [CrossRef]
  22. Von Lerber, A.; Moisseev, D.; Bliven, L.F.; Petersen, W.; Harri, A.M.; Chandrasekar, V. Microphysical properties of snow and their link to Ze-S relations during BAECC 2014. J. Appl. Meteorol. Climatol. 2017, 56, 1561–1582. [Google Scholar] [CrossRef]
  23. Heymsfield, A.J.; Schmitt, C.; Bansemer, A. Ice cloud particle size distributions and pressure-dependent terminal velocities from in situ observations at temperatures from 0° to −86 °C. J. Atmos. Sci. 2013, 70, 4123–4154. [Google Scholar] [CrossRef]
  24. Matrosov, S.Y. A dual-wavelength radar method to measure snowfall rate. J. Appl. Meteorol. 1998, 37, 1510–1521. [Google Scholar] [CrossRef]
  25. Matrosov, S. Variability of microphysical parameters in high-altitude ice clouds: Results of the remote sensing method. J. Appl. Meteorol. 1997, 36, 633–648. [Google Scholar] [CrossRef]
  26. Matrosov, S.Y.; Heymsfield, A.J. Empirical relations between size parameters of ice hydrometeor populations and radar reflectivity. J. Appl. Meteorol. Climatol. 2017, 56, 2479–2488. [Google Scholar] [CrossRef]
  27. Matrosov, S.Y.; Campbell, C.; Kingsmill, D.; Sukovich, E. Assessing snowfall rates from X-band radar reflectivity measurements. J. Atmos. Ocean. Technol. 2009, 26, 2324–2339. [Google Scholar] [CrossRef] [Green Version]
  28. Kennedy, P.C.; Rutledge, S.A. S-band dual-polarization radar observations of winter storms. J. Appl. Meteorol. Climatol. 2011, 50, 844–858. [Google Scholar] [CrossRef]
  29. Bringi, V.N.; Chandrasekar, V. Polarimetric Doppler Weather Radar; Cambridge University Press: Cambridge, UK, 2001; 636p. [Google Scholar]
  30. Matrosov, S.Y.; Shupe, M.D.; Djalalova, I.V. Snowfall retrievals using millimeter-wavelength cloud radars. J. Appl. Meteorol. Climatol. 2008, 47, 769–777. [Google Scholar] [CrossRef] [Green Version]
  31. Atmospheric Radiation Measurement (ARM) User Facility. Ka-Band Scanning ARM Cloud Radar (KASACRPPIVH); 2016-10-20 to 2016-10-21, ARM Mobile Facility (OLI) Oliktok Point, Alaska, AMF3 (M1); Isom, B., Bharadwaj, N., Lindenmaier, I., Nelson, D., Hardin, J., Matthews, A., Eds.; ARM Data Center: Oak Ridge, TN, USA, 2018. [Google Scholar]
  32. Matrosov, S.Y.; Maahn, M.; de Boer, G. Observational and modeling study of ice hydrometeor radar dual-wavelength ratios. J. Appl. Meteorol. Climatol. 2019, 58, 2005–2017. [Google Scholar] [CrossRef]
  33. Sassen, K.; Matrosov, S.; Campbell, J. CloudSat spaceborne 94 GHz radar bright band in the melting layer: An attenuation driven upside-down lidar analog. Geophys. Res. Lett. 2007, 34, L16818. [Google Scholar] [CrossRef]
Figure 1. r-DR relations for different values of median volume particle size, Dmv, assuming that the radar elevation angle α = 10°, transmission phase shift φt =90°, the standard deviation of particle wobbling σθ = 20°, and m = 0.0053D2.1 mass-size relation (m is in grams, D is in cm).
Atmosphere 11 00097 g001
Figure 2. r-DR relations assuming Dmv = 0.1 cm and different assumptions for the radar elevation angle α, transmission phase shift φt, the standard deviation of particle wobbling σθ, and the coefficients in the particle mass-size relation.
Atmosphere 11 00097 g002
Figure 3. r-DR relations assuming Dmv = 0.1 cm and different assumptions for the radar elevation angle α, the transmission phase shift φt, the standard deviation of particle wobbling σθ, and the coefficients in particle mass-size relation. Different color segments correspond to results of modeling with different Dmv values (i.e., 0.05, 0.1, 0.2, 0.3 and 0.5 cm).
Atmosphere 11 00097 g003
Figure 4. r-DR (lower X-axis, black curves) and r-ZDR (upper X-axis, red curves) relations for different particle wobbling parameters σθ.
Atmosphere 11 00097 g004
Figure 5. Measurements of horizontal polarization reflectivity (a), differential reflectivity (b), copolar correlation coefficient (c), estimates of depolarization ratio (e) and retrievals of particle median volume size (d) and aspect ratio (f) corresponding to a KDLH radar scan at 4.5° on 5 March 2013 at 19:27 UTC.
Atmosphere 11 00097 g005
Figure 6. Measurements of horizontal polarization reflectivity (a), differential reflectivity (b), copolar correlation coefficient (c), estimates of depolarization ratio (e) and retrievals of particle median volume size (d) and aspect ratio (f) corresponding to a KDLH radar scan at 4.5° on 20 February 2014 at 19:31 UTC.
Atmosphere 11 00097 g006
Figure 7. Measurements of horizontal polarization reflectivity (a), differential reflectivity (b), copolar correlation coefficient (c), estimates of depolarization ratio (e) and retrievals of particle median volume size (d) and aspect ratio (f) corresponding to a KDLH radar scan at 5° on 21 October 2016 at 00:52 UTC.
Atmosphere 11 00097 g007

