Abstract
Human exposure to healthy doses of UV radiation is required for vitamin D synthesis, but exposure to excessive UV irradiance leads to several harmful impacts ranging from premature wrinkles to dangerous skin cancer. However, for countries located in the global dust belt, accurate estimation of the UV irradiance is challenging due to a strong impact of desert dust on incoming solar radiation. In this work, a UV Index forecasting capability is presented, specifically developed for dust-rich environments, that combines the use of ground-based measurements of broadband irradiances UVA (320–400 nm) and UVB (280–315 nm), NASA OMI Aura satellite-retrieved data and the meteorology-chemistry mesoscale model WRF-Chem. The forecasting ability of the model is evaluated for clear sky days as well as during the influence of dust storms in Doha, Qatar. The contribution of UV radiation to the total incoming global horizontal irradiance (GHI) ranges between 5% and 7% for UVA and 0.1% and 0.22% for UVB. The UVI forecasting performance of the model is quite encouraging with an absolute average error of less than 6% and a correlation coefficient of 0.93. In agreement with observations, the model predicts that the UV Index at local noontime can drop from 10–11 on clear sky days to approximately 6–7 during typical dusty conditions in the Arabian Peninsula—an effect similar to the presence of extensive cloud cover.
1. Introduction
The incoming solar radiation at the Earth’s surface consists of radiations of different wavelengths such as the visible and infrared, but also the UV (UltraViolet) bandwidth. The UV radiation takes up a small portion of the total solar irradiance (usually about 5–7%), but is a key component for the sustenance of life on Earth [1]. The most important benefit of human exposure to UV radiation is the production of vitamin D that contributes to a strengthening of the bones. Additionally, exposure to controlled doses of UV radiation helps in treating several human skin diseases such as atopic dermatitis, psoriasis, localized scleroderma, and vitiligo. Furthermore, nitrogen oxide (NO) produced from UV has antimicrobial effects and generally improves cardiovascular health by reducing blood pressure [2]. On the other hand, excessive exposure to UV radiation leads to several harmful health effects on the skin through sunburn, melanoma, and non-melanoma carcinoma, on the eye through cataracts, pterygium (growth of conjunctiva in eye), and photoconjunctivitis (inflammation of conjunctiva), photokeratitis (inflammation of the cornea), and suppression of the immune system [1,3,4,5]. Thus, it is important for people to control their exposure to UV radiation [1,6].
The UV radiation on the Earth’s surface is largely determined by the solar zenith angle, clouds, total ozone column, surface albedo, aerosols, earth–sun distance, and altitude [7]. Clouds poorly absorb UV radiation and in general, scatter UV radiation into the atmosphere [8,9]. Stratospheric ozone (ozone layer) predominantly absorbs UV radiation at wavelengths below 320 nm [10]. The extent of reflectivity from a surface affects UV surface irradiance with higher surface albedo enhancing the net UV surface irradiance due to multiple scattering of the reflected irradiance with the atmosphere. For example, a surface covered by snow (with albedo of 0.8) will increase UV irradiance at 320 nm by 1.5 times compared to snow-free, low albedo conditions [11]. Aerosols also affect the incoming UV irradiance. They usually decrease UV irradiance reaching the surface by scattering and absorption. A measurement campaign in Greece showed that UV irradiance decreased by 5–35% due to aerosols [12], and similar numbers of annual average aerosol attenuation of UV irradiance were obtained around the globe [13]. Desert dust intrusions also affect UV irradiance with differences larger than 30% in cloudless conditions in Santiago de Chile [14,15]. These differences in UV irradiance highlight the need for ground-based measurements to account for the attenuation of UV radiation in the troposphere which are not accounted for in satellite derived estimates [16,17]. UV irradiance increases with increasing altitude due to a thinner atmosphere that scatters and absorbs the radiation, and lesser anthropogenic aerosols which are usually limited to lower altitudes. The earth–sun distance which varies throughout the year also affects the incoming UV, with higher UV irradiance during the summer months [8].
The UV radiation comprises of three broadband regions; UVC from 100 to 280 nm, UVB from 280 to 315 nm, and UVA from 320 to 400 nm (Figure 1). UVA radiation is predominantly not absorbed by atmospheric aerosols or living organisms while almost all of UVC radiation is absorbed by the Huggins–Hartley system of ozone and the Schumann–Runge systems (70–200 nm) of molecular oxygen. UVB radiation is primarily absorbed by the earth’s ozone layer, however some of it is partially transmitted through the atmosphere [18]. The UVB radiation that is not absorbed interacts with coarse and fine mode particles in the atmosphere on its way to the earth’s surface [19].
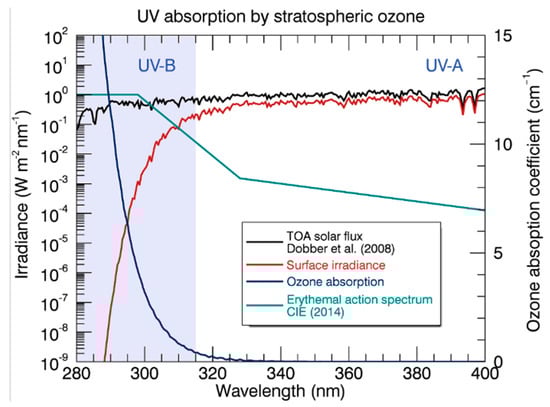
Figure 1.
Sample surface UV irradiance spectrum on a clear summer day. Stratospheric ozone (Huggins–Hartley band system—blue curve) absorbs the radiative flux (black curve) in the UV-B region) resulting in the net surface irradiance (red curve). Susceptibility of human skin to epidermal damage is demonstrated by the erythemal action spectrum (green curve) [18]. © Crown copyright 2018.
One way to disseminate UV radiation information to people is through the UV Index (UVI). It is an international standard that represents the erythemal (sunburn producing) effect of UV radiation with a convenient numerical range normally from 0 to 11 [18]. The UVI is calculated by National Aeronautics and Space Administration (NASA)’s Ozone Monitoring Instrument (OMI) on its Aura satellite that considers cloud-free, and snow-free conditions, and provides data for mean sea level with surface albedo of 3% and aerosol optical depth (AOD) at 550 nm for a particle diameter of 0.2 nm [20]. However, for countries located in the global dust belt (an area that extends from the west coast of North Africa, through the Middle East, into Central Asia) with high surface albedo (due to its desert landscape), and high AOD throughout the year [21], there is a need for a more representative UVI.
For the first time, a method for UVI forecasting has been developed for the dust-rich conditions of the Middle East that makes use of a three dimensional regional meteorology-chemistry model [7], [22] combined with surface solar radiation measurements from our monitoring stations in Doha, Qatar and NASA’s OMI Aura satellite-retrieved data.
2. Methodology
2.1. The Region of Interest
This study concentrates on UV Index forecasting in the Middle East with a focus over the state of Qatar. Qatar is located in the Arabian Peninsula and juts out as a peninsula into the Arabian Gulf Sea. Doha (25.33 °N, 51.43 °E), its capital city, has almost 80% of its population of 2.8 million and is one of the fastest growing regions of the world with significant infrastructure and industrial development over the last two decades [23]. The country has semi-arid climate with very limited annual rainfall [24]. Qatar, located in the sun belt region of the world, receives about 9.4 h of sunshine daily and consequently receives a high amount of UV radiation [25,26]. It is also within the global dust belt, and thus, its atmosphere constantly has a large proportion of mineral desert dust aerosol particles that mostly absorb UV radiation [25,27]. Most of its mineral dust concentrations come through two wind regimes—the summer and the winter Shamal winds that blow from the deserts of Iraq, Syria, and the Arabian Peninsula [21,24].
2.2. Ground Measurements
Surface solar monitoring stations (Figure 2) have been deployed across Qatar by the Qatar Environment and Energy Research Institute (QEERI) with the main supersite monitoring station located in Education City, Doha (25.33 °N, 51.43 °E), which is considered an urban background site, at the premises of the Research and Development Center of Hamad bin Khalifa University (HBKU). Global Horizontal Irradiance (GHI), UVA, UVB, and relative humidity (RH), among others were measured from 1 January, 2013 to 31 December, 2018. These measurements are taken with a Kipp & Zonen Pyranometer solar radiation instrument that includes a Solys2 sun tracker with sun sensor kit for improved tracking accuracy and shading ball assembly for diffuse measurements, one CHP1 pyrheliometer First Class (https://www.kippzonen.com/Product/18/CHP1-Pyrheliometer#.XZTvyFVLjIU) to measure Direct Normal Irradiance (DNI), and two CMP11 pyranometers fitted with CVF 3 ventilation units with one of them shaded for GHI and Diffuse Horizontal Irradiance (DHI) measurements [28]. Daily maintenance, cleaning, and quality control checks of the sensors and of the collected data were conducted [28].
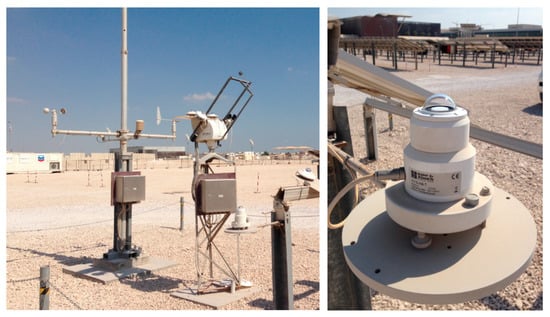
Figure 2.
The ground-based analyzers from QEERI’s Outdoor Test Facility (OTF) in Education City, Doha, Qatar.
2.3. Satellite-Derived UVI from OMI Aura
The OMI satellite instrument on the NASA EOS (Earth Observation System) Aura satellite launched in July 2004 was built in collaboration between the Netherlands Agency for Aerospace Programs (NIVR) and the Finnish Meteorology Institute (FMI) [29,30]. The Aura satellite orbits at an altitude of 705 km in a sun-synchronous polar orbit with an exact 16-day repeat cycle and with a local equator crossing time of 13:45. It provides latitudinal coverage from 82 °N to 82 °S. It is a nadir viewing spectrometer that measures reflected and backscattered solar radiation from 264 nm to 504 nm with a spectral resolution of 0.55 nm in the ultraviolet and 0.63 in the visible spectrum, a ground resolution of 13 km × 24 km and a swath of 2600 km wide, making it capable of daily global contiguous mapping [31]. The OMI was a significant improvement from previous satellite-based instruments such as the TOMS (Total Ozone Mapping Spectrometer), GOME (Global Ozone Monitoring Experiment), and SCIAMACHY (SCanning Imaging Absorption SpectroMeter for Atmospheric CHartographY) with improved spatial resolution as well as the vastly increased number of wavelengths. The OMI UV product covers the years from 2004 to the present and is currently foreseen to last for at least a few more years [8].
In this study, the OMI’s surface UV irradiance (OMIUVB), which is derived from a surface UV algorithm (Sodankylä OMI UV Processing System (SOUPS)) developed by the FMI and NASA, is used. This algorithm includes the use of OMI measurements such as cloud pressure and cloud fraction as inputs to radiative transfer models and generates local solar noon irradiances at 305, 310, 324, and 380 nm, as well as erythemally weighted irradiance. The algorithm comprises of two parts—a part to calculate the clear-sky surface UV irradiance, and a second part that corrects that irradiance for clouds and aerosols by using the measured reflected and backscattered light at 331 nm and 360 nm. This correction is, however, one dimensional as it uses a plane-parallel cloud model, and thus, does not account for three-dimensional effects of clouds, and variation in terrain [32]. All OMI Aura products are downloaded from the Aura Validation data center (http://aura.gsfc.nasa.gov).
One of the factors that affect a satellite model’s calculation of UVI is the reflectance of radiation from intermediate cloud and aerosol layers, with higher reflection contributing to errors and over estimation of UVI compared to surface data. Thus, a linear model in which satellite UVI is correlated to ground-based UVA and UVB irradiances could be developed for clear sky days. Surface reflectance for satellite models is determined by a parameter known as the Lambertian Equivalent Reflectivity (LER). In OMI, the LER is used for cloud and aerosol reflectance characterization [33,34]. In addition to reflectance by clouds and aerosols, ground surface’s reflectance plays a role in UVI over estimation as well, even though it is usually an order of magnitude lesser than that by cloud layers. However, unlike clouds and aerosol layers which are transient, ground reflectance is nearly constant seasonally in regions without snow and ice. The LER accounts for ground surface reflectance as well [35]. While a number of studies on UVI with satellite measurements have used LER of less than 0.1 to identify clear sky days [27,30], Qin et al., 2019, Herman et al., 2013, and O’Byrne et al. 2013, showed that OMI LER over the Arabian desert region is higher due to higher surface reflectance of the desert [33,35,36]. Therefore, for this study over the Arabian Desert region, LER of less than 0.2 is used to represent clear sky days.
2.4. Three-Dimensional Regional Air Quality Model
GHI is simulated using a three-dimensional atmospheric meteorology-chemistry model in a triple-nesting configuration over the Middle East with a focus on the hot desert climate of Qatar [7]. NWP (Numerical Weather Prediction) models inherently include a radiative transfer model that is used to predict GHI through a dynamic modeling of the troposphere. However, NWP models, traditionally, either neglect the presence of particles in the atmosphere or include a simplified aerosol approach (e.g., use of climatological data) resulting in large biases in solar irradiance forecasting for dust-rich environments [7,37]. In this work, we simulate GHI in Qatar and the Middle East using a regional air quality model (WRF-Chem) including a state-of-the-art prognostic treatment of aerosols [7]. The WRF-Chem model simulated the three basic components for accurate atmospheric concentration predictions: emissions of atmospheric constituents (gases and aerosol particles); transport of constituents; and the physicochemical transformations of atmospheric species. The GOCART (Georgia Institute of Technology–Goddard Global Ozone Chemistry Aerosol Radiation and Transport) aerosol scheme [38] was used in all simulations along with the RACM (Regional Atmospheric Chemistry Mechanism) chemistry scheme [39]. The Hemispheric Transport of Air Pollution emissions (HTAP; http://www.htap.org/) anthropogenic emissions were used with a grid resolution of 0.1° × 0.1° and include: non-methane volatile organic compounds, nitrogen oxides, ammonia, carbon monoxide, sulfur dioxide, black carbon, organic carbon, PM2.5 and PM10. These emissions are provided for several source sectors: ground transport (road, rail, pipeline, inland waterways), energy (power industry), industry (manufacturing, solvent industry, chemical, cement, metal, mining), agriculture and residential sector (heating/cooling of buildings and equipment/lighting of buildings and waste treatment). Dust was simulated using the US Air Force Weather Agency emission scheme which incorporates the MB95 [40] dust emission parameterization with typical airborne dust size distributions [41].
2.5. UV Index Determination
The UV Index was officially adopted as the method of reporting surface UV irradiances by the World Meteorological Organization (WMO) and World Health Organization (WHO) in 1994 [42] and is defined as:
where, for wavelengths in the UV range of 280 to 400 nm,
is the surface solar irradiance, and
is the erythemal action spectrum.
The UV Index provides a simple scale (Figure 3) to inform the public about the strength of the UV radiation to take appropriate protection actions. The UV Index values range from 0 to 11 [43] and extreme cases of UVI greater than 11 are found in the tropics where the solar zenith angle and the total column ozone are small, such as in the Arabian Peninsula.
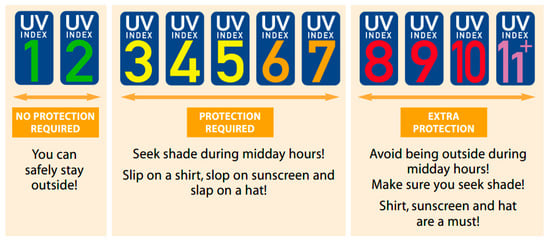
Figure 3.
UV Index scale [43].
The two most common approaches to estimate the UV Index are the integration (Equation (1)), and the linear model fitting [18]. The integration approach requires the sum of the product of piecewise interpolated spectral irradiances over various wavelength bandwidths to the corresponding erythemal action spectrum [18]. The linear model fitting approach is an iterative linear regression analysis that seeks to obtain the coefficients of a linear combination of various broadband UV spectral subcomponents such as UVA, UVB, and UVC, to the UVI. UVC components are not considered as they are absorbed before they reach the surface. Pashiardis et al., 2017 validated the use of a linear model to estimate UVI [44].
Another alternative modeling technique is the artificial neural network. These complex models perform a large number of iterations to find the most suitable coefficients. However, as evidenced by Barbero et al., 2007, statistical models such as linear regression perform adequately compared to neural network-based model as the latter do not respond to changes beyond what the iterations were based on [45]. Barbero et al., 2007 recommend that the use of the neural network methodology should be limited to models where large data sets are available and cover many possible scenarios of real atmospheric conditions [45].
In this research, as ground-based radiometers provide UVA and UVB irradiation directly, the linear modelling approach was chosen to develop a method to forecast the UV Index using the WRF-Chem model as the basis. All analyses to develop the new UVI model are performed at local noon time for surface UVA and UVB irradiance data from the ground-surface pyranometers, and the NASA OMI Aura satellite-derived UVI data.
3. Results
A linear fitting UVI estimation approach (Equation (2)) is followed using UVA and UVB, as below,
where for a particular date DD/MM (DD for date, and MM for month) of the year, at its local noon,
the is the average UV Index obtained by the NASA OMI Aura satellite,
the and are the average UVA and UVB irradiances obtained from surface (SFC) measurements,
the and are the coefficients of the model, and that accounts for the model’s residuals, are to be obtained.
The following subsections describe how the linear forecasting model is developed. Section 3.1 describes the first step of finding the monthly ratio of UVA/GHI and UVB/GHI from ground-based measurements in Qatar for 6 years (2013–2018). The effects of ground-based measurements of relative humidity and solar zenith angle on these ratios is also discussed. Section 3.2 describes the development and presents the linear-fit UVI model with UVA and UVB. The model is obtained by performing an iterative linear regression analysis to find the relationship between UVI obtained from NASA’s OMI Aura satellite with the ground-based measurements of UVA and UVB over Doha, Qatar on clear-sky days between 2013 and 2018. Section 3.3 describes the use of the model to obtain forecasts of UVI for Qatar. For a test period of 1 January 2019 to 31 August 2019, forecasts of GHI up to 72 h ahead are obtained from WRF-Chem. Section 3.4. provides the various statistical tools to assess the model’s performance of UVI forecasts against NASA’s OMI Aura satellite-derived UVI values on clear-sky days. Finally, Section 3.5. highlights the model’s accurate prediction of UVI forecasts on non-clear sky days by comparing its performance on two days with very high PM10 concentrations over Qatar.
3.1. Obtaining the Contributions of UVA and UVB to GHI
Using the GHI, UVA and UVB data from a series of measurements taken in Qatar from 2013 to 2018, the fraction of UVA/GHI and UVB/GHI was obtained for a period of 6 years (Table 1).

Table 1.
Monthly variation of solar irradiance parameters for Doha, between 2013 and 2018—comparison between values at local noon and those averaged throughout the intraday sunshine hours (05:00 to 06:00).
The maximum GHI occurs during the summer months with the highest being in June at 969 W/m2 and this also corresponds to the highest UV irradiance (52 W/m2 UVA and 1.9 W/m2 UVB) (Figure 4). The daily average taken over the sunshine hours between 05:00 and 06:00 highlight the difference against the high GHI at local noon (Figure 4).
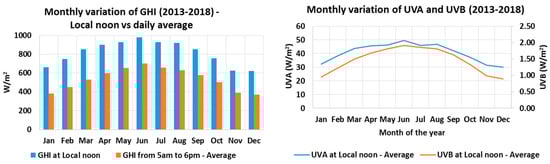
Figure 4.
The monthly variation of (left) GHI at local noon and the intraday average, (right) UVA and UVB from 2013 to 2018 at the surface station in Doha, Qatar.
The contribution of UV radiation to the total incoming GHI is small, with UVA approximately 5–7% and the UVB approximately 0.1–0.22% (Figure 5). The relative ratios of the UVA and UVB components to total GHI are very similar throughout the year but still vary by a small amount (0.4% for UVA/GHI and 0.1% for UVB/GHI). While the generally similar ratio points to the predominant role the earth’s rotation relative to the sun has on incoming UV irradiance (which does not change), the small changes on the ground-based sensors can be attributed to the role of atmospheric aerosols on the scattering and absorbing of incoming irradiance. All data for the analysis were obtained from the daily minute-by-minute readings from the sensors from 1 January 2013 to 31 December 2018. The data were quality screened to remove values of UVA/GHI more than 7% and the UVB/GHI values more than 0.22% based on the recommendations from Pashiardis et al., 2017 [44]. Other parameters that affect Qatar’s surface irradiance of UVA, and UVB are the relative humidity and solar zenith angle as shown in Figure 6; Figure 7. In the summer months, relative humidity and the solar zenith angle is less and with lesser atmospheric interference on incoming solar irradiance, the UVA and UVB irradiances are higher during this period. Figure 6 shows the effect of water which has a UV absorption spectrum associated with it, and thus with higher relative humidity, UV surface irradiance reduces.
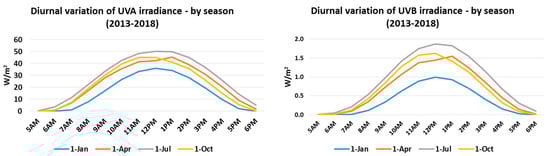
Figure 5.
Diurnal (intraday) variation of UVA (left) and UVB (right) radiation (averaged from 2013 to 2018) on four dates (1 January, 1 April, 1 July, and 1 October) to show the seasonal variation at Doha, Qatar. The maxima for both radiations occur at local noon time in Qatar.
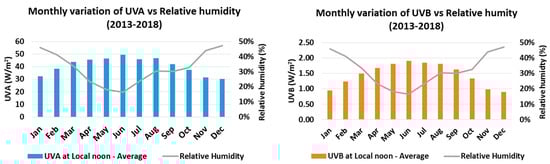
Figure 6.
Monthly variation of (left) UVA and (right) UVB with relative humidity (a gauge of atmospheric water vapor content) at local noon in Doha, Qatar from 2013 to 2018.
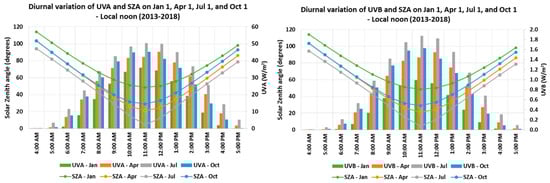
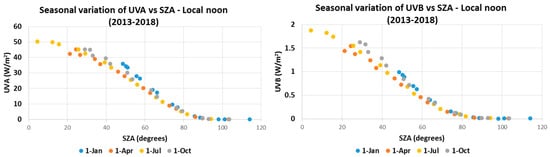
Figure 7.
Diurnal variation of UVA and UVB radiation with solar zenith angle in Doha, Qatar on four dates (1 January, 1 April, 1 July, and 1 October) showing the seasonal variation.
Section 3.1 does not include any data screening for clear sky days. Only ground-based data of GHI, UVA and UVB are used.
3.2. Developing a UVI Model Using the Broadband UVA and UVB Irradiances
The linear fit model approach is followed here using UVA and UVB data obtained from 2013 to 2018 from ground-based analyzers (Table 1) with the satellite UVI data from NASA’s OMI from 2013 to 2018 (Equation (1)).
To obtain OMI Aura satellite derived UVI data, as this was the first ever analysis of OMI products over Doha, the UVI for Doha was generated and made available online on a special request to the relevant NASA team (Figure 8) [46].
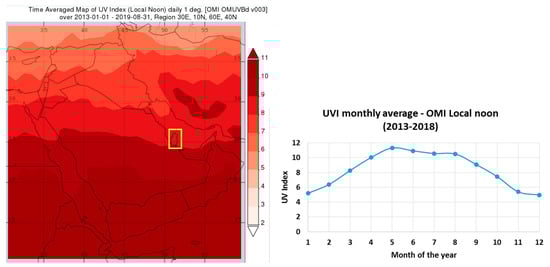
Figure 8.
(left) Map of UV Index across the Arabian Peninsula from 1 January 2013 to 31 August 2019. The yellow box locates Qatar at latitude of 24.08–26.35 and longitude 50.62–51.88 (NASA, OMIUVb data retrieved from NASA’s GIOVANNI platform); (right) Monthly variation of UV Index over Doha, Qatar as obtained from NASA’s OMI satellite.
For the clear-sky model, the NASA OMI clear-sky UVI (CSUVI) product for days when the LER was less than 0.2 was used. Out of a possible 2191 days between 2013 and 2018, OMI UVI data for clear sky days (with LER less than 0.2) were available for 1671 days, i.e., 76% of all days over Doha, showing that the atmosphere over Qatar is usually clear sky. This finding is consistent with other studies over Doha that show that most of the days in Doha are cloud-free as meteorological conditions do not favor the formation of clouds [7,28,47,48,49]. An iterative linear regression analysis was performed to find the coefficients that provided the highest correlation coefficient to the satellite obtained daily UVI (Equation (3)). After accounting for 27 days with no UVA and UVB data (from 2013 to 2018), and removing outliers based on physical limits, consistency checks, and extremely rare limits (18 days), the model was established with UVI, UVA, and UVB values from 1626 days (Equation (4)). The following coefficients were derived:
Thus, the UVI model using ground-based data and NASA OMI Aura satellite-derived UVI values on clear sky days is:
where DD/MM stands for the date and the month of the year.
With this model, the normal probability distribution of the residuals, i.e., the difference in the actual satellite UVI and the model UVI, is plotted below. Almost half the data match the satellite data, 80% fall within +/−1 UVI, and 97% fall within +/−2 UVI (Figure 9).
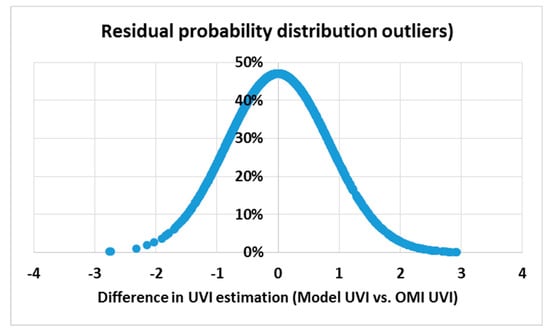
Figure 9.
Probability distribution function of the residuals (difference in model UVI values versus the satellite UVI data).
3.3. A Model to Forecast UVA and UVB
The already established WRF-Chem/QEERI model setup [7] begun its operational forecasting products on 1 January 2019. Therefore, hourly GHI forecasts from 1 January 2019 to 31 August 2019 for 72 h ahead of time are used in this study. The GHI forecasts were multiplied by the daily UVA/GHI and UVB/GHI fractions to obtain the forecasted UVA and UVB estimates for day-1, day-2, and day-3 forecasts for each day from 1 January 2019 to 31 August 2019.
The UVA and UVB forecasted values for one, two, and three days ahead were used in the model to find the UVI forecasts. The obtained UVIs were then compared with the actual NASA OMI satellite UVI values obtained from 2 and 3 January 2019 to 1 and 2 September 2019. The model provided very good forecasting results with a high correlation factor of 0.9 for the day-1, day-2, and day-3 forecasts against the satellite-obtained UVI (Figure 10).
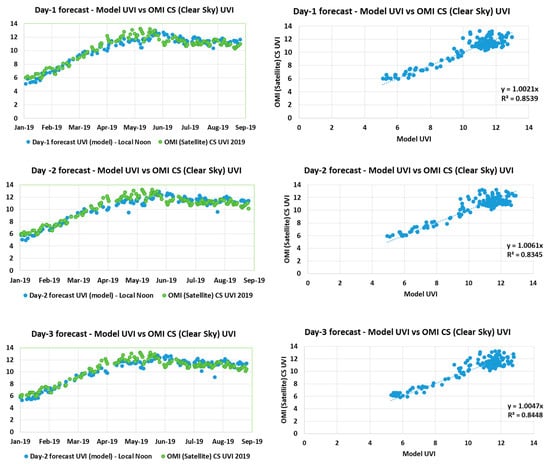
Figure 10.
Comparison of the modeled UV Index forecast for daily (Day-1), 1 day (Day-2), and 2 days (Day-3) ahead with the actual NASA OMI Aura satellite derived UVI data on clear sky days from 1 January to 31 August 2019.
The excellent performance of the model for all three days ahead of time highlights the usefulness of the model. By forecasting UVI from 1 January 2019 to 31 August 2019, the model is validated for use in the winter and summer seasons of Qatar. The density of the range of variance appears to be higher at the higher UVI values as the data set range until 31 August 2019, which includes the majority of the high-UVI seasons. Had the analysis continued to include the entire year (i.e., September to December 2019), a seemingly higher density of variation would have been observed throughout the data set.
3.4. Model Evaluation
A number of statistical tools commonly used in meteorological studies were used to validate the model. They included MBE, MAPE, RMSE, and R (Equation (5)–(8)) [7,37,50]. The statistics are defined in the next paragraph and the results are summarized in Table 2.
Table 2.
The statistical parameters to qualify the model for prediction of daily UVI (Day-1), 1 day forecast UVI (Day-2), and 2 day forecast UVI (Day-3) values.
For n number of data points, and being the UVI predicted by the model and being the OMI Aura satellite derived clear sky UVI,
The Mean Bias Error (MBE) is a measure of the bias in the forecasted UVI, i.e., a negative value indicates that the modeled UVI is negatively biased (lower) than the actual clear sky satellite derived UVI. In this case, all three cases have a negative bias, confirming that the predicted UVI that is based on surface data is lesser than the satellite derived UVI due to the presence of absorbing aerosols in Qatar’s atmosphere.
The Mean Absolute Percentage Error (MAPE) is a measure of the forecast’s prediction capability. The MAPE is less than 6% for all three forecasts highlighting the model’s high accuracy.
The Root Mean Square Error (RMSE) is a measure of how well a model configuration performed relative to another. The RMSE values are also similar to results from UVI forecasting models [51]. In this case, the model’s UVI Day-3 forecast and Day-1 forecast have slightly lower RMSE values than the Day-2 forecast. However, as the magnitude is small, it can be concluded that the model performs just as well for all three cases.
The correlation coefficient calculates the strength of the model in its predicting ability relative to the actual satellite UVI. It ranges from −1 to 1. Correlation coefficients closer to 1 show a perfect positive correlation. In this case, high values of 0.92 and 0.93 validate the model’s encouraging forecasting performance.
In this validation, the absence of OMI satellite UVI data for 86 days in 2019 should be noted (on 60 days, the satellite did not pass over the coordinates of Doha, and the remaining 26 days had LER of more than 0.2, i.e., were not clear sky days). This highlights the importance of having a UVI forecast model based on ground-based sensors that will serve to provide data forecasts for all days regardless of the availability of satellite based UVI data.
3.5. Model Performance during Two Extremely Dusty Days in Doha
On 1 March and 26 March 2019, Doha witnessed very high PM10 concentrations of 1241 µg/m3 and 629 µg/m3 respectively, due to local dust episodes (Figure 11). The high concentration of particulate matter in the atmosphere reduces the surface irradiance of UV. These two dates are thus used to validate the UVI forecasting model’s ability to account for dust concentrations and predict the reduction of UVI.
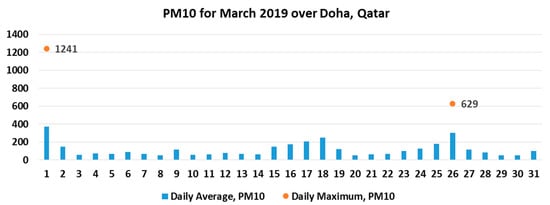
Figure 11.
The PM10 daily average concentration (blue bars) over Doha for the month of March 2019. The dates 1 March and 26 March, 2019 are used as case studies of extremely high PM10 concentrations to validate the model.
On 1 March, 2019, there was a severe dust storm across Doha with high average PM10 concentration of 371 µg/m3 and a maximum of 1241 µg/m3 (Figure 11). The model predicted a UVI of 5.49 on 28 February, 2019, which was very close to the UVI measured on the day of 5.99.
Unfortunately, it was not possible to compare this result with the OMI Aura satellite UVI data as it was one of those days when the satellite did not pass over Doha’s coordinates. Figure 12 shows the distribution of UVI for the Arabian Peninsula from the OMI Aura satellite using NASA’s GIOVANNI platform the day before and the day after the dust storm event, i.e., 28 February, 2019 and 2 March, 2019 [52]. Unfortunately, the GIOVANNI plot for 1 March, 2019 was not available, however, the plot for 28 February, 2019 would be very similar to the one for 1 March, 2019 showing how the satellite did not pass over Doha. This case study highlights the use of the UVI forecasting model to provide accurate forecast information when the NASA OMI Aura satellite does not pass over Doha.
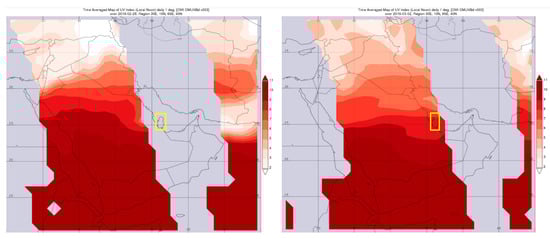
Figure 12.
OMI Aura UVI plots for the Arabian Peninsula on (left) 28 February, 2019, and on 2 (right) March, 2019 generated using NASA’s GIOVANNI platform. All data that are greyed out are from where the satellite did not pass over and thus did not have UVI information. Qatar is highlighted in a yellow box.
On 26 March, 2019 there was another dust storm across Doha with high average PM10 concentration of 304 µg/m3 and a maximum of 629 µg/m3 (Figure 11). The model predicted a low UVI of 6.4 on the 24 March, 2019, 2 days before the event, then predicted a UVI of 6.86 on 25 March, 2019, which was very close to the UVI measured on the day of 6.81. Fortunately, the OMI Aura satellite passed over Doha’s coordinates and generated a clear sky UVI of 10.8. This shows that, compared to the satellite data, the model developed in this study accounts for the dust intrusion well whereas the satellite data underestimates this effect. A post-event corrected UVI by the satellite to account for the dust intrusion generated an over-compensated UVI of 3.6. Figure 13 shows the distribution with the corrected UVI for the Arabian Peninsula from the OMI Aura satellite using NASA’s GIOVANNI platform on 26 March, 2019.
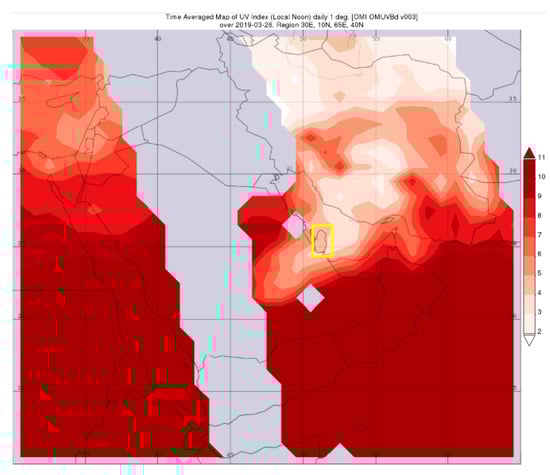
Figure 13.
OMI Aura UVI plots for the Arabian Peninsula on the 26 March, 2019 generated using NASA’s GIOVANNI platform. Qatar is highlighted in a yellow box.
4. Conclusions
The Arabian Peninsula, due to its geographical location in the global sun belt, constantly receives very high ultraviolet radiation and thus, its population has a high risk of succumbing to the negative aspects of over exposure to UV radiation. So far, the available satellite-derived UV Index data are not representative of the region as they do not accurately model the effect of UV absorbing aerosols such as the mineral dust. Severe dust storms occur with a frequency of 10–20 per year in the Middle East while typical “dusty conditions” are even more frequent locally [21,47]. In this study, for the first time, a method for UVI forecasting has been developed for the dust-rich conditions of the Middle East that makes use of a three-dimensional regional meteorology-chemistry model combined with surface solar radiation measurements from monitoring stations in Doha, Qatar and NASA’s OMI Aura satellite-retrieved data. The UVI model is built by first calibrating historical NASA OMI Aura satellite-derived UVI over Doha with ground-based measurements of UVA and UVB on clear sky days from 2013 to 2018. The model was validated by using forecasts of shortwave radiation (GHI—Global Horizontal Irradiance) from a three-dimensional (3D) air quality model that combines a well-established numerical weather prediction model with a state-of-the-art pollution (dust, ozone) dispersion model for Qatar, to forecast UVI and comparing them with actual clear-sky NASA OMI Aura satellite-obtained UV Indices from 1 January to 31 August 2019, resulting in high correlation factors of 0.9. In addition, the model is also validated for forecasting UVI for dusty days in Qatar and for days where NASA OMI Aura satellite UVI was not available.
Author Contributions
Conceptualization, C.F. and D.R.R.; methodology, D.R.R. and C.F.; software, D.R.R.; validation, D.R.R., M.K., R.I., and C.F.; formal analysis, D.R.R.; investigation, D.R.R.; resources, A.A., L.M.-P., D.R.R., M.K., R.I., and C.F.; data curation, D.R.R. and C.F.; writing—original draft preparation, D.R.R.; writing—review and editing, M.K., A.A., L.M.-P., R.I., and C.F.; visualization, D.R.R.; supervision, M.K., R.I. and C.F.; project administration, M.K. and C.F. All authors have read and agree to the published version of the manuscript.
Funding
This research received no external funding.
Acknowledgments
We would like to thank H. Harshvardhan and N. Krotkov for assistance with the online availability of the OMI UVB timeseries for Doha. We very much acknowledge the logistic support of Hamad Bin Khalifa University and Qatar Foundation for making this study possible. The publication of this article was funded by the Qatar National Library.
Conflicts of Interest
The authors declare no conflict of interest.
References
- Norval, M.; Cullen, A.P.; De Gruijl, F.R.; Longstreth, J.; Takizawa, Y.; Lucas, R.M.; Noonan, F.P.; Van Der Leun, J.C. The Effects on Human Health from Stratospheric Ozone Depletion and Its Interactions with Climate Change. Photochem. Photobiol. Sci. 2007, 6, 232–251. [Google Scholar] [CrossRef]
- Juzeniene, A.; Moan, J. Beneficial Effects of UV Radiation Other than via Vitamin D Production. Derm.-Endocrinol. 2012, 4, 109–117. [Google Scholar] [CrossRef]
- Diffey, B.L. Ultraviolet Radiation Physics and the Skin. Phys. Med. Biol. 1980, 25, 405–426. [Google Scholar] [CrossRef]
- Zegarska, B.; Pietkun, K.; Zegarski, W.; Bolibok, P.; Wisniewski, M.; Roszek, K.; Czarnecka, J.; Nowacki, M. Air Pollution, UV Irradiation and Skin Carcinogenesis: What We Know, Where We Stand and What Is Likely to Happen in the Future? Adv. Dermatol. Allergol. 2017, 34, 6–14. [Google Scholar] [CrossRef]
- Young, A.R. Acute Effects of UVR on Human Eyes and Skin. Prog. Biophys. Mol. Biol. 2006, 92, 80–85. [Google Scholar] [CrossRef] [PubMed]
- Lucas, R.M.; Yazar, S.; Young, A.R.; Norval, M.; de Gruijl, F.R.; Takizawa, Y.; Rhodes, L.E.; Sinclair, C.A.; Neale, R.E. Human health in relation to exposure to solar ultraviolet radiation under changing stratospheric ozone and climate. Photochem. Photobiol. Sci. 2019, 18, 641–680. [Google Scholar] [CrossRef] [PubMed]
- Fountoukis, C.; Martín-Pomares, L.; Perez-Astudillo, D.; Bachour, D.; Gladich, I. Simulating Global Horizontal Irradiance in the Arabian Peninsula: Sensitivity to Explicit Treatment of Aerosols. Sol. Energy 2018, 163, 347–355. [Google Scholar] [CrossRef]
- Lindfors, A.V.; Kujanpää, J.; Kalakoski, N.; Heikkilä, A.; Lakkala, K.; Mielonen, T.; Sneep, M.; Krotkov, N.A.; Arola, A.; Tamminen, J. The TROPOMI Surface UV Algorithm. Atmos. Meas. Tech. 2018, 11, 997–1008. [Google Scholar] [CrossRef]
- Arola, A.; Kazadzis, S.; Lindfors, A.; Krotkov, N.; Kujanpää, J.; Tamminen, J.; Bais, A.; Di Sarra, A.; Villaplana, J.M.; Brogniez, C.; et al. A New Approach to Correct for Absorbing Aerosols in OMI UV. Geophys. Res. Lett. 2009, 36, 1–5. [Google Scholar] [CrossRef]
- Weatherhead, B.; Tanskanen, A.; Stevermer, A.; Andersen, S.B.; Arola, A.; Austin, J.; Bernhard, G.; Browman, H.; Fioletov, V.; Herman, J.; et al. Chapter 5: Ozone and Ultraviolet Radiation. In Arctic Climate Impact Assessment Report; Cambridge University Press: Cambridge, UK, 2005. [Google Scholar]
- Lenoble, J. Modeling of the Influence of Snow Reflectance on Ultraviolet Irradiance for Cloudless Sky. Appl. Opt. 1998, 37, 2441–2447. [Google Scholar] [CrossRef] [PubMed]
- Kylling, A.; Bais, A.F.; Blumthaler, M.; Schreder, J.; Zerefos, C.S.; Kosmidis, E. Effect of Aerosols on Solar UV Irradiances during the Photochemical Activity and Solar Ultraviolet Radiation Campaign. J. Geophys. Res. Atmos. 1998, 103, 26051–26060. [Google Scholar] [CrossRef]
- Kazadzis, S.; Bais, A.; Balis, D.; Kouremeti, N.; Zempila, M.; Arola, A.; Giannakaki, E.; Amiridis, V.; Kazantzidis, A. Spatial and Temporal UV Irradiance and Aerosol Variability within the Area of an OMI Satellite Pixel. Atmos. Chem. Phys. 2009, 9, 4593–4601. [Google Scholar] [CrossRef]
- Damiani, A.; Cabrera, S.; Muñoz, R.C.; Cordero, R.R.; Labbe, F. Satellite-Derived UV Irradiance for a Region with Complex Morphology and Meteorology: Comparison against Ground Measurements in Santiago de Chile. Int. J. Remote Sens. 2013, 34, 5812–5833. [Google Scholar] [CrossRef]
- Cabrera, S.; Ipiña, A.; Damiani, A.; Cordero, R.R.; Piacentini, R.D. UV Index Values and Trends in Santiago, Chile (33.5 °S) Based on Ground and Satellite Data. J. Photochem. Photobiol. B Biol. 2012, 115, 73–84. [Google Scholar] [CrossRef] [PubMed]
- Cordero, R.R.; Seckmeyer, G.; Damiani, A.; Jorquera, J.; Carrasco, J.; Muñoz, R.; Da Silva, L.; Labbe, F.; Laroze, D. Aerosol Effects on the UV Irradiance in Santiago de Chile. Atmos. Res. 2014, 149, 282–291. [Google Scholar] [CrossRef]
- Deng, X.J.; Zhou, X.J.; Tie, X.X.; Wu, D.; Li, F.; Tan, H.B.; Deng, T. Attenuation of Ultraviolet Radiation Reaching the Surface Due to Atmospheric Aerosols in Guangzhou. Chin. Sci. Bull. Atmos. Sci. 2012, 57, 2759–2766. [Google Scholar] [CrossRef]
- Tereszchuk, K.A.; Rochon, Y.J.; McLinden, C.A.; Vaillancourt, P.A. Optimizing UV Index Determination from Broadband Irradiances. Geosci. Model Dev. 2018, 11, 1093–1113. [Google Scholar] [CrossRef]
- Badarinath, K.V.S.; Kharol, S.K.; Kaskaoutis, D.G.; Kambezidis, H.D. Influence of Atmospheric Aerosols on Solar Spectral Irradiance in an Urban Area. J. Atmos. Sol.-Terr. Phys. 2007, 69, 589–599. [Google Scholar] [CrossRef]
- Staiger, H.; Meteorological, G.; Dwd, S. Scientific Challenges of UV-B Forecasting. In Proceedings of the Seminar on Global Earth-System Monitoring, Reading, UK, 5–9 September 2005. [Google Scholar]
- Roshan, D.R.; Koc, M.; Isaifan, R.; Shahid, M.Z.; Fountoukis, C. Aerosol Optical Thickness over Large Urban Environments of the Arabian Peninsula-Speciation, Variability, and Distributions. Atmosphere 2019, 10, 228. [Google Scholar] [CrossRef]
- Fountoukis, C.; Ackermann, L.; Ayoub, M.A.; Gladich, I.; Hoehn, R.D.; Skillern, A. Impact of Atmospheric Dust Emission Schemes on Dust Production and Concentration over the Arabian Peninsula. Model. Earth Syst. Environ. 2016, 2, 1–6. [Google Scholar] [CrossRef]
- Planning and Statistics Authority. Monthly Figures on Total Population. Available online: https://www.psa.gov.qa/en/statistics1/StatisticsSite/Pages/Population.aspx (accessed on 6 November 2019).
- Rao, P.G.; Al-Sulaiti, M.; Al-Mulla, A.H. Winter Shamals in Qatar, Arabian Gulf. Weather 2001, 56, 444–451. [Google Scholar] [CrossRef]
- Al-Mostafa, Z.A.; Elminir, H.K.; Abulwfa, A.; Al-Shehri, S.M.; Alshehri, F.A.; Al-Rougy, I.M.; Bazyad, A.A. Evaluation of Erythemal Ultraviolet Solar Radiation over Saudi Arabia. Sol. Energy 2015, 113, 258–271. [Google Scholar] [CrossRef]
- Weather and Climate. Average Monthly Hours of Sunshine in Doha. Available online: https://weather-and-climate.com/average-monthly-hours-Sunshine,doha,Qatar (accessed on 6 November 2019).
- Aïssa, B.; Isaifan, R.J.; Madhavan, V.E.; Abdallah, A.A. Structural and Physical Properties of the Dust Particles in Qatar and Their Influence on the PV Panel Performance. Sci. Rep. 2016, 6, 1–12. [Google Scholar] [CrossRef] [PubMed]
- Perez-Astudillo, D.; Bachour, D. DNI, GHI and DHI Ground Measurements in Doha, Qatar. Energy Procedia 2014, 49, 2398–2404. [Google Scholar] [CrossRef]
- Levelt, P.F.; Joiner, J.; Tamminen, J.; Veefkind, J.P.; Bhartia, P.K.; Zweers, D.C.S.; Duncan, B.N.; Streets, D.G.; Eskes, H.; Van Der, R.A.; et al. The Ozone Monitoring Instrument: Overview of 14 Years in Space. Atmos. Chem. Phys. 2018, 18, 5699–5745. [Google Scholar] [CrossRef]
- Schoeberl, M.R.; Douglass, A.R.; Hilsenrath, E.; Bhartia, P.K.; Beer, R.; Waters, J.W.; Gunson, M.R.; Froidevaux, L.; Gille, J.C.; Barnett, J.J.; et al. Overview of the EOS Aura Mission. IEEE Trans. Geosci. Remote Sens. 2006, 44, 1066–1072. [Google Scholar] [CrossRef]
- Sharma, N.P.; Bhattarai, B.K.; Sapkota, B.; Kjeldstad, B. Comparison of Ground Based Measurements of Solar UV Index with Satellite Estimation at Four Sites of Nepal. J. Inst. Eng. 2012, 8, 58–71. [Google Scholar] [CrossRef]
- Pitkänen, M.R.A.; Arola, A.; Lakkala, K.; Koskela, T.; Lindfors, A.V. Comparing OMI UV Index to Ground-Based Measurements at Two Finnish Sites with Focus on Cloud-Free and Overcast Conditions. Atmos. Meas. Tech. Discuss. 2015, 8, 487–516. [Google Scholar] [CrossRef]
- Qin, W.; Fasnacht, Z.; Haffner, D.; Vasilkov, A.; Joiner, J.; Krotkov, N.; Fisher, B.; Spurr, R. A Geometry-Dependent Surface Lambertian-Equivalent Reflectivity Product for UV/Vis Retrievals—Part 1. Evaluation over Land Surfaces Using Measurements from OMI at 466 Nm. Atmos. Meas. Tech. 2019, 12, 3997–4017. [Google Scholar] [CrossRef]
- Antón, M.; Valenzuela, A.; Romn, R.; Lyamani, H.; Krotkov, N.; Arola, A.; Olmo, F.J.; Alados-Arboledas, L. Influence of Desert Dust Intrusions on Ground-Based and Satellite-Derived Ultraviolet Irradiance in Southeastern Spain. J. Geophys. Res. 2012, 117, 1–8. [Google Scholar] [CrossRef]
- Herman, J.; Deland, M.T.; Huang, L.K.; Labow, G.; Larko, D.; Lloyd, S.A.; Mao, J.; Qin, W.; Weaver, C. A Net Decrease in the Earth’s Cloud, Aerosol, and Surface 340 Nm Reflectivity during the Past 33 Yr (1979–2011). Atmos. Chem. Phys. 2013, 13, 8505–8524. [Google Scholar] [CrossRef]
- O’Byrne, G.; Martin, R.V.; Van Donkelaar, A.; Joiner, J.; Celarier, E.A. Surface Reflectivity from the Ozone Monitoring Instrument Using the Moderate Resolution Imaging Spectroradiometer to Eliminate Clouds: Effects of Snow on Ultraviolet and Visible Trace Gas Retrievals. J. Geophys. Res. 2010, 115, 1–13. [Google Scholar] [CrossRef]
- Cadet, J.M.; Bencherif, H.; Portafaix, T.; Lamy, K.; Ncongwane, K.; Coetzee, G.J.R.; Wright, C.Y. Comparison of Ground-Based and Satellite-Derived Solar UV Index Levels at Six South African Sites. Int. J. Environ. Res. Public Health 2017, 14, 1384. [Google Scholar] [CrossRef] [PubMed]
- Ginoux, P.; Chin, M.; Tegen, I.; Prospero, J.M.; Holben, B.; Dubovik, O.; Lin, S.-J. Sources and Distributions of the Dust Aerosols Simulated with the GOCART Model. J. Geophys. Res. 2001, 106, 20255–20273. [Google Scholar] [CrossRef]
- Geiger, H.; Barnes, I.; Bejan, I.; Benter, T.; Spittler, M. The Tropospheric Degradation of Isoprene: An Updated Module for the Regional Atmospheric Chemistry Mechanism. Atmos. Environ. 2003, 37, 1503–1519. [Google Scholar] [CrossRef]
- Marticorena, B.; Bergametti, G. Modeling the Atmospheric Dust Cycle: 1. Design of a Soil-Derived Dust Emission Scheme. J. Geophys. Res. 1995, 100, 16415–16430. [Google Scholar] [CrossRef]
- Kok, J.F. A Scaling Theory for the Size Distribution of Emitted Dust Aerosols Suggests Climate Models Underestimate the Size of the Global Dust Cycle. Proc. Natl. Acad. Sci. USA 2011, 108, 1016–1021. [Google Scholar] [CrossRef]
- World Meteorological Organization. Report on the WMO-WHO Meeting of Expert on Standardization of UV Indices and Their Dissemination to the Public; WMO: Les Diablerets, Switzerland, 1998; Volume 127. [Google Scholar]
- World Health Organization. World Meteorological Organization, United Nations Environment Programme & International Commission on Non-Ionizing Radiation Protection. In Global Solar UV Index: A Practical Guide; World Health Organization: Geneva, Switzerland, 2002. [Google Scholar]
- Pashiardis, S.; Kalogirou, S.; Pelengaris, A. Statistical Analysis and Inter- Comparison of Solar UV and Global Radiation for Athalassa and Larnaca, Cyprus. SM J. Biom. Biostat. 2017, 2, 1020. [Google Scholar]
- Barbero, F.J.; López, G.; Batlles, F.J. Determination of Daily Solar Ultraviolet Radiation Using Statistical Models and Artificial Neural Networks. Ann. Geophys. 2006, 24, 2105–2114. [Google Scholar] [CrossRef]
- Hovila, J.; Arola, A.; Tamminen, J. OMUVB: OMI/Aura Surface UV Irradiance 1-orbit L2 Swath 13x24 km V003. Available online: https://disc.gsfc.nasa.gov/datasets/OMUVB_V003/summary (accessed on 3 September 2019). [CrossRef]
- Tsiouri, V.; Kakosimos, K.E. Concentrations, Sources and Exposure Risks Associated with Particulate Matter in the Middle East Area—A Review. Air Qual. Atmos. Health 2015, 8, 67–80. [Google Scholar] [CrossRef]
- Prakash, P.J.; Stenchikov, G.; Kalenderski, S.; Osipov, S.; Bangalath, H. The Impact of Dust Storms on the Arabian Peninsula and the Red Sea. Atmos. Chem. Phys. 2015, 15, 199–222. [Google Scholar] [CrossRef]
- Kalenderski, S.; Stenchikov, G.; Zhou, C. Modeling a Typical Winter-Time Dust Event over the Arabian Peninsula and the Red Sea. Atmos. Chem. Phys. 2013, 13, 1999–2014. [Google Scholar] [CrossRef]
- Patlakas, P.; Stathopoulos, C.; Flocas, H.; Kalogeri, C.; Kallos, G. Regional Climatic Features of the Arabian Peninsula. Atmosphere 2019, 10, 220. [Google Scholar] [CrossRef]
- Podrascanin, Z.; Atlagic, M.; Mijatovic, Z.; Sremac, A.F. Uv Index Forecasting in Vojvodina Region. RAD Conf. Proc. 2018, 3, 187–190. [Google Scholar] [CrossRef]
- GIOVANNI, NASA. Available online: https://giovanni.gsfc.nasa.gov/giovanni (accessed on 21 May 2019).
© 2020 by the authors. Licensee MDPI, Basel, Switzerland. This article is an open access article distributed under the terms and conditions of the Creative Commons Attribution (CC BY) license (http://creativecommons.org/licenses/by/4.0/).