An Extensive Collection of Evaluation Indicators to Assess Occupants’ Health and Comfort in Indoor Environment


Abstract
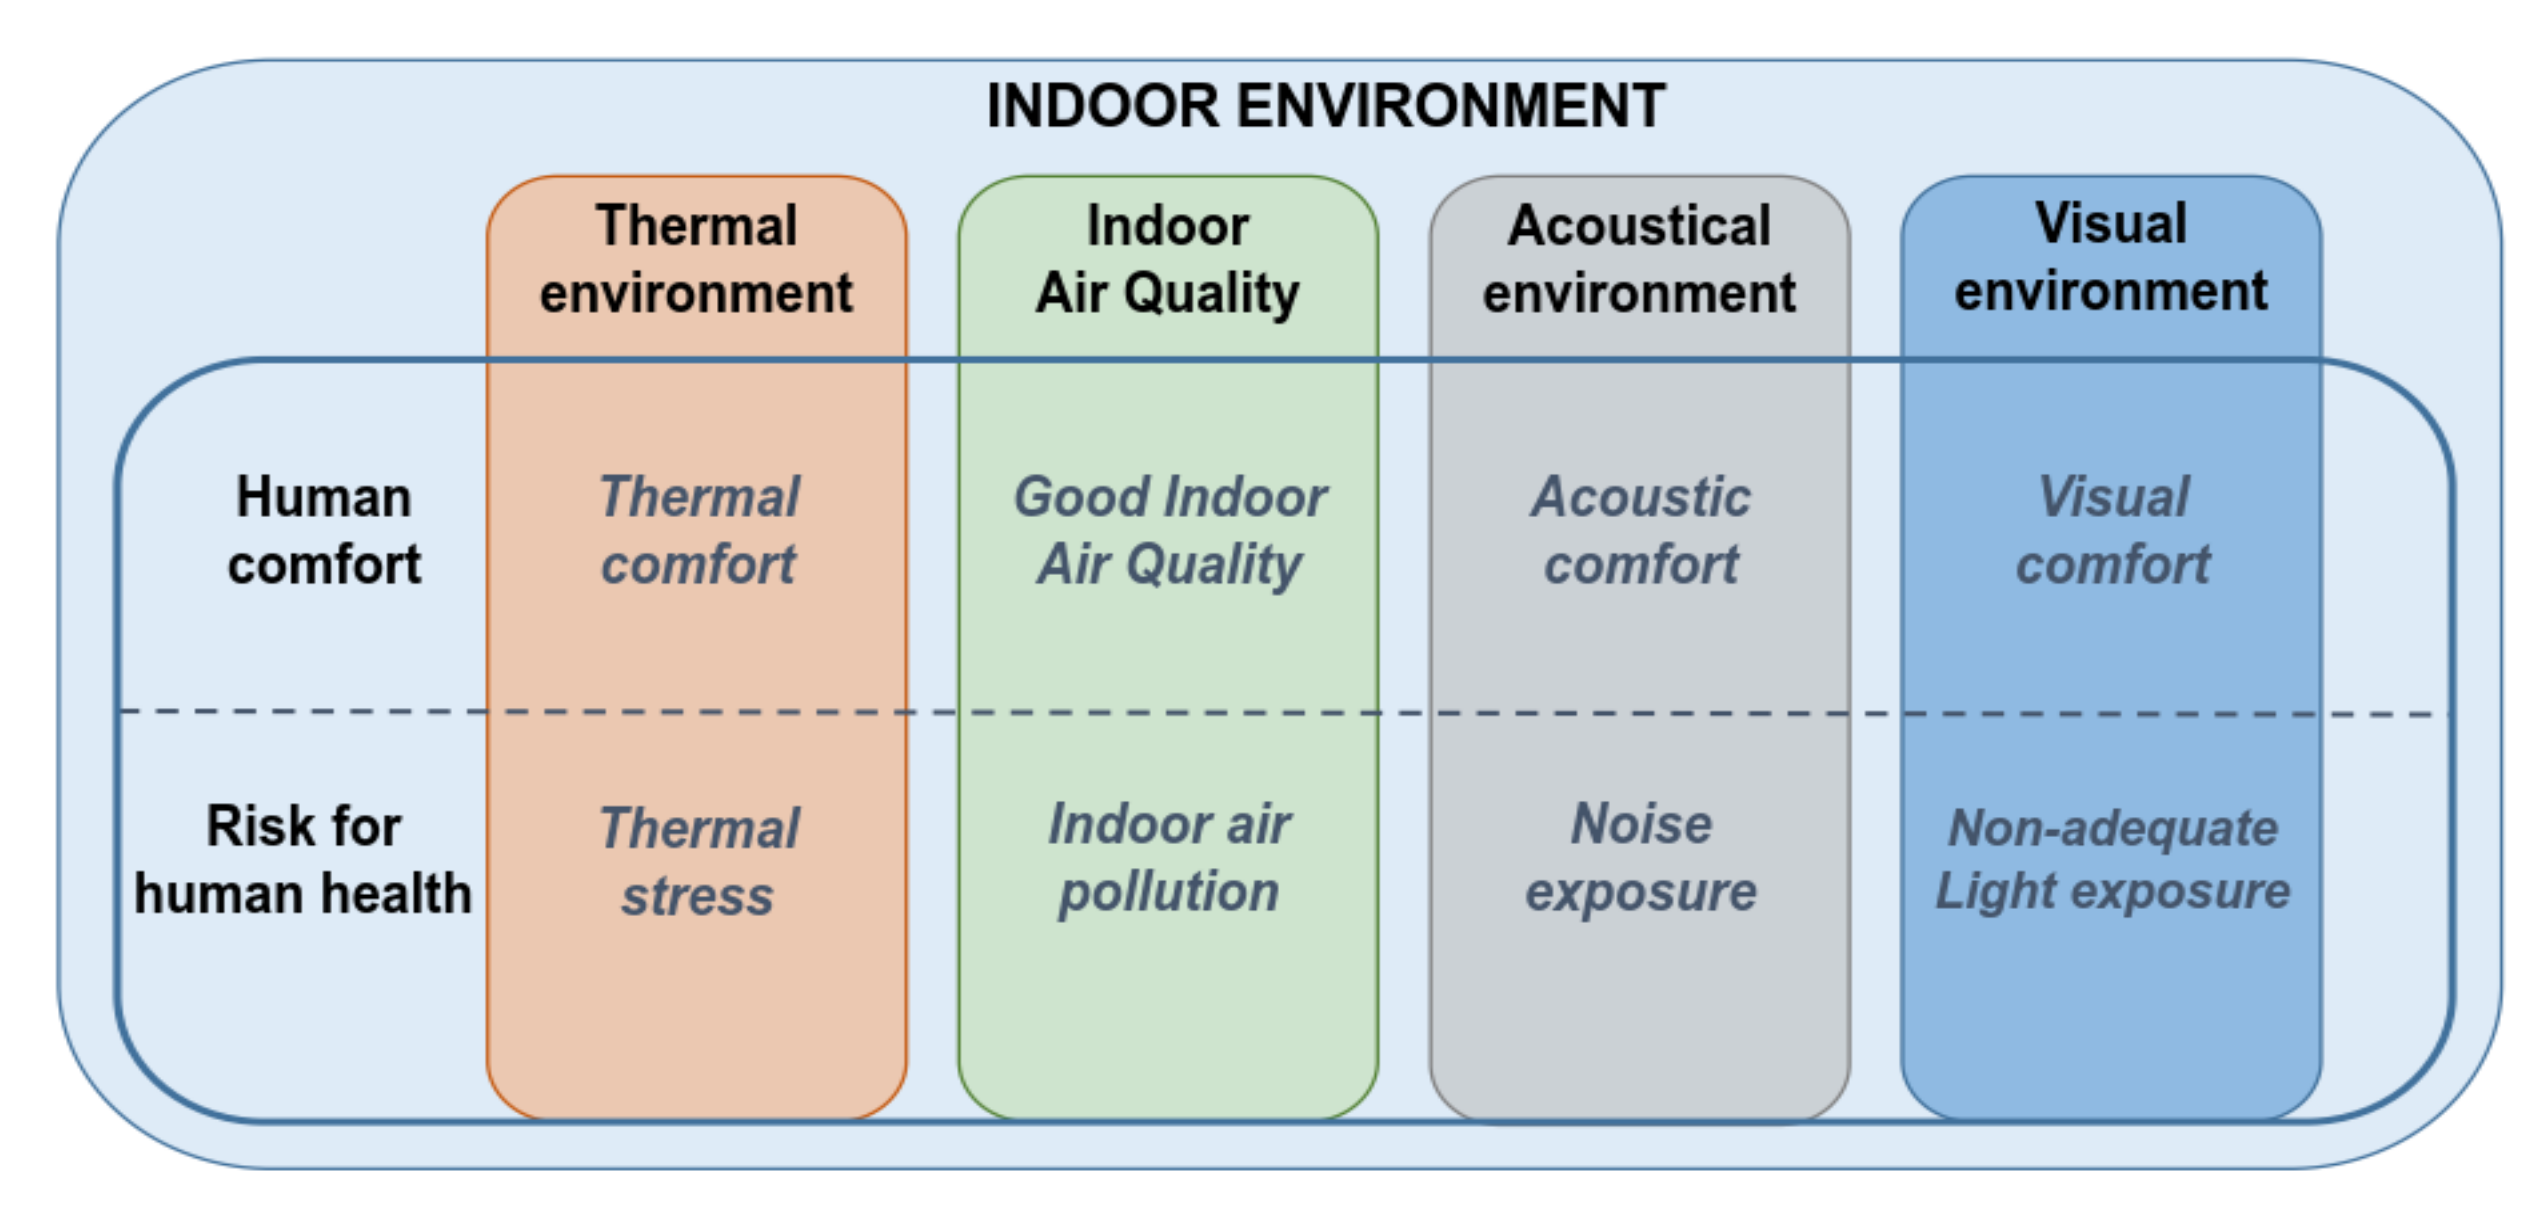
1. Introduction
2. Literature Search
3. Health and Comfort Evaluation
4. Thermal Environment
4.1. Thermal Stress
4.1.1. Overview
4.1.2. Guidelines and Legislative Outline
4.1.3. Indicators
4.2. Thermal Comfort
4.2.1. Overview
4.2.2. Indicators
4.2.3. Current Research Trends
5. Indoor Air Quality
5.1. Indoor Air Pollution
5.1.1. Overview
5.1.2. Guidelines and Legislative Outline
5.1.3. Air Pollutants
5.2. Good Indoor Air Quality
5.2.1. Overview
5.2.2. Indicators
5.2.3. Current Research Trends
6. Acoustical Environment
6.1. Noise Exposure
6.1.1. Overview
6.1.2. Guidelines and Legislative Outline
6.1.3. Indicators
6.2. Acoustic Comfort
6.2.1. Overview
6.2.2. Indicators
6.2.3. Current Research Trends
7. Visual Environment
7.1. Non-Adequate Light Exposure
7.1.1. Overview
7.1.2. Guidelines and Legislative Outline
7.1.3. Indicators
7.2. Visual Comfort
7.2.1. Overview
7.2.2. Indicators
7.2.3. Current Research Trends
8. Conclusive Remarks
Author Contributions
Funding
Conflicts of Interest
References
- American Society of Heating, Refrigerating and Air-Conditioning Engineering (ASHRAE). Guideline 10P, Interactions Affecting the Achievement of Acceptable Indoor Environments; ASHRAE: Atlanta, GA, USA, 2016. [Google Scholar]
- Pinto, S.; Fumincelli, L.; Mazzo, A.; Caldeira, S.; Martins, J.C. Comfort, well-being and quality of life: Discussion of the differences and similarities among the concepts. Porto Biomed. J. 2017, 2, 6–12. [Google Scholar] [CrossRef]
- Directive (EU). 2018/844 of the European Parliament and of the Council of 30 May 2018 amending Directive 2010/31/EU on the Energy Performance of Buildings and Directive 2012/27/EU on Energy Efficiency; EU: Brussels, Belgium, 2018. [Google Scholar]
- Directive 2012/27/EU of the European Parliament and of the Council of 25 October 2012 on Energy Efficiency, Amending Directives 2009/125/EC and 2010/30/EU and Repealing Directives 2004/8/EC and 2006/32/EC. Available online: https://eur-lex.europa.eu/legal-content/EN/TXT/?uri=celex%3A32012L0027 (accessed on 7 January 2020).
- Directive 2010/31/EU of the European Parliament and of the Council of 19 May 2010 on The Energy Performance of Buildings. Available online: https://eur-lex.europa.eu/legal-content/EN/TXT/?uri=CELEX%3A32010L0031 (accessed on 7 January 2020).
- Directive 2002/91/EC of the European Parliament and of the Council of 16 December 2002 on the energy performance of buildings. Available online: https://eur-lex.europa.eu/legal-content/EN/TXT/?uri=LEGISSUM%3Al27042 (accessed on 7 January 2020).
- Bluyssen, P.M. Towards new methods and ways to create healthy and comfortable buildings. Build. Environ. 2010, 45, 808–818. [Google Scholar] [CrossRef]
- World Health Organization (WHO). Definition of Health. Available online: http://www.who.int/about/definition/en/print.html (accessed on 12 March 2019).
- Commission of the European Communities. White Paper—Together for Health. A Strategic Approach for the EU 2008–2013; Commission of the European Communities: Brussels, Belgium, 2007; Available online: https://ec.europa.eu/health/ph_overview/Documents/strategy_wp_en.pdf (accessed on 6 June 2019).
- Tang, H.; Ding, Y.; Singer, B. Interactions and comprehensive effect of indoor environmental quality factors on occupant satisfaction. Build. Environ. 2020, 167, 106462. [Google Scholar] [CrossRef]
- Shan, A.; Nissa Melina, A.; Yang, E.H. Impact of indoor environmental quality on students’ wellbeing and performance in educational building through life cycle costing perspective. J. Clean. Prod. 2018, 204, 298–309. [Google Scholar] [CrossRef]
- Lee, E. Indoor environmental quality (IEQ) of LEED-certified home: Importance-performance analysis (IPA). Build. Environ. 2019, 149, 571–581. [Google Scholar] [CrossRef]
- Geng, Y.; Lin, B.; Yu, J.; Zhou, H.; Ji, W.; Chen, H.; Zhang, Z.; Zhu, Y. Indoor environmental quality of green office buildings in China: Large-scale and long-term measurement. Build. Environ. 2019, 150, 266–280. [Google Scholar] [CrossRef]
- Anand, P.; Cheong, D.; Sekhar, C.; Santamouris, M.; Kondepudi, S. Energy saving estimation for plug and lighting load using occupancy analysis. Renew. Energy 2019, 143, 1143–1161. [Google Scholar] [CrossRef]
- European Committee for Standardization. EN 15251: Indoor Environmental Input Parameters for Design and Assessment of Energy Performance of Buildings Addressing Indoor Air Quality, Thermal Environment, Lighting and Acoustics; European Committee for Standardization: Brussels, Belgium, 2007. [Google Scholar]
- European Committee for Standardization. Part 1: Indoor Environmental Input Parameters for Design and Assessment of Energy Performance of Buildings Addressing Indoor Air Quality, Thermal Environment Lighting and Acoustics. Module M1-6. In EN 16798-1 Energy Performance of Buildings. Ventilation for Buildings; European Committee for Standardization: Brussels, Belgium, 2019. [Google Scholar]
- European Committee for Standardization. PD CEN/TR 16798-2 Energy Performance of Buildings. In Ventilation for Buildings; Part 2: Interpretation of the Requirements in EN 16798-1. Indoor Environmental Input Parameters for Design and Assessment of Energy Performance of Buildings Addressing Indoor Air Quality, Thermal Environment, Lighting and Acoustics. Module M1-6; European Committee for Standardization: Brussels, Belgium, 2019. [Google Scholar]
- Anand, P.; Deb, C.; Alur, R. A simplified tool for building layout design based on thermal comfort simulations. Front. Archit. Res. 2017, 6, 218–230. [Google Scholar] [CrossRef]
- Redlich, C.A.; Sparer, J.; Cullen, M.R. Sick-building syndrome. Lancet 1997, 349, 1013–1016. [Google Scholar] [CrossRef]
- Burge, P.S. Sick Building Syndrome. Occup. Environ. Med. 2004, 61, 185–190. [Google Scholar] [CrossRef]
- Ghaffarianhoseini, A.; AlWaer, H.; Omrany, H.; Ghaffarianhoseini, A.; Alalouch, C.; Clements-Croome, D.; Tookey, J. Sick building syndrome: Are we doing enough? Archit. Sci. Rev. 2018, 61, 99–121. [Google Scholar] [CrossRef]
- World Health Organization (WHO). Indoor Air Pollutants: Exposure and Health Effects; EURO Reports and Studies 78: 1–42.; WHO: Geneva, Switzerland, 1983. [Google Scholar]
- Kamaruzzaman, S.; Sabrani, N.A. The Effect of Indoor Air Quality (IAQ) Towards Occupants’ Psychological Performance in Office Buildings. J. Rekabentuk Dan Binaan 2011, 4, 49–61. [Google Scholar]
- Runeson-Broberg, R.; Norbäck, D. Sick Building Syndrome (SBS) and Sick House Syndrome (SHS) in Relation to Psychosocial Stress at Work in the Swedish Workforce. Int. Arch. Occup. Environ. Health 2013, 86, 915–922. [Google Scholar] [CrossRef] [PubMed]
- De Freitas, C.R.; Grigorieva, E.A. A comprehensive catalogue and classification of human thermal climate indices. Int. J. Biometeorol. 2015, 59, 109–120. [Google Scholar] [CrossRef]
- D’Ambrosio Alfano, F.R.; Palella, B.I.; Riccio, G. Thermal Environment Assessment Reliability Using Temperature-Humidity Indices. Ind. Health 2011, 49, 95–106. [Google Scholar] [CrossRef]
- Carlucci, S.; Pagliano, L. A review of indices for the long-term evaluation of the general thermal comfort conditions in buildings. Energy Build. 2012, 53, 194–205. [Google Scholar] [CrossRef]
- Beshir, M.Y.; Ramsey, J.D. Heat stress indices: A review paper. Int. J. Ind. Ergon. 1988, 3, 89–102. [Google Scholar] [CrossRef]
- Djongyang, N.; Tchinda, R.; Njomo, D. Thermal comfort: A review paper. Renew. Sustain. Energy Rev. 2010, 14, 2626–2640. [Google Scholar] [CrossRef]
- Carlucci, S.; Causone, F.; De Rosa, F.; Pagliano, L. A review of indices for assessing visual comfort with a view to their use in optimization processes to support building integrated design. Renew. Sustain. Energy Rev. 2015, 47, 1016–1033. [Google Scholar] [CrossRef]
- Sundell, J. On the history of indoor air quality and health. Indoor Air 2004, 14, 51–58. [Google Scholar] [CrossRef]
- European Agency of Safety and Health at Work (EU-OSHA). Well-Being at Work: Creating a Positive Work Environment; EU-OSHA: Luxembourg, 2013. [Google Scholar]
- Institution of Occupational Safety and Health (IOSH). Working Well. Guidance on Promoting Health and Wellbeing at Work; IOSH: Leicestershire, UK, 2018. [Google Scholar]
- Public Health Agency (HSC). Health and Wellbeing at Work: A Resource Guide; HSC: Belfast, Northern Ireland, 2017. [Google Scholar]
- Anand, P.; Sekhar, C.; Cheong, D.; Santamouris, M.; Kondepudi, S. Occupancy-based zone-level VAV system control implications on thermal comfort, ventilation, indoor air quality and building energy efficiency. Energy Build. 2019, 204, 109473. [Google Scholar] [CrossRef]
- American Society of Heating, Refrigerating and Air-Conditioning Engineering (ASHRAE). “TC 1.6 Terminology”, Atlanta, USA. Available online: http://tc0106.ashraetcs.org/ (accessed on 21 January 2019).
- Fisk, W.J. Health and productivity gains from better indoor environments and their relationship with building energy efficiency. Annu. Rev. Energy Environ. 2000, 25, 537–566. [Google Scholar] [CrossRef]
- Andersson, J.; Boerstra, A.; Clements-Croome, D.; Fitzner, K.; Hanssen, S.O. Indoor Climates and Productivity in Offices; Wargocki, P., Seppänen, O., Eds.; REHVA: Ixelles, Belgium, 2006; Volume 6. [Google Scholar]
- Seppanen, O.A. Association of ventilation rates and CO2 concentrations with health and other responses in commercial and institutional buildings. Indoor Air 1999, 9, 226–252. [Google Scholar] [CrossRef]
- De Giuli, V.; Da Pos, O.; De Carli, M. Indoor environmental quality and pupil perception in Italian primary schools. Build. Environ. 2012, 56, 335–345. [Google Scholar] [CrossRef]
- Parsons, K.C. Human Thermal Environments: The Effects of Hot, Moderate, and Cold Environments on Human Health, Comfort and Performance, 3rd ed.; Taylor and Francis: London, UK, 2014. [Google Scholar]
- Epstein, Y.; Moras, D.S. Thermal Comfort and the Heat Stress Indices. Ind. Health 2006, 44, 388–398. [Google Scholar] [CrossRef] [PubMed]
- Morgado, M.; Talaia, M.; Teixeira, L. A new simplified model for evaluating thermal environment and thermal sensation: An approach to avoid occupational disorders. Int. J. Ind. Ergon. 2017, 60, 3–13. [Google Scholar] [CrossRef]
- European Agency for Occupational Health and Safety at Work (EU-OSHA)—OSHwiki. Available online: http:\\oshwiki.eu (accessed on 12 March 2019).
- Council Directive 89/391/EEC of 12 June 1989 on the Introduction of Measures to Encourage Improvements in the Safety and Health of Workers at Work. Available online: https://eur-lex.europa.eu/legal-content/EN/TXT/?uri=CELEX:52006PC0390 (accessed on 7 January 2020).
- Workplace Safety & Health Division of the Manitoba Government. Guideline for Thermal Stress; Workplace Safety & Health Division of the Manitoba Government: Winnipeg, MB, Canada, 2007. Available online: https://www.gov.mb.ca/labour/safety/ (accessed on 21 January 2019).
- Italian Legislative Decree, No. 81/2008 “Code on Health and Safety Protection of Employees in the workplace”, implementation of Article 1 of Law 3 August 2007, No 123 on Health and Safety in the workplaces. Available online: https://www.ispettorato.gov.it/it-it/Documenti-Norme/Documents/Testo-Unico-Dlgs-81-08-edizione-di-luglio-2018.pdf (accessed on 7 January 2020).
- Malchaire, J.B.; Gebhardt, H.J.; Piette, A. Strategy for evaluation and prevention of risk due to work in thermal environment. Ann. Occup. Hyg. 1999, 43, 367–376. [Google Scholar] [CrossRef]
- Malchaire, J.B. Occupational heat stress assessment by the Predicted Heat Strain model. Ind. Health 2006, 44, 380–387. [Google Scholar] [CrossRef]
- Palella, B.I.; Quaranta, F.; Riccio, G. On the management and prevention of heat stress for crews on board ships. Ocean Eng. 2016, 112, 277–286. [Google Scholar] [CrossRef]
- Taleghani, M.; Tenpierik, M.; Kurvers, S.; van den Dobbelsteen, A. A review into thermal comfort in buildings. Renew. Sustain. Energy Rev. 2013, 26, 201–215. [Google Scholar] [CrossRef]
- Yaglou, C.P.; Minard, D. Control of heat casualties at military training centers. Am. Med. Assoc. Arch. Ind. Health 1957, 16, 302–316. [Google Scholar]
- Siple, P.A.; Passel, C.F. Measurement of dry atmospheric cooling in subfreezing temperatures. Proc. Am. Phil. Soc. 1945, 89, 177–199. [Google Scholar] [CrossRef]
- Holmer, I. Required Clothing Insulation (IREQ) as an Analytical Index of the Cold Stress. Ashrae Trans. 1984, 90, 1116–1128. [Google Scholar]
- De Freitas, C.R.; Symon, L.V. A bioclimatic index of human survival times in the Antarctic. Polar Rec. 1987, 23, 651–659. [Google Scholar] [CrossRef]
- Shitzer, A. Wind-chill-equivalent temperatures: Regarding the impact due to the variability of the environmental convective heat transfer coefficient. Int. J. Biometeorol. 2006, 50, 224–232. [Google Scholar] [CrossRef]
- International Organization for Standardization. ISO 11079. Ergonomics of the Thermal Environment—Determination and Interpretation of Cold Stress When Using Required Clothing Insulation (IREQ) and Local Cooling Effects; International Organization for Standardization: Geneve, Switzerland, 2007. [Google Scholar]
- Robinson, S.; Turrell, E.S.; Gerking, S.D. Physiologically equivalent conditions of air temperature and humidity. Am. J. Physiol. 1945, 143, 21–32. [Google Scholar] [CrossRef]
- McArdle, B.; Dunham, W.; Holling, H.E.; Ladel, W.S.S.; Scott, J.W.; Thomson, M.L.; Weiner, J.S. The Prediction of the Physiological Effects of Warm and Hot Environments. Available online: https://www.scienceopen.com/document?vid=f0cf60ca-b22b-4615-be54-548ad606fd56 (accessed on 7 January 2020).
- Belding, H.S.; Hatch, T.F. Index for evaluating heat stress in terms of resulting physiological strain. Heat. Pip. Air Condit. 1955, 27, 129–136. [Google Scholar]
- Lee, D.H.K. Proprioclimates of Man and Domestic Animals. Climatology, Arid Zone Research—X, UNESCO. 1958, p. 102. Available online: https://unesdoc.unesco.org/ark:/48223/pf0000179751 (accessed on 6 June 2019).
- Lally, V.E.; Watson, B.F. Humiture revisited. Weatherwise 1960, 13, 254–256. [Google Scholar] [CrossRef]
- Givoni, B. The influence of work and environmental conditions on the physiological responses and thermal equilibrium of man. Arid Zone Res. 1962, 24, 199–204. [Google Scholar]
- McKarns, J.S.; Brief, R.S. Nomographs give refined estimate of heat stress index. J. Occup. Med. 1966, 8, 557. [Google Scholar]
- Fuller, F.H.; Brouha, L. New engineering methods for evaluating the job environment. Ashrae J. 1966, 8, 39–52. [Google Scholar]
- Lind, A.R. Effect of individual variation on upper limit of perspective zone of climates. J. Appl. Physiol. 1970, 28, 57–62. [Google Scholar] [CrossRef] [PubMed]
- Botsford, J.H. A wet globe thermometer for environmental heat measurement. Am. Ind. Hyg. Assoc. J. 1971, 32, 1–10. [Google Scholar] [CrossRef] [PubMed]
- Kerslake, D.M. The Stress of Hot Environment; Cambridge University Press: Cambridge, UK, 1972. [Google Scholar]
- Givoni, B.; Pandolf, R.R. Predicting heart rate response to work, environment and clothing. J. Appl. Physiol. 1973, 34, 201–204. [Google Scholar] [CrossRef] [PubMed]
- Gonzalez, R.R.; Bergulnd, L.G.; Gagge, A.P. Indices of thermoregulatory strain for moderate exercise in the heat. J. Appl. Physiol. 1978, 44, 889–899. [Google Scholar] [CrossRef] [PubMed]
- Nunneley, S.H.; Stribley, F. Fighter index of thermal stress (FITS): Guidance for hot-weather aircraft operations. Aviat. Space Environ. Med. 1979, 50, 639–642. [Google Scholar] [PubMed]
- Kamon, E.; Ryan, C. Effective heat strain index using pocket computer. Am. Ind. Hyg. Assoc. J. 1981, 42, 611–615. [Google Scholar] [CrossRef]
- Shapiro, Y.; Pandolf, K.B.; Goldman, R.F. Predicting sweat loss response to exercise, environment and clothing. Eur. J. Appl. Physiol. Occup. Physiol. 1982, 48, 83–96. [Google Scholar] [CrossRef]
- Höppe, P. Die Energiebilanz des Menschen. Ph.D. Thesis, University of München, Munich, Germany, 1984. [Google Scholar]
- De Freitas, C.R. Assessment of human bioclimate based on thermal response. Int. J. Biometeorol. 1985, 29, 97–119. [Google Scholar] [CrossRef]
- Frank, A.; Moran, D.; Epstein, Y.; Belokopytov, M.; Shapiro, Y. The Estimation of Heat Tolerance by a New Cumulative Heat Strain Index. Available online: https://www.lboro.ac.uk/microsites/lds/EEC/ICEE/textsearch/1996/Frank-1996.pdf (accessed on 7 January 2020).
- Moran, D.S.; Shitzer, A.; Pandolf, K.B. A physiological strain index to evaluate heat stress. Am. J. Physiol. 1998, 275, 129–134. [Google Scholar] [CrossRef]
- International Standard Organization (ISO). Hot Environments—Analytical Determination and Interpretation of Thermal Stress Using Calculation of Required Sweat Rate; ISO: Geneva, Switzerland, 1989. [Google Scholar]
- Malchaire, J.; Piette, A.; Kampmann, B.; Mehnert, P.; Gebhard, H.; Havenith, G.; Den hartog, E.; Holmer, I.; Parsons, K.; Alfano, G.; et al. Development and Validation of the Predicted Heat Strain Model. Ann. Occup. Hyg. 2001, 45, 123–135. [Google Scholar] [CrossRef]
- Moran, D.S.; Pandolf, K.B.; Shapiro, Y.; Heled, Y.; Shani, Y.; Matthew, W.T.; Gonzales, R.R. An environmental stress index (ESI) as a substitute for the wet bulb globe temperature (WBGT). J. Therm. Biol. 2001, 26, 427–431. [Google Scholar] [CrossRef]
- Wallace, R.F.; Kriebel, D.; Punnett, L.; Wegman, D.H.; Wenger, C.B.; Gardner, J.W.; Gonzalez, R.R. The effects of continuous hot weather training on risk of exertional heat illness. Med. Sci. Sports Exerc. 2005, 37, 84–90. [Google Scholar] [CrossRef] [PubMed]
- European Committee for Standardization. EN ISO 11079. Ergonomics of the Thermal Environment—Determination and Interpretation of Cold Stress When Using Required Clothing Insulation (IREQ) and Local Cooling Effects (ISO 11079:2007); European Committee for Standardization: Brussel, Belgium, 2007. [Google Scholar]
- Robinson, D.; Haldi, F. Model to predict overheating risk based on an electrical capacitor analogy. Energy Build. 2007, 40, 1240–1245. [Google Scholar] [CrossRef]
- Nicol, F.; Hacker, J.; Spires, B.; Davies, H. Suggestion for new approach to overheating diagnostics. In Proceedings of Air Conditioning and the Low Carbon Cooling Challenge; Cumberland Lodge: Windsor, UK, 2008. [Google Scholar]
- Brake, D.J.; Bates, G.P. Limiting Metabolic Rate (Thermal Work Limit) as an Index of Thermal Stress. Appl. Occup. Environ. Hyg. 2010, 17, 176–186. [Google Scholar] [CrossRef]
- Sakoi, T.; Mochida, T. Concept of the equivalent wet bulb globe temperature index for indicating safe thermal occupational environments. Build. Environ. 2013, 67, 167–178. [Google Scholar] [CrossRef]
- D’Ambrosio Alfano, F.R.; Malchaire, J.; Palella, B.I.; Riccio, G. The WBGT index revisited after 60 years of use. Ann. Occup. Hyg. 2014, 58, 955–970. [Google Scholar]
- Olesen, B.W.; d’Ambrosio, F.R.; Parsons, K.; Palella, B.I. The creation of a single indicator that allows the evaluation of the perceived thermal stress in a wide range of environmental conditions and physiological activities required numerous attempts. In Proceeding of the 9th Windsor Conference on “Making Comfort Relevant”; Cumberland Lodge: Windsor, UK, 2016. [Google Scholar]
- D’Ambrosio Alfano, F.R.; Palella, B.I.; Riccio, G. Notes on the Implementation of the IREQ Model for the Assessment of Extreme Cold Environments. Ergonomics 2013, 56, 707–724. [Google Scholar] [CrossRef]
- American Society of Heating, Refrigerating and Air-Conditioning Engineering (ASHRAE). Thermal Environmental Conditions for Human Occupancy; Standard 55-2004; ASHRAE: Atlanta, GA, USA, 2017. [Google Scholar]
- Fanger, P.O. Thermal Comfort; Danish Technical Press: Copenhagen, Denmark, 1970. [Google Scholar]
- Hamdi, M.; Lachiver, G.; Michaud, F. A new predictive thermal sensation index of human response. Energy Build. 1999, 29, 167–178. [Google Scholar] [CrossRef]
- D’Ambrosio Alfano, F.R.; Palella, B.I.; Riccio, G.; Toftum, J. Fifty years of Fanger’s equation: Is there anything to discover yet? Int. J. Ind. Ergon. 2018, 66, 157–160. [Google Scholar] [CrossRef]
- D’Ambrosio Alfano, F.R.; Olesen, B.W.; Palella, B.I. Povl Ole Fanger’s Impact Ten Years Later. Energy Build. 2017, 152, 243–249. [Google Scholar] [CrossRef]
- Yang, L.; Yan, H.; Lam, J.C. Thermal comfort and building energy consumption implications—A review. Appl. Energy 2014, 115, 164–173. [Google Scholar] [CrossRef]
- De Dear, R.; Brager, G.; Cooper, D. Developing an Adaptive Model of Thermal Comfort and Preference; RP-884, Final Report; ASHRAE: Berkeley, CA, USA, 1997. [Google Scholar]
- Beccali, M.; Nucara, A.; Rizzo, G. Thermal Comfort. In The Encyclopaedia of Energy; Cutler, J.C., Ed.; Elsevier Science: Amsterdam, The Netherlands, 2004; pp. 55–64. ISBN 0-12-176480-X. [Google Scholar]
- De Dear, R.J.; Akimoto, T.; Arens, E.A.; Brager, G.; Candido, C.; Cheong, K.W.D.; Li, B.; Nishihara, N.; Sekhar, S.C.; Tanabe, S. Progress in Thermal Comfort Research over the Last Twenty Years. Indoor Air 2013, 23, 442–461. [Google Scholar] [CrossRef] [PubMed]
- Haldane, J.S. The influence of high air temperature. Hygiene 1905, 5, 494–513. [Google Scholar]
- Hill, L.; Griffith, O.W.; Flack, M. The measurement of the rate of heat-loss at body temperature by convection, radiation, and evaporation. Philos. Trans. Res. Soc. Lond. B 1916, 207, 183–220. [Google Scholar] [CrossRef]
- Vernon, H.M. The measurements of radiant heat in relation to human comfort. Proceeding of the Physiological Society. J. Physiol. 1930, 70. [Google Scholar] [CrossRef]
- Gagge, A.P.; Rapp, G.M.; Hardy, J.D. Effective radiant field and operative temperature necessary for comfort with radiant heating. Ashrae Trans. 1967, 73, 2.1–2.9. [Google Scholar]
- Hevener, O.F. All about humiture. Weatherwise 1959, 12, 56–85. [Google Scholar] [CrossRef]
- Craig, F.N. Relation between heat balance and physiological strain in walking men clad in ventilated impermeable. Fed. Proc. 1950, 9, 26. [Google Scholar]
- Lind, A.R.; Hallon, R.F. Assessment of physiologic severity of hot climate. J. Appl. Physiol. 1957, 11, 35–40. [Google Scholar] [CrossRef]
- Thom, E.C. The discomfort index. Weatherwise 1959, 12, 57–61. [Google Scholar] [CrossRef]
- Tennenbaum, J.; Sohar, E.; Adar, R.; Gilat, T.; Yaski, D. The physiological significance of the cumulative discomfort index (Cum DI). Harefuah 1961, 60, 315–319. [Google Scholar] [PubMed]
- Hall, J.F.K.; Polte, W. Physiological index of strain and body heat storage in hyperthermia. J. Appl. Physiol. 1960, 15, 1027–1030. [Google Scholar] [CrossRef] [PubMed]
- Lee, D.H.K.; Henschel, A. Evaluation of Thermal Environment in Shelters, Department of Health, Education and Welfare; Public Health Service, Division of Occupational Health: Washington, DC, USA, 1963. [Google Scholar]
- Nieuwolt, S. Tropical Climatology: An Introduction to the Climates of the Low Latitudes; John Wiley and Sons: London, UK, 1977. [Google Scholar]
- Masterton, J.M.; Richardson, F.A. Humidex, a Method of Quantifying Human Discomfort Due to Excessive Heat and Humidity; Environment Canada: Ottawa, ON, Canada, 1979. [Google Scholar]
- Weiss, M. The humisery and other measures of summer discomfort. Nat. Wea. Dig. 1982, 7, 10–18. [Google Scholar]
- Pepi, W.J. The Summer Simmer Index. Weatherwise 1987, 40. [Google Scholar] [CrossRef]
- Moran, D.S.; Shapiro, Y.; Epstein, Y.; Matthew, W.; Pandolf, K.B. A Modified Discomfort Index (MDI) as an Alternative to the Wet Bulb Globe Temperature (WBGT). In Environmental Ergonomics VIII, Proceedings of the 8th International Conference on Environmental Ergonomics, 18–23 October 1998, San Diego, CA, USA; Naval Health Research Center and San Diego State University: San Diego, CA, USA, 1998; pp. 77–80. [Google Scholar]
- Pepi, W.J. The New Summer Simmer Index. In Proceedings of the 80th Annual Meeting of the AMS, Long Beach, CA, USA, 9–14 January 2000. [Google Scholar]
- Chartered Institution of Building Services Engineers. CIBSE Guide a Chapter 1: Environmental Criteria for Design; CIBSE: London, UK, 2006. [Google Scholar]
- Talaia, M.; Simoes, H. EsConTer: Um índice de avaliaçao de ambiente termico. In Proceedings of the V Congresso Cubano de Meteorologia, Somet-Cuba; Sociedade de Meteorologia de Cuba: La Havana, Cuba, 2009; pp. 1612–1626. [Google Scholar]
- Borgeson, S.; Brager, G.S. Comfort standards and variations in exceedance for mixed-mode buildings. Build. Res. Inf. 2010, 39, 118–133. [Google Scholar] [CrossRef]
- Houghton, F.C.; Yaglou, C.P. Determining equal comfort lines. Am. Soc. Heat. Vent. Eng. 1923, 29, 165–176. [Google Scholar]
- Dufton, A.F. The eupatheostat. Sci. Instrum. 1929, 6, 249–251. [Google Scholar] [CrossRef]
- Vernon, H.M.; Warner, C.G. The influence of the humidity of the air on capacity for work at high temperature. Hygiene 1932, 32, 431–463. [Google Scholar] [CrossRef]
- Gagge, A.P. Man, his environment, his comfort. Heat. Pip. Air Cond. 1969, 41, 209–224. [Google Scholar]
- Winslow, C.E.A.; Herrington, L.P.; Gagge, A.P. Physiological reactions and sensations of pleasantness under varying atmospheric conditions. Trans. Ashve 1937, 44, 179–196. [Google Scholar]
- Ionides, M.; Plummer, J.; Siple, P.A. The thermal acceptance ratio. Interm. report No. 1, Climatology and envelope. Fed. Proc. 1945, 9, 26. [Google Scholar]
- Bedford, T. Environmental Warmth and Its Measurement; H.M.S.O: London, UK, 1946. [Google Scholar]
- Missenard, A. A thermique des ambiences: Équivalences de passage, équivalences de séjours. Chal. Indust 1948, 276, 159–172. [Google Scholar]
- Webb, C.G. An analysis of some observations of thermal comfort in an equatorial climate. Brit. J. Ind. Med. 1959, 16, 297–310. [Google Scholar] [CrossRef] [PubMed]
- Sohar, E.; Tennenbaum, D.J.; Robinson, N. A Comparison of the Cumulative Discomfort Index (Cum DI) and Cumulative Effective Temperature (Cum ET), as Obtained by Meteorological Data; Tromp, S.W., Ed.; Biometeorology, Pergamon Press: Oxford, UK, 1962; pp. 395–400. [Google Scholar]
- Gagge, A.P.; Stolwijk, A.; Nishi, Y. An effective temperature scale based on a simple model of human physiological regulatory response. Ashrae Trans. 1971, 77, 247–257. [Google Scholar]
- Nishi, Y.; Gagge, A.P. Humid operative temperature. A biophysical index of thermal sensation and discomfort. J. Physiol. 1971, 63, 365–368. [Google Scholar]
- Steadman, R.G. Indices of wind chill of clothed persons. J. Appl. Meteor. 1971, 10, 674–683. [Google Scholar] [CrossRef]
- Gonzalez, R.R.; Nishi, Y.; Gagge, A.P. Experimental evaluation of standard effective temperature: A new biometeorological index of man’s thermal discomfort. Int. J. Biometeorol. 1974, 18, 1–15. [Google Scholar] [CrossRef]
- Steadman, R.G. The Assessment of Sultriness. Part I: A Temperature-Humidity Index Based on Human Physiology and Clothing Science. J. Appl. Meteor. 1979, 18, 861–873. [Google Scholar] [CrossRef]
- Wray, W.O. A simple procedure for assessing thermal comfort in passive solar heated buildings. Sol. Energy 1980, 25, 327–333. [Google Scholar] [CrossRef]
- Gagge, A.P.; Fobelets, A.P.; Berglund, L.G. A standard predictive index of human response to the thermal environment. Ashrae Trans. 1986, 92, 709–731. [Google Scholar]
- Bureau of Indian Standards. Handbook of Functional Requirements of Buildings (Other than Industrial Buildings); Bureau of Indian Standards: New Delhi, India, 1987. [Google Scholar]
- Guide, J. Weather, Solar and Illuminance Data, Chartered Institution of Building Services Engineers; CIBSE: London, UK, 2002; Volume 8. [Google Scholar]
- International Standard Organization (ISO). 7730: Ergonomics of the Thermal Environment—Analytical Determination and Interpretation of Thermal Comfort Using Calculation of the PMV and PPD Indices and Local Thermal Comfort Criteria, 3rd ed.; ISO: Geneva, Switzerland, 2005. [Google Scholar]
- World Health Organizzation (WHO). WHO Air Quality Guidelines for Particulate Matter, Ozone, Nitrogen Dioxide and Sulfur Dioxide; Summary of Risk Assessment; WHO: Geneva, Switzerland, 2005. [Google Scholar]
- Norhidayah, A.; Lee, C.K.; Azhar, M.K.; Nurulwahida, S. Indoor air quality and sick building syndrome in three selected buildings. Procedia Eng. 2013, 53, 93–98. [Google Scholar] [CrossRef]
- Yang, J.; Pantazaras, A.; Chaturvedi, K.A.; Chandran, A.K.; Santamouris, M.; Lee, S.E.; Tham, K.W. Comparison of different occupancy counting methods for single system-single zone applications. Energy Build. 2018, 172, 221–234. [Google Scholar] [CrossRef]
- Sekhar, C.; Anand, P.; Schiavon, S.; Tham, K.W.; Cheong, D.; Saber, E.M. Adaptable cooling coil performance during part loads in the tropics—A computational evaluation. Energy Build. 2018, 159, 148–163. [Google Scholar] [CrossRef]
- Bluyssen, P.M. Towards an integrative approach of improving indoor air quality. Build. Environ. 2009, 44, 1980–1989. [Google Scholar] [CrossRef]
- Jansz, J. Sick Building Syndrome. In International Encyclopedia of Public Health, 2nd ed.; Academic Press: Cambridge, MA, USA, 2017; pp. 502–505. [Google Scholar]
- Crook, B.; Burton, N.C. Indoor moulds, Sick Building Syndrome and building related illness. Fungal Biol. Rev. 2010, 24, 106–113. [Google Scholar] [CrossRef]
- U.S. Environmental Protection Agency (EPA). Guidelines for Ecological Risk Assessment. Federal Register 63. pp. 26846–26924. Available online: https://www.epa.gov/sites/production/files/2014-11/documents/eco_risk_assessment1998.pdf (accessed on 16 February 2019).
- World Health Organization. The Right to Healthy Indoor Air. In Proceedings of the WHO Meeting, Bilthoven, The Netherlands, 15–17 May 2000. [Google Scholar]
- World Health Organization. Health 21—An Introduction to the Health for all Policy Framework for the WHO European Region: European Health for all Series No 5; World Health Organization Europe Regional Office: Copenhagen, Denmark, 2000. [Google Scholar]
- World Health Organization (WHO). Air Pollution: Fifth Report of the Expert Committee on Environmental Sanitation; WHO Technical Report Series, No. 157; World Health Organization: Geneva, Switzerland, 1958; Available online: http://apps.who.int/iris/handle/10665/40416 (accessed on 6 December 2018).
- World Health Organization (WHO). Atmospheric Pollutants: Report of a WHO Expert Committee; WHO Technical Report Series, No. 271; World Health Organization: Geneva, Switzerland, 1964; Available online: http://apps.who.int/iris/handle/10665/40578 (accessed on 6 December 2018).
- World Health Organization (WHO). Air Quality Criteria and Guides for Urban Air Pollutants: Report of a WHO Expert Committee; WHO Technical Report Series, No. 506; World Health Organization: Geneva, Switzerland, 1972; Available online: http://apps.who.int/iris/handle/10665/40989 (accessed on 6 December 2018).
- World Health Organization (WHO). Regional Office for Europe; Air Quality Guidelines for Europe; World Health Organization Europe Regional Office: Copenhagen, Denmark, 1987. [Google Scholar]
- World Health Organization (WHO). Air Quality Guidelines for Europe. Second Edition; European Health for all Series No 91; World Health Organization Europe Regional Office: Copenhagen, Denmark, 2000. [Google Scholar]
- European Commission. Council directive 96/62/EC of 27 September 1996 on Ambient Air Quality Assessment and Management 96/62/EC. Available online: https://eur-lex.europa.eu/legal-content/EN/TXT/?uri=CELEX%3A31996L0062 (accessed on 10 January 2020).
- World Health Organization (WHO) Regional Office for Europe. Air Quality Guidelines; Global Update; WHO: Geneva, Switzerland, 2005. [Google Scholar]
- World Health Organization (WHO) Regional Office for Europe. WHO Guidelines for Indoor Air Quality: Dampness and Mould; World Health Organization Europe Regional Office: Copenhagen, Denmark, 2009. [Google Scholar]
- World Health Organization (WHO) Regional office for Europe. Selected Pollutants: Who Guideline for Indoor Air Quality; World Health Organization Europe Regional Office: Copenhagen, Denmark, 2010. [Google Scholar]
- World Health Organization (WHO) Regional office for Europe. Indoor Air Quality Guidelines: Household Fuel Combustion; World Health Organization Europe Regional Office: Copenhagen, Denmark, 2014. [Google Scholar]
- American Society of Heating, Refrigerating and Air-Conditioning Engineering (ASHRAE). Indoor Air Guide; Environmental Protection Agency: Atlanta, GA, USA, 2009. [Google Scholar]
- Anand, P. Development of a Data-Driven Occupancy-Based Building Energy and IEQ Model. Ph.D. Thesis, National University of Singapore, Singapore, 2019. [Google Scholar]
- American Society of Heating, Refrigerating and Air-Conditioning Engineering (ASHRAE). Ventilation and Acceptable Indoor Air Quality; ANSI/ASHRAE standard 62.1; ASHRAE: Atlanta, GA, USA, 2013. [Google Scholar]
- Fanger, P.O. Introduction of the olf and the decipol Units to Quantify Air Pollution Perceived by Humans Indoors and Outdoors. Energy Build. 1987, 12, 1–6. [Google Scholar] [CrossRef]
- Cohas, M. Ventilation et Qualité de l’Air dans l’Habitat, 5th ed.; Les éditions Parisiennes (EDIPA): Paris, France, 1996. [Google Scholar]
- Kirchner, S.; Jedor, B.; Mandin, C. Elaboration D’indices de la Qualite de L’Air Interieur: Phase 1: Inventaire des Indices Disponibles. 2015. Available online: http://www.oqai.fr/userdata/documents/483_Inventaire_OQAI_Indices_2006.pdf (accessed on 9 February 2019).
- Indoor Air Quality Management Group. A Guide on Indoor Air Quality Certification Scheme for Offices and Public Places. 2015. Available online: http://www.iaq.gov.hk/en/publications-and-references/guidance-notes.aspx (accessed on 9 February 2019).
- Chiang, C.M.; Lai, C.M. A study on the comprehensive indicator of indoor environment assessment for occupants’ health in Taiwan. Build. Environ. 2002, 37, 387–392. [Google Scholar] [CrossRef]
- Moschandreas, D.; Sofuoglu, S.C. The indoor air pollution index. Indoor Air 1999, 99, 261–266. [Google Scholar]
- Moschandreas, D.J.; Sofuoglu, S.C. The indoor environmental index and its relationship with symptoms of office building occupants. J. Air Waste Manag. Assoc. 2004, 54, 1440–1451. [Google Scholar] [CrossRef]
- Rojas, G.; Pfluger, R.; Feist, W. Ventilation concepts for energy efficient housing in Central European climate—A simulation study comparing IAQ, mold risk and ventilation losses. In Proceedings of the 14th International Conference on Indoor Air Quality and Climate, Indoor Air 2016, Ghent, Belgium, 3–8 July 2016. [Google Scholar]
- Gadeau, A.L. Assessment of ventilation strategies using an air quality index introduced in CLIM 2000 software, Espoo, Finland. Proc. Healthy Build. 1996, 4, 23–24. [Google Scholar]
- Castanet, S. Contribution À L’étude de la Ventilation Et de la Qualité de L’air Intérieur des Locaux. Ph.D. Thesis, INSA, Lyon, France, 1998. [Google Scholar]
- QUAD-BBC. Choix de Paramètres de Suivi de la Qualité de L’air Intérieur; Report T1.2 for the project QUAD-BBC; International Energy Agency: Paris, France, 2012. [Google Scholar]
- Sofuoglu, S.C.; Moschandreas, D.J. The link between symptoms of office building occupants and in-office air pollution: The Indoor Air Pollution Index. Indoor Air 2003, 13, 332–343. [Google Scholar] [CrossRef] [PubMed]
- Marchand, D.; Belair, F.; Kirchner, S. Indices de qualité d’air intérieur: Vers une culture du risque sanitaire. Environnement Risques & Santé 2008, 7, 341–347. [Google Scholar]
- Teichman, K.; Howard-Reed, C.; Persily, A.; Emmerich, S. Characterizing Indoor Air Quality Performance Using a Graphical Approach; NIST: Gaithersburg, MD, USA, 2016. [Google Scholar]
- Logue, J.M.; Price, P.N.; Sherman, M.H.; Singer, B.C. A method to estimate the chronic health impact of air pollutants in U.S. residences. Environ. Health Perspect. 2010, 120, 216–222. [Google Scholar] [CrossRef]
- Luo, N.; Weng, W.; Xu, X.; Hong, T.; Fu, M.; Su, K. Assessment of occupant-behavior based indoor air quality and its impacts on human exposure risk: A case study based on the wildfires in Northern California. Sci. Total Environ. 2019, 686, 1251–1261. [Google Scholar] [CrossRef]
- Wei, W.; Ramalho, O.; Derbez, M.; Riberon, J.; Kirchner, S.; Mandin, C. Applicability and relevance of six indoor air quality indexes. Build. Environ. 2016, 109, 42–49. [Google Scholar]
- van Dijken, F.; Boerstra, A.C. The ABCD Tool for schools. In Proceedings of the 9th International Conference and Exhibition on Healthy Buildings 2009, Syracuse, NY, USA, 13–17 September 2009. [Google Scholar]
- Environment Protection Agency. Indoor AirPLUS Construction Specifications Version 1 (Rev 03) USA, 2015. Available online: http://www2.epa.gov/sites/production/files/2015-10/documents/construction_specification_rev_3_508.pdf (accessed on 16 February 2019).
- Cony, L.R.S.; Abadie, M.; Wargocki, P.; Rode, C. Towards the definition of indicators for assessment of indoor air quality and energy performance in low-energy residential buildings. Energy Build. 2017, 152, 492–502. [Google Scholar] [CrossRef]
- Zhu, C.; Li, N. Study on indoor air quality evaluation index based on comfort evaluation experiment. Energy Procedia 2017, 205, 2246–2253. [Google Scholar] [CrossRef]
- Energy in Building and Community programme (EBC) and International Energy Agency (IEA) Indoor Air Quality Design and Control in Low Energy Residential Buildings IEA EBC Annex 68 2015. Available online: http://www.iea-ebc-annex68.org/about_annex-68 (accessed on 8 November 2018).
- Reinten, J.; Braat-Eggen, P.E.; Hornikx, M.; Kort, H.S.M.; Kohlrausch, A. The indoor sound environment and human task performance: A literature review on the role of room acoustics. Build. Environ. 2017, 123, 315–332. [Google Scholar] [CrossRef]
- Health and Safety Executive (HSE). Controlling Noise at Work. The Control of Noise at Work, 2nd ed.; HSE Books: Sudbury, Suffolk, UK, 2005; ISBN 978-0-7176-6164-4. [Google Scholar]
- Directive 2003/10/EC of the European Parliament and of the Council of 6 February 2003 on the Minimum Health and Safety Requirements Regarding the Exposure of Workers to the Risks Arising from Physical Agents (Noise) (Seventeenth Individual Directive within the Meaning of Article 16 of Directive 89/391/EEC), OJ L 42, 15.2.2003. Available online: https://eur-lex.europa.eu/legal-content/EN/ALL/?uri=CELEX%3A32003L0010 (accessed on 10 January 2020).
- International Organization for Standardization ISO 9612. Acoustics-Determination of Occupational Noise Exposure-Engineering Method; ISO: Geneva, Switzerland, 2009. [Google Scholar]
- Leccese, F.; Salvadori, G.; Rocca, M.; Spinelli, N. Risk assessment of noise exposure in a machine shop and choice of hearing protection equipment. G Ital. Med. Lav. Ergon. 2016, 38, 5–13. [Google Scholar]
- European Environment Agency. Good Practice Guide on Noise Exposure and Potential Health Effects; EEA Technical Report no. 11/2010; European Environment Agency: Copenhagen, Denmark, 2010. [Google Scholar]
- World Health Organization. Night Noise Exposure Guidelines for Europe; WHO Regional Office for Europe: Copenhagen, Denmark, 2009; Available online: http://www.euro.who.int/__data/assets/pdf_file/0017/43316/E92845.pdf (accessed on 6 June 2019).
- Al horr, Y.; Arif, M.; Katafygiotou, M.; Mazroei, A.; Kaushik, A.; Elsarrag, E. Impact of indoor environmental quality on occupant well-being and comfort: A review of the literature. Int. J. Sustain. Built Environ. 2016, 5, 1–11. [Google Scholar] [CrossRef]
- Navai, M.; Veitch, J.A. Acoustic Satisfaction in Open-Plan Offices: Review and Recommendations, Research Report RR-151; Institute for Research in Construction, National Research Council Canada: Ottawa, ON, Canada, 2003; Available online: http://www.nrc-cnrc.gc.ca/obj/irc/doc/pubs/rr/rr151/rr151.pdf (accessed on 12 February 2019).
- Choi, Y.J. Effect of occupancy on acoustical conditions in university classrooms. Appl. Acoust. 2016, 114, 36–43. [Google Scholar] [CrossRef]
- Bistafa, S.R.; Bradley, J.S. A Comparative study of Speech Intelligibility Metrics and the Derivation of Optimum Reverberation Time and Maximum Background-Noise Level for Classrooms; Institute of Research in Construction, National Research Council Canada: Ottawa, ON, Canada, 1999. [Google Scholar]
- Nowoświat, A.; Olechowska, M. Fast estimation of speech transmission index using the reverberation time. Appl. Acoust. 2016, 102, 55–61. [Google Scholar] [CrossRef]
- Leccese, F.; Rocca, M.; Salvadori, G. Fast estimation of Speech Transmission Index using Reverberation Time: Comparison between predictive equations for educational rooms of different sizes. Appl. Acoust. 2018, 140, 143–149. [Google Scholar] [CrossRef]
- Beranek, L.L. Balanced noise criterion (NCB) curves. J. Acoust. Soc. Am. 1989, 86, 650–664. [Google Scholar] [CrossRef]
- Ayr, U.; Cirillo, E.; Martellotta, F. A new parameter for the assessment of noise annoyance in air-conditioned buildings. In Proceedings of the Clima 2000/Naples 2001 World Congress, Napoli, Italy, 15–18 September 2001. [Google Scholar]
- Beranek, L.L.; Blazier, W.E.; Figwer, J.J. Preferred noise criterion (PNC) curves and their application to rooms. J. Acoust. Soc. Am. 1971, 50, 1223–1228. [Google Scholar] [CrossRef]
- Kryter, K.D. The Effects of Noise on Man; Academic Press: New York, NY, USA, 1970. [Google Scholar]
- Beranek, L.L. Criteria for office quieting based on questionnaire rating studies. J. Acoust. Soc. Am. 1956, 28, 833–852. [Google Scholar] [CrossRef]
- Robinson, D.W. Towards a unified system of noise assessment. J. Acoust. Soc. Am. 1971, 14, 279–298. [Google Scholar] [CrossRef]
- International Organization for Standardization. ISO 1996-1: Acoustics—Description, Measurement and Assessment of Environmental Noise, Part 1: Basic Quantities and Assessment Procedures; ISO: Geneva, Switzerland, 2016. [Google Scholar]
- Hay, B.; Kemp, K.F. Measurement of noise in air-conditioned, landscaped offices. J. Sound Vib. 1972, 23, 363–373. [Google Scholar] [CrossRef]
- Ayr, U.; Cirillo, E.; Martellotta, F. Further investigations on the definition of a new parameter to assess noise annoyance in air conditioned offices. Energy Build. 2002, 34, 765–774. [Google Scholar] [CrossRef]
- Blazier, W.E. Revised noise criterion for application in the acoustical design and rating of HVAC systems. Noise Control Eng. J. 1981, 162, 64–73. [Google Scholar] [CrossRef]
- Blazier, W.E. Sound quality consideration in rating noise from heating, ventilating and air-conditioning (HVAC) systems in buildings. Noise Control Eng. J. 1995, 43, 53–63. [Google Scholar] [CrossRef]
- Blazier, W.E. RC Mark II: A refined procedure for rating the noise of heating, ventilating, and air-conditioning (HVAC) systems in buildings. Noise Control Eng. J. 1997, 45, 243–250. [Google Scholar] [CrossRef]
- Beranek, L.L. The Design of Speech Communication Systems. In Proceedings of the IRE; IEEE: Piscataway, NJ, USA, 1947; Volume 35, pp. 880–890. [Google Scholar]
- Stevens, S. Procedure for calculating loudness: Mark IV. J. Acoust. Am. Soc. 1983, 33, 1577–1585. [Google Scholar] [CrossRef]
- International Organization for Standardization. ISO 532-1: Acoustics—Methods for Calculation Loudness, Part 1— Zwicker method; ISO: Geneva, Switzerland, 2017. [Google Scholar]
- French, N.R.; Steinberg, J.C. Factors governing the intelligibility of speech sounds. J. Acoust. Am. Soc. 1947, 19, 90–119. [Google Scholar] [CrossRef]
- Peutz, V.M. A Articulation Loss of Consonants as a Criterion for Speech Transmission in a Room. J. Audio Eng. Soc. 1971, 19, 915–919. [Google Scholar]
- Reichardt, W.; Abdel Alim, O.; Schmidt, W. Definition und Messgrundlage eines objektiven Masses zur Ermittlung der Grenze zwischen brauchbarer und unbrauchbarer Durchsichtigkeit beim Musikdarbietung. Acustica 1975, 32, 126–137. [Google Scholar]
- Thiele, R. Die Richtungsverteilung und Zeitfolge der Schallrückwürfe in Räumen (Directional distribution and time sequence of sound reflections in rooms). Acta Acust. United Acust. 1953, 3, 291–302. [Google Scholar]
- Jordan, V.L. A comprehensive Musical Criterion: The inversion Index. In Proceedings of the 47th Audio Engineering Society Convention, Copenhagen, Denmark, 26–29 March 1974. [Google Scholar]
- Cremer, L.; Muller, H. Principles and Applications of Room Acoustics vol. 1 & 2; English translation with additions by T. Schultz.; Applied Science Publishers: New York, NY, USA, 1982. [Google Scholar]
- Dammerud, J.J.; Barron, M.; Kahle, E. Objective Assessment of Acoustic Conditions for Symphony Orchestras. Build. Acoust. 2011, 18, 207–219. [Google Scholar] [CrossRef]
- Sabine, W.C. Collected Papers on Acoustics; Reprinted by Dover; University Press Harvard: New York, NY, USA, 1964. [Google Scholar]
- Eyring, C.F. Reverberation time in “Dead” rooms. J. Acoust. Soc. Am. 1930, 26, 217–241. [Google Scholar] [CrossRef]
- Arau-Puchades, H. An Improved Reverberation Formula. Acta Acust. 1988, 65, 163–180. [Google Scholar]
- Millington, G. A modified formula for reverberation. J. Acoust. Soc. Am. 1932, 4, 69–82. [Google Scholar] [CrossRef]
- IEC 60268-16. In Sound System Equipment. Part 16: Objective Rating of Speech Intelligibility by Speech Transmission Index, 4th ed.; IEC: Geneva, Switzerland, 2011.
- Pelegrin Garcia, D.; Brunkoq, J.; Lyberg-Ahlander, V.; Lofquist, A. Measurement and prediction of voice support and room gain in school classroom. J. Acoust. Soc. Am. 2012, 131, 194–204. [Google Scholar] [CrossRef] [PubMed]
- Latham, H.G. The signal-to-noise ratio for speech intelligibility—An auditorium acoustics design index. Appl. Acoust. 1979, 12, 253–320. [Google Scholar] [CrossRef]
- American National Standards Institute (ANSI). Methods for Calculation of the Speech Intelligibility Index; ANSI/ASA S3.5-1997 (R2017); ANSI: Washington, DC, USA, 2017. [Google Scholar]
- Houtgast, T.; Steeneken, H.J.M.; Plomp, R. Predicting speech intelligibility in rooms from the modulation transfer function. I. General room acoustics. Acustica 1980, 46, 60–72. [Google Scholar]
- Van Wijngaarden, S.; Verhave, J.; Steeneken, H. The speech transmission index after four decades of development. Acoust. Aust. 2012, 40, 134–138. [Google Scholar]
- Barron, M.; Lee, L.J. Energy relations in concert auditoriums. I J. Acoust. Soc. Am. 1988, 84, 618–628. [Google Scholar] [CrossRef]
- Pelegrín-García, D. Comment on ‘Increase in voice level and speaker comfort in lecture rooms’. J. Acoust. Soc. Am. 2011, 129, 1161. [Google Scholar]
- Cotana, F.; Goreti, M. Acoustic classification of Buildings: Impact of acoustic performances of high acoustic performance of a high energy-efficient building on quality and sustainability indicators. In Proceedings of the 20th International Congress on Acoustics, ICA 2010, Sydney, Australia, 23–27 August 2010. [Google Scholar]
- European Committee for Standardization. EN 12354-5 Building Acoustics—Estimation of Acoustic Performance of Buildings from the Performance of Elements—Part 5: Sounds Levels Due to the Service Equipment; European Committee for Standardization: Brussels, Belgium, 2000. [Google Scholar]
- European Committee for Standardization. EN 12354-2 Building Acoustics—Estimation of Acoustic Performance of Buildings from the Performance of Elements—Part 2: Impact Sound Insulation Between Rooms; European Committee for Standardization: Brussels, Belgium, 2000. [Google Scholar]
- European Committee for Standardization. EN 12354-1 Building Acoustics—Estimation of Acoustic Performance of Buildings from the Performance of Elements—Part 1: Airborne Sound Insulation Between Rooms; European Committee for Standardization: Brussels, Belgium, 2000. [Google Scholar]
- European Committee for Standardization. EN 12354-3 Building Acoustics—Estimation of Acoustic Performance of Buildings from the Performance of Elements—Part 3: Airborne Sound Insulation Against Outdoor Sound; European Committee for Standardization: Brussels, Belgium, 2000. [Google Scholar]
- Yang, D.; Mak, C.M. An assessment model of classroom acoustical environment based on fuzzy comprehensive evaluation method. Appl. Acoust. 2017, 127, 292–296. [Google Scholar] [CrossRef]
- Madbouly, A.I.; Noaman, A.Y.; Ragab, A.H.M.; Khedra, A.; Fayoumi, A.G. Assessment model of classroom acoustics criteria for enhancing speech intelligibility and learning quality. Appl. Acoust. 2016, 114, 147–158. [Google Scholar] [CrossRef]
- Boyce, P.R. Human Factors in Lighting, 2nd ed.; Taylor and Francis: London, UK, 1981. [Google Scholar]
- International Well Building Institute. WELL Building Standard. Available online: https://www.wellcertified.com/ (accessed on 6 June 2019).
- Heiden, M.; Zetterberg, C.; Lindberg, P.; Nylen, P.; Hemphala, H. Validity of a computer-based risk assessment method for visual ergonomics. Int. J. Ind. Ergon. 2019, 72, 180–187. [Google Scholar] [CrossRef]
- Leccese, F.; Salvadori, G.; Rocca, M. Visual discomfort among university students who use CAD workstations. Work 2016, 55, 171–180. [Google Scholar] [CrossRef] [PubMed]
- Taino, G.; Ferrari, M.; Mestad, I.J.; Fabris, F.; Imbriani, M. Astenophia and work at VDT: Study on a population of 191 workers exposed to risk through administering of anamnestic questionnaire focused on ophthalmic assessment. G. Ital. Med. Lav. Ergon. 2006, 34, 487–497. [Google Scholar]
- Leccese, F.; Salvadori, G.; Montagnani, C.; Ciconi, A.; Rocca, M. Lighting assessment of ergonomic workstation for radio diagnostic reporting. Int. J. Ind. Ergon. 2017, 57, 42–54. [Google Scholar] [CrossRef]
- Yan, Z.; Hu, L.; Chen, H.; Lu, F. Computer Vision Syndrome: A widely spreading but largely unknown epidemic among computer users. Comput. Hum. Behav. 2008, 24, 2026–2042. [Google Scholar] [CrossRef]
- Bergqvist, U. Visual Display Terminal work—A perspective on long-term changes and discomfort. Int. J. Ind. Ergon. 1995, 16, 201–209. [Google Scholar] [CrossRef]
- Turville, K.L.; Psihogios, J.P.; Ulmer, T.R.; Mirka, G.A. The effects of video display terminal height on the operator: A comparison of the 15° and 40° recommendations. Appl. Ergon. 1998, 29, 239–246. [Google Scholar] [CrossRef]
- Pillastrini, P.; Mugnaia, R.; Bertozzi, L.; Costi, S.; Curti, S.; Guccione, A.; Mattioli, S.; Violante, F.S. Effectiveness of an ergonomic intervention on work-related posture and low back pain in video display terminal operators: A 3 year cross-over trial. Appl. Ergon. 2010, 41, 436–443. [Google Scholar] [CrossRef]
- Mirmohammadi, S.J.; Mehrparvar, A.H.; Olia, M.B.; Mirmohammadi, M. Effects of training intervention on non-ergonomic positions among video display terminals (VDT) users. Work 2012, 42, 429–433. [Google Scholar] [CrossRef]
- Powell, A.L. Computer anxiety: Comparison of research from the 1990s and 2000s. Comput. Hum. Behav. 2013, 29, 2337–2381. [Google Scholar] [CrossRef]
- Leccese, F.; Salvadori, G.; Rocca, M. Visual ergonomics of video-display-terminal workstations: Field measurements of luminance for various display settings. Displays 2016, 42, 9–18. [Google Scholar] [CrossRef]
- Lin, Y.T.; Lin, P.H.; Hwang, S.L.; Jeng, S.C.; Liao, C.C. Investigation of legibility and visual fatigue for simulated flexible electronic paper under various surface treatments and ambient illumination conditions. Appl. Ergon. 2009, 40, 922–928. [Google Scholar] [CrossRef] [PubMed]
- Blehm, C.; Vishnu, S.; Khattak, A.; Mitra, S.; Yee, R.W. Computer vision syndrome: A review. Surv. Ophthalmol. 2005, 50, 253–262. [Google Scholar] [CrossRef] [PubMed]
- Helland, M.; Horgen, G.; Kvikstad, T.R.; Garthus, T.; Bruenech, J.R.; Aaras, A. Musculoskeletal, visual and psychosocial stress in VDU operators after moving to an ergonomically designed office landscape. Appl. Ergon. 2008, 39, 284–295. [Google Scholar] [CrossRef]
- Wilkins, A.J.; Evans, B. Visual stress, its treatment with special filters, and its relationship to visually induced motion sickness. Appl. Ergon. 2010, 41, 509–515. [Google Scholar] [CrossRef]
- Pinto, I.; Brogi, A.; Piccolo, F.; Stacchini, N.; Buonocore, G.; Bellieni, C. Blue Light and Ultraviolet Radiation Exposure from infant Phototherapy Equipment. J. Occup. Environ. Hyg. 2015, 12, 603–610. [Google Scholar] [CrossRef]
- Directive 89/654/EEC of the European Parliament and of the Council of 30 November 1989 Concerning the Minimum safety and Health Requirements for the Workplace. Available online: https://eur-lex.europa.eu/legal-content/EN/TXT/?uri=CELEX%3A31989L0654 (accessed on 10 January 2020).
- Directive 2006/25/EC of the European Parliament and of the Council of 5 April 2006 on the Minimum Health and Safety Requirements regarding the Exposure of Workers to Risks Arising from Physical Agents (Artificial Optical Radiation). Available online: https://eur-lex.europa.eu/legal-content/EN/TXT/?uri=CELEX%3A02006L0025-20140101 (accessed on 10 January 2020).
- Leccese, F.; Salvadori, G.; Casini, M.; Bertozzi, M. Analysis and measurements of artificial optical radiation (AOR) emitted by lighting sources found in offices. Sustainability 2014, 6, 5941–5954. [Google Scholar] [CrossRef]
- European Commission. Council directive 96/62/EC of 27 September 1996 on ambient air quality assessment and management 96/62/EC. Available online: https://osha.europa.eu/en/legislation/guidelines/non-binding-guide-to-good-practice-for-implementing-directive-2006-25-ec-201aartificial-optical-radiation2019 (accessed on 7 January 2020).
- Leccese, F.; Vandelanotte, V.; Salvadori, G.; Rocca, M. Blue light hazard and risk group classification of 8 W LED tubes, replacing fluorescent tubes, through optical radiation measurements. Sustainability 2015, 7, 13454–13468. [Google Scholar] [CrossRef]
- International Commission on Non-Ionizing Radiation Protection. ICNIRP Guidelines on limits of exposure to incoherent visible and infrared radiation. Health Phys. 2013, 105, 74–96. [Google Scholar]
- International Commission on Non-Ionizing Radiation Protection. ICNIRP Guidelines on limits of exposure to ultraviolet of wavelength between 180 nm and 400 nm (incoherent optical radiation). Health Phys. 2004, 87, 171–186. [Google Scholar] [CrossRef]
- European Committee for Standardization. Photobiological Safety of Lamps and Lamp Systems; EN 62471; European Committee for Standardization: Bruxelles, Belgium, 2009. [Google Scholar]
- International Electrotechnical Commission. Application of IEC 62471 for the Assessment of Blue Light Hazard to Light Sources and Luminaires; IEC/TR 62778:2012; International Electrotechnical Commission: Geneva, Switzerland, 2014. [Google Scholar]
- European Committee for Electrotechnical Standardization. Light and Lighting—Basic Terms and Criteria for Specifying Lighting Requirements; EN 12665; European Committee for Electrotechnical Standardization: Bruxelles, Belgium, 2018. [Google Scholar]
- European Committee for Standardization. Light and Lighting—Lighting of Work Places—Part 1: Indoor Work Places; EN 12464-1; European Committee for Standardization: Brussels, Belgium, 2011. [Google Scholar]
- Berman, S.M. Energy Efficiency Consequences of Scotopic Sensitivity. J. Illum. Eng. Soc. 1992, 21, 3–14. [Google Scholar] [CrossRef]
- Thornton, W.A. Color-discrimination index. J. Opt. Soc. Am. 1972, 62, 191–194. [Google Scholar] [CrossRef] [PubMed]
- Thornton, W.A. A validation of the color preference index. J. Illum. Eng. Soc. 1974, 4, 48–52. [Google Scholar] [CrossRef]
- Xu, H. Color-rendering capacity of illumination. J. Opt. Soc. Am. 1983, 73, 1709–1713. [Google Scholar] [CrossRef]
- Davis, W.; Ohno, Y. Color quality scale. Opt. Eng. 2010, 49, 336021–3360216. [Google Scholar] [CrossRef]
- Hashimoto, K.; Yano, T.; Nayatani, Y. Proposal of practical method for calculating and indexing feeling of contrast for a light source. Illum. Eng. Inst. Jpn. 2000, 84, 843–849. [Google Scholar] [CrossRef]
- Judd, D.B. A flattery index for artificial illuminants. Illum. Eng. 1967, 62, 593–598. [Google Scholar]
- Freyssinier-Nova, J.P.; Rea, M.S. A two-metric proposal to specify the color-rendering properties of light sources for retail lighting, in Tenth International Conference of Solid-State Lighting. In Proceedings of the SPIE, San Diego, CA, USA, 23 August 2010. [Google Scholar]
- Smet, K.G.; Ryckaert, W.R.; Pointer, M.R.; Deconick, G.; Hanseler, P. Memory color quality metric for white light sources. Energy Build. 2012, 49, 216–225. [Google Scholar] [CrossRef]
- Pointer, M.R. Measuring color rendering—A new approach. Light Res. Technol. 1986, 18, 175–184. [Google Scholar] [CrossRef]
- Illuminating Engineering Society (IES). Approved Method: IES Spatial Daylight Autonomy (sDA) and Annual Sunlight Exposure (ASE) (IES-LM-83-12); IES: Washington DC, USA, 2012. [Google Scholar]
- Rogers, Z.; Goldman, D. Daylighting Metric Development Using Daylight Autonomy Calculations in the Sensor Placement Optimization Tool—Development Report and Case Studies; Architectural Energy Corporation: Boulder, CO, USA, 2006. [Google Scholar]
- Reinhart, C.; Walkenhorst, O. Validation of dynamic RADIANCE-based daylight simulations for a test office with external blinds. Energy Build 2001, 33, 683–697. [Google Scholar] [CrossRef]
- Walsh, J.W.T. The early years of Illuminating engineering in Great Britain. Trans. Illum. Eng. Soc. 1951, 15, 49–60. [Google Scholar] [CrossRef]
- Sicurella, F.; Evola, G.; Wurtz, E. A statistical approach for the evaluation of thermal and visual comfort in free-running buildings. Energy Build 2012, 47, 402–410. [Google Scholar] [CrossRef]
- Nabil, A.; Mardaljevic, J. Useful daylight illuminances: A replacement for daylight factors. Energy Build 2006, 38, 905–913. [Google Scholar] [CrossRef]
- Einhorn, H.D. Discomfort glare: A formula to bridge differences. Lighting Res. Technol. 1979, 11, 90–94. [Google Scholar] [CrossRef]
- International Commission on Illumination. Glare from Small, Large and Complex Sources (CIE 147); International Commission on Illumination: Vienna, Austria, 2002. [Google Scholar]
- Guth, S.K. A method for the evaluation of discomfort glare. Illum. Eng. 1963, 57, 351–364. [Google Scholar]
- Nazzal, A. A new evaluation method for daylight discomfort glare. Int. J. Ind. Ergon. 2005, 35, 295–306. [Google Scholar] [CrossRef]
- Wienold, J. Dynamic daylight glare evaluation. In Proceedings of the 11th International IBPSA Conference, Building Simulation, Glasgow, UK, 27–30 July 2009; pp. 944–951. [Google Scholar]
- International Commission on Illumination. Equations for Disability Glare (CIE 146); International Commission on Illumination: Vienna, Austria, 2002. [Google Scholar]
- Hviid, C.; Nielsen, T.; Svendsen, S. Simple tool to evaluate the impact of daylight on building energy consumption. Sol. Energy 2008, 82, 787–798. [Google Scholar] [CrossRef]
- Meyer, J.J. Visual discomfort: Evaluation after introducing modulated light equipment. In Proceedings of the 2nd European Conference on Energy-Efficient Lighting, in Right Light, Arnhem, NL, 26–29 September 1993; pp. 348–357. [Google Scholar]
- Chauvel, P.; Collins, J.B.; Dogniaux, R.; Longmore, J. Glare from windows: Current views of the problem. Light. Res. Technol. 1982, 14, 31–46. [Google Scholar] [CrossRef]
- Tokura, M.; Iwata, T.; Shukuya, M. Experimental study on discomfort glare caused by windows; development of a method for evaluating discomfort glare from a large light source. J. Arch. Plan Envrion. Eng. 1996, 489, 17–25. [Google Scholar]
- International Commission on Illumination. Discomfort Glare in Interior Lighting (CIE 117); International Commission on Illumination: Vienna, Austria, 1995. [Google Scholar]
- Ente Italiano di Normazione. Luce e Illuminazione-Illuminazione di Interni-Valutazione Dell’abbagliamento Molesto con il Metodo UGR (UNI 11165); Ente Italiano di Normazione: Milan, Italy, 2005. [Google Scholar]
- Petherbridge, P.; Hopkinson, R.G. Discomfort glare and the lighting of buildings. Trans Illum. Eng. Soc. 1950, 15, 29–79. [Google Scholar] [CrossRef]
- Wienold, J.; Christoffersen, J. Towards a new daylight glare rating. In Proceedings of the 10th European Lighting Conference Lux Europa, Berlin, Germany, 19–21 September 2005; pp. 157–161. [Google Scholar]
- Bellia, L.; Bisegna, F.; Spada, G. Lighting in indoor environments: Visual and non-visual effects of light sources with different spectral power distributions. Build. Environ. 2010, 46, 1984–1992. [Google Scholar] [CrossRef]
- Zeitzer, J.M.; Dijk, D.J.; Kronauer, R.E.; Brown, E.N.; Czeisler, C.A. Sensitivity of the human circadian pacemaker to nocturnal light: Melatonin phase resetting and suppression. J. Physiol. 2000, 526, 695–702. [Google Scholar] [CrossRef] [PubMed]
- Bisegna, F.; Burattini, C.; Li Rosi, O.; Blaso, L.; Fumagalli, S. Non visual effects of light: An overview and an Italian experience. Energy Procedia 2015, 78, 723–728. [Google Scholar]
- Rea, M.S. Lighting simply made better: Providing a full range of benefits without much fuss. Build. Environ. 2018, 144, 57–65. [Google Scholar] [CrossRef]
- Enezi, J.; Revell, V.; Brown, T.; Wynne, J.; Schlangen, L.; Lucas, R. A “Melanopic” Spectral Efficiency Function Predicts the Sensitivity of Melanopsin Photoreceptors to Polychromatic Lights. J. Biol. Rhythm. 2011, 26, 314–323. [Google Scholar] [CrossRef]
- Lucas, R.; Peirson, S.; Berson, D.; Brown, T.; Cooper, H.; Czeisler, C.; Figueiro, M.; Gamlin, P.; Lockley, S.; O’Hagan, J.; et al. Measuring and using light in the melanopsin age. Trends Neurosci. 2014, 37, 1–9. [Google Scholar] [CrossRef]
- Lucas Group. Excel-Based Melanopic Illuminance Calculator. University of Manchester. Available online: http://lucasgroup.lab.ls.manchester.ac.uk/research/measuringmelanopicilluminance/ (accessed on 25 February 2019).
- Rea, M.S.; Figueiro, M.; Bierman, A.; Hamner, R. Modelling the spectral sensitivity of the human circadian system. Light. Res. Technol. 2012, 44, 386–396. [Google Scholar] [CrossRef]
- Lighting Research Center. Circadian Stimulus Calculator. Available online: http://www.lrc.rpi.edu/programs/lightHealth/ (accessed on 25 February 2019).
- Konis, K. A novel circadian daylight metric for building design and evaluation. Build. Environ. 2017, 113, 22–38. [Google Scholar] [CrossRef]
- Chang, A.M.; Santhi, N.; St Hilaire, M.; Gronfier, C.; Bradstreet, D.S.; Duffy, J.F.; Lockley, S.W.; Kronauer, R.E.; Czeisler, C.A. Human responses to bright light of different durations. J. Physiol. 2012, 590, 3103–3112. [Google Scholar] [CrossRef]
- Figueiro, M.G.; Gonzales, K.; Pedler, D. Designing with Circadian Stimulus. Des. Appl. 2016, 46, 31–34. Available online: https://www.lrc.rpi.edu/programs/lightHealth/index.asp (accessed on 6 June 2019).


| Google Scholar | Science Direct | WOS | MDPI | |
|---|---|---|---|---|
| Search in | All (not optional) | Title, abstract, keywords | Title, abstract, keywords | Title, keywords |
| Sort type | Relevance (not optional) | Relevance | Time cited | Time cited |
| Meaning of classification | Publisher, authors, number of citations, recent citations | Highest occurrence of search item | Highest number of citation | Highest number of citation |
| keywords | Number of results (reviews) | |||
| “Thermal comfort” | 185,000 | 20,831 (1201) | 12,830 (495) | 466 |
| “Thermal stress” | 901,000 | 75,807 (2549) | 20,113 (401) | 254 |
| “Indoor air quality” | 271,000 | 14,551 (797) | 8046 (346) | 290 |
| “Indoor air pollution” | 94,800 | 5871 (603) | 3086 (286) | 64 |
| “Acoustic comfort” | 9100 | 881 (62) | 375 (9) | 21 |
| “Noise exposure” | 122,000 | 6897 (500) | 4962 (253) | 103 |
| “Visual comfort” | 25,000 | 2646 (187) | 1290 (52) | 43 |
| “Visual fatigue” | 18,100 | 1145 (36) | 825 (16) | 9 |
| Reference | Year | Index | Symbol | Application |
|---|---|---|---|---|
| [53] | 1945 | Wind Chill Index | WCI | Cold Environment |
| [54] | 1984 | Required Clothing Insulation | IREQ | |
| [55] | 1987 | Survival time outdoor in extreme cold | STOEC | |
| [28] | 1988 | Wind-Chill Effective Temperature | WET | |
| [56] | 2005 | Wind Chill equivalent Temperature | WCT | |
| [57] | 2007 | Wind Chill Temperature | twc | |
| [58] | 1945 | Index of physiological effect | EP | Hot Environment |
| [59] | 1947 | Predicted 4-h sweat rate | P4SR | |
| [60] | 1955 | Heat stress index | HIS | |
| [52] | 1957 | Wet bulb globe temperature | WBGT | |
| [61] | 1958 | Thermal strain index | TSI | |
| [62] | 1960 | Index of physiological Strain | Is | |
| [63] | 1962 | Index of Thermal Stress | ITS | |
| [64] | 1966 | Heat Strain Index corrected | HIS | |
| [65] | 1966 | Prediction of heart rate | HR | |
| [66] | 1970 | Prescriptive zone | ||
| [67] | 1971 | Wet Globe Temperature | WGT | |
| [68] | 1972 | Skin wettedness | ||
| [69] | 1974 | Predicted heart rate | PHR | |
| [70] | 1978 | Skin wittedness | ||
| [71] | 1979 | Fighter Index of Thermal Stress | FITS | |
| [72] | 1981 | Effective Heat Strain Index | EHSI | |
| [73] | 1982 | Predicted sweat loss | msw | |
| [74] | 1984 | Munich energy balance model for individuals | MEMI | |
| [74] | 1985 | Skin Temperature energy balance index | STEBIDEX | |
| [75] | 1985 | Heat Budget index | HEBIDEX | |
| [76] | 1996 | Cumulative Heat Strain Index | CHSI | |
| [77] | 1998 | Physiological Strain Index | PSI | |
| [78] | 1989 | Required sweating | SWreq | |
| [79] | 2001 | Predicted Heat strain | PHS | |
| [80] | 2001 | Environmental stress index | ESI | |
| [81] | 2005 | Wet bulb dry temperature | WBDT | |
| [82] | 2005 | Relative Humidity Dry Temperature | RHDT | |
| [83,84] | 2007 | Overheating Risk | OR | |
| [85] | 2010 | Thermal work limit | TWL | |
| [86] | 2013 | Equivalent Wet Bulb Globe Temperature | eWBGT |
| Metabolic Rate Class | Metabolic Rate W | Reference Value of WBGT | |
|---|---|---|---|
| PERSONS Acclimatized to Heat °C | Persons Unacclimatized to Heat °C | ||
| 0 Resting metabolic rate | 115 | 33 | 32 |
| 1 Low metabolic rate | 180 | 30 | 29 |
| 2 Moderate metabolic rate | 300 | 28 | 26 |
| 3 High metabolic rate | 415 | 26 | 23 |
| 4 Very high metabolic rate | 520 | 25 | 20 |
| Reference | Index | Symbol | Parameters | Year | Category |
|---|---|---|---|---|---|
| [99] | Wet bulb temperature | Tw | 1905 | Single parameter based | |
| [100] | Katathermometer | 1914 | |||
| [101] | Globe-Thermometer Temperature | GtT | 1930 | ||
| [102] | Effective Radiant Field | ERF | 1967 | ||
| [103] | Humiture or Heat Index | HI | Air temperature, humidity. | 1937 | Double parameters based |
| [104] | Craig Index | I | Heart rate, predicted body temperature | 1950 | |
| [105] | Oxford index | WD | Wet-bulb temperature, Dry-bulb temperature | 1957 | |
| [106] | Discomfort index | DI | Wet-bulb temperature, Dry-bulb temperature | 1957 | |
| [107] | Cumulative Discomfort Index (**) | CumDI | Wet-bulb temperature, Dry-bulb temperature | 1961 | |
| [108] | Humiture revisited | Air temperature, humidity. | 1960 | ||
| [109] | Relative Strain Index | RSI | Air temperature, water vapor pressure. | 1963 | |
| [110] | Temperature-Humidity Index | THI | Air temperature, Relative Humidity | 1977 | |
| [111] | Humidex | H | Air Temperature, water vapor pressure | 1979 | |
| [112] | Humisery | Air temperature, Relative Humidity | 1982 | ||
| [113] | Summer simmer Index | SSI | Air temperature, Relative Humidity | 1987 | |
| [114] | Modified discomfort index | MDI | Wet-bulb temperature, Dry-bulb temperature | 1998 | |
| [115] | New Summer Simmer Index | newSSI | Air temperature, Relative Humidity | 2000 | |
| [116] | Degree-hour criterion (**) | Air temperature, mean radiant temperature | 2007 | ||
| [117] | EsConTer Index | Wet-bulb temperature, Dry-bulb temperature | 2009 | ||
| [118] | ExceedanceM (**) | Air temperature, mean radiant temperature | 2010 | ||
| [119] | Effective temperature | ET | Dry-bulb temperature, air temperature, humidity, radiant conditions, air movements. | 1923 | Multi-parameters based |
| [120] | Equivalent temperature | Teq | Dry-bulb temperature, air temperature, radiant temperature, humidity. | 1929 | |
| [121] | Corrected effective temperature | CET | Dry-bulb temperature, air temperature, humidity, radiant conditions, air movements. | 1932 | |
| [122] | Standard Operative Temperature | SOpT | Air temperature, air velocity, solar radiation, body temperature. | 1937 | |
| [123] | Operative temperature | To | Air temperature, mean radiant temperature, air velocity | 1937 | |
| [124] | Thermal acceptance ratio | TAR | Vapor pressure, metabolic heat, skin temperature, evaporation, convection and radiation constants. | 1945 | |
| [125] | Corrected Effective Temperature | CET | Dry-bulb temperature, humidity, radiant conditions, air movements. | 1946 | |
| [126] | Resultant temperature | RT | Dry-bulb temperature, air temperature, humidity, radiant conditions, air movements. | 1948 | |
| [52] | Effective Temperature including radiantion | ETR | Dry-bulb temperature, air temperature, humidity, globe thermometer temperature, air movements. | 1957 | |
| [127] | Equatorial comfort index | ECI | Wet-bulb temperature, Dry-bulb temperature, air velocity, geographic coordinates | 1959 | |
| [128] | Cumulative Effective Temperature (**) | CumET | Dry-bulb temperature, air temperature, humidity, radiant conditions, air movements. | 1962 | |
| [91] | Predicted mean vote | PMV | Air temperature, relative humidity, mean radiant temperature and relative air velocity, metabolic activity, clothing. | 1970 | Multi-parameters based |
| [129] | New effective temperature | ET * | Dry-bulb temperature, air temperature, humidity, radiant conditions, air movements. | 1971 | |
| [130] | Humid operative temperature | TOH | Air temperature, mean radiant temperature, dew point temperature, skin temperature, air movements, clothing. | 1971 | |
| [131] | Apparent Temperature | AT | Air temperature, relative humidity, air velocity. | 1971 | |
| [132] | Standard effective temperature | SET | Dry-bulb temperature, air temperature, humidity, radiant conditions, air movements. | 1973 | |
| [133] | Apparent Temperature (revised) | AT | Air temperature, relative humidity, air velocity. | 1979 | |
| [134] | Equivalent Uniform Temperature | EUT | Air temperature, relative humidity, mean radiant temperature and relative air velocity, metabolic activity, clothing. | 1980 | |
| [135] | Predicted mean vote modified | PMV * | Air temperature, relative humidity, mean radiant temperature and relative air velocity, metabolic activity, clothing. | 1986 | |
| [136] | Tropical Summer Index | TSI | Wet-bulb temperature, globe temperature, Relative Humidity, | 1987 | |
| [137] | CIBSE Guide J-criterion | Dry-bulb temperature, mean radiant temperature, air velocity. | 2002 | ||
| [138] | PPD weighted criterion (**) | Air temperature, relative humidity, mean radiant temperature and relative air velocity, metabolic activity, clothing. | 2005 | ||
| [138] | Average PPD (**) | Air temperature, relative humidity, mean radiant temperature and relative air velocity, metabolic activity, clothing. | 2005 | ||
| [138] | Cumulative PPD (**) | Air temperature, relative humidity, mean radiant temperature and relative air velocity, metabolic activity, clothing. | 2005 | ||
| [116] | CIBSE Guide A-criterion | Dry-bulb temperature, mean radiant temperature, air velocity. | 2006 |
| Organic Pollutants | Inorganic Pollutants | Classical Pollutants |
|---|---|---|
| Acrylonitrile; Butadiene; Benzene; Carbon disulfide; Carbon monoxide; 1.2 Dichloromethane; Dichloromethane; Formaldehyde; Polycyclic aromatic hydrocarbons; Polychlorinated biphenyls; Styrene; Tetrachloroethylene; Toluene; Trichloroethylene; Vinyl chloride; Polychlorinated dibenzodioxins and dibenzofurans. | Arsenic; Asbestos; Cadmium; Chromium; Fluoride; Hydrogen sulfide; Lead; Manganese; Mercury; Nickel; Platinum; Vanadium | Particulate matter; Ozone and other photochemical oxidants; Nitrogen dioxide; Sulfur dioxide |
| Indoor Air Pollutants | ||
| Man-made vitreous fibers; Environmental tobacco smoke; Radon. |
| Pollutant | Symbol | Limit Values | Reference Period | Year of Latest WHO AQGs |
|---|---|---|---|---|
| Organic Pollutants | ||||
| Carbon disulphide | CS2 | 100 µg/m3 | 24 h | 1987 |
| 20 µg/m3 | 30 min | |||
| 1,2-Dichloroethane | EDC | 0.7 mg/m3 | 24 h | 2000 |
| Dichloromethane | DCM | 3.0 mg/m3 | 24 h | 2000 |
| Formaldehyde | 100 µg/m3 | 30 min | 2010 | |
| Styrene | 0.26 mg/m3 | Weekly | 2000 | |
| 70 µg/m3 | 30 min | |||
| Tetrachloroethylene | PERC | 0.25 mg/m3 | Annual | 2010 |
| 8 mg/m3 | 30 min | |||
| Toluene | 0.26 mg/m3 | Weekly | 2000 | |
| 1 mg/m3 | 30 min | |||
| Inorganic Pollutants | ||||
| Cadmium | Cd | 100 mg/m3 | 30 min | 2000 |
| Hydrogen sulphide | H2S | 150 µg/m3 | 24 h | 2000 |
| 7 µg/m3 | 30 min | |||
| Lead | Pb | 0.5 µg/m3 | Annual | 2000 |
| Manganese | Mn | 0.15 µg/m3 | Annual | 2000 |
| Mercury | Hg | 1 µg/m3 | Annual | 2000 |
| Vanadium pentoxide | 1 µg/m3 | 24 h | 1987 | |
| Classical Pollutants | ||||
| Particulate matter | PM2.5 | 10 µg/m3 | Annual | 2006 |
| 25 µg/m3 | 24 h | |||
| PM10 | 20 µg/m3 | Annual | ||
| 50 µg/m3 | 24 h | |||
| Ozone | O3 | 100 µg/m3 | 8 h | 2006 |
| Nitrogen dioxide | NO2 | 40 µg/m3 | Annual | 2010 |
| 200 µg/m3 | 1 h | |||
| Sulphur dioxide | SO2 | 20 µg/m3 | 24 h | 2006 |
| 500 µg/m3 | 10 min | |||
| Reference | Symbol | Pollutants | Category | Year |
|---|---|---|---|---|
| Any | One index per single pollutant * | |||
| [169] | CO2, TVOC | 2016 | ||
| [163,164] | BILGA | Any | Simple aggregation | 1996 |
| [164,170] | CLIM2000 | CO, CO2, NO2, formaldehyde | 1996 | |
| [164,170] | LHVP | CO, CO2, bacteria | 1998 | |
| [166,167,168] | IEI | CO, CO2, formaldehyde, TVOC, PM10 | 2002 | |
| [165] | IAQC | CO, CO2, formaldehyde, TVOC, PM10 | 2003 | |
| [172] | QUAD | Group A: CO2 Group B: NO2, SO2, O3 Group C: CO, formaldehyde, acetaldehyde, ethylbenzene, styrene, toluene, o-xylene, acetone Group D: PM2.5, PM10 | Aggregation according the sources of pollutants and/or type of pollutants | 2012 |
| [173] | IAPI | CO, CO2, formaldehyde, TVOC, PM2.5, PM10, fungi, bacteria | Aggregation accounting for the IAQ in the building stock | 2003 |
| [174] | DALY | Any | Aggregation by simple addition of health impacts | 2011 |
| [182] | PMVIAQ | CO2; PM10; HCHO | One index per single pollutant; and an overall index | 2017 |
| Symbol | Indicator | Time Constant | Threshold (2) |
|---|---|---|---|
| LEX,8h | Daily noise exposure level | 8 h | 80/85/87 dB(A) (3) |
| Ppeak | Peak sound pressure | 125 ms | 135/137/140 dB(C) (3) |
| LAmax | Maximum sound pressure level occurring in an interval | 125 ms | 35 dB(A) |
| SEL | Sound exposure level or sound pressure level over an interval normalised to 1 s | 1 s | 53 dB(A) |
| Lday | Average sound pressure level over a 1 day | 12 or 16 h | |
| Lnight(1) | Average sound pressure level over 1 night | 8 h | 42 dB(A) |
| L24h | Average sound pressure level over a whole day | 24 h | |
| Ldn | Average sound pressure level over a whole day getting to the night values a penalty of 10 dB | 24 h | |
| Lden(1) | Average sound pressure level over all days, evening and nights in a year getting a penalty of 5 dB to the evening values and a penalty of 10 dB for the night values | Year | 42 dB(A) |
| Reference | Acoustic Comfort Metric | Symbol | Category |
|---|---|---|---|
| A-weighted equivalent sound pressure level | LeqA | Sound pressure level | |
| A-weighted statistical levels | LA90, LA10, LA5 | ||
| Linear equivalent sound pressure level | Leqlin | ||
| [197] | Balanced noise criterion | NCB | |
| [198] | Combined noise index | CNI | |
| [199] | Preferred noise criterion | PNC | |
| [200] | Noise climate | (LA10–LA90) | |
| [201] | Noise criterion curves | NC | |
| [202] | Noise pollution level | LNP | |
| [203] | Noise rating curves | NR | |
| [204] | Office noise index | ONI | |
| [205] | Quality assessment index | QAI | |
| [206] | Room criterion | RC | |
| [207,208] | Room Criterion Mark II | RCmarkII | |
| [209] | Speech interference level | SIL | |
| [210] | Stevens’ loudness level | LLS | |
| [211] | Zwicker’s loudness level | LLZ | |
| [212] | Articulation index | AI | Architectural acoustic |
| [213] | Articulation loss of consonants | ALcons | |
| [214] | Clarity index | C80 | |
| [215] | Definition index | D50 | |
| [216,217] | Early decay time | EDT | |
| [218] | Late arriving sound/ Strength of the late arriving | Glate | |
| [219,220,221,222] | Reverberation time | RT30,RT60 | |
| [223] | Room Acoustic Speech Transmission Index | RASTI | |
| [224] | Room gain | GRG,0.5–2kHz | |
| [225] | Signal to noise ratio | S/N | |
| [214] | Speech clarity | C50 | |
| [226] | Speech Intelligibility Index | SII | |
| [227] | Speech Transmission Index | STI | |
| [223,228] | Speech Transmission Index for Public Access | STIPA | |
| [229] | Strength value | G | |
| [230] | Voice support | STV,0.5–2kHz | |
| [231] | Acoustic Performance index | AP | Building acoustic |
| [232] | Noise level produced by discontinuous service equipment | Lic | |
| [232] | Noise level produced by continuous service equipment | Lid | |
| [233] | Weighted normalized impact sound pressure level of floor | L’nw | |
| [234] | Weighted sound reduction index | R’w | |
| [235] | Weighted standardized sound level difference of facade | D2m,nt,w |
| Wavelength. Range (nm) | Exposure Limit Values | Units | Action Spectrum | Hazard | Effects |
|---|---|---|---|---|---|
| 180 ÷ 400 (UVA, UVB, UVC) | HEFF = 30 Daily value (8 h) | J/m2 | S(λ) | Actinic UV | Eye: Photokeratitis; Conjuctivitis; Cataractogenesis. Skin: Elastosis |
| 315 ÷ 400 (UVA) | HUVA = 104 Daily value (8 h) | J/m2 | UVA | Eye: Cataractogenesis | |
| 300 ÷ 700 (Blue Light) | LB = 106·t−1 for t ≤ 10,000 s | W/m2·sr | B(λ) | Retinal Blue-Light small source | Eye: Photoretinitis |
| LB = 100 for t > 10,000 s | |||||
| EB = 100·t−1 for t ≤ 10,000 s | W/m2 | B(λ) | Retinal Blue-Light small source | ||
| EB = 0.01 for t > 10,000 s | |||||
| 380 ÷ 1400 (Visible, IRA) | LR = (2.8·107)·Cα−1 for t >10 s | W/m2·sr | R(λ) | Retinal thermal | Eye: Retinal burn |
| LR = (5 × 10⁷)·Cα−1·t−0.25 for 10 µs ≤ t ≤ 10 s | |||||
| LR = (8.89 × 10⁸)·Cα−1 for t < 10 µs | |||||
| 780 ÷ 1400 (IRA) | LR= (6 × 10⁶) Cα−1 for t > 10 s | R(λ) | Retinal thermal-weak visual stimulus | Eye: Retinal burn | |
| LR = (5 × 10⁷)·Cα−1·t−0.25 for 10 µs ≤ t ≤ 10 s | |||||
| LR = (8.89 × 10⁸) Cα−1 for t < 10 µs | |||||
| 780 ÷ 3000 (IRA, IRB) | EIR = 18,000·t−0.75 for t ≤ 1000 s | W/m2 | Infrared radiation eye | Eye: Cornea burn; Cataractogenesis | |
| EIR = 100 for t > 1000 s | |||||
| 380 ÷ 3000 (Visible, IRA, IRB) | HSKIN = 20,000·t0.25 for t < 10 s | J/m2 | Thermal skin | Skin: Skin burn |
| Reference | Visual Comfort Metric | Symbol | Category |
|---|---|---|---|
| [266] | Illuminance | E (lx) | Amount of light |
| [266] | Illuminance uniformity | U | |
| [266] | Luminance | L (cd/m2) | |
| [266] | Luminance ratio | LR | |
| [267] | Scotopic/Photopic ratio | S/P ratio | |
| [268] | Color Discrimination Index | CDI | Color rendition |
| [269] | Color Preference Index | CPI | |
| [270] | Color Rendering Capacity | CRC | |
| [266] | Color Rendering Index | CRI | |
| [271] | Color Quality Scale | CQS | |
| [272] | Feeling of contrast Index | FCI | |
| [273] | Flattery Index | ||
| [274] | Gamut Area Index | GAI | |
| [275] | Memory color quality metric | S(a) | |
| [276] | Pointer’s new color rendering index | ||
| [277] | Annual Sunlight Exposure | ASE | Daylight availability |
| [278] | Continuous Daylight Autonomy | cDA | |
| [279] | Daylight Autonomy | DA | |
| [280] | Daylight Factor | DF | |
| [281] | Frequency of Visual Comfort | FVC | |
| [281] | Intensity Visual Discomfort | IVD | |
| [277] | Spatial Daylight Autonomy | sDA | |
| [282] | Useful Daylight Illuminance | UDI | |
| [283] | British Glare Index | Glare | |
| [284] | CIE Glare Index | CGI | |
| [285] | Discomfort Glare Index | DGI | |
| [286] | Discomfort Glare Probability | DGP | |
| [287] | Enhanced simplified Discomfort Glare Probability | eDGPs | |
| [284,288] | Great-room Glare Rating | GGR | |
| [289] | Hviid simplified Discomfort Glare Probability | DGPsHviid | |
| [290] | J-index | J | |
| [291] | New Discomfort Glare Index | DGIN | |
| [292] | Predicted Glare Sensation Vote | PGSV | |
| [293,294] | Unified Glare Rating | UGR | |
| [284,288] | Unified Glare Rating for small sources | UGRsmall | |
| [295] | Visual Comfort Probability | VCP | |
| [296] | Wienold Simplified Discomfort Glare Probability | DGPsWienold |
© 2020 by the authors. Licensee MDPI, Basel, Switzerland. This article is an open access article distributed under the terms and conditions of the Creative Commons Attribution (CC BY) license (http://creativecommons.org/licenses/by/4.0/).
Share and Cite
Fantozzi, F.; Rocca, M. An Extensive Collection of Evaluation Indicators to Assess Occupants’ Health and Comfort in Indoor Environment. Atmosphere 2020, 11, 90. https://doi.org/10.3390/atmos11010090
Fantozzi F, Rocca M. An Extensive Collection of Evaluation Indicators to Assess Occupants’ Health and Comfort in Indoor Environment. Atmosphere. 2020; 11(1):90. https://doi.org/10.3390/atmos11010090
Chicago/Turabian StyleFantozzi, Fabio, and Michele Rocca. 2020. "An Extensive Collection of Evaluation Indicators to Assess Occupants’ Health and Comfort in Indoor Environment" Atmosphere 11, no. 1: 90. https://doi.org/10.3390/atmos11010090
APA StyleFantozzi, F., & Rocca, M. (2020). An Extensive Collection of Evaluation Indicators to Assess Occupants’ Health and Comfort in Indoor Environment. Atmosphere, 11(1), 90. https://doi.org/10.3390/atmos11010090