1. Introduction
Climate change can trigger global and regional extreme climate events, such as water cycle disturbances, sea-level rise, and droughts, which destroy the natural ecological environment and threaten human survival [
1,
2,
3,
4]. These extreme climate events are closely related to abrupt temperature change and to warming hiatuses [
5,
6,
7,
8,
9]. Currently, the findings of the spatial variability in the years of abrupt temperature change and warming hiatuses, as well as the trends before and after these years in large regions that cover a variety of climate zones are lacking. This is conducive to the understanding of regional climate change and the limitation of coping with climate disasters under different temperature variation characteristics in the region. Additionally, the mechanisms are yet to be elucidated and represent an urgent need for further research.
Since the 1960s, the mutation theory has gradually matured and has been applied to the climate field [
10]. Abrupt temperature change is manifested as the phenomenon of a jump in temperature from one stable state (or a stable and continuous tendency) to another stable and steady-state (or a stable and continuous tendency), which represents a sharp change in temperature from one statistical property to another in space-time [
11]. Aiming at the factors such as the annual (seasonal) average temperatures [
12] and extreme temperatures [
13] and diurnal temperature [
14], studies have been carried out using methods such as the Mann-Kendall nonparametric test [
11], filtering detection [
15], and the filtering sliding
t-test [
16]. and studies have demonstrated that global average temperatures in the 20th century have exhibited warm-cold-warm variations and experienced an abrupt increase in the 1970s [
17], and abrupt global temperature change was unsynchronized over a long time scale [
18], and there was a difference in cooling or warming after the abrupt change [
19,
20]. The Northern Hemisphere experienced a sudden temperature change in the 1960s [
21,
22], and regions including Central Asia [
23], northeast Asia [
24], and China [
25] experienced sudden temperature changes between 1970 and 2000. The factors such as the Earth’s orbital eccentricity, change of inclination, and interdecadal abrupt changes in atmospheric circulation [
26,
27] all affect abrupt temperature changes.
The temperatures increased rapidly over a period of time following an abrupt change in the 20th century until 1998 or 2007 [
6], when the global or some regional temperatures showed a rise “hiatus”, namely, the warming hiatus phenomenon, and this event caused widespread concern in the international community [
28]. The warming hiatus occurred in regions such as Eurasia [
29], North America [
30], the North Atlantic [
31], and China [
32], and the global warming hiatus in the Northern Hemisphere was more pronounced in winter than in summer [
33]. Some researchers believe that the sunspots in the weakened phase [
31], volcanic aerosols reflecting sunlight [
32], and stratospheric water vapor forcing [
34] all slow global warming. However, there is still considerable controversy regarding warming hiatuses. There are different views on the duration and mechanism of warming hiatuses. Some researchers even question the existence of warming hiatuses [
35,
36,
37] and argue that the slowdown of the temperature increase since 1998 is only a short-term fluctuation in climate change and that global temperatures will continue to rise [
38]. Regardless of whether the global warming hiatus is temporary or long-term, this hiatus has an important impact on global climate change, sustainable socioeconomic development, and the rational use of resources [
34]. Therefore, it is of practical significance to determine the patterns and spatial variabilities in the climate warming hiatus years.
In summary, most existing studies on abrupt temperature changes and warming hiatuses have used regional average temperatures as the research parameter and have ignored spatial variability. A warming hiatus year is determined as a global composite hiatus year (1998). The regional characteristics and modes are masked by the global average, resulting in an inability to examine the spatial variability of a warming hiatus year. Average temperature alone as a research element is not enough to cover the general characteristics of temperature [
39], there is a big difference between the average temperature and the average minimum temperature and the average maximum temperature. For example, the increase in the minimum temperature is more than two times greater than the increase in the maximum temperature in Puerto Rico [
40], the percent of days having very warm maximum or minimum temperatures increased strongly since the late 1950s while the percent of days with very cold temperatures decreased in Caribbean region [
41]. Studies of abrupt temperature changes and warming hiatuses are mostly carried out at an annual scale and rarely at seasonal or monthly scales. The meteorological stations used are widely dispersed and provide short data series. Most previous studies have separately investigated the characteristics of abrupt temperature changes and warming hiatuses. Research findings on the combination of these two factors over a long period to reveal the spatial variability in their variation trends before and after the abrupt changes and hiatuses are scarce.
Thus, China, which is situated in eastern Asia with its diverse climates and complex underlying surfaces, was selected as the study area to research on the spatial variability in the years with abrupt temperature changes and with warming hiatuses, as well as the variation trends before and after these years. There are numerous studies addressing abrupt temperature changes and warming hiatuses in China that cover the entire country [
12,
28,
33], as well as northern China [
6], Northwest China, North China, and Northeast China [
42,
43,
44], and typical areas of the Yellow River Basin [
45]. The overall trend of temperature change in China is similar to but different from that in the Northern Hemisphere [
25]. In the early 1960s, the climate in China changed from warmer to colder [
46]. In the 1980s, the average temperatures in Northeast China and North China rose abruptly. The abrupt change for the farming-pastoral ecotone of northern China appeared successively later, roughly in the order of winter, spring, fall, and summer [
13]. The warming hiatuses in the typical regions of northern China and the Yellow River Basin were concentrated between 1997 and 2007 [
6,
45]. In most previous studies, the regional average values were adopted, and the year of the warming hiatus was determined to be 1998. However, research findings from a combination of these two factors to reveal the spatial variability in the variation trends are scarce. In the present study, based on the monthly average minimum temperatures (Tnav), average temperatures (Tav), and average maximum temperature (Txav) data from 622 high-density meteorological stations in China from 1951–2018, The spatial pattern of seasonal abrupt temperature changes, warming hiatuses year and temperature change trend is revealed. This study aims to enrich the research findings for climate change and provides a basis for understanding regional climate change and coping with climate disasters.
2. Data and Methods
In this study, datasets from 622 meteorological stations distributed across China were used, including the monthly data of Tnavs, Tav, and Txav from stations that were established up to 2018, and are available from the China Meteorological Data Service Center (China meteorological data network. Available online:
http://data.cma.cn/). The three types of temperature data from each meteorological station show no remarkable abrupt change points or random variations, and the data variations are relatively uniform and consistent and represent the temperature conditions in the study area.
In the present study, the data during the 1951 to 2018 period were used for consistency [
47]. Any missing data were interpolated or extrapolated using correlation and regression analysis methods, as shown in the following formula:
where
= Correlation coefficient of temperature factors x and y;
= Values of temperature factors
x and
y corresponding to the jth year;
= Multiyear average values of temperature factors
x and
y;
n = Sample length (years).
The Mann-Kendall (M-K) nonparametric statistical method was used for the abrupt temperature change test, using the following formula [
48]:
where
= Approximate standard normal distribution;
= Cumulative number of cases in which the value at time
i is greater than value at time
j;
= Mean value of the cumulative number
;
= Variance in the cumulative number
.
If there is only one intersection point between the
UF and
UB lines and this point is within the reliability lines, this intersection point is the year of the abrupt change. If the intersection point of the two lines is outside the reliability lines or if multiple abrupt change points are detected, the moving
t-test technique is used to determine the abrupt change point after further verification, with the following formula [
41]:
For a time series
x with a sample size
n, the multiple abrupt change points detected by the M-K test are set as the reference points. The subseries before and after the reference points,
and
, have a sample size of
and
, respectively, means of
and
, respectively, and variances of
and
, respectively. The statistic is defined as follows:
where
, and the above formula follows a distribution with degrees of freedom of
.
Given a significance level , the critical value of is obtained from the t distribution table. If , then an abrupt change is considered to have occurred at the reference point, otherwise, no abrupt change has occurred.
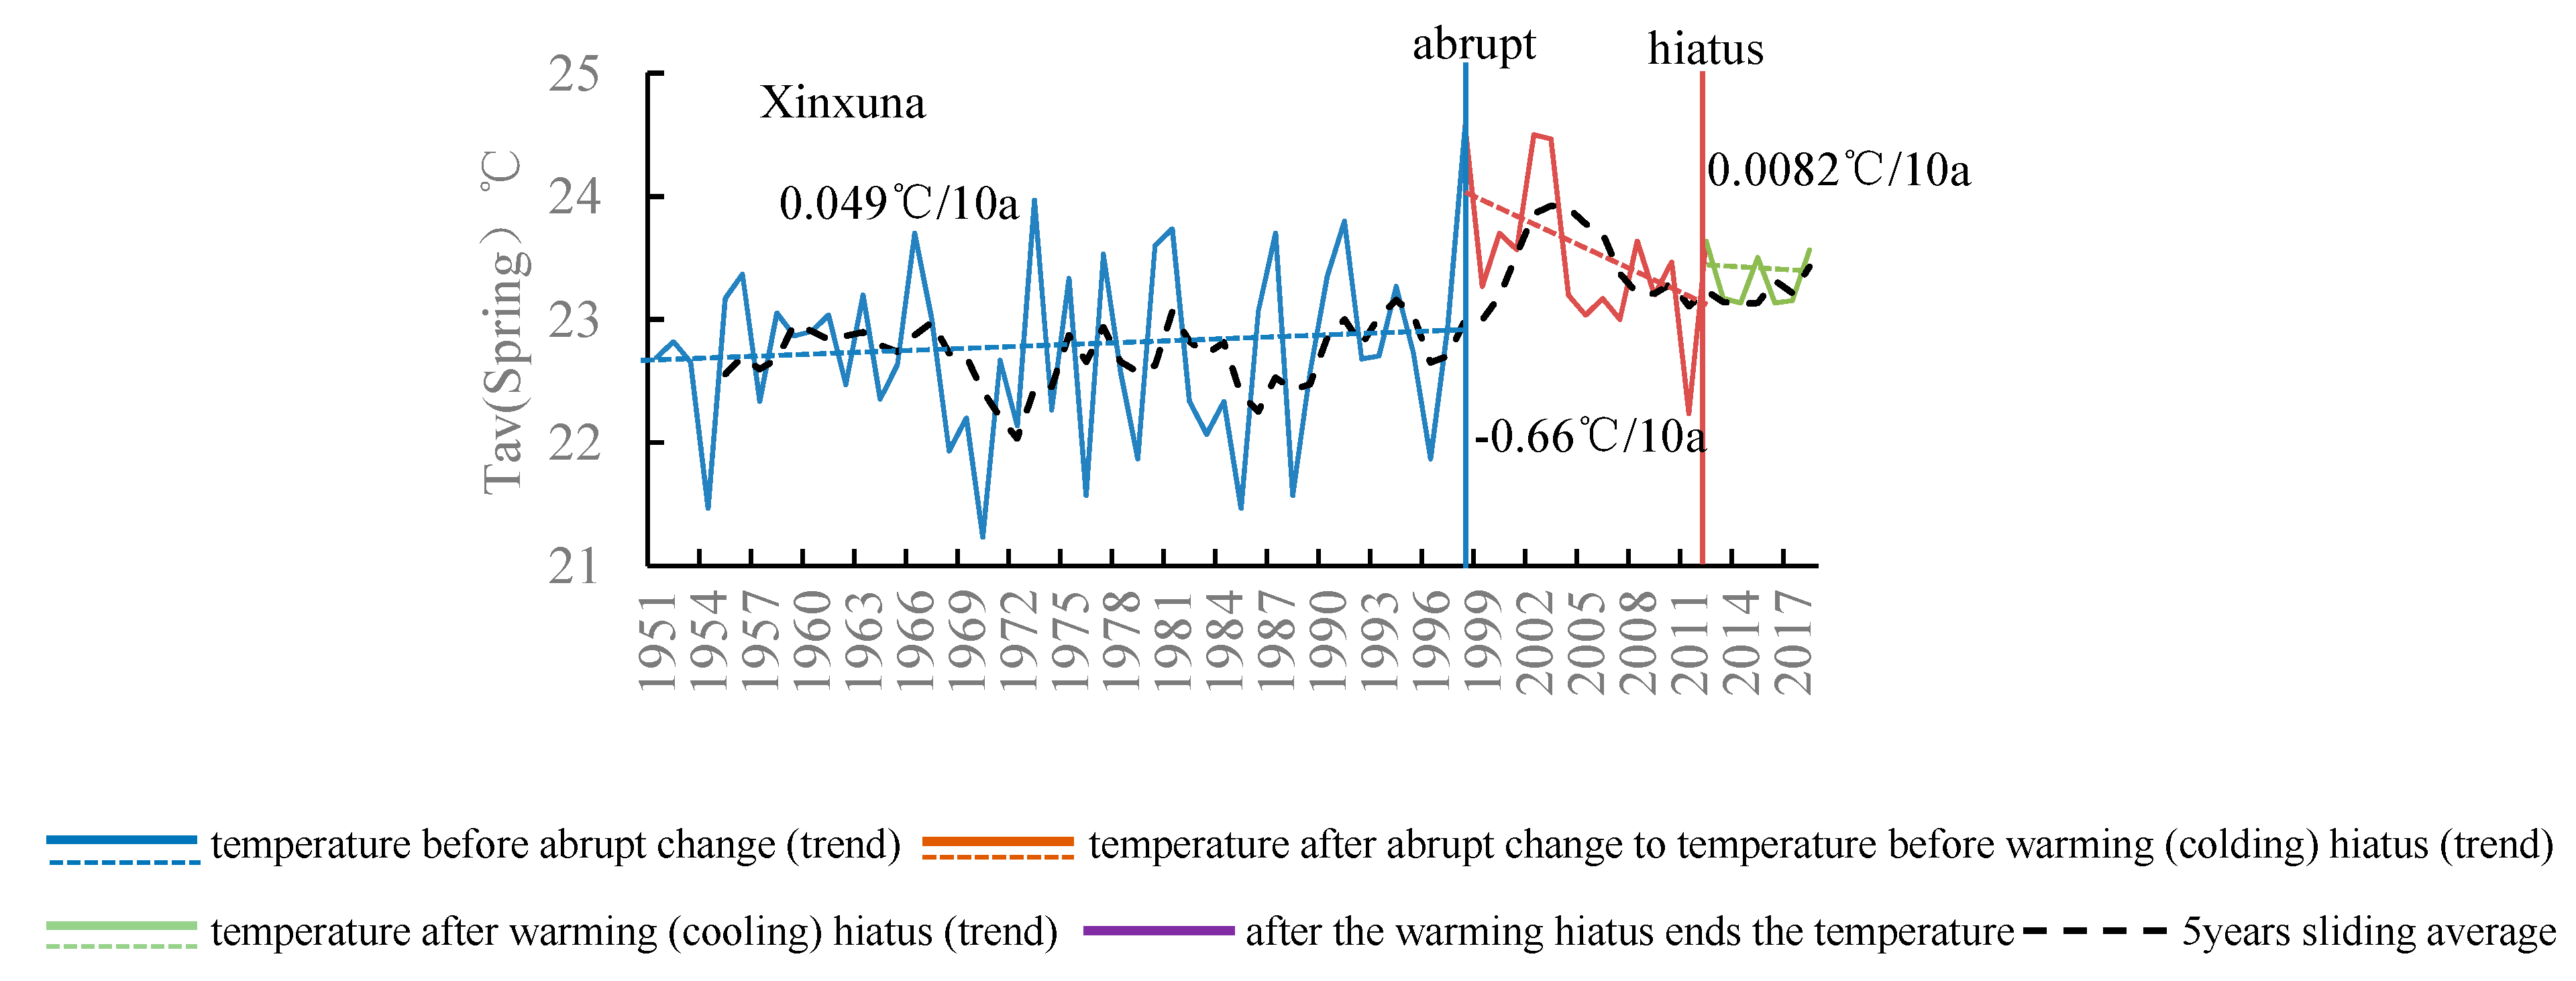
The years when a warming (cooling) hiatus and warming (cooling) hiatus ended after an abrupt change are determined by using the annual temperature series and the phased trend line combined with a three to five-year moving value series trend. After an abrupt temperature change, the warming hiatus year is determined as the year when the climate tendency rate reaches a relative maximum and the climate trend rate is less than or equal to 0.1 °C/10a for the range of this year to the end of the series (2018) or to a specified year before 2018. If the climate tendency rate after the abrupt change is negative, the same method can be used to determine the cooling hiatus year. The hiatus end year is defined as the year when temperatures rise again after the temperature hiatus and before the end of the series [
49]. The process is illustrated with representative stations (
Figure 1).
The temperature variation trend is analyzed by the climate tendency rate method, using the following formula:
where
y = One of the three temperature types;
t = Time;
a = A positive value indicates that the temperature
y exhibits a linear upward trend in a statistical time period, and a negative value indicates a downward trend.
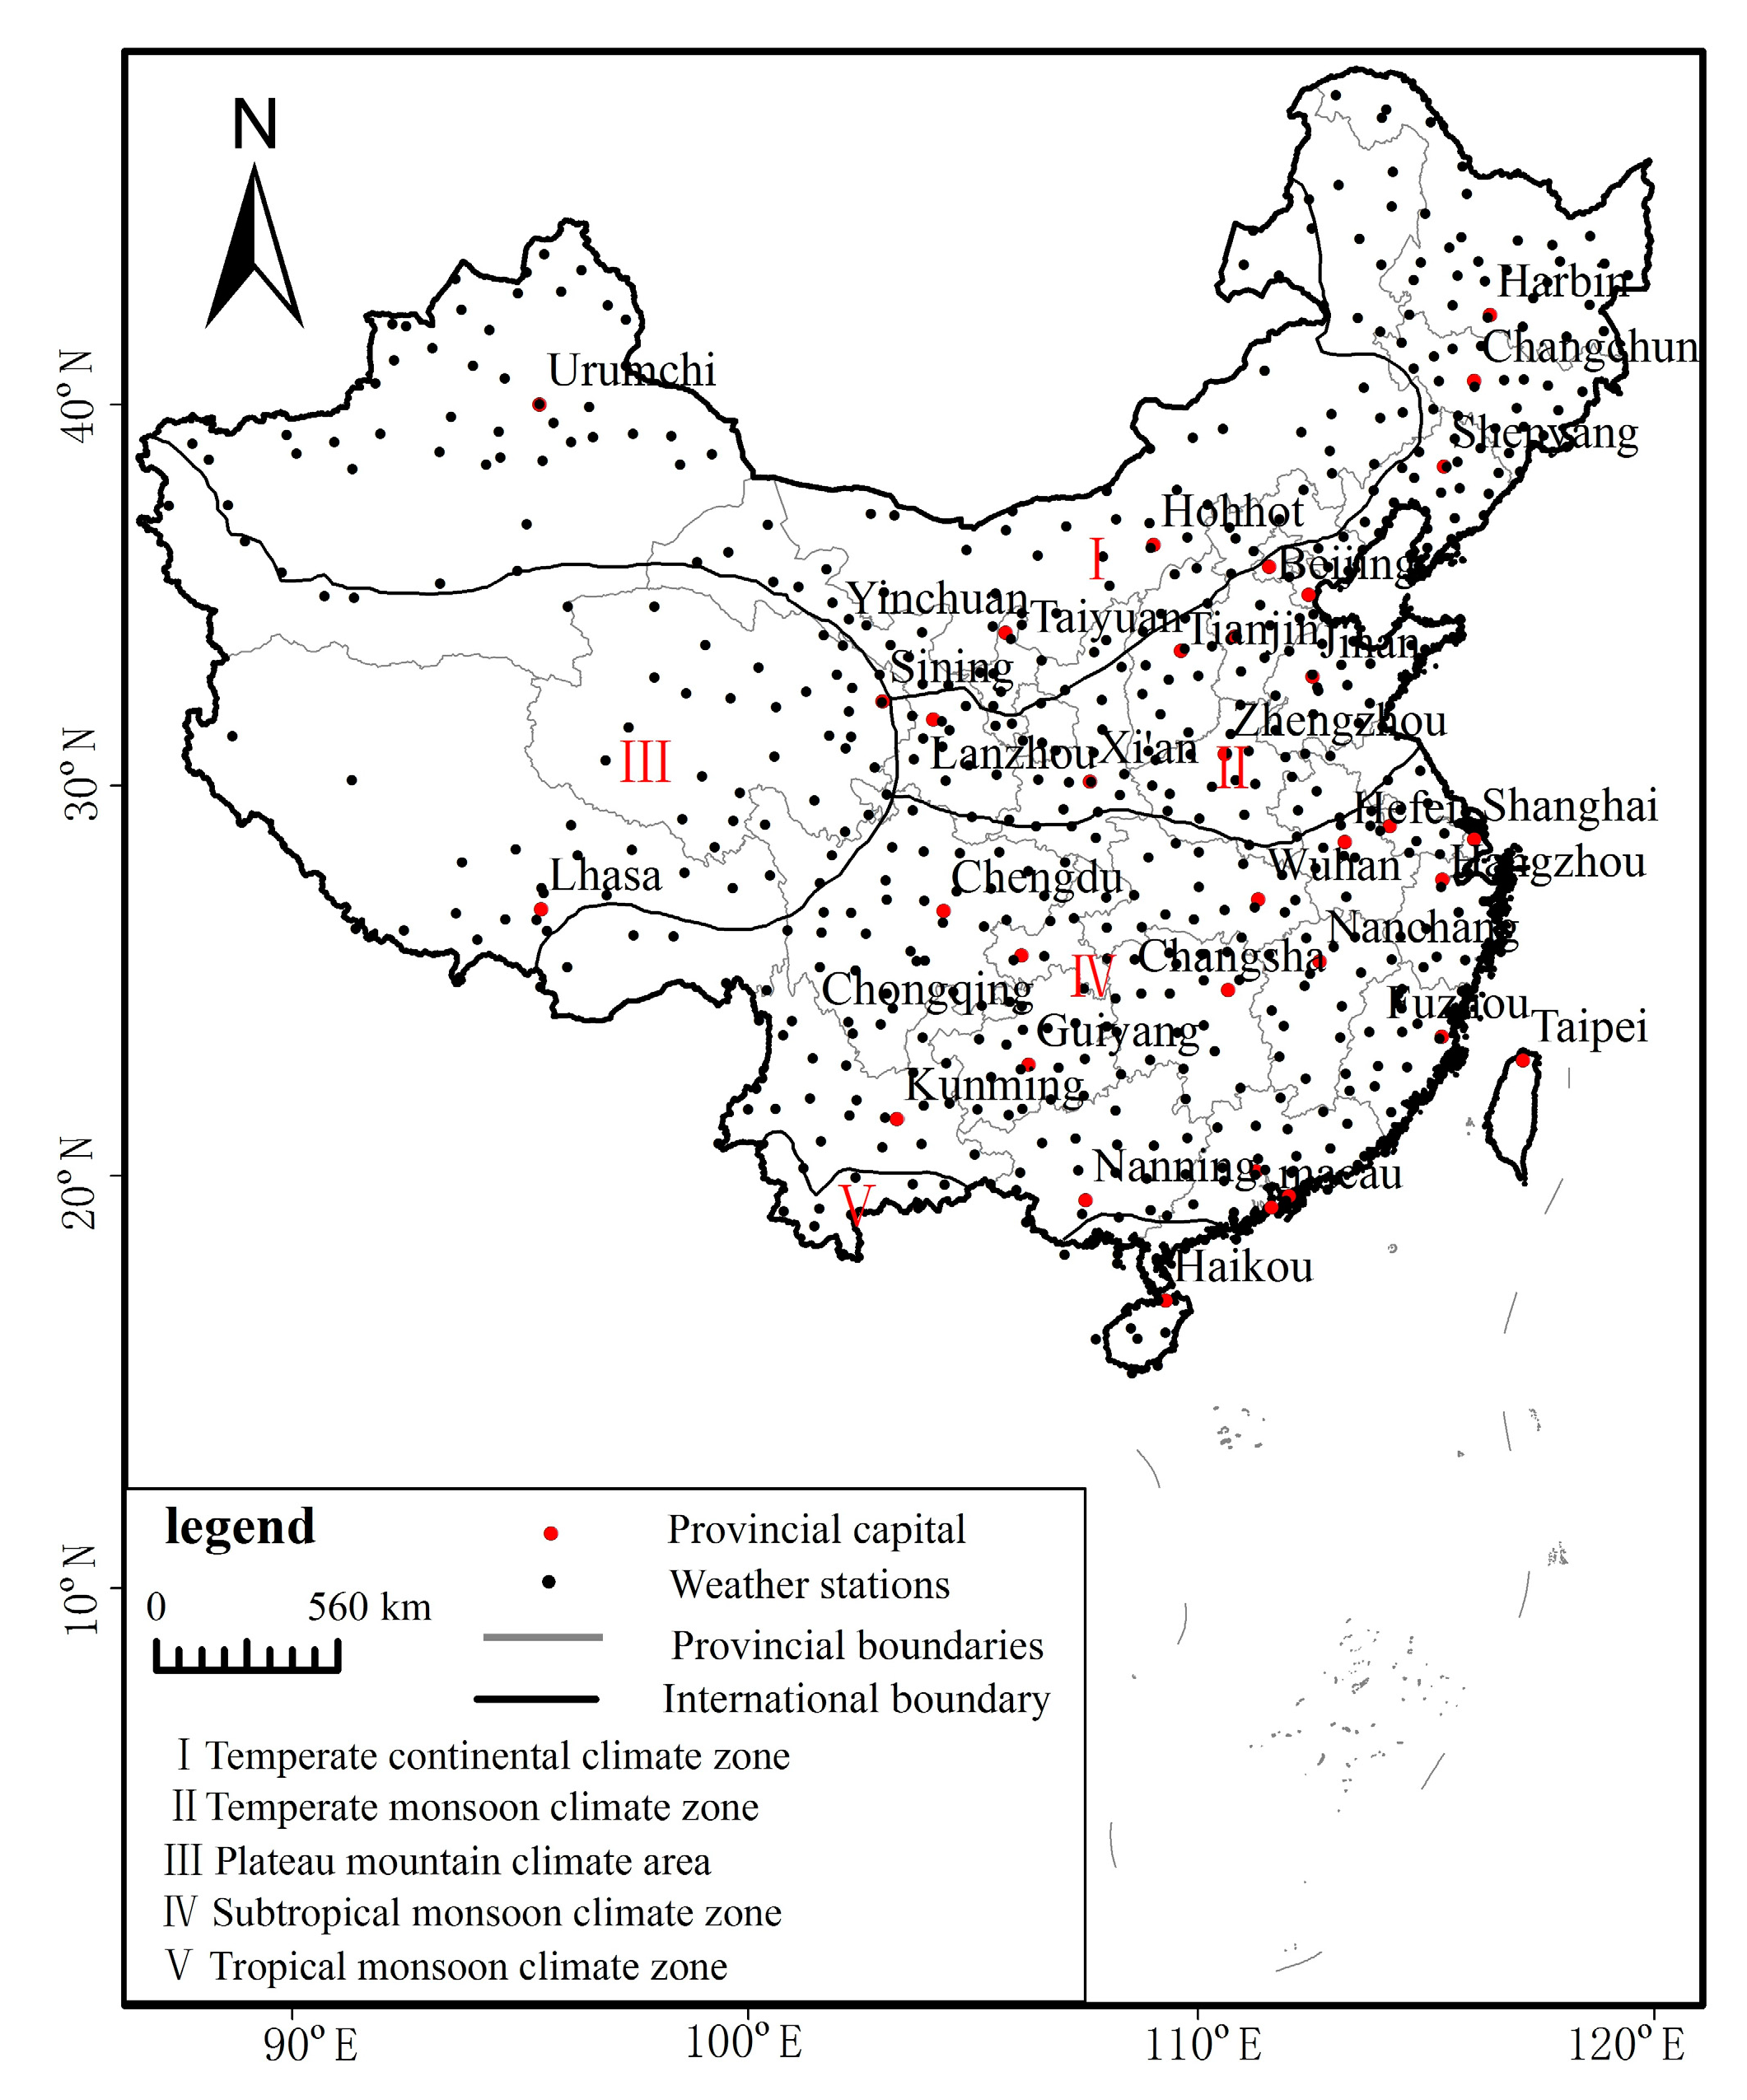
The spatial variations for the years of abrupt temperature change and warming (cooling) hiatuses, as well as the change rates before and after these years, were analyzed using spatial statistical methods and geographic information system analysis software. The meteorological data surrounding the Taiwan region were not collected and thus were not analyzed. Additionally, due to space limitations, the interpolation map for the Chinese mainland is used consistently in the paper. A complete Chinese territory map is shown in
Figure 2.
3. Results
3.1. Spatial Distribution in Abrupt Temperature Change
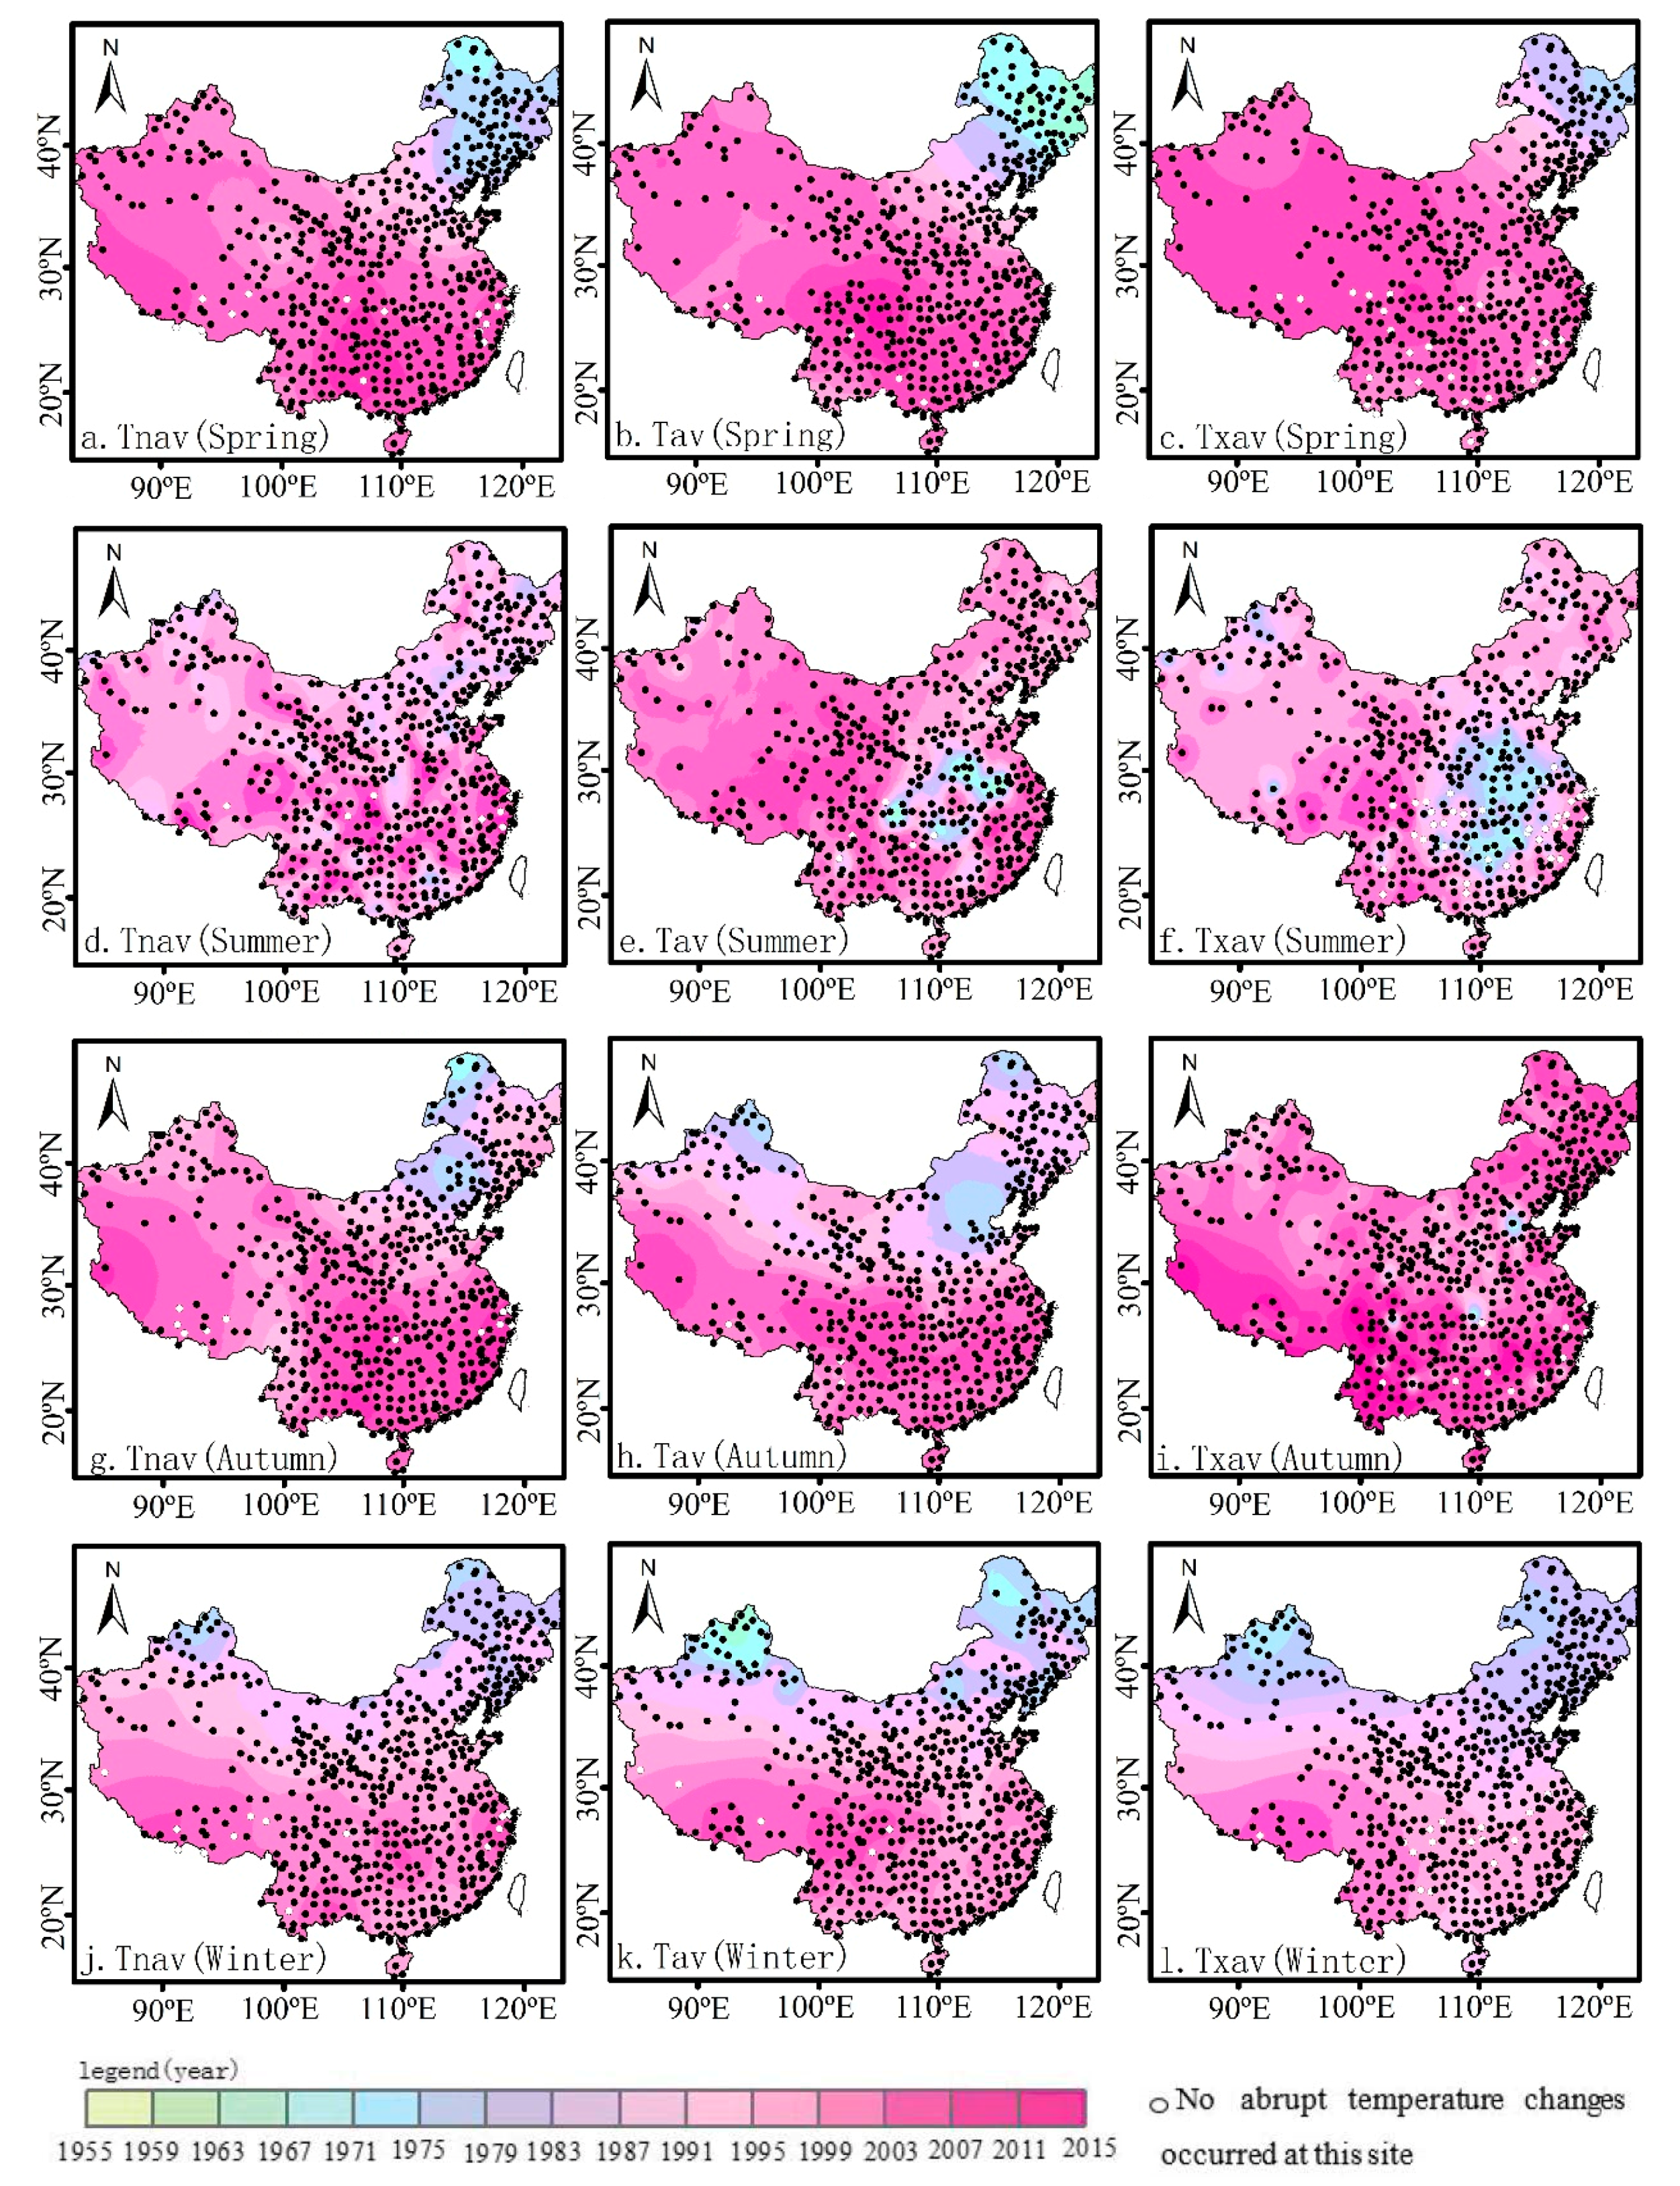
Figure 3 shows the spatial distribution of the years of abrupt changes in Tnav, Tav, and Txav for each season. Abrupt changes were observed at most of the stations with a few exceptions. Most of these exceptions were concentrated in regions near and south of 30° N, which is consistent with the results of previous studies [
19]. The number of stations showing no abrupt change in Txav was greatest in summer (38 stations) and lowest in spring (six stations). Overall, most of the stations showing no significant abrupt changes were concentrated in southern China, while clear abrupt change trends were observed in northern China, which may be attributed to the impact of the East Asian monsoon and even global atmospheric circulation [
19]. Overall, the abrupt changes in the three temperature types during winter as well as for the Tnav and Tav during fall gradually became later from north to south. Among these changes, the abrupt changes in the temperate continental climate zone and the temperate monsoon climate zone gradually occurred later from northeast to southwest; the abrupt changes in the plateau mountain climate zone gradually occurred later from north to south, which is consistent with the overall abrupt change pattern. The abrupt change times for the subtropical monsoon climate zone and the tropical monsoon climate zone were close to each other and both relative, as these times were concentrated after 2000. The overall abrupt changes in the Txav during fall occurred relatively late (after the 1990s), and the abrupt changes occurred relatively early only for a few regions in the mountains of northern Hebei and southern Hubei (1967–1975).
During spring, abrupt changes in the three temperatures types occurred first in northeastern North China (east of 120° E, 1967–1983), and the ranges corresponding to the early abrupt changes in the Tav, Tnav, and Txav decreased gradually. The abrupt changes in other regions were concentrated after the 1990s, and the abrupt changes in the regions centered in the Sichuan Basin and the southwestern Tibetan Plateau and the surrounding regions gradually occurred earlier. During summer, the abrupt changes in the Tav and Txav occurred first in the plains of the middle and lower reaches of the Yangtze River. The spatiotemporal distributions of the abrupt changes in the summer Tnav and in the fall Txav were similar, but overall the latter was later than the former. Generally, the abrupt changes in the three temperature types occurred in different orders in different seasons. In both spring and fall, the abrupt changes occurred successively in the order of Tav, Tnav, and Txav. During summer, the abrupt changes occurred successively in the order of Txav, Tav, and Tnav. During winter, the abrupt changes occurred successively in the order of Tav, Txav, and Tnav.
The abrupt changes in the three temperature types each occurred in different order of seasons. The abrupt changes in the Tnav occurred successively in the order of winter, spring, fall, and summer; the abrupt changes in the Tav occurred successively in the order of winter, fall, summer, and spring; and the abrupt change in the Txav occurred successively in the order of winter, summer, spring, and fall. Hence, there was large spatiotemporal variability in the abrupt changes in the three temperature types in different seasons.
3.2. Spatial Distribution in Warming (Cooling) Hiatus Years
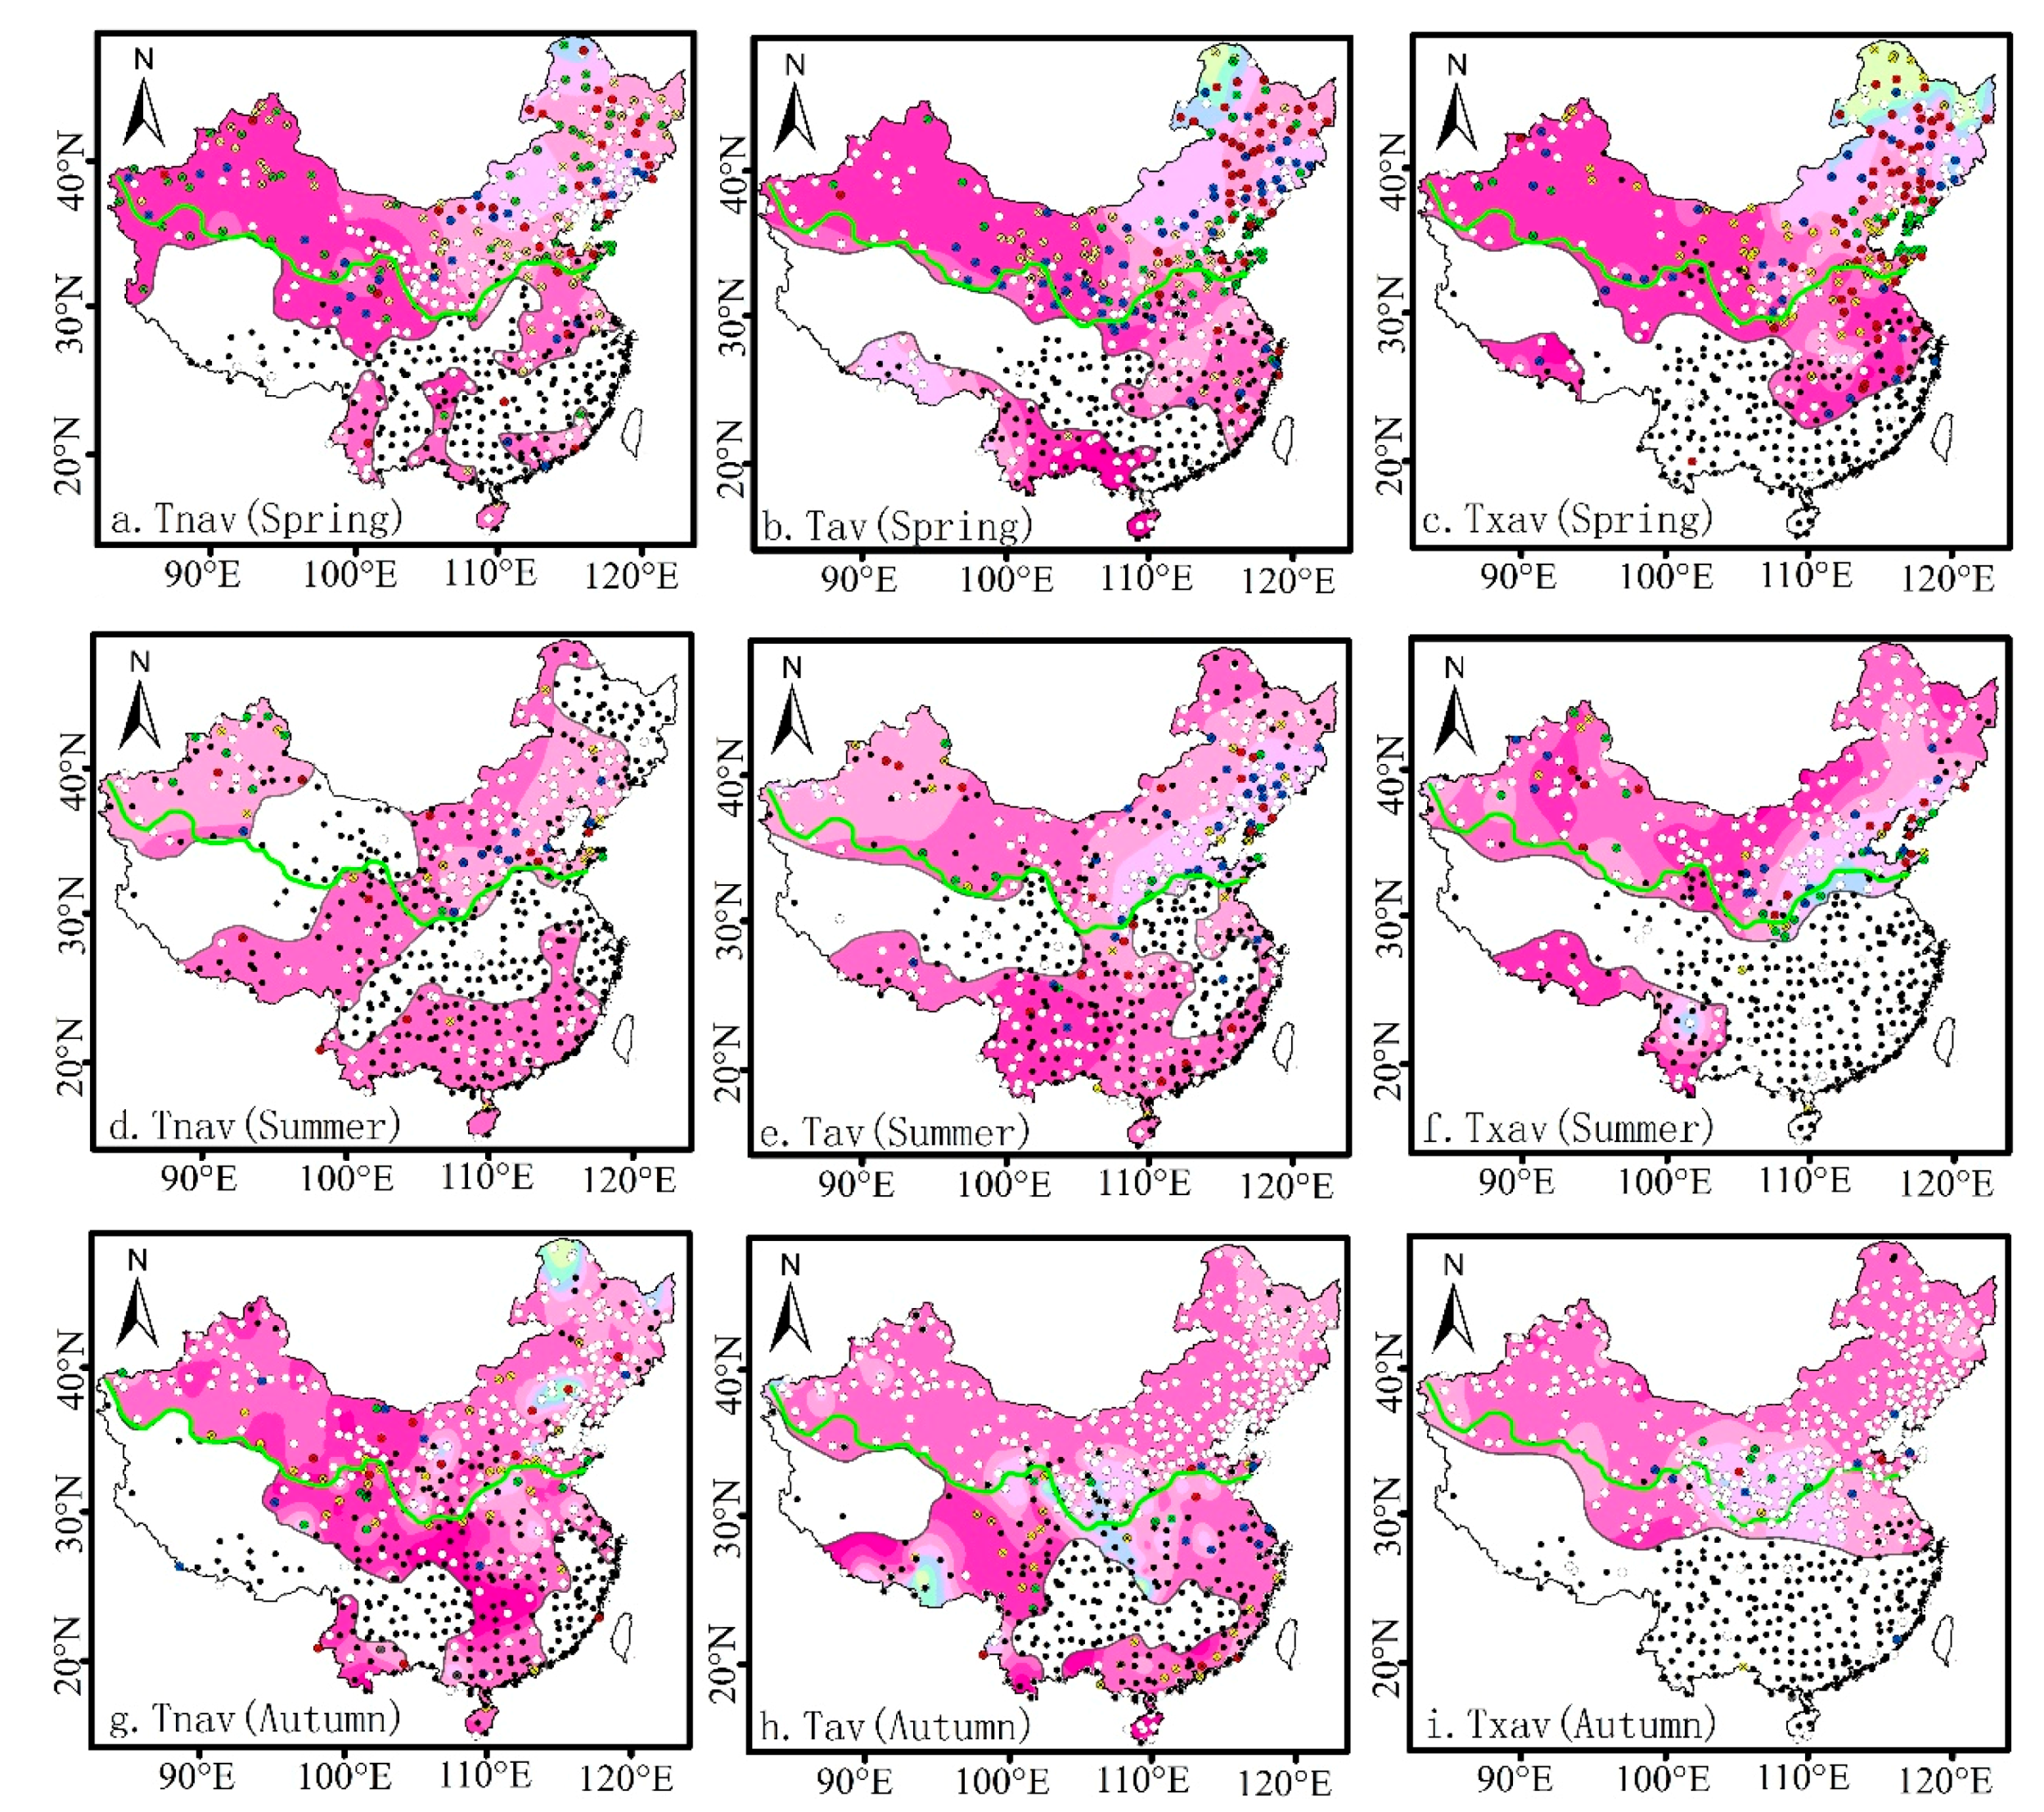
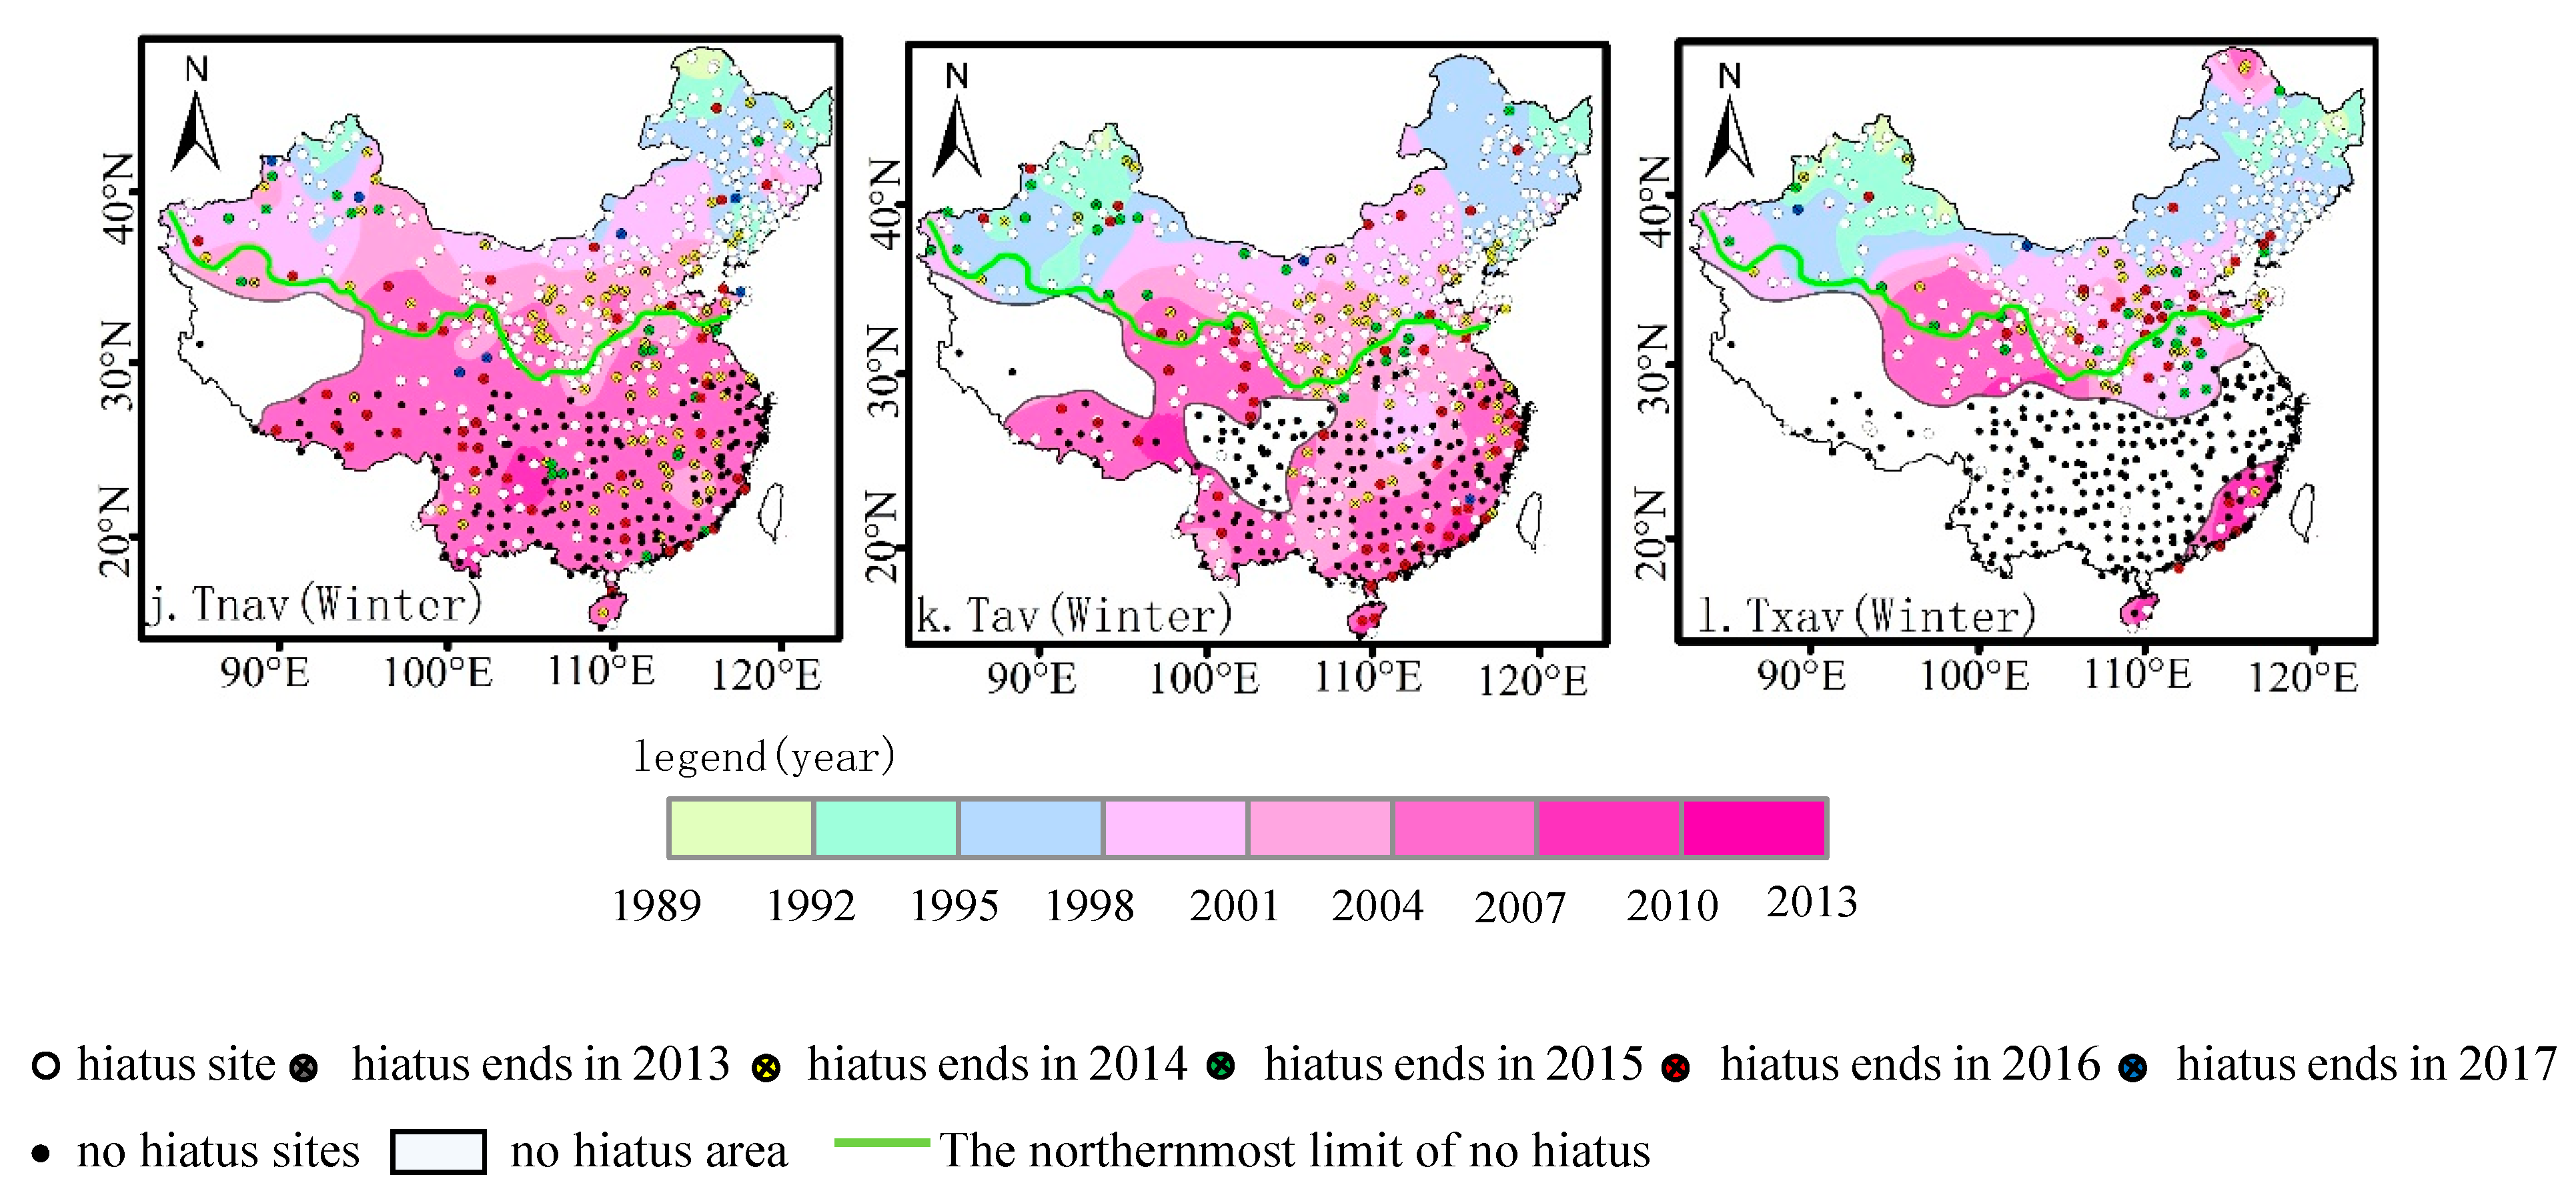
Figure 4 shows the spatial distribution of the Tnav, Tav, and Txav for different seasons in the warming (cooling) hiatus years. Beginning in the late 1980s, the rate of temperature increase (decrease) at some stations gradually slowed, leading to a warming (cooling) hiatus. The hiatus stations accounted for more than half of the stations in the study area and exhibited spatial variability. During each season, regions with no warming (cooling) hiatus were not part of the spatial interpolation, and such regions were called nonhiatus regions. When a small number of nonhiatus stations and a large range of hiatus stations were distributed in a staggered manner, spatial interpolation was carried out for the years with hiatus stations. The nonhiatus regions were superimposed to draw the northernmost non-hiatus boundary. The figure shows that the northernmost boundary with no warming (cooling) hiatus was generally distributed along the northern boundaries of the plateau mountain climate zone and the subtropical monsoon climate zone.
In certain years between 2013 and 2017 after a warming (cooling) hiatus, the temperatures again showed a clear upward trend. When the warming (cooling) hiatus ended, there were approximately 150 to 180 stations showing the end of the hiatus. The stations where the hiatuses-ended showed different spatial distributions for different seasons and for different temperature types. The hiatus duration from start to finish was approximately nine to 17 years.
Overall, the warming (cooling) hiatus for the Tnav occurred successively in the order of winter, fall, spring, and summer; the warming (cooling) hiatus for the Tav and Txav occurred successively in the order of winter, spring, fall, and summer. For all three temperature types, the hiatus occurred earliest in winter and occurred latest in summer, and the time for the warming (cooling) hiatus in winter became later with decreasing latitude. The warming (cooling) hiatus for the Txav occurred first during spring, summer, and winter, while the hiatus for the Tnav occurred slightly later, and the hiatus for the Tnav occurred latest. During fall, the warming (cooling) hiatus in the Tnav occurred earlier than that of the Tav, which occurred earlier than that of the Txav.
During spring, the warming (cooling) hiatus for the three temperature types occurred earliest in northeastern Inner Mongolia and northern Heilongjiang (1989–1995). This hiatus gradually occurred later in the southward and westward directions and occurred latest in the northwestern region (2007–2013). The range of nonhiatus regions for the Txav was greater than the range for the Tav, and the range for the Tnav was the smallest.
During summer, the hiatuses for the three temperature types generally gradually occurred later from east to west, and to some extent, the hiatus occurred earlier at the western boundary of the Kunlun Mountains-North China region. The warming (cooling) hiatus occurred between 2004 and 2007 for most stations. There were nonhiatus regions for the Tnav to the north of the northernmost nonhiatus boundary and they were concentrated in the northwest and northeast areas, where the nonhiatus area was the largest.
During fall, the years of warming (cooling) hiatuses for the three temperature types differed significantly in terms of their spatial distributions. The warming (cooling) hiatus of the Tnav occurred earliest in northeastern Inner Mongolia (1989–1998), and the nonhiatus regions were concentrated in the high-altitude Tibetan Plateau, Yunnan-Guizhou Plateau, and the low-altitude Zhejiang-Fujian hilly region. The warming (cooling) hiatus for the Tav first occurred near Shigatse and the areas south of the Loess Plateau, and the warming (cooling) hiatus occurred in the area north of the northernmost hiatus boundary of the nonhiatus regions between 2001–2007, while the stations where the hiatus had ended were also concentrated in this area. The warming (cooling) hiatus for the Txav first occurred in northeastern North China, and the hiatus gradually occurred later in the surrounding areas. There was no warming (cooling) hiatus in most areas south of 30° N, where the nonhiatus range was the greatest.
During winter, the overall warming (cooling) hiatus occurred early, and this hiatus gradually occurred later from north to south; the warming (cooling) hiatus first occurred in Northeast China, North China, and in northern Northwest China (1989–1998), and it gradually occurred later to the south (1998–2004). In northern China, there was a pattern where the warming (cooling) hiatus of the high-altitude areas occurred later than in the low-altitude areas and that the warming (cooling) hiatus of the low-latitude areas occurred later than for the high-latitude areas. The hiatuses for the three temperature types were mostly concentrated at the stations with 1998, 2002, and 2008 stations, while the nonhiatus regions were concentrated in the plateau mountainous climate zone and the subtropical monsoon climate zone.
The Tnav, Tav, and Txav were divided into three time periods. The first period was from 1951 to the abrupt change year (T1)—a small number of stations with no abrupt change were removed in the interpolation analysis. The second period was from the abrupt changes year to the warming (cooling) hiatus year (T2)—for stations with no warming (cooling) hiatuses, the period T2 was always set as from the abrupt change year to 2018. The third time period was from the warming (cooling) hiatus year to the hiatus-ended year (T3)—the hiatuses for most stations had not ended as of 2018, while the hiatuses for some stations ended between 2013 and 2017, and the temperatures showed a subsequent upward trend. This trend was due to the availability of only a short period of data after the hiatus ended for the latter case, and the period of temperature increase after the warming (cooling) hiatus ended was not separately analyzed in the present study.
3.3. Spatial Distribution of Climate Trend Rate in Period T1
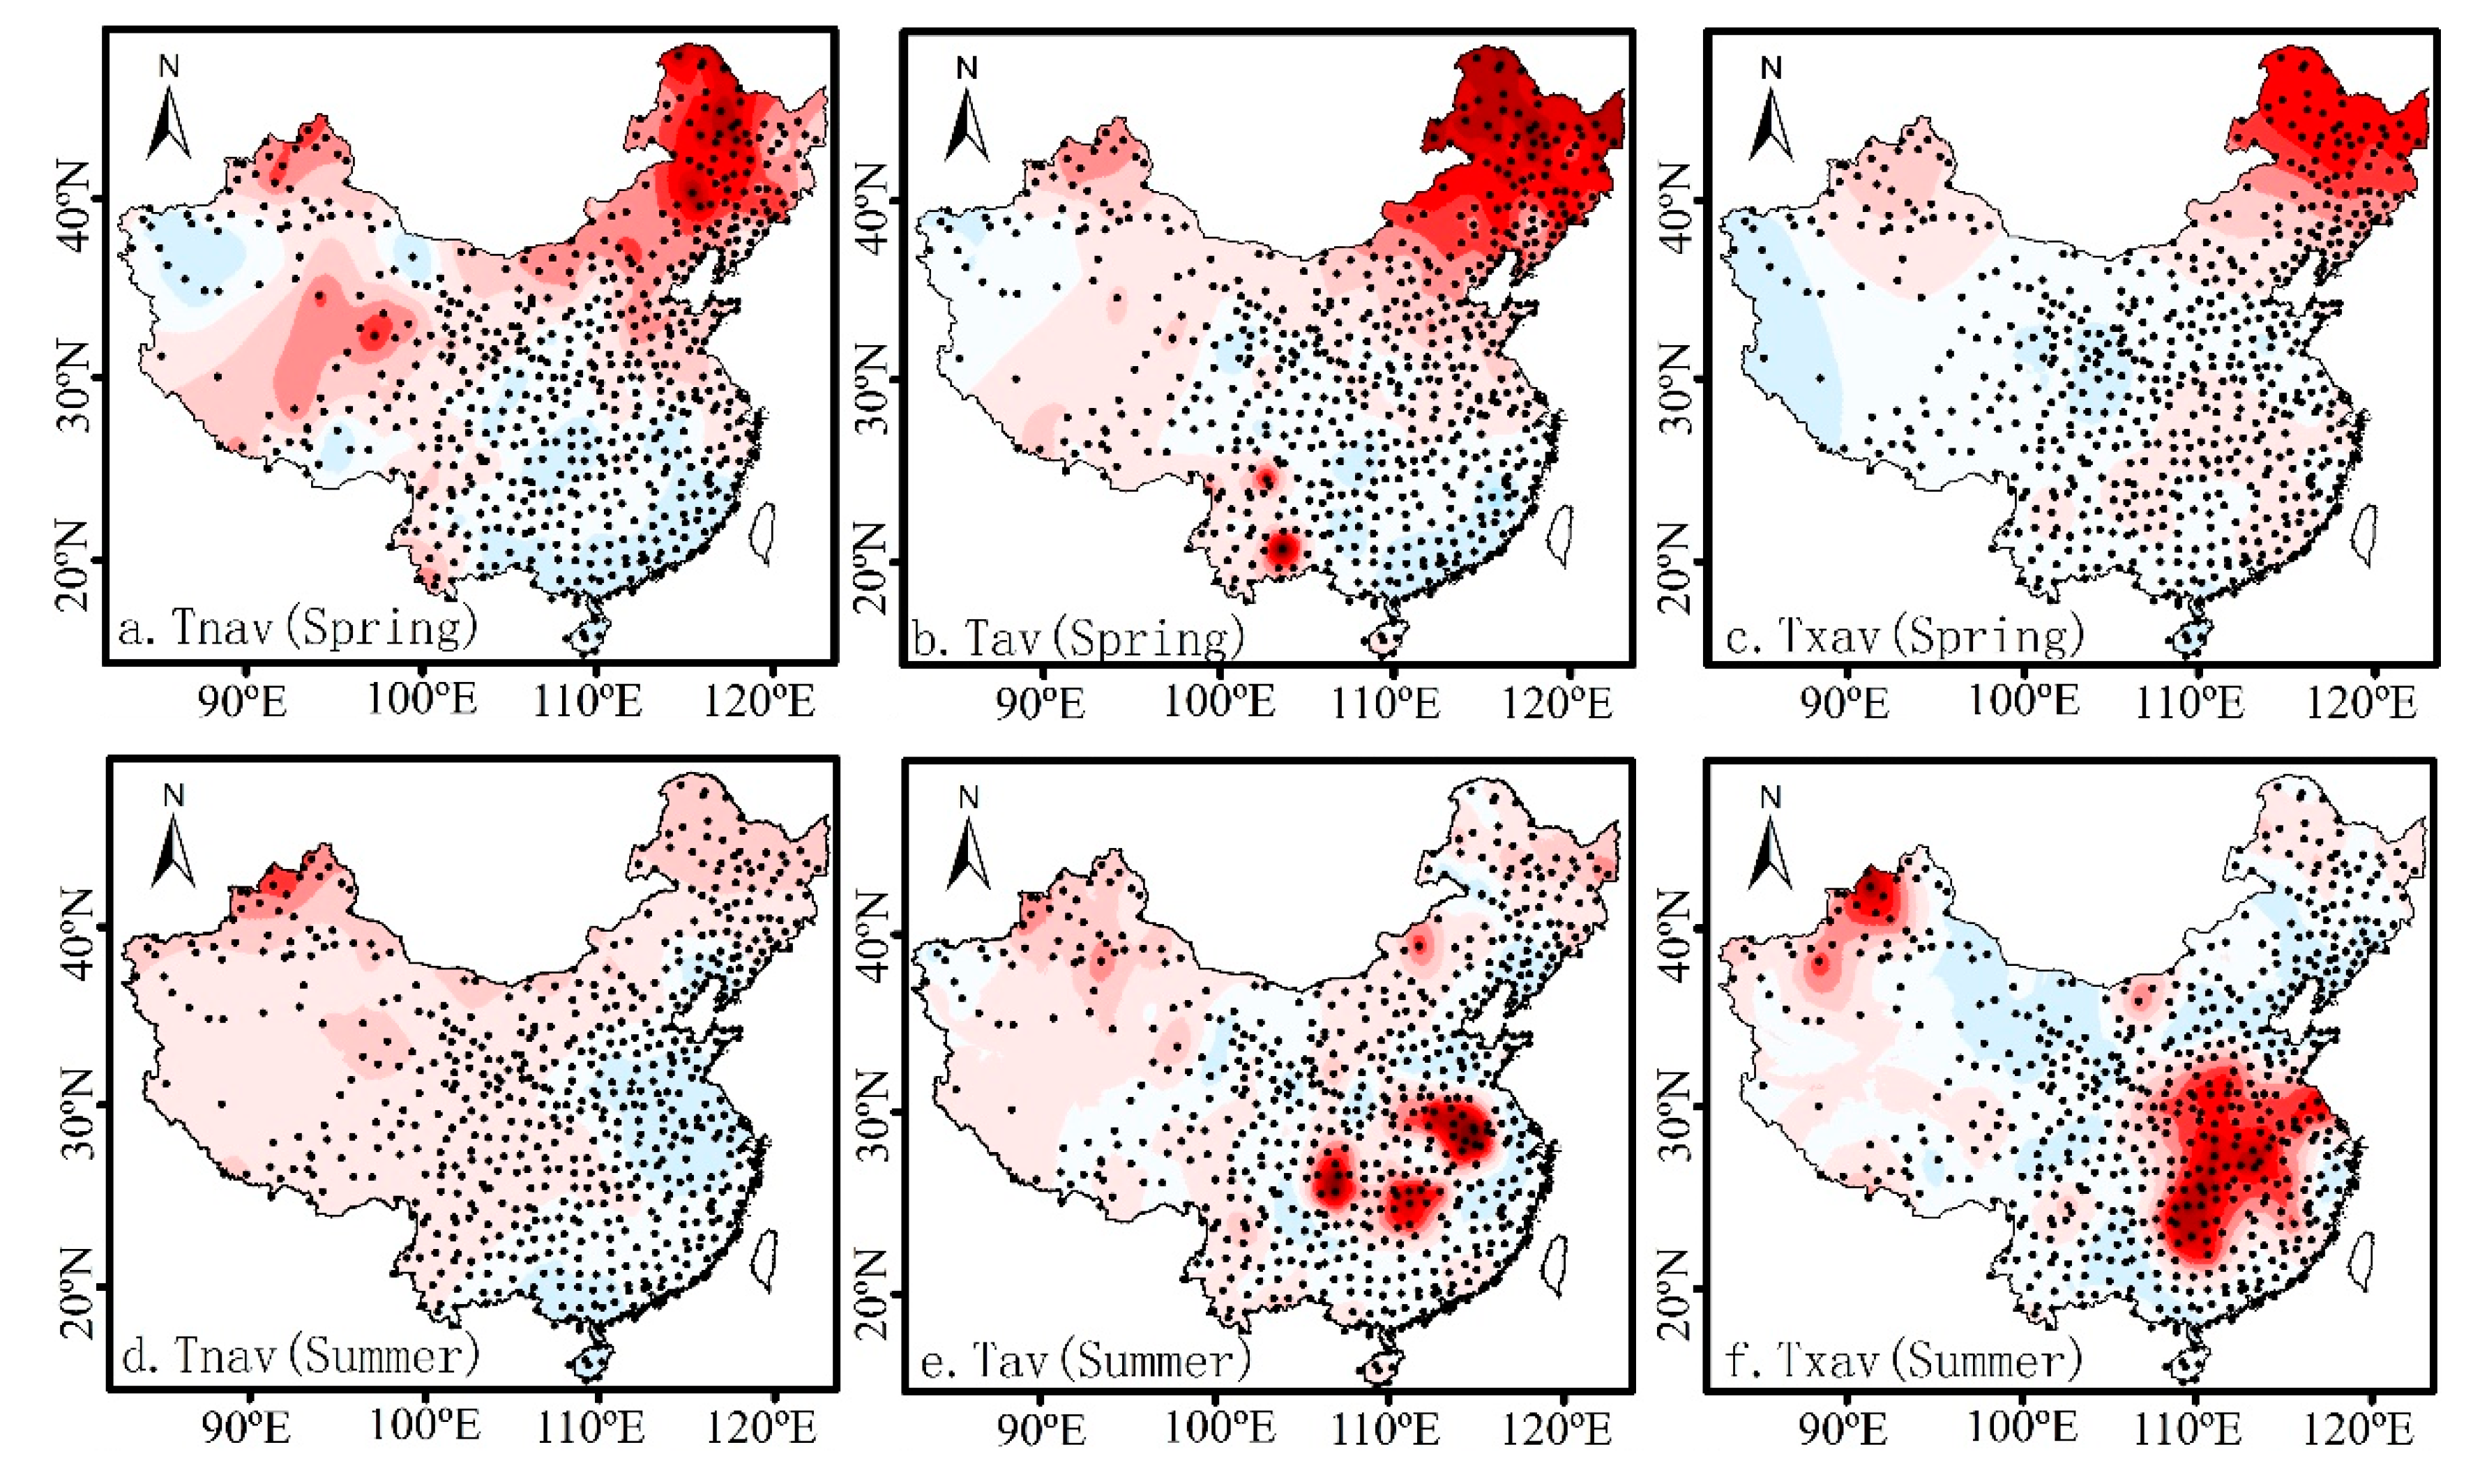
Figure 5 shows the spatial distribution of the climate tendency rates for the Tnav, Tav, and Txav during each season before the abrupt change (period T1). Before the abrupt change, there were both regions of increasing temperature and regions with temperature decreases, and the regions with temperature decreases were mainly concentrated in Northwest China, Central South China, and East China. Except for the Tnav in fall and the Txav in winter, all three temperature types exhibited a pattern of earlier abrupt changes that were associated with higher rates of increasing temperatures.
During spring, the variation rate for the Tav was higher than for the Tnav, and the variation rate of the Txav was lowest. During summer, the variation rates were ranked from high to low, and were in the order of Txav, Tav, and Tnav—the variation rate of the Tnav in fall and winter was highest, followed by that of the Tav and that of the Txav was the lowest. In spring, all three temperature types increased most rapidly in Northeast China (0.8 to 1.0 °C/10a). The variation rate of the Tnav was high (0.5 to 0.9 °C/10a) in the northern Northeast China Plain and at the northern foot of the Greater Khingan Mountains, Qaidam Basin, north of Junggar Basin, for which the temperature rise rate gradually decreased toward the surrounding areas. There were two centers of rapid temperature increase, which were in the southern part of the Yunnan-Guizhou Plateau and near Shangri-La in the Tibetan Plateau, and the rate of temperature rise decreased, or the temperature even dropped toward the surrounding areas. The Txav decreased slightly in the Qilian Mountains, Xinjiang, and in western Tibet (−0.1 to 0 °C/10a), and the rate of temperature increase was also low in most other regions (0 to 0.4 °C/10a).
During summer, the Tnav showed a downward trend in most regions of China’s third terrain ladder (−0.1 to 0 °C/10a); the Tav and the Txav showed the highest rate of increase in the plains of the middle and lower reaches of the Yangtze River (0.8 to 1.0 °C/10a).
During fall, the rate of change of the Tnav gradually decreased from northwest to southeast; the rate of increase for the Tav gradually decreased from north to south, and eventually in East China and Central South China, the variation rate showed a slight downward trend. The Txav exhibited a weak downward trend in the Jiangsu and Zhejiang areas, and the rate of temperature variation was close to zero for the remaining regions.
During winter, the rate of increase for the Tnav gradually slowed from the northwest to the southeast. The rate of the Tav increase was relatively high in a small region of the northernmost part of Xinjiang (0.5 to 0.6 °C/10a), and the region with a decrease in Tav was concentrated in the west of Northwest China and in the hilly regions of Guangdong and Guangxi; the Txav showed the greatest range of temperature decreases, and gradually rose from the region of temperature decrease in the eastern, western, and southern boundaries to the inland areas, but the rate of temperature increase was relatively low (0.2 °C/10a).
3.4. Spatial Distribution of Climate Trend Rate in Period T2
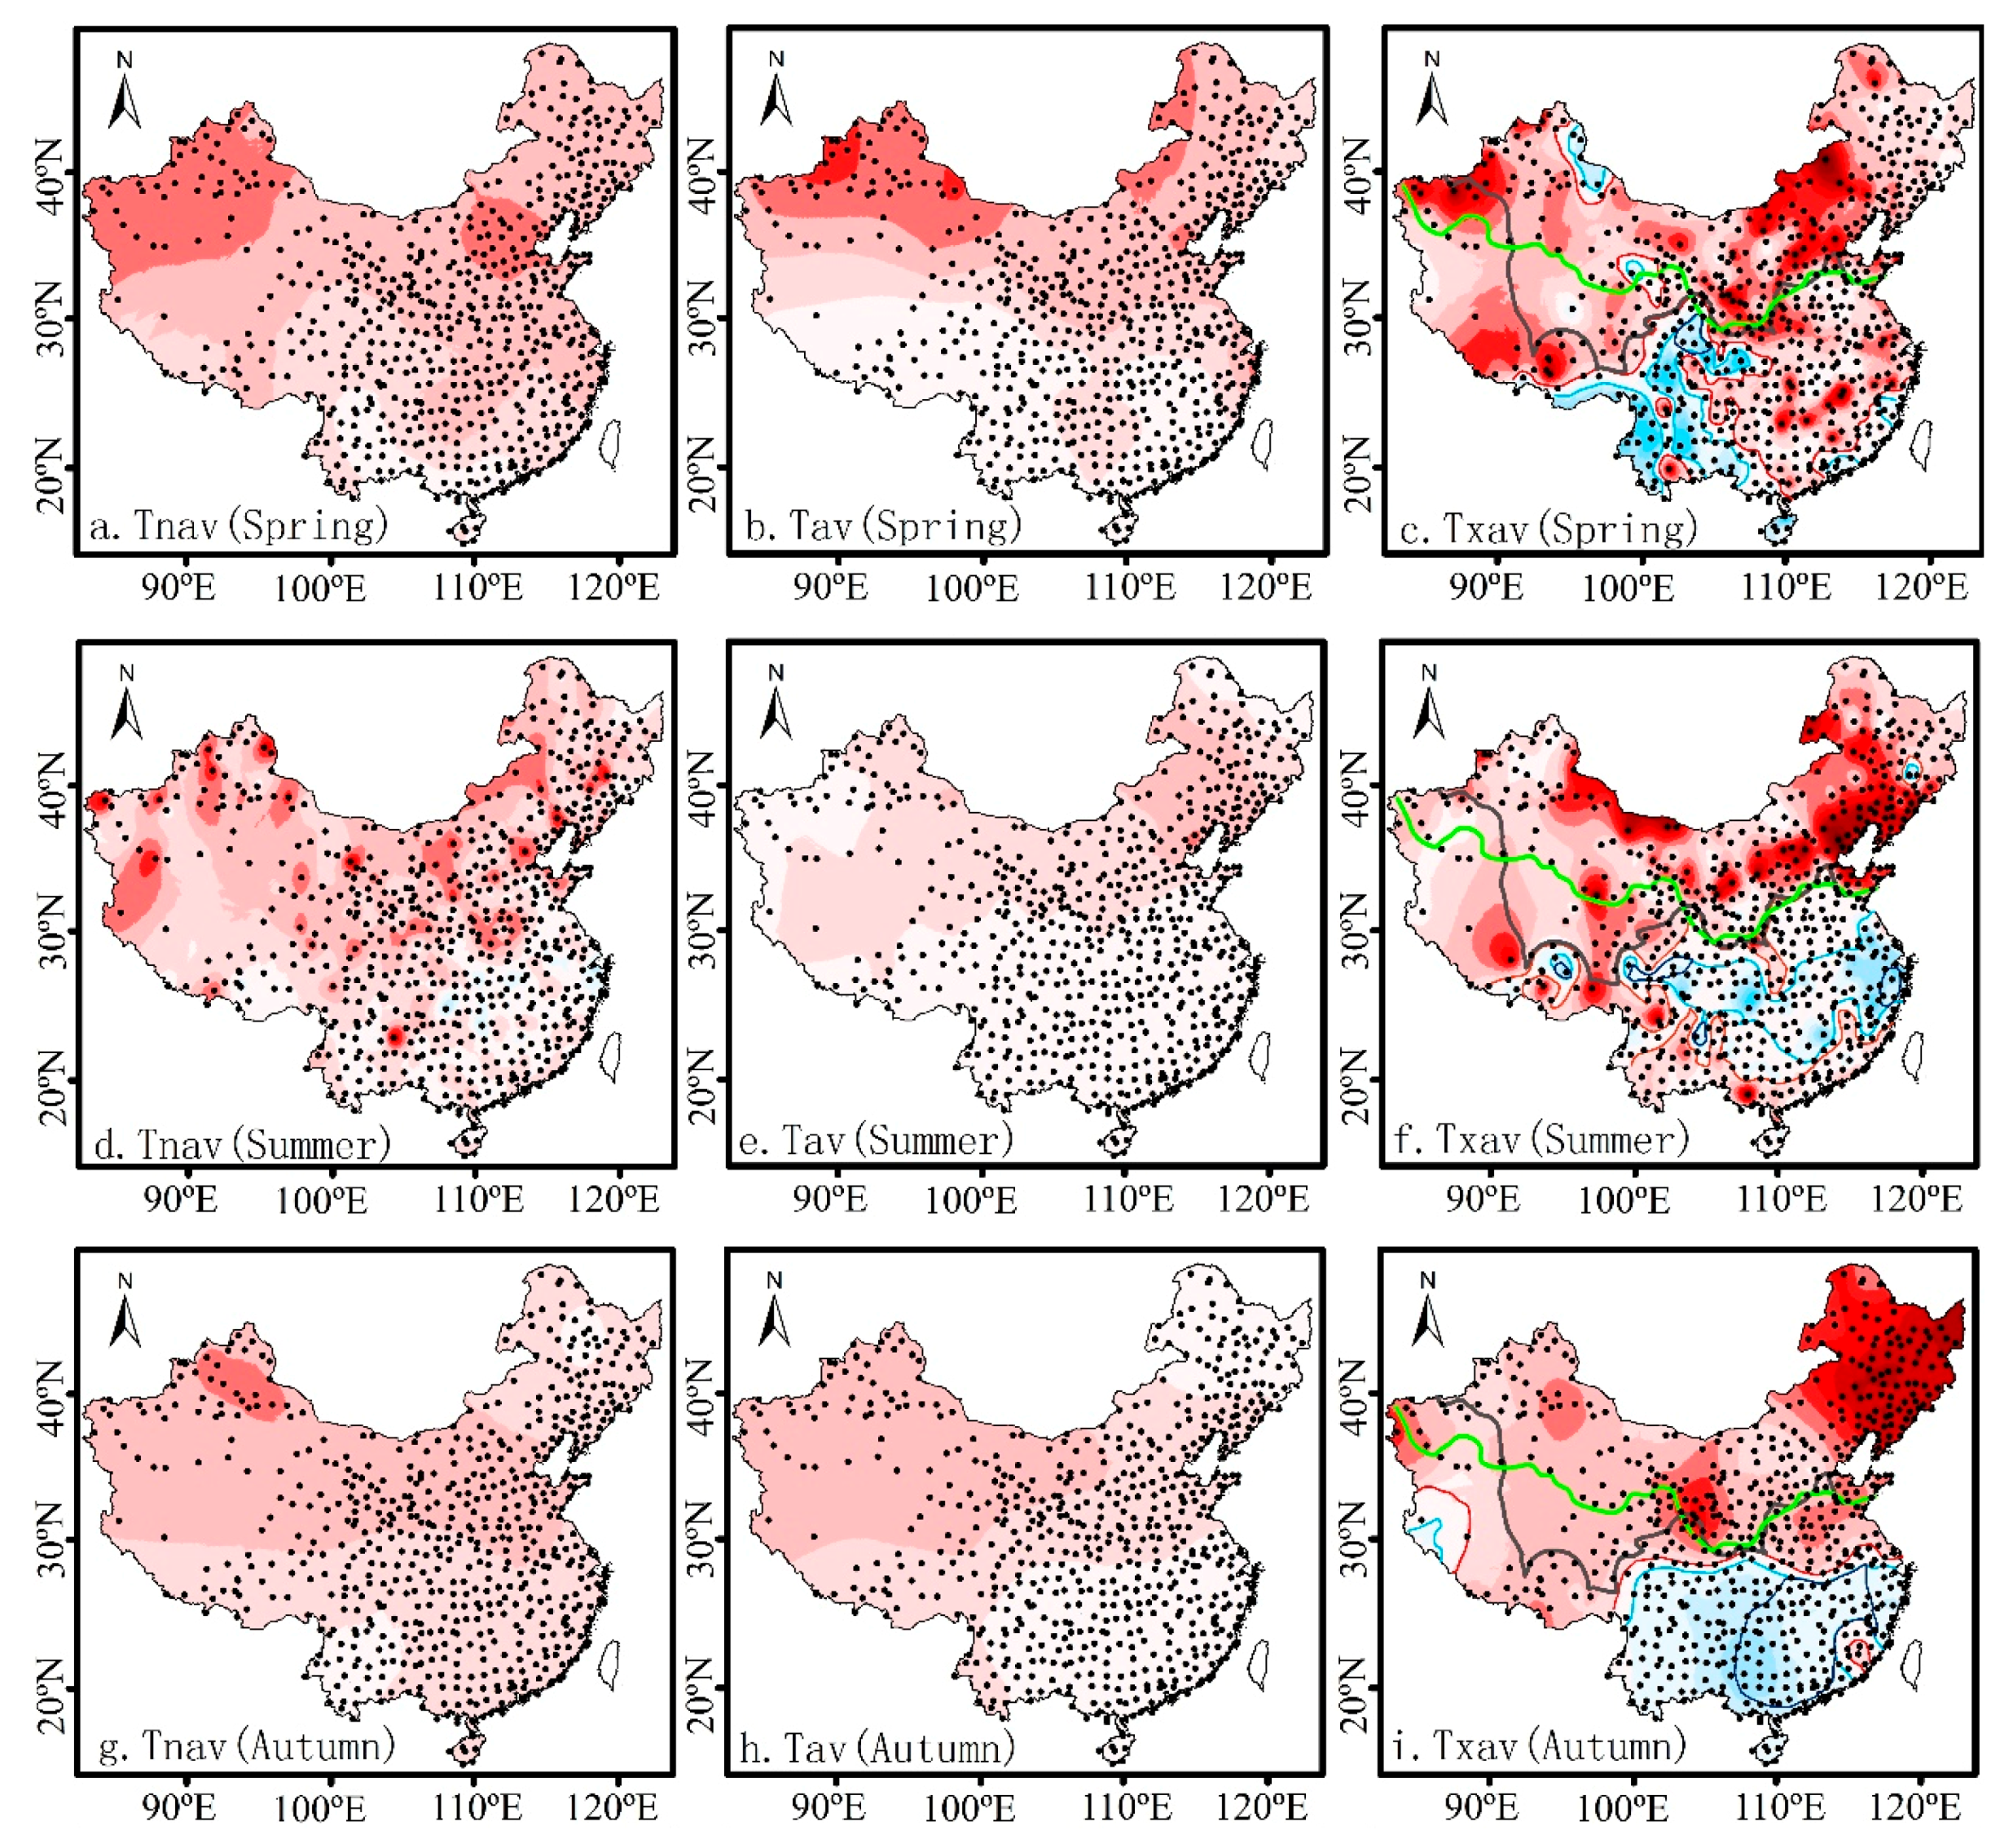
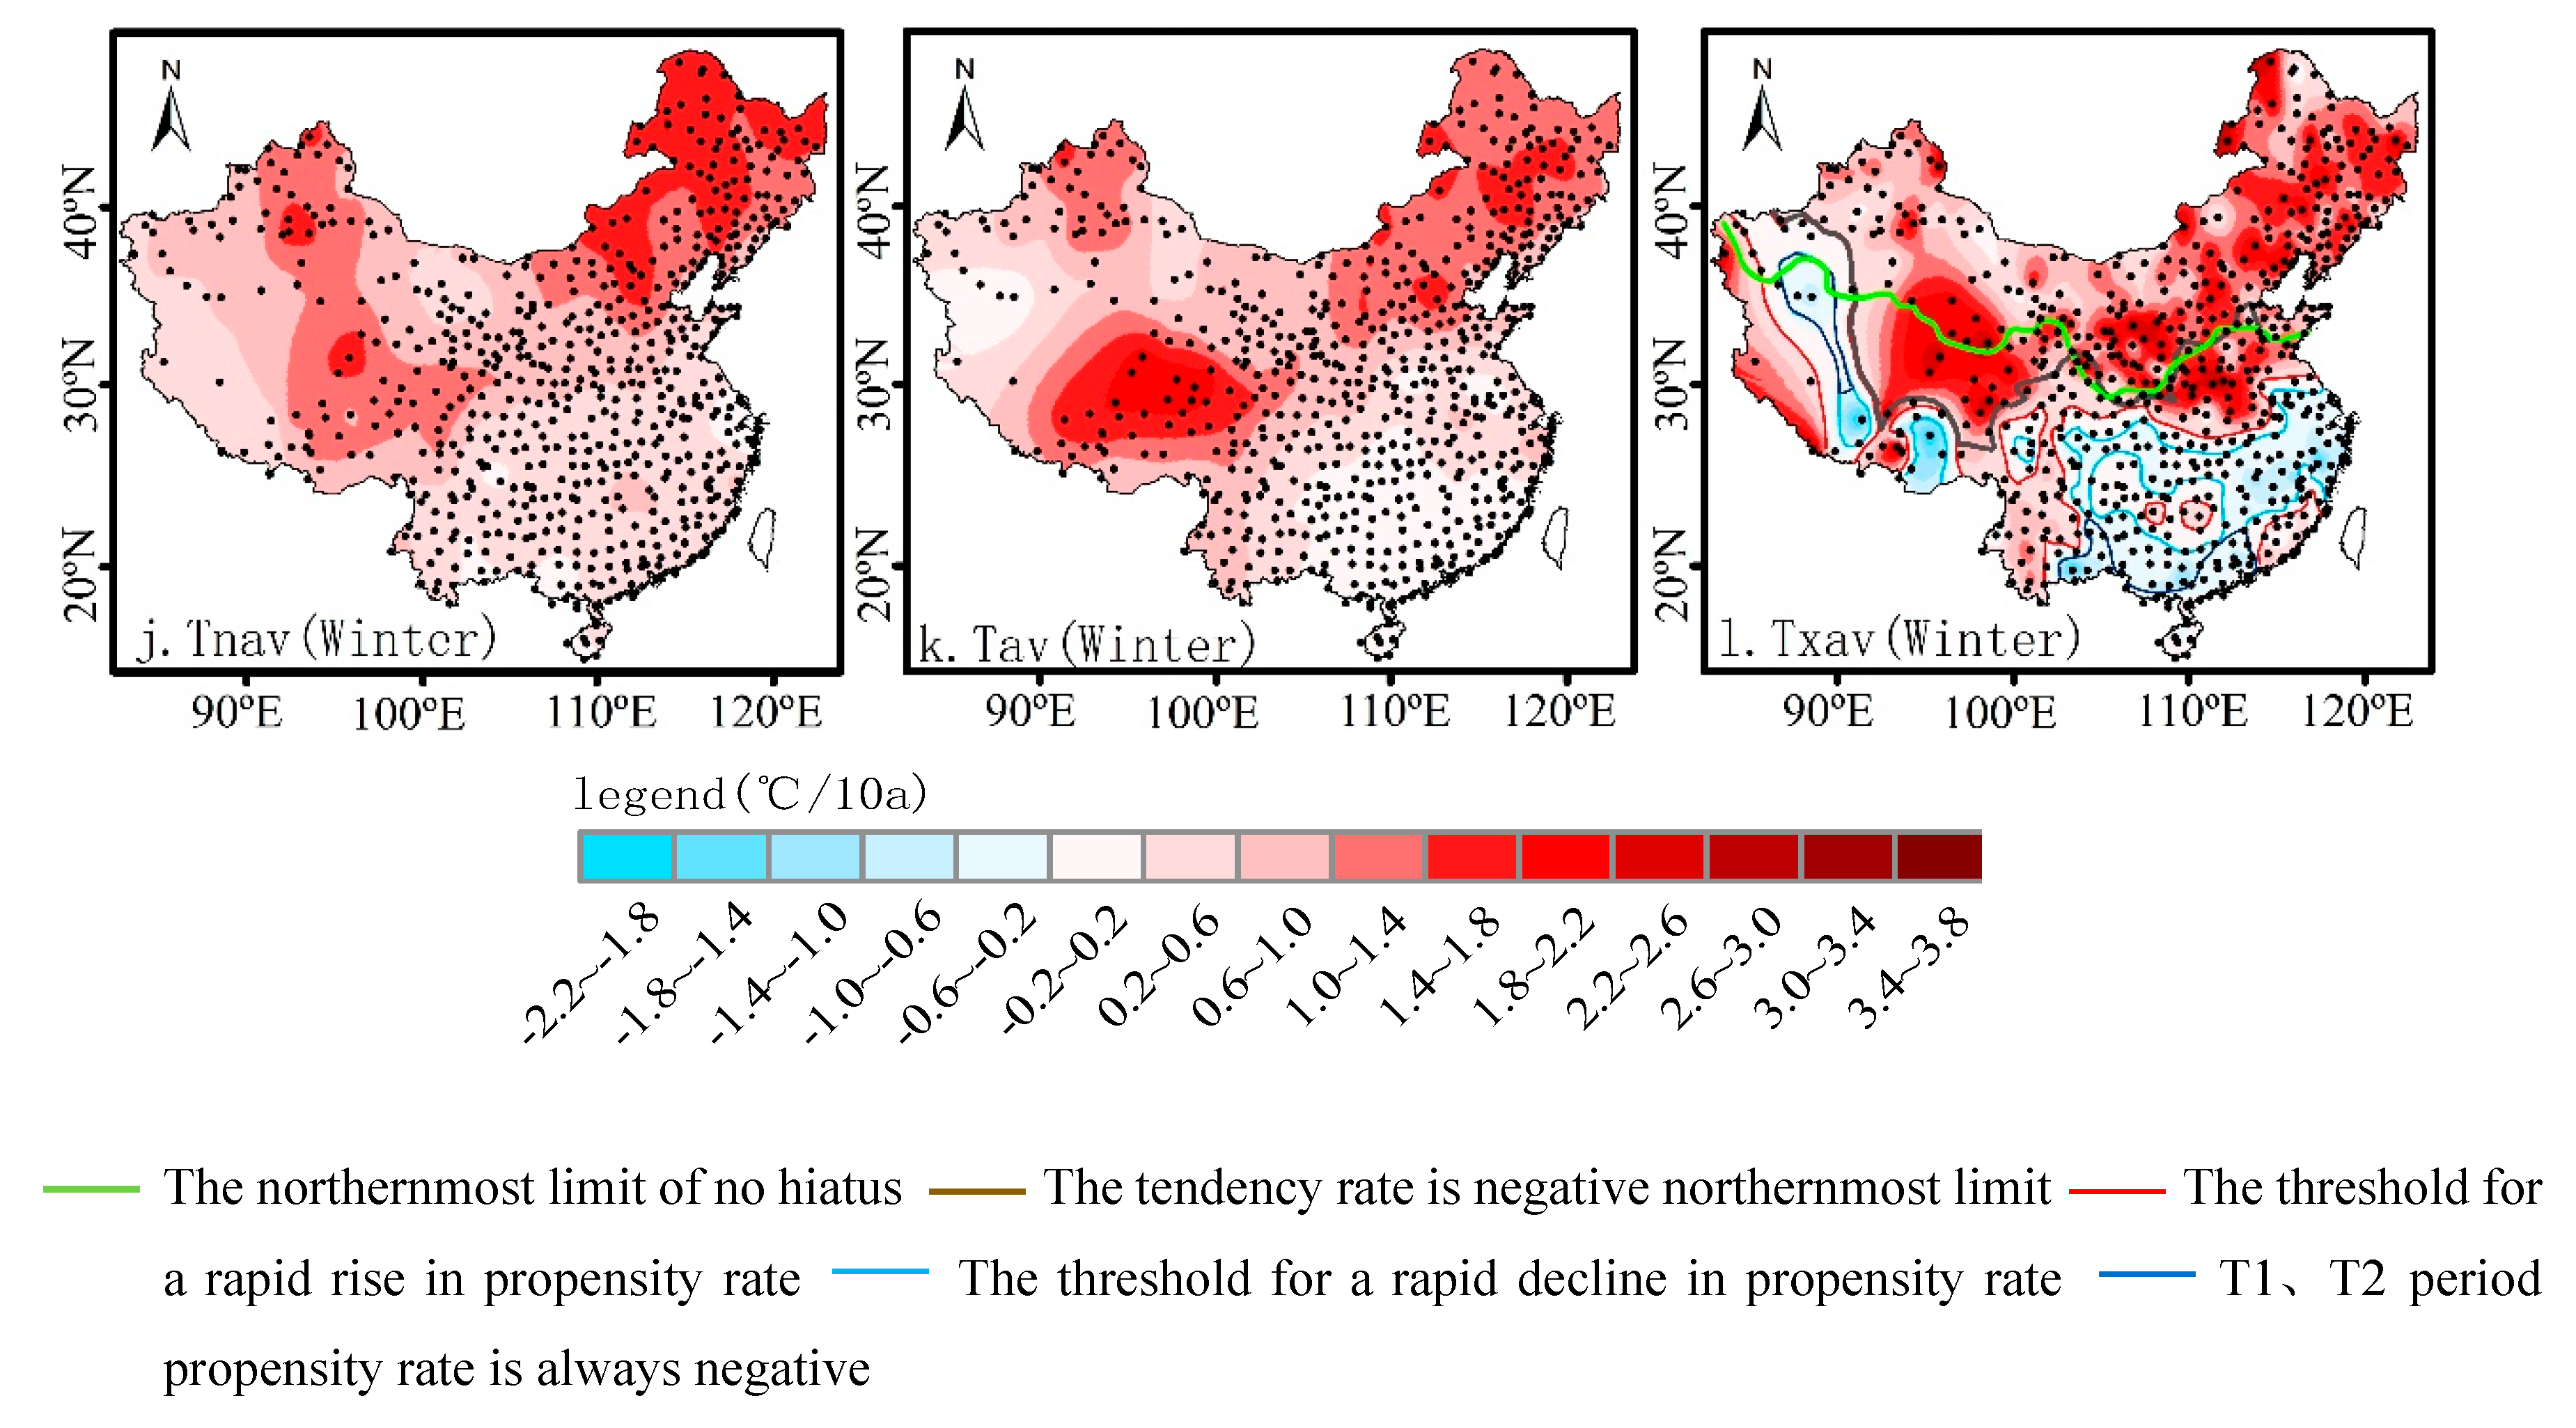
After the abrupt change for the three temperature types in each season (period T2), the rate of temperature increases significantly increased and was four times that of period T1, while the Txav in some regions showed a downward trend (
Figure 6). Previous studies have shown that, after the temperature changed abruptly in China, temperatures in the Sichuan Basin and the Guangdong-Guangxi hilly region showed a downward trend [
50]. Due to the different lengths of the data series used, the range of temperature decrease after the abrupt change in the present study was different from previous ones, but both confirmed that there were regions of cooling after the abrupt temperature change in China. The regions with decreases in the Txav after the abrupt change were superimposed, and the northernmost boundary of those regions with a temperature decrease are shown in the figure. In addition, the Txav rapid increase region and rapid decrease region are shown in the figure. A temperature increase and a temperature decrease transition zone are present between the two regions, with a multiyear variation rate of −0.2 to 0.2 °C/10a. The variation rate of the three temperature types for each season showed a pattern of high in the north and low in the south, and the Txav increase (decrease) rate was highest for all four seasons, and followed the trend for the Tav, and the variation rate for the Tnav was the lowest. The variation rates of the Tnav in the four seasons were ranked from high to low and were in the order of winter, spring, summer, and fall, while the variation rates of the Tav and the Txav were ranked from high to low and were in the order of winter, spring, fall, and summer.
During spring, the variation rate of the Tnav was 0.2 to 1.4 °C/10a, and the rates of temperature increase for northeastern Inner Mongolia and Northeast China did not differ much from those before the abrupt change (0.6 to 1.0 °C/10a). The temperatures increased most rapidly in western Xinjiang and Hebei (1.0 to 1.4 °C/10a), and the rate of temperature increase gradually slowed down toward the surroundings, and the slowdown rate was most rapid toward the south (1.4 to 0 °C/10a). The average rate of temperature increase in northern China was greater than in southern China, and the rate of temperature increase was highest in northern Xinjiang (1.0 to 1.8 °C/10a). The temperature of the region in southern East China with a low rate of decreased temperature showed a weak downward trend in period T1. The greatest rate of increase for the Txav reached 3.0 to 3.8 °C/10a, which was distributed in a staggered manner in eastern North China, western West China, East China and Central South China, while the temperatures in eastern Southwest China showed a significant downward trend (−2.2 °C/10a). In addition, the temperatures in some small areas of Sichuan showed a weak downward trend during periods T1 and T2, with a consistent rate of decrease of around −0.2 °C/10a.
During summer, the spatial distribution of the variation rates for the three temperature types was different from that in spring. The Tnav increase rate was three times higher than before the abrupt change (0.2 to 1.4 °C/10a), and the temperature increase rate of the plain and hilly areas in eastern China was the lowest (0 to 0.2 °C/10a). The Tav variation rate gradually slowed down from north to south, and the temperature variation rate to the south of 30° N was close to 0, where the temperature rise rate was relatively high in period T1 (0.8 to 1.0 °C/10a). The Txav increase rate in most of Northeast China and North China was relatively high (3 to 3.8 °C/10a), and the temperature decrease rate in most of the area south of the Loess Plateau was relatively high (−1.8 to −0.6 °C/10a), and there were also regions where the temperatures dropped in both the T1 and T2 periods and were concentrated in the western Sichuan Basin and in the Yunnan-Guizhou Plateau and the southern Tibetan Plateau, respectively, with an expanded range compared to that in the spring.
During the fall, the spatial distribution of the variation rates of the Tnav was roughly consistent with that of the Tav, and the variation rate gradually dropped from the northwest to southeast. The Txav increase rate in Northeast China and the east of North China was the highest (3.4 to 3.8 °C/10a), the temperatures to the south of the middle and lower reaches of the Yangtze River showed significant downward trends (−0.8 to −0.2 °C/10a), and the range of the temperature drop in both periods T1 and T2 continued to expand to most regions to the south of 30° N and to the east of 110° E.
During winter, the variation rates of the three temperatures types were higher than those in other seasons, and the temperature increase rates all reached maximum values near Northeast China and the Qaidam Basin (2.6 to 3.8 °C/10a). Overall, the Txav increase rate gradually slowed down from north to south, and the weakening of the Mongolian high may be one of the important reasons for the gradual decrease in continental warming from north to south in the winter [
31]. The regions with Txav decreases in both periods T1 and T2 were concentrated in the west of the Tibetan Plateau, the southeastern Yunnan-Guizhou Plateau, and the Guangdong-Guangdong hilly region.
3.5. Spatial Distribution of Climate Trend Rate in Period T3
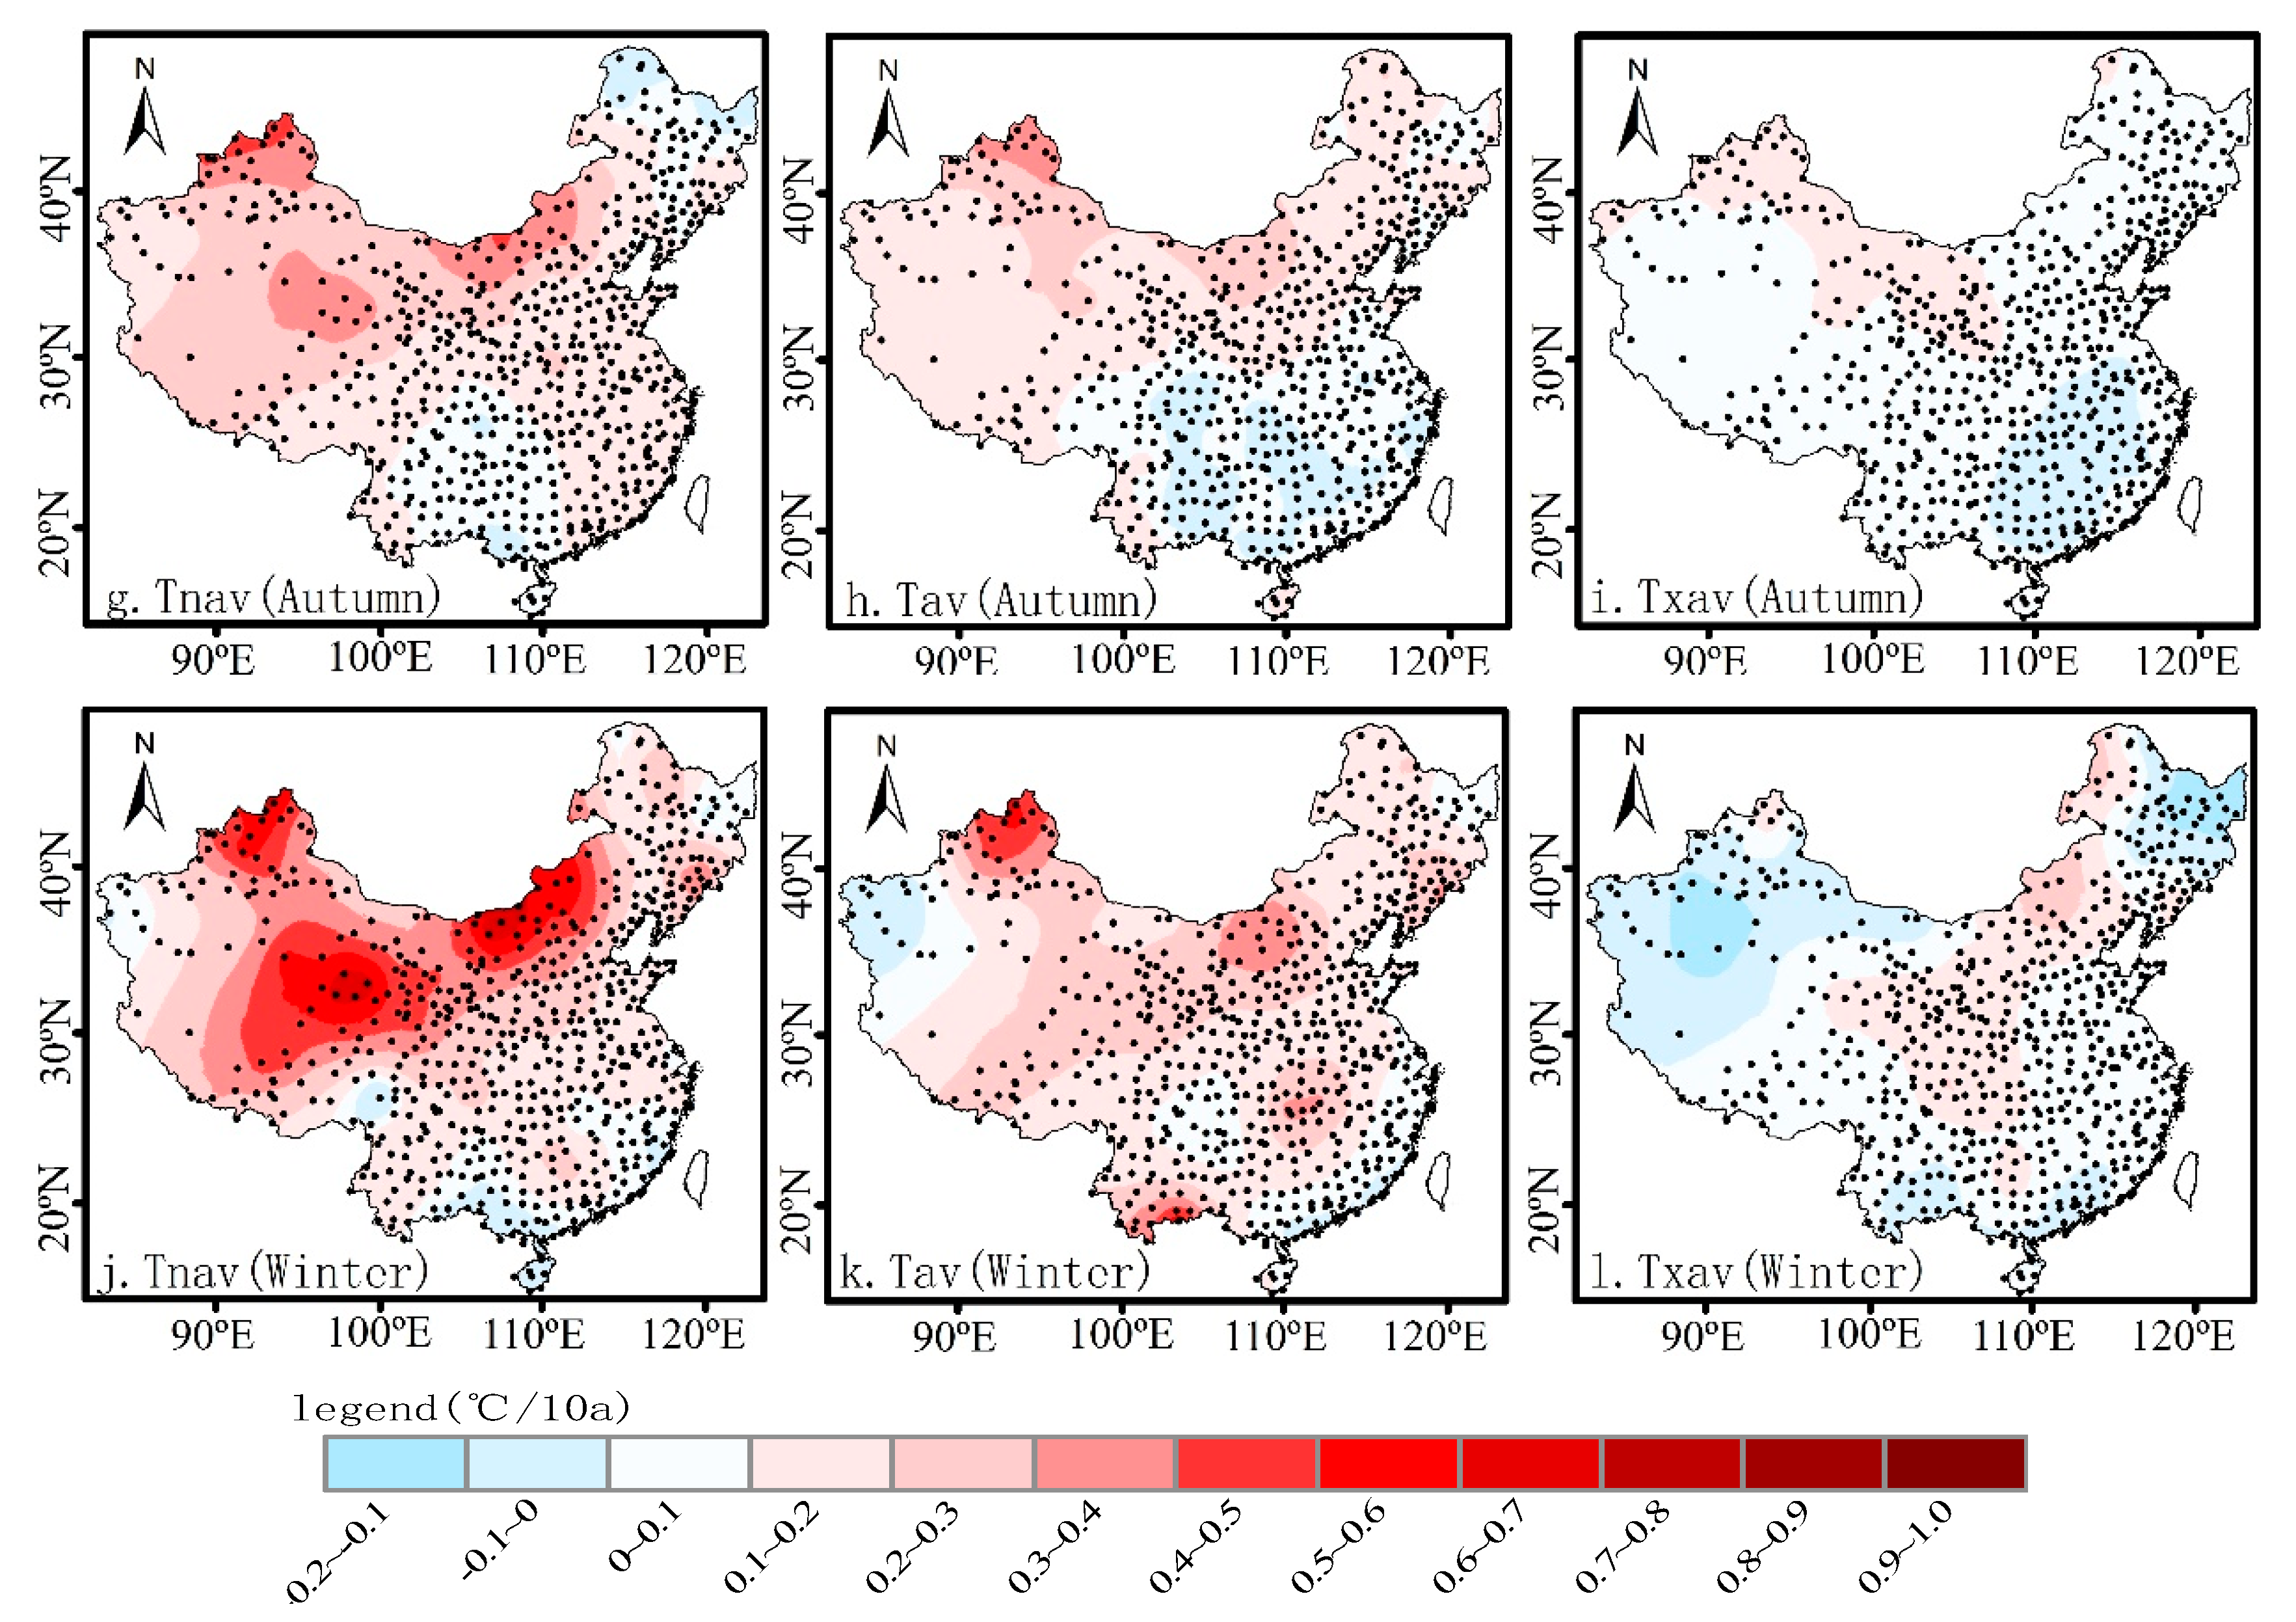
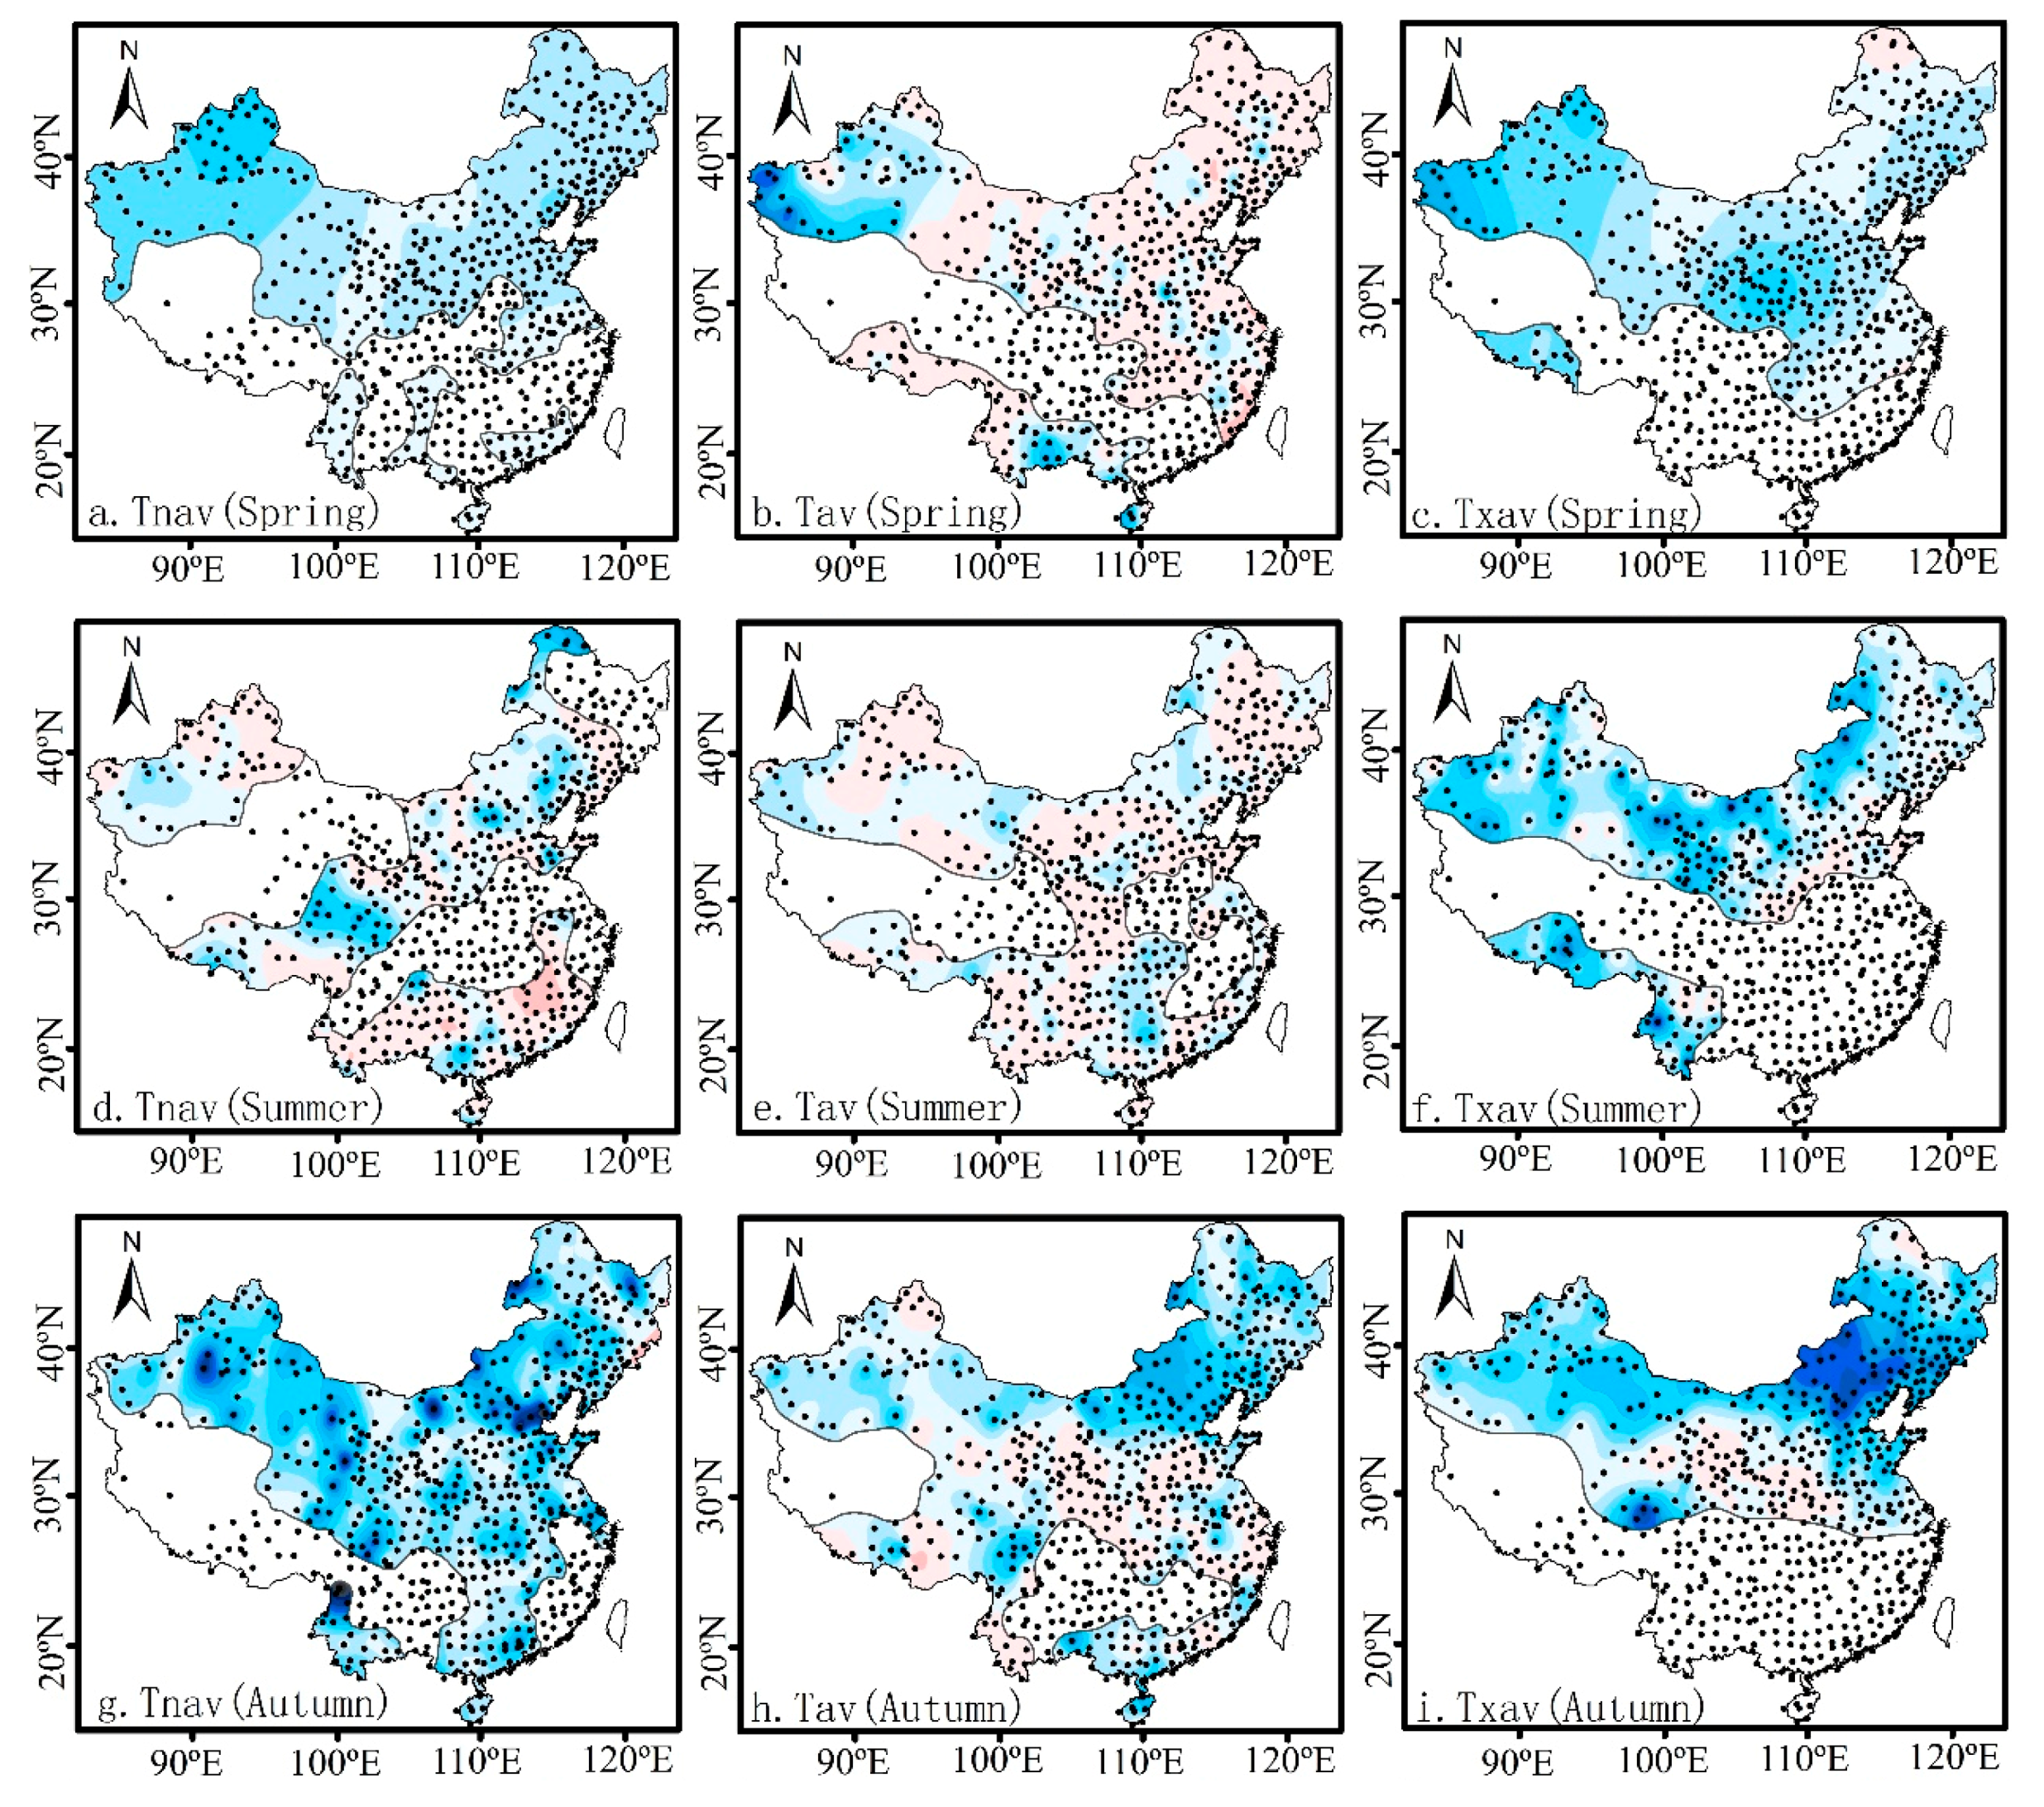
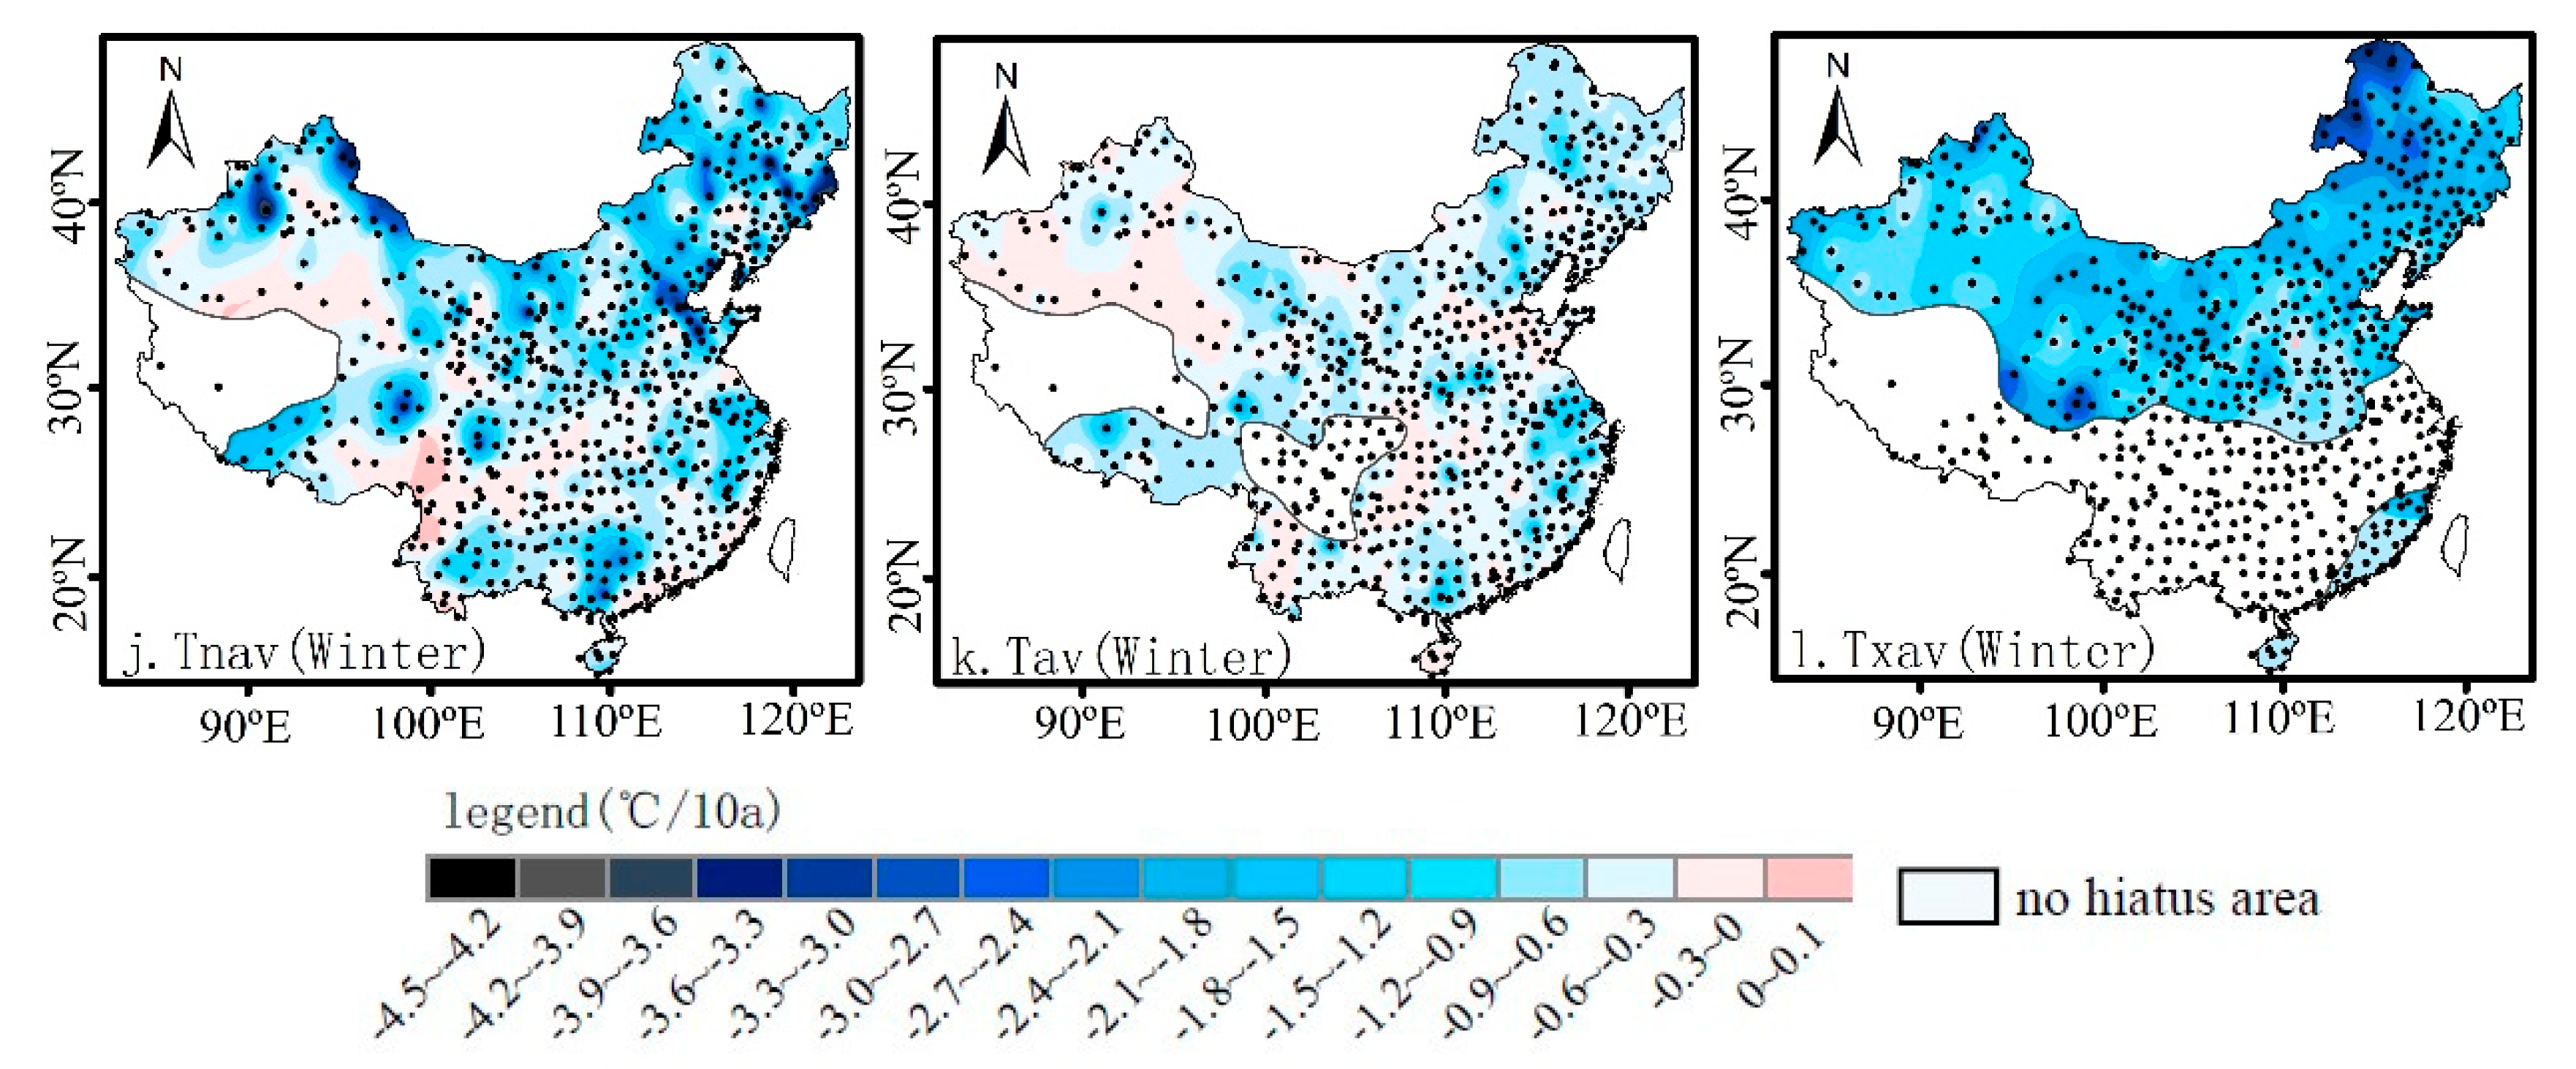
After the abrupt change, the temperature rapidly increased (decreased), and the temperature increase (decrease) at certain stations slowed down after a certain period, leading to a warming (cooling) hiatus when entering period T3 (
Figure 7). The rates of decrease for the three temperature types were highest in winter, followed by fall, and the temperature decrease rate was low in spring and summer. In terms of the temperature type, the rate of decrease for the Txav was the highest, followed by that of the Tnav, and the rate for the Tav was the lowest. In each season, the three temperature types decreased rapidly over a wide range in North China, Northeast China, and in Northwest China, and the temperature variation rates for the hinterlands of the plains in the study area were mostly concentrated between 0 to 0.1 °C/10a. In general, the temperature decrease rate was higher in northern China than in southern China.
During spring, the spatial distributions of the variation rates of the three temperature types were quite different, and the Tnav showed a downward trend (−0.9 to −0.3 °C/10a) after the warming (cooling) hiatus. In the vicinity of 100° E, there was a zone of relatively slowly dropping temperatures that ran from the south to the north of the study area; the Tav dropped rapidly in southwestern Xinjiang, Yunnan, and in southern Guangxi (−3.3 to −2.4 °C/10a), and gradually showed a slightly increasing trend toward the surrounding areas (0 to 0.1 °C/10a). The Txav decrease rate generally increased gradually from the northeast to southwest, and the temperature rose rapidly in period T2 in the region where the temperature variation rate at the northernmost end of Inner Mongolia was relatively low (0 to 0.1 °C/10a).
During summer, the spatial distributions of the variation rates of the Tnav and Tav were similar, but the overall variation rate of the Tnav was greater than that for the Tav. The Txav decrease rate was relatively high to the south of the Mongolian Plateau and to the west of Northwest China and Southwest China (−1.5 to −1.2 °C/10a).
During fall, the Tnav showed a downward trend in most regions, and it dropped most rapidly near Lijiang (−4.5 to −3.6 °C/10a). The Tav showed a relatively low variation rate in most regions, and it dropped rapidly in the areas east of 105° E and north of the Loess Plateau (−1.8 to −1.5 °C/10a); the Txav exhibited the greatest rate of decrease in central and eastern Inner Mongolia and southern Qinghai (−3.7 to −3.3 °C/10a) and, with the Loess Plateau and the slow temperature increase region of the northern Lesser Khingan Mountains forming the center, the temperature variation rate gradually decreased toward the surrounding areas.
During winter, the temperature decrease rates in Northeast China and North China were relatively high (−3.0 to −2.1 °C/10a), and the temperature decrease rate in Northwest China gradually increased from west to east, while the pattern in Southwest China was the opposite. The Tnav also showed the highest decrease rate in Northeast China and North China, but the temperature in the southern coastal region of the Northeast China Plains exhibited a slight upward trend—the temperature at the junction of China’s first and second terrain ladders showed a slight upward trend, and temperature decreased eastward until reaching the Zhejiang-Fujian hilly region where temperature again rose slightly. Compared to the other two temperature types, the Tav tended to exhibit a gentle rate of variation and the range of the slow temperature increases expanded to some extent—the Txav always showed a downward trend, and the temperature decrease rate reached its greatest values in northeastern Inner Mongolia (−3.9 to −3.0 °C/10a).
4. Conclusions and Discussion
Unlike previous researches, This study used the datasets from 622 meteorological stations distributed in China, including the monthly data of Tnavs, Tav, and maximum temperatures from stations that were established up to 2018, Three types of abrupt temperature changes and hiatus years were determined for each site, and take this as the time node to analyze its change trend before and after, It comprehensively shows the spatial variation of three types of temperature abrupt change, hiatus years and their before and after variation trend in China in the recent 68 years.
The study found that under the background of global warming, the Txav in each season experienced a cooling abrupt change in China. Most of the cooling areas were concentrated in the south of 30° N in China, but the range of the cooling abrupt change areas in different seasons was different, which was different from the trend of global warming. The Txav with the greatest rate of decrease reached 2.2 °C/10a and an overall decrease rate in the range of −1.0 to −0.2 °C/10a. In some parts of southern China, the Txav drops after an abrupt change, and the Tnav rises after a sudden change, resulting in a smaller temperature difference. This has a great impact on local agriculture and crop output.
The warming (cooling) hiatus in China showed strong spatial variability, and the duration of the hiatus to the end of the hiatus was longer than the global forecast. Some scholars have pointed out that, average global temperatures moderated in 1998, but after that, record heat waves hit Russia and the United States in 2010 and 2012, and arctic sea ice reached record lows, a single trend analysis of global mean temperature sequence has limitations on revealing regional climate change rules. In China, after the abrupt change, the temperature increased (decreased) rapidly for five to 15 years, and the temperature increase (decrease) then slowed down, and a warming (cooling) hiatus occurred. Overall, the hiatus times in spring, summer, and fall (which occurred after 2000 for more than 80% of the stations) were later than the composite year of the global warming hiatus (1998)—the warming (cooling) hiatus time in winter was between 1989 and 2000, and a hiatus occurred in 1998 for approximately 20% of the stations. A warming (cooling) hiatus did not occur for approximately half of the stations located south of 40° N, and the rate of temperature increase (decrease) after the abrupt change was still high. Winter temperature changes are worth watching, In the northern hemisphere, the surface temperature of the tropical outer continent in winter changed from warming to nearly neutral or even cooling trend in recent 10 years [
51]; In Eurasia and much of the United States, 2009–2010 saw a winter of persistent low temperatures and blizzards [
52,
53]; It is found that the temperature drop in winter is the biggest during the period of stagnation of warming in China. For some stations, after the warming (cooling) hiatus occurred in a specific year between 2013 and 2017, the temperature again rose rapidly, and the hiatus lasted for nine to 17 years, the temperature of the other part of the station is still in the hiatus stage until 2018, without the end of hiatus, and the hiatus time to end of hiatus time is still uncertain. This is different from the previous conclusion that Kerr et al. [
54] used global macro-scale factors to simulate the stagnation of temperature warming within 15 years, the regional temperature hiatus time has a strong spatial variability at the micro scale. The study confirmed warming (and cooling) hiatus in parts of China after an abrupt temperature change, The warming (colding) hiatus has a great influence on the growth of regional vegetation and the distribution of water resources, It also reveals the spatial variability of hiatus, This provides reference for the prediction of future climate change trends and the formulation of policies to cope with climate change.
As for the mechanism of temperature mutation, there are different opinions for such causes, which mainly include natural factors [
55,
56] and human factors [
57]. The years of abrupt change for the three temperature types in each season, as well as their variation trends before and after these years, were affected by multiple factors such as the longitude, latitude, underlying surfaces, and geographical environments. The formation mechanisms for warming hiatuses include internal forcing (e.g., volcanic aerosols [
58] and human aerosols [
59]), natural variability (e.g., ocean heat absorption [
60] and the Pacific Decadal Oscillation [
56]). Due to the limitation of space, this paper does not conduct an in-depth study on the three types of temperature abrupt change and hiatus mechanisms in various seasons in China, and the following studies will focus on their internal mechanisms.
Due to the limited duration of the data series used in the present study, there are limitations and deficiencies for revealing the patterns of abrupt change in long-term temperature and warming hiatuses. With the increase of subsequent temperature data series, new questions may emerge, for example, whether the number of stations showing hiatus cessation will further increase in the warming (cooling) hiatus regions in southern China, and if and when hiatuses will subsequently occur at the stations that have shown no warming (cooling) hiatuses yet, This is of great significance to China’s regional economic development, agricultural development, and relevant policy formulation, and deserves our continued attention.
