Article

Long-Range Transport Influence on Key Chemical Components of PM2.5 in the Seoul Metropolitan Area, South Korea, during the Years 2012–2016

1
Department of Environmental and Safety Engineering, Ajou University, Suwon 16499, Korea
2
Georgia Environmental Protection Division, Atlanta, GA 30354, USA
3
Air Resources Laboratory, National Oceanic and Atmospheric Administration, College Park, MD 20740, USA
4
Cooperative Institute for Satellite Earth System Studies, University of Maryland, College Park, MD 20740, USA
5
Air Quality Improvement Bureau, National Council on Climate and Air Quality, Jongro 03181, Korea
*
Author to whom correspondence should be addressed.
Atmosphere 2020, 11(1), 48; https://doi.org/10.3390/atmos11010048
Submission received: 27 October 2019 / Revised: 26 December 2019 / Accepted: 27 December 2019 / Published: 29 December 2019
(This article belongs to the Special Issue Recent Advances of Air Pollution Studies in South Korea)

Abstract

:
This study identified the key chemical components based on an analysis of the seasonal variations of ground level PM2.5 concentrations and its major chemical constituents (sulfate, nitrate, ammonium, organic carbon, and elemental carbon) in the Seoul Metropolitan Area (SMA), over a period of five years, ranging from 2012 to 2016. It was found that the mean PM2.5 concentration in the SMA was 33.7 μg/m3, while inorganic ions accounted for 53% of the total mass concentration. The component ratio of inorganic ions increased by up to 61%–63% as the daily mean PM2.5 concentration increased. In spring, nitrate was the dominant component of PM2.5, accounting for 17%–32% of the monthly mean PM2.5 concentrations. In order to quantify the impact of long-range transport on the SMA PM2.5, a set of sensitivity simulations with the community multiscale air-quality model was performed. Results show that the annual averaged impact of Chinese emissions on SMA PM2.5 concentrations ranged from 41% to 44% during the five years. Chinese emissions’ impact on SMA nitrate ranged from 50% (winter) to 67% (spring). This result exhibits that reductions in SO2 and NOX emissions are crucial to alleviate the PM2.5 concentration. It is expected that NOX emission reduction efforts in China will help decrease PM2.5 concentrations in the SMA.

Graphical Abstract

1. Introduction

Ambient particulate matter with a diameter less than 2.5 µm (PM2.5) is composed of inorganic ions, carbonaceous materials, crustal substances, metallic components, sea salt, water, and so on. Globally, carbonaceous materials are considered to be a major component of PM2.5 [1,2]. However, in Northeast Asia, the concentration of inorganic ions in PM2.5 is reported to be higher than that of carbonaceous materials [3,4,5]. The concentration of inorganic ions is affected by atmospheric physiochemical processes and its primary and precursor emissions (NOX, SO2, and NH3) [6,7,8,9,10]. In Northeast Asia, in particular, precursor emissions and meteorological conditions change markedly depending on the season. Thus, the concentration and composition of PM2.5 show clear seasonal variations [11,12].
Exposure to ambient PM2.5 is a probable cause of several serious diseases (chronic obstructive pulmonary disease, cardiovascular disease, and some cancers). This is more evident in the vulnerable sectors of the sensitive population, such as children and elders, than in the general population [13,14,15]. In Northeast Asia, including China, days with high PM2.5 concentration occur frequently during winter and spring [16,17,18]. To address this, China has developed and implemented comprehensive emission reduction policies, such as the phasing out of outdated industrial sites and strengthening the industrial emission standards [19,20]. In particular, more intensive emission reduction policies were enforced during autumn and winter [21]. For example, production restrictions have been implemented for high emitting industries (i.e., steel) and emission limits have been placed on thermal power plants for the periods between October and March [21]. Furthermore, the Korean Ministry of Environment and Seoul city recently began considering stronger emissions-reduction policies during the cold season.
The Korea–United States Air Quality study (KORUS-AQ) interim report explains that secondary particle formation and growth is important to determine PM2.5 concentrations in South Korea [22]. Concentrations of secondary PM2.5 components are determined through complex processes, including emission, advection, diffusion, chemical reaction, and removal. Studies have shown that the PM2.5 concentrations of countries in Northeast Asia are influenced by long-range transport [23,24,25,26,27]. Therefore, to implement an effective control strategy for decreasing PM2.5 concentrations, it is necessary to quantify the major chemical components of PM2.5, its seasonal variability, and its major emission sources.
The results of previous studies that analyze haze episodes in South Korea are as follows. Shin et al. [17] analyzed PM2.5 and its chemical composition during high PM2.5 events in spring 2014 for Seoul, South Korea. They found that inorganic ions in the Seoul metropolitan area (SMA) accounted for approximately 60% of PM2.5 by mass. According to Kim et al. [28], the sum of the inorganic ion mass fraction is 50% of the total PM2.5 mass when smog events in Seoul occurred from 2003 to 2004. Many other case studies on haze have reported that inorganic ions are major components of PM2.5 [29,30,31]. In a meta-analysis of PM2.5 concentrations in Seoul, Han and Kim [32] showed that, while the overall PM2.5 concentration decreased, concentrations of nitrate and ammonium tended to increase during the years 1986–2013. Trends in PM2.5 and nitrate concentrations may be related to recent Chinese anthropogenic emission reductions [19,33]; however, this assumption should be supported by continuous and long-term measurement and analysis of component concentrations. Han et al. [34,35] reported on the characteristics of inorganic ions in South Korea over two years; however, their analysis was conducted prior to the Chinese emission reductions. Hence, analysis using recent observational data is required.
Three-dimensional photochemical models can be used to quantify the long-range transport of air pollutants [36,37,38,39]. For example, some of the most frequently used air-quality modeling systems is the Weather Research and Forecasting (WRF) [40], Sparse Matrix Operator Kernel Emissions (SMOKE; [41]), and the Community Multiscale Air Quality (CMAQ; [42]) models [22,26]. Previous studies utilizing this system have reported that the impact of foreign emissions on South Korean PM2.5 concentrations during days with high PM2.5 concentrations was 60%–80% [43,44]. Furthermore, long-term studies that analyzed long-range transport of PM2.5 seasonally or annually in South Korea reported that foreign emissions ranged from 40% to 70%, depending on the season [45,46,47,48]. However, few studies have considered long-term seasonal variations of PM2.5 chemical components.
This study aims to examine the seasonal concentration and composition of surface (ground layer of the atmosphere) PM2.5 observed in the SMA and to identify the dominant chemical components during high-concentration PM2.5 events. To achieve this, the seasonal chemical composition of PM2.5 was analyzed to identify the key PM2.5 components on days with high PM2.5 concentrations based on five years of the recently collected data (2012–2016) from an SMA super site. We distinguished the influence of foreign impacts on PM2.5 concentrations and identified the individual major chemical components in the SMA by using a three-dimensional photochemical model. This paper is structured as follows: Section 2 describes the methods used in this study; Section 3 describes the seasonal changes in individual PM2.5 major chemical components and quantifies foreign impacts, using air-quality modeling; and, finally, Section 4 summarizes our findings.

2. Data and Methods

2.1. Surface Observation Data

Hourly data, including PM2.5 composition and concentration, from the SMA super site (latitude: 37.6098, longitude: 126.9348) provided by the National Institute of Environmental Research, were used in this study. PM2.5 mass concentrations were measured through the beta-ray absorption method, using a BAM1020 (MetOne Instrument Inc., Grants Pass, OR, USA). Ionic components were monitored by ion chromatography, using a URG-9000D Aerosol Ion Monitor (URG Corporation, Chapel Hill, NC, USA), and carbonaceous components were measured by using a 4F-semi-continuous carbon field analyzer (Sunset Laboratory Inc., Portland, OR, USA). Elemental carbon (EC) and organic carbon (OC) were determined by using the National Institute for Occupational Safety and Health’s thermal optical transmittance method. Observation data were automatically recorded, using a semi-continuous instrument at 1-hour intervals. These automatic measurements used heated inlets to remove particle-bound water, so water content was excluded in this study [49]. Further details on the measurement techniques and the reliability of evaluation methods can be seen in Park et al. [50,51].
Because each component was measured by using a different instrument, the concentrations of some components were sometimes not measured. To analyze the relative ratios of the individual major chemical components, we only used data that contained concentrations of all five major constituents of PM2.5, namely sulfate, nitrate, ammonium, OC, and EC. Our analysis shows that the composition of measured PM2.5 was sulfate (20%), nitrate (20%), ammonium (13%), OC (11%), and EC (5%) (Figure S1). We present a detailed description in Section 3.1. The ‘unidentified substances’ classification represents the components, excluding the sum of the concentrations of these five major components. Between 2012 and 2016, 58% of hourly data samples contained all of these components. Daily mean concentration was discarded unless at least 75% of the day’s hourly average concentrations were available, leaving 51% (933 days) of the data for analysis. Seasonally, 45%, 42%, 52%, and 63% of winter, spring, summer, and fall data, respectively, were used (Table 1). The monthly average concentration was determined only when five or more daily mean concentrations were available. Using the selected observation data, annual and seasonal changes in PM2.5 ratios and chemical composition were analyzed.

2.2. Air-Quality Modeling

A three-dimensional photochemical modeling system was used for the PM2.5 sensitivity simulations. WRF was used to prepare meteorological input data to be used in a chemical transport model. SMOKE and the Model of Emissions of Gases and Aerosols from Nature (MEGAN) [52] were used to process anthropogenic and biogenic emissions for air-quality modeling, respectively. Finally, CMAQ was used for chemical-transport modeling. The WRF model was configured with 36 vertical layers and used initial fields from the Final Operational Global Analysis (FNL) reanalysis provided by the National Centers for Environmental Prediction (NCEP; Table 2). WRF simulation results were converted for use in the air-quality model, using the Meteorology–Chemistry Interface Processor (MCIP) version 3.6, and the vertical layers were interpolated to 22 layers.
Emission input data were divided into South Korea and Northeast Asia. For Northeast Asia, the MICS-Asia 2010 [53] emissions inventory was used. These data were applied in many air-pollutant-behavior studies in the region [26,27,54]. For South Korea, 2010 Clean Air Policy Support System (CAPSS) [55] data were used. Temporal allocation, spatial allocation, and chemical speciation were performed for each source classification code (SCC) through SMOKE, to incorporate the emission inventory into the air-quality simulation [56]. Biogenic emissions were estimated by using MEGAN. Meteorological data were used for the calculation of biogenic emissions and for vertical allocation of point sources. Air-quality simulation was performed by using CMAQ version 4.7.1. For the chemical mechanism, Statewide Air Pollution Research Center, Version 99 (SAPRC99) [57] was used, and for the aerosol module, Aerosol module version 5 (AERO5) [58] was used (Table 3). The model domain for Northeast Asia included the Korean Peninsula, China, and Japan, and used a 27 km horizontal resolution to account for the influence of long-range transport (Figure 1).

2.3. Model Performance Evaluation

The performance of the base simulation was evaluated by a comparison of its results with surface measured concentrations. Table S1 shows that the statistical evaluation of CMAQ model performance for PM2.5 was performed by comparing the results of the air-quality modeling system (described in Section 2.2) with the observed data from the SMA super site. The performance statistics proposed by Emery et al. [59] were used as the evaluation criteria. For PM2.5, the normalized mean bias (NMB) was −11%, the normalized mean error (NME) was 30%, and the correlation coefficient (R) was 0.72, indicating that model performance is consistent with the goal level suggested by Emery et al. [59]. Sulfate and OC components were underestimated by 28% and 8%, respectively, while nitrate and EC components were overestimated by 33% and 121%, respectively. Simulations of all components satisfied the performance criteria proposed by Emery et al. [59]. At the same time, the model shows interannual variability of performance. PM2.5 was underestimated for the years 2013 and 2014 (MB: −8.1 μg/m3, NMB: −22%), while the simulated PM2.5 concentrations for the year 2015 were similar to observed PM2.5 concentrations (MB: −0.6 μg/m3, NMB: 2%). We noticed that the simulated nitrate bias had increased from 2.4 μg/m3 (2012) to 5.0 μg/m3 (2015) (Figure S2). We compared 1 h average observed values of meteorological variables with the WRF-simulated values in Northeast Asia during the years 2012 to 2016 (Table S2). Meteorological observation data were obtained from the United States National Centers for Environmental Prediction (NCEP) and Meteorological Assimilation Data Ingest System (MADIS). Overall, the simulated 2 m temperature and 10 m wind speed satisfied the statistical benchmarks that were proposed by Emery et al. [60]. According to Zheng et al. [19], Chinese NOX and SO2 emissions decreased by 23% and 53%, respectively, during the years 2012 to 2016. However, this study used a fixed emission inventory. This may affect nitrate overestimation and simulated sulfate bias reduction in recent years. Model bias changes warrant further analysis in the future, but a detailed analysis is outside the scope of this study. Figures S3 and S4 show a comparison of the simulated and observed PM2.5 concentrations in China from 2015 to 2016. Surface observation data for China were obtained only in 2015 and 2016. For PM2.5, NMB, NME, and R were −4%, 13%, and 0.91, respectively. These values meet the goal level suggested by Emery et al. [59].

2.4. Estimation of Chinese Emission Impacts

The impact of Chinese emissions on surface PM2.5 concentrations in the SMA were analyzed, using the brute-force method (BFM), which measures the sensitivity of resultant concentrations by using a perturbed emission input. In addition to the air-quality simulation that used base emissions (the base simulation), an impact analysis simulation was conducted that changed the target emissions (simulation with perturbed emissions). The sensitivity factor, which represents the airborne pollutant concentration change relative to the emissions change, was then estimated, using the following equation [61]:
S p , i = C p     C p , i Δ e i
where S p , i indicates the sensitivity factor for the emission area, i , and the concentration of pollutant, p , derived through BFM; C p is the atmospheric concentration of nitrate, sulfate, ammonium, OC, and EC in SMA; C p , i is the re-simulated concentration of emission area, i, after changing the emissions by e %; and Δ e i is the emission-reduction rate of emission area, i. In this study, i indicates Chinese sources and the emissions of all precursors were reduced simultaneously. A BFM emission-reduction rate of 50% was used to derive the sensitivity factor. This rate was determined after reviewing previous studies that used BFM to analyze the impacts of PM emissions in Northeast Asia [46,62,63]. A high reduction rate can prevent the influence of numerical noise that may be apparent if the emission reduction rate is too small [64].
The zero-out contribution (ZOC) [65] represents the change in concentration when the emission reduction rate of the target area is assumed to be 100%, using the derived sensitivity factor. ZOC was used as the concentration impact of the target emissions in this study. The impact of Chinese emissions on the PM2.5 concentration in SMA was calculated by adding the ZOCs of each component, in the following manner:
ZOC p , i = S p , i × 100
ZOC i = p = 1 n ( ZOC p , i )
For the air-quality simulation, it was difficult to perfectly represent the observed concentrations during the target period. When utilizing simulation results, the US Environmental Protection Agency recommends using the observed and simulated concentrations and considering the relative changes of the simulated concentrations according to emission changes [66]. Taking this into account, this study corrected the impact-analysis results, using the relative ratio of the simulated and observed concentrations. This correction is similar to the relative response factor (RRF) of the United States EPA, and it is described as the contribution correction factor (CCF) in this study [67]. CCFp,d is the ratio of the observed and simulated concentrations for each component (p) and was calculated by day (d), in the following way:
CCF p , d = C ( OBS ) p , d C ( MOD ) p , d
The process of correcting the emission impact using CCF is shown in Equation 5. The impact of emission area, i, on component p in daily units (d; ZOCi,p,d) is multiplied by CCFp,d, which is determined by component and day. The corrected ZOC (Adjusted ZOCi,d) is considered to be the impact of Chinese emissions.
Adjusted   ZOC i , d = p = 1 n ( ZOC i , p , d × CCF p , d )
This methodology to estimate the Chinese emission impact used a fixed emissions inventory and perturbed Chinese emissions. Therefore, the methodology has a limitation, in that recent changes in Chinese emissions cannot be considered.

3. Results and Discussion

3.1. Concentration and Chemical Composition of PM2.5

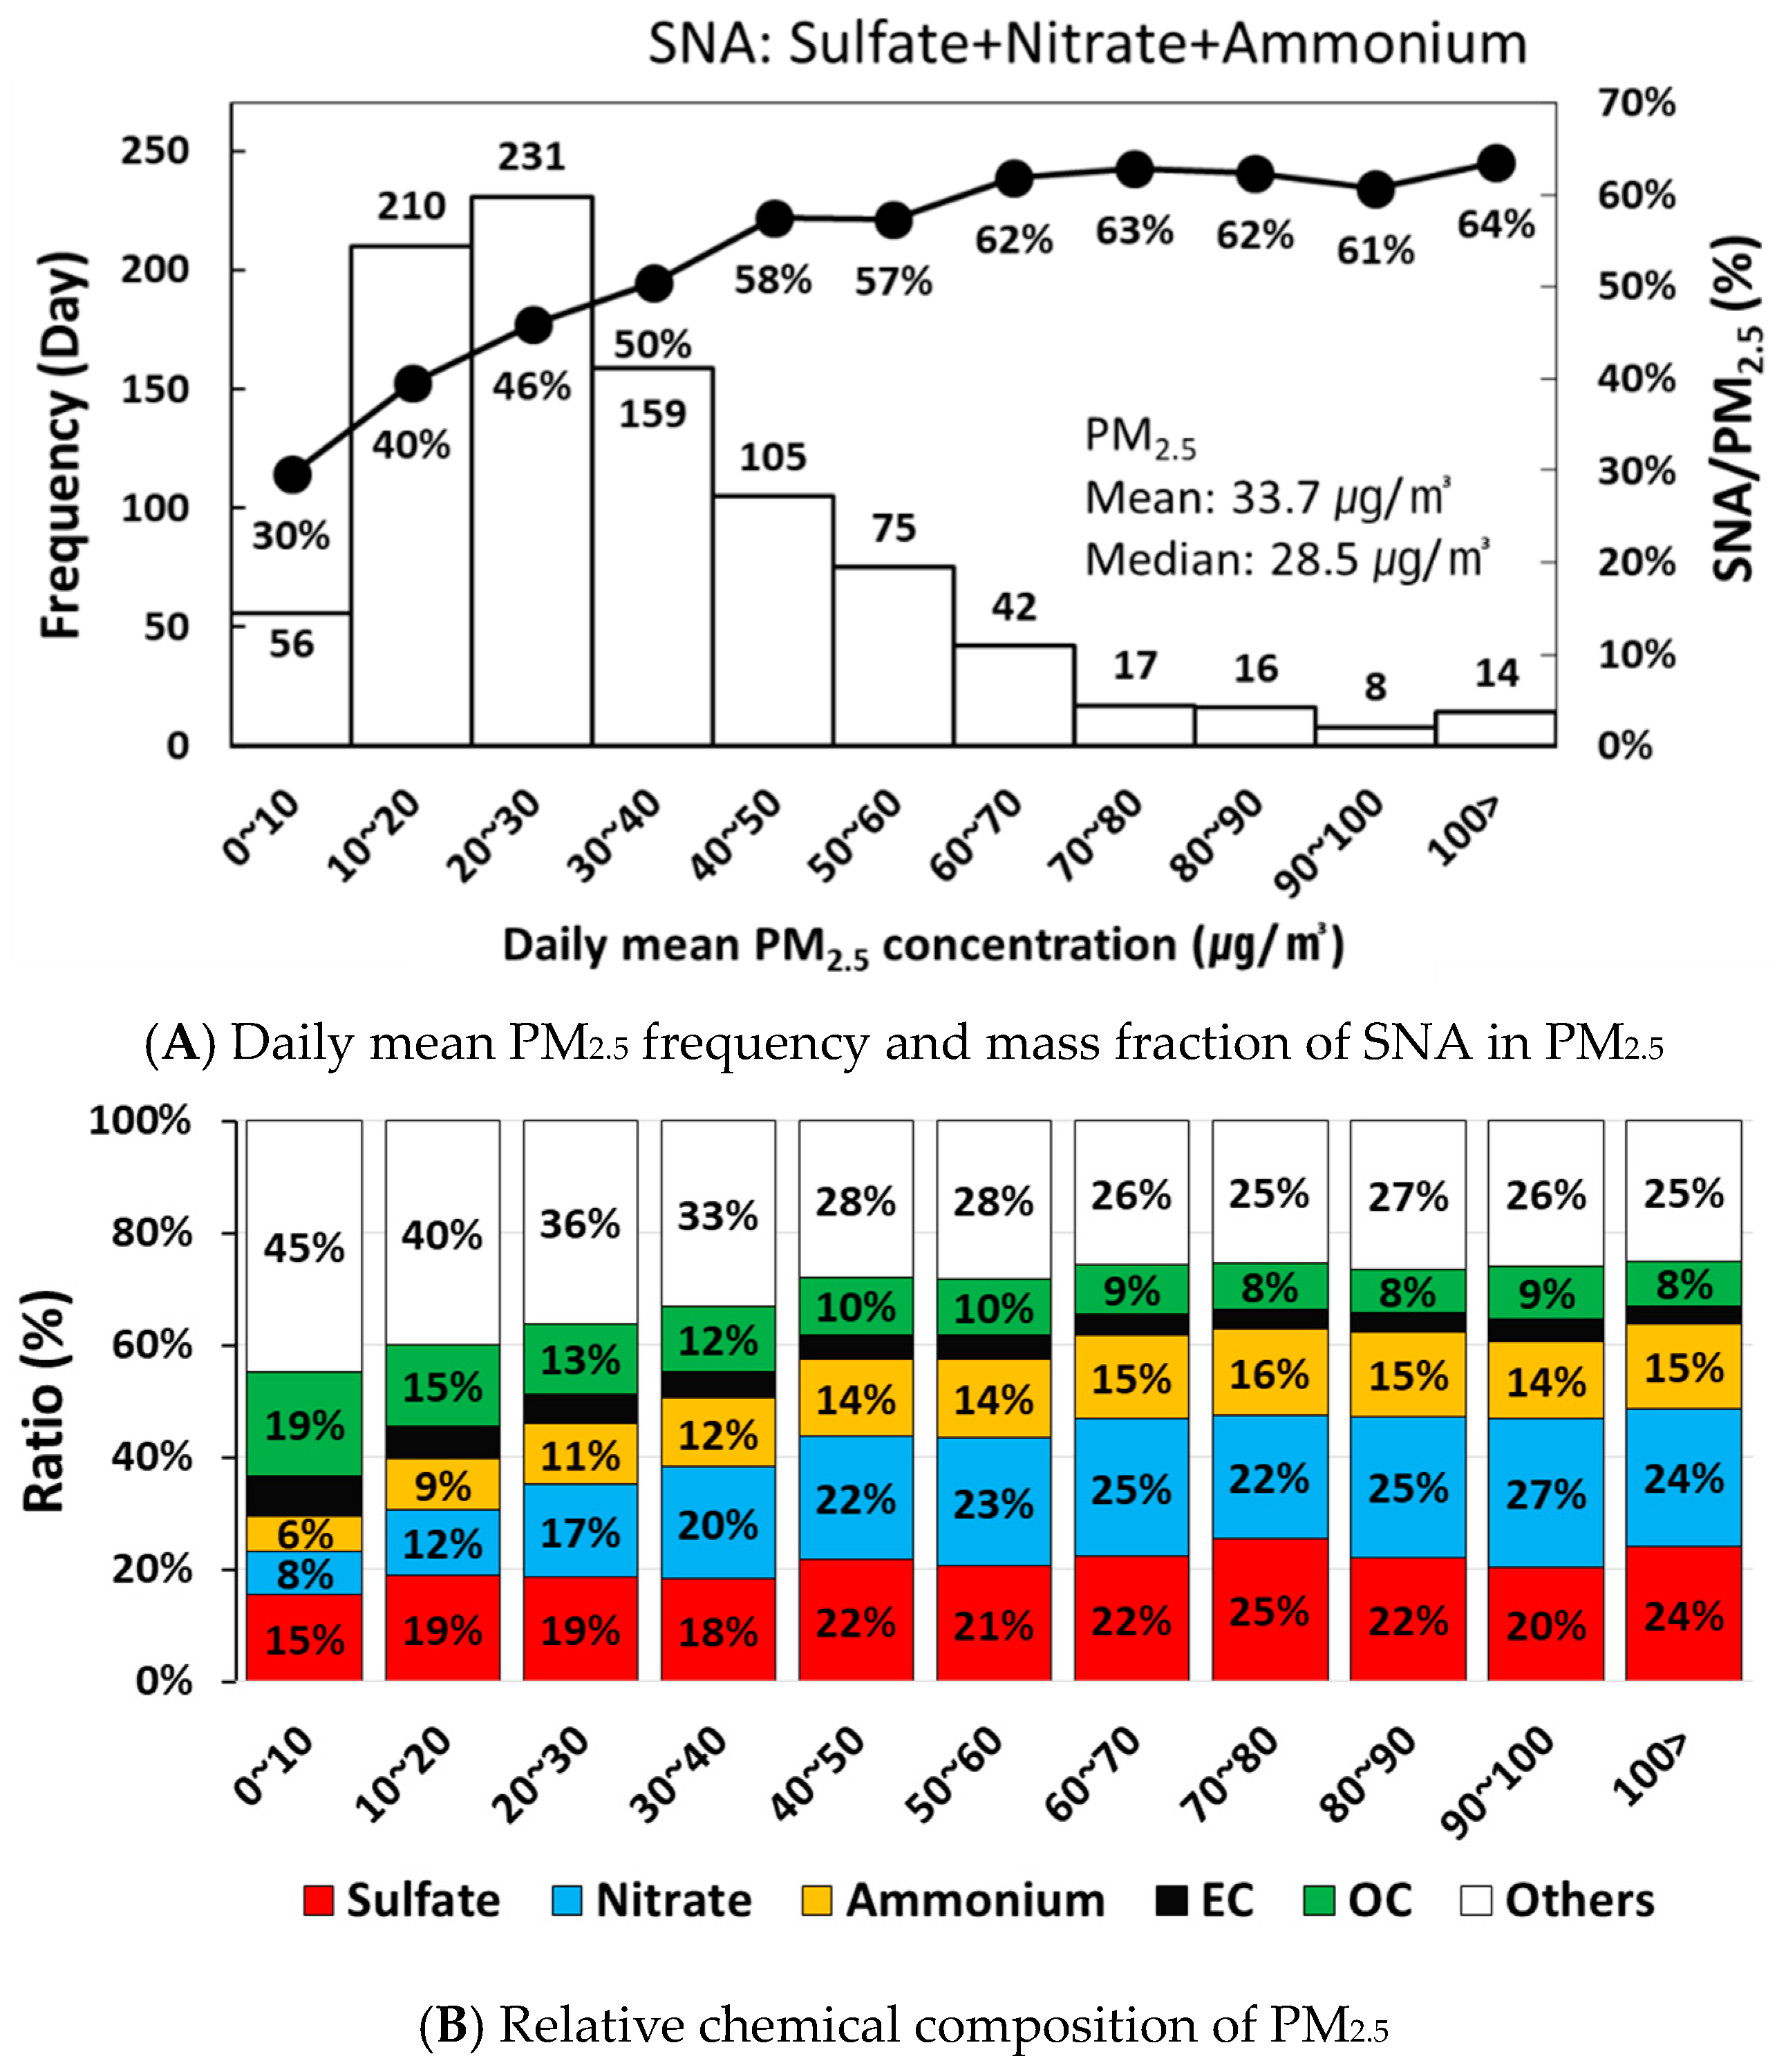
The average PM2.5 concentration observed at the SMA super site during 2012–2016 was 33.7 µg/m3. On average, the five major constituents account for 69% of the PM2.5 concentrations. Unidentified substances make up 31% of PM2.5 and a significant part of PM2.5 mass. However, the analysis of unidentified substances is challenging because previous studies have reported that the unidentified substances possibly consisted of various ion and trace metal species (e.g., Na+, K+, Ca2+, Mg2+, Cl, and Fe [5,31]), and their measurements have large uncertainties [50]. Unidentified substances are discussed further in the last part of this section. To identify the major chemical components during high PM2.5 events in the SMA, daily mean PM2.5 concentrations were divided into 10 µg/m3 concentration bins. The average chemical component ratios for each bin are shown in Figure 2. The number of days in the 0–10 µg/m3 concentration bin was 56 days (6%), and the composition ratios of unidentified substances, inorganic ions, OC, and EC were 45%, 29%, 19%, and 7%, respectively. When the PM2.5 concentration was lower than 10 µg/m3, the unidentified substances component was high, while inorganic ions and carbonaceous components (OC + EC) were similar. When applying the South Korean OM/OC ratio (1.6–1.8) proposed in previous studies [68,69], the ratio of carbonaceous components became higher than that of inorganic ions. Previous studies that have measured the chemical composition of PM2.5 globally reported that the mass concentration of OM was approximately 40% [1]. Cheng et al. [2] reported that the mass concentration of carbonaceous components was approximately 39%. Globally, PM2.5 contains more carbonaceous components than inorganic ions; however, in China and South Korea, when the PM2.5 concentration is higher than 30 µg/m3, PM2.5 contains more inorganic ions than carbonaceous components [2]. This indicates that the importance of carbonaceous components and inorganic ions can differ depending on PM2.5 concentration.
The 10–20 (210 days) and 20–30 µg/m3 (231 days) PM2.5 concentration bins had the highest observation frequencies and together accounted for 47% of observation days. At these concentrations, the ratio of inorganic ions increased from 40% to 47%, whereas the ratio of carbonaceous components decreased from 20% to 18%. This change in component ratios continued until the 50–60 µg/m3 bin, and no significant differences were observed in higher concentration bins. From the 30–40 µg/m3 bin, which is higher than the national ambient air-quality standard of 35 µg/m3 for daily mean PM2.5 in South Korea, the ratio of inorganic ions exceeded 50% of the total PM2.5 mass, with the nitrate ratio exceeding that of sulfate. Although observations were limited, when the PM2.5 concentration was 100 µg/m3, the ratio of inorganic ions was high (63%). In summary, inorganic ions were the largest components of PM2.5 in the SMA. Nitrate became predominant for the bins of PM2.5 concentrations exceeding 30 µg/m3.

3.2. Seasonal Changes

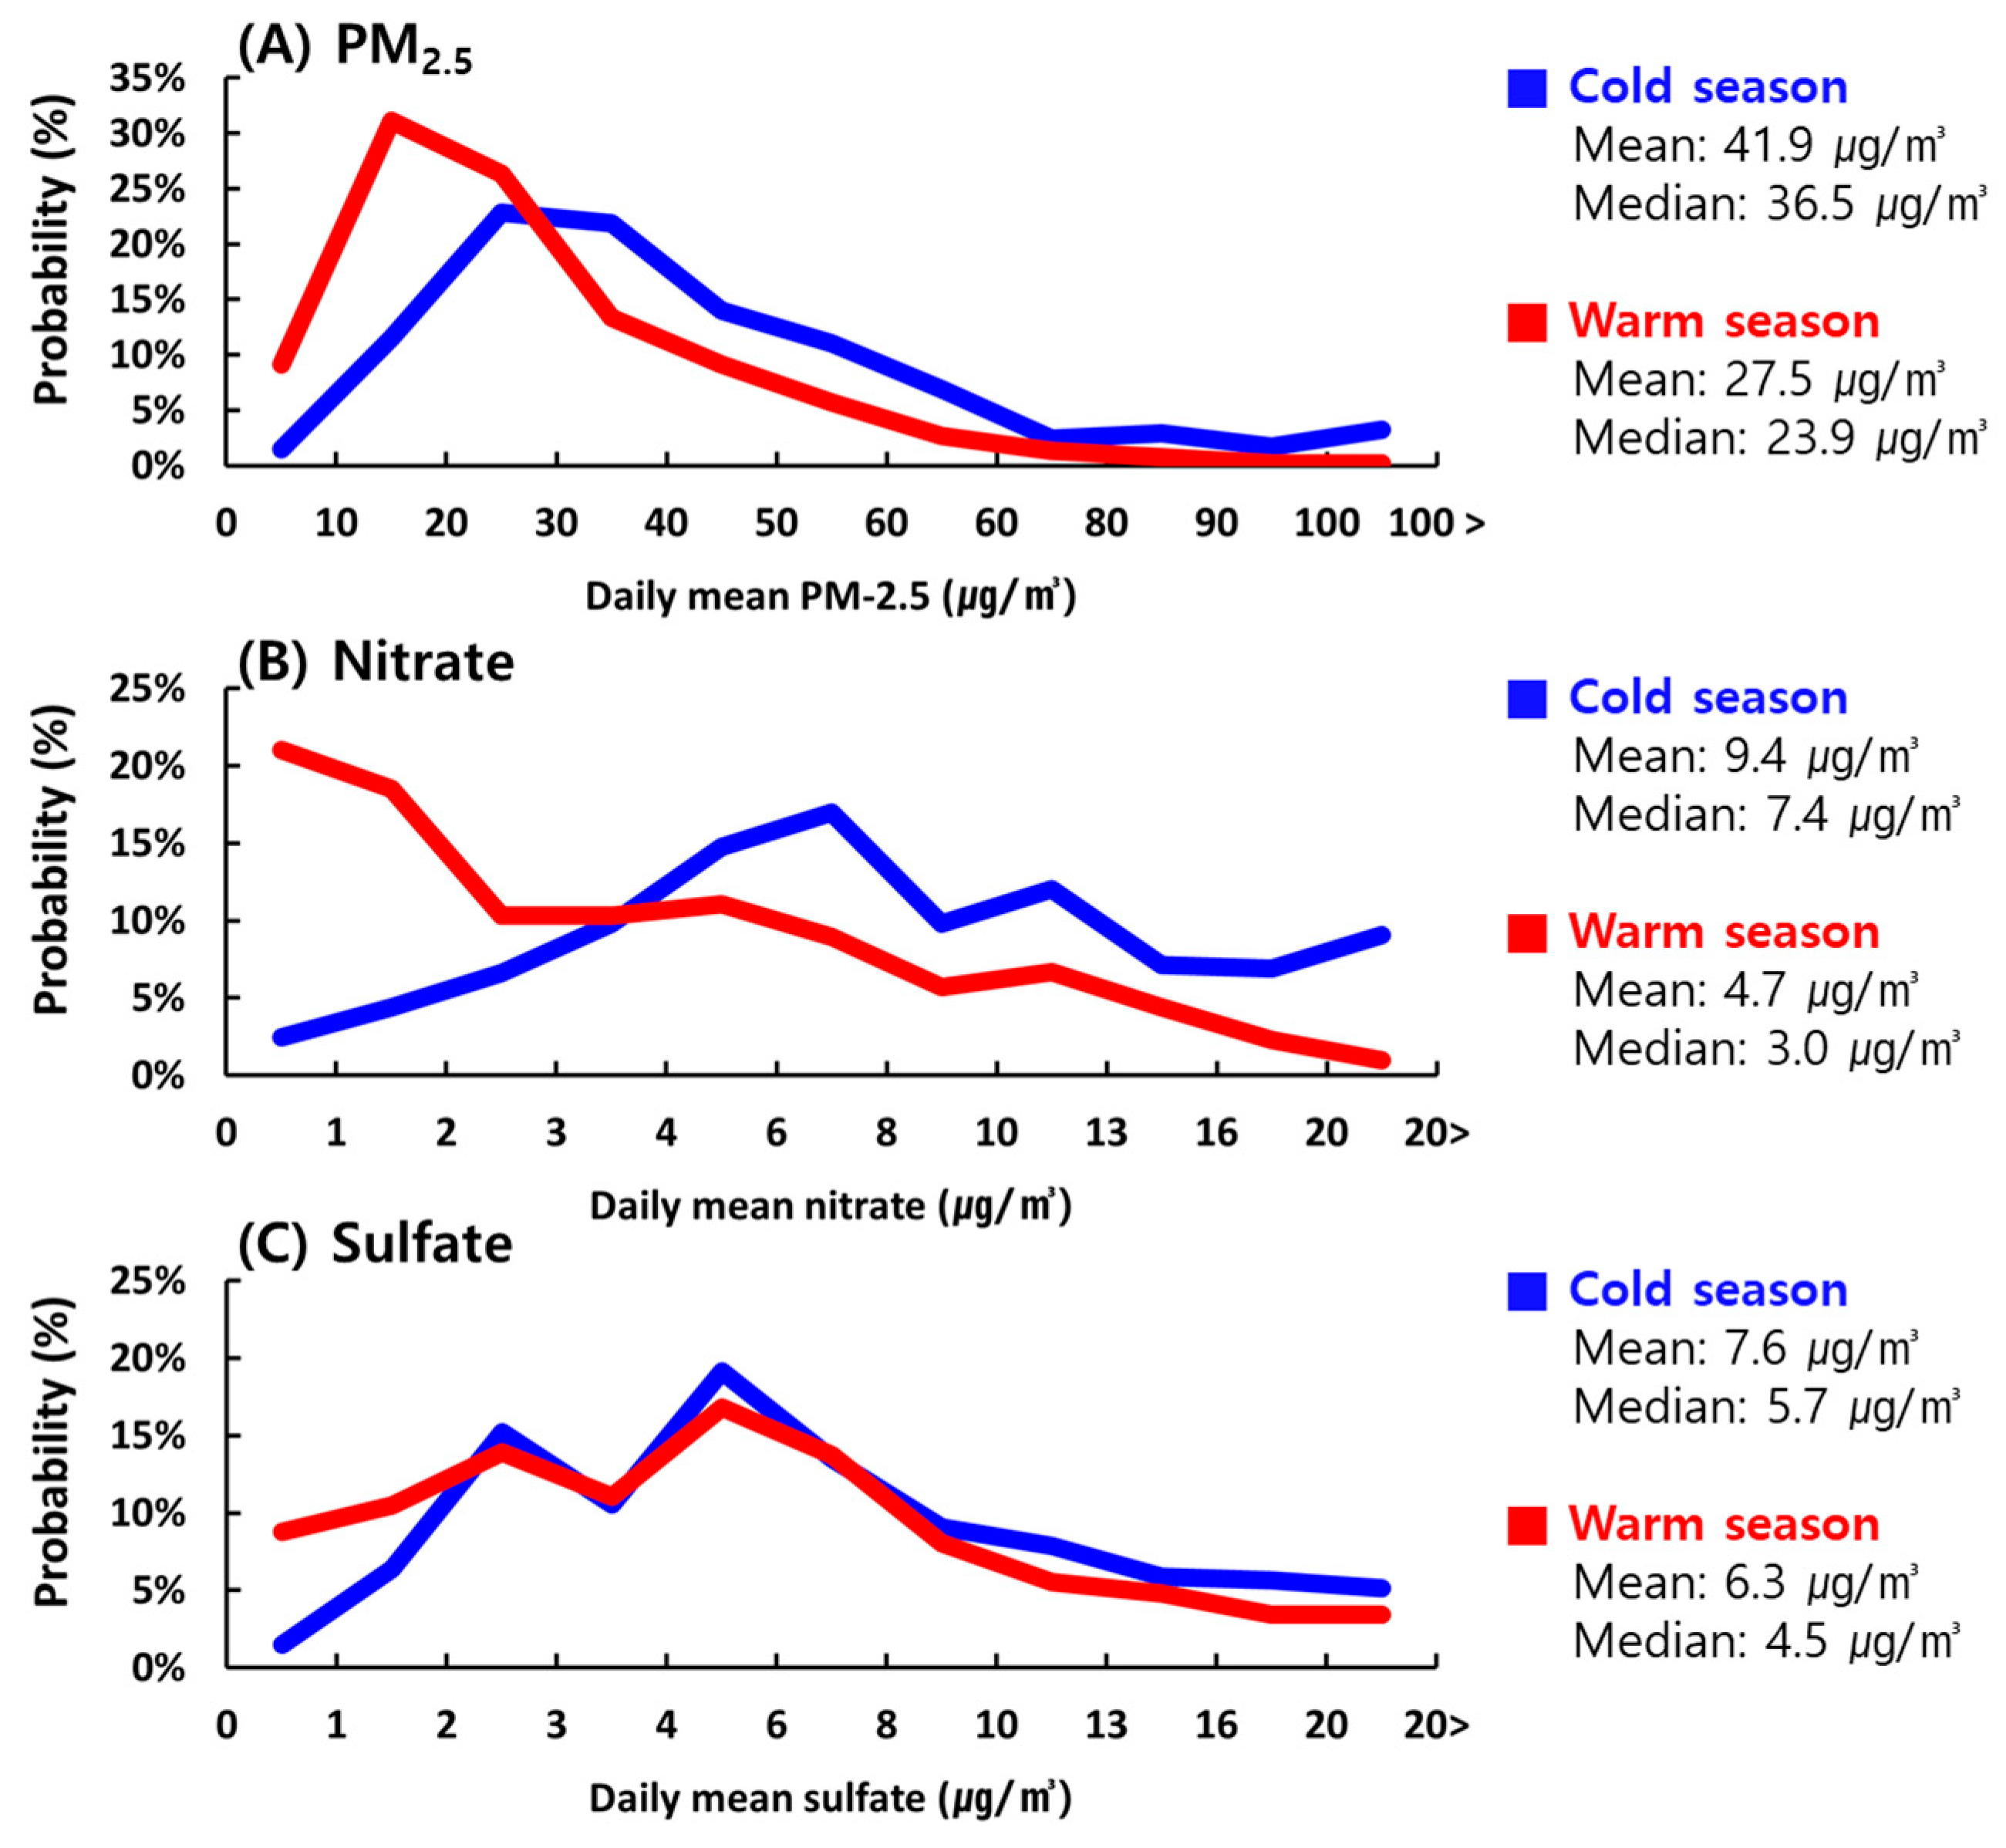
Figure 3A shows the frequency distribution of PM2.5 concentrations during the cold (winter and spring) and warm seasons (summer and autumn). Frequencies are shown as probabilities to account for the varying amounts of data available in the cold and warm seasons. The mean and median PM2.5 concentrations in the cold season were 41.9 and 36.5 µg/m3, respectively, making it approximately 13 µg/m3 higher when compared to the warm season. The 20–30 µg/m3 concentration bin was the highest, at 22.9%, and the probability of a concentration over 70 µg/m3 was 10% during the cold season. In contrast, a concentration of 10–20 µg/m3 PM2.5 was most likely (31%) during the warm season, and more than 90% of the observed concentrations were under 50 µg/m3.
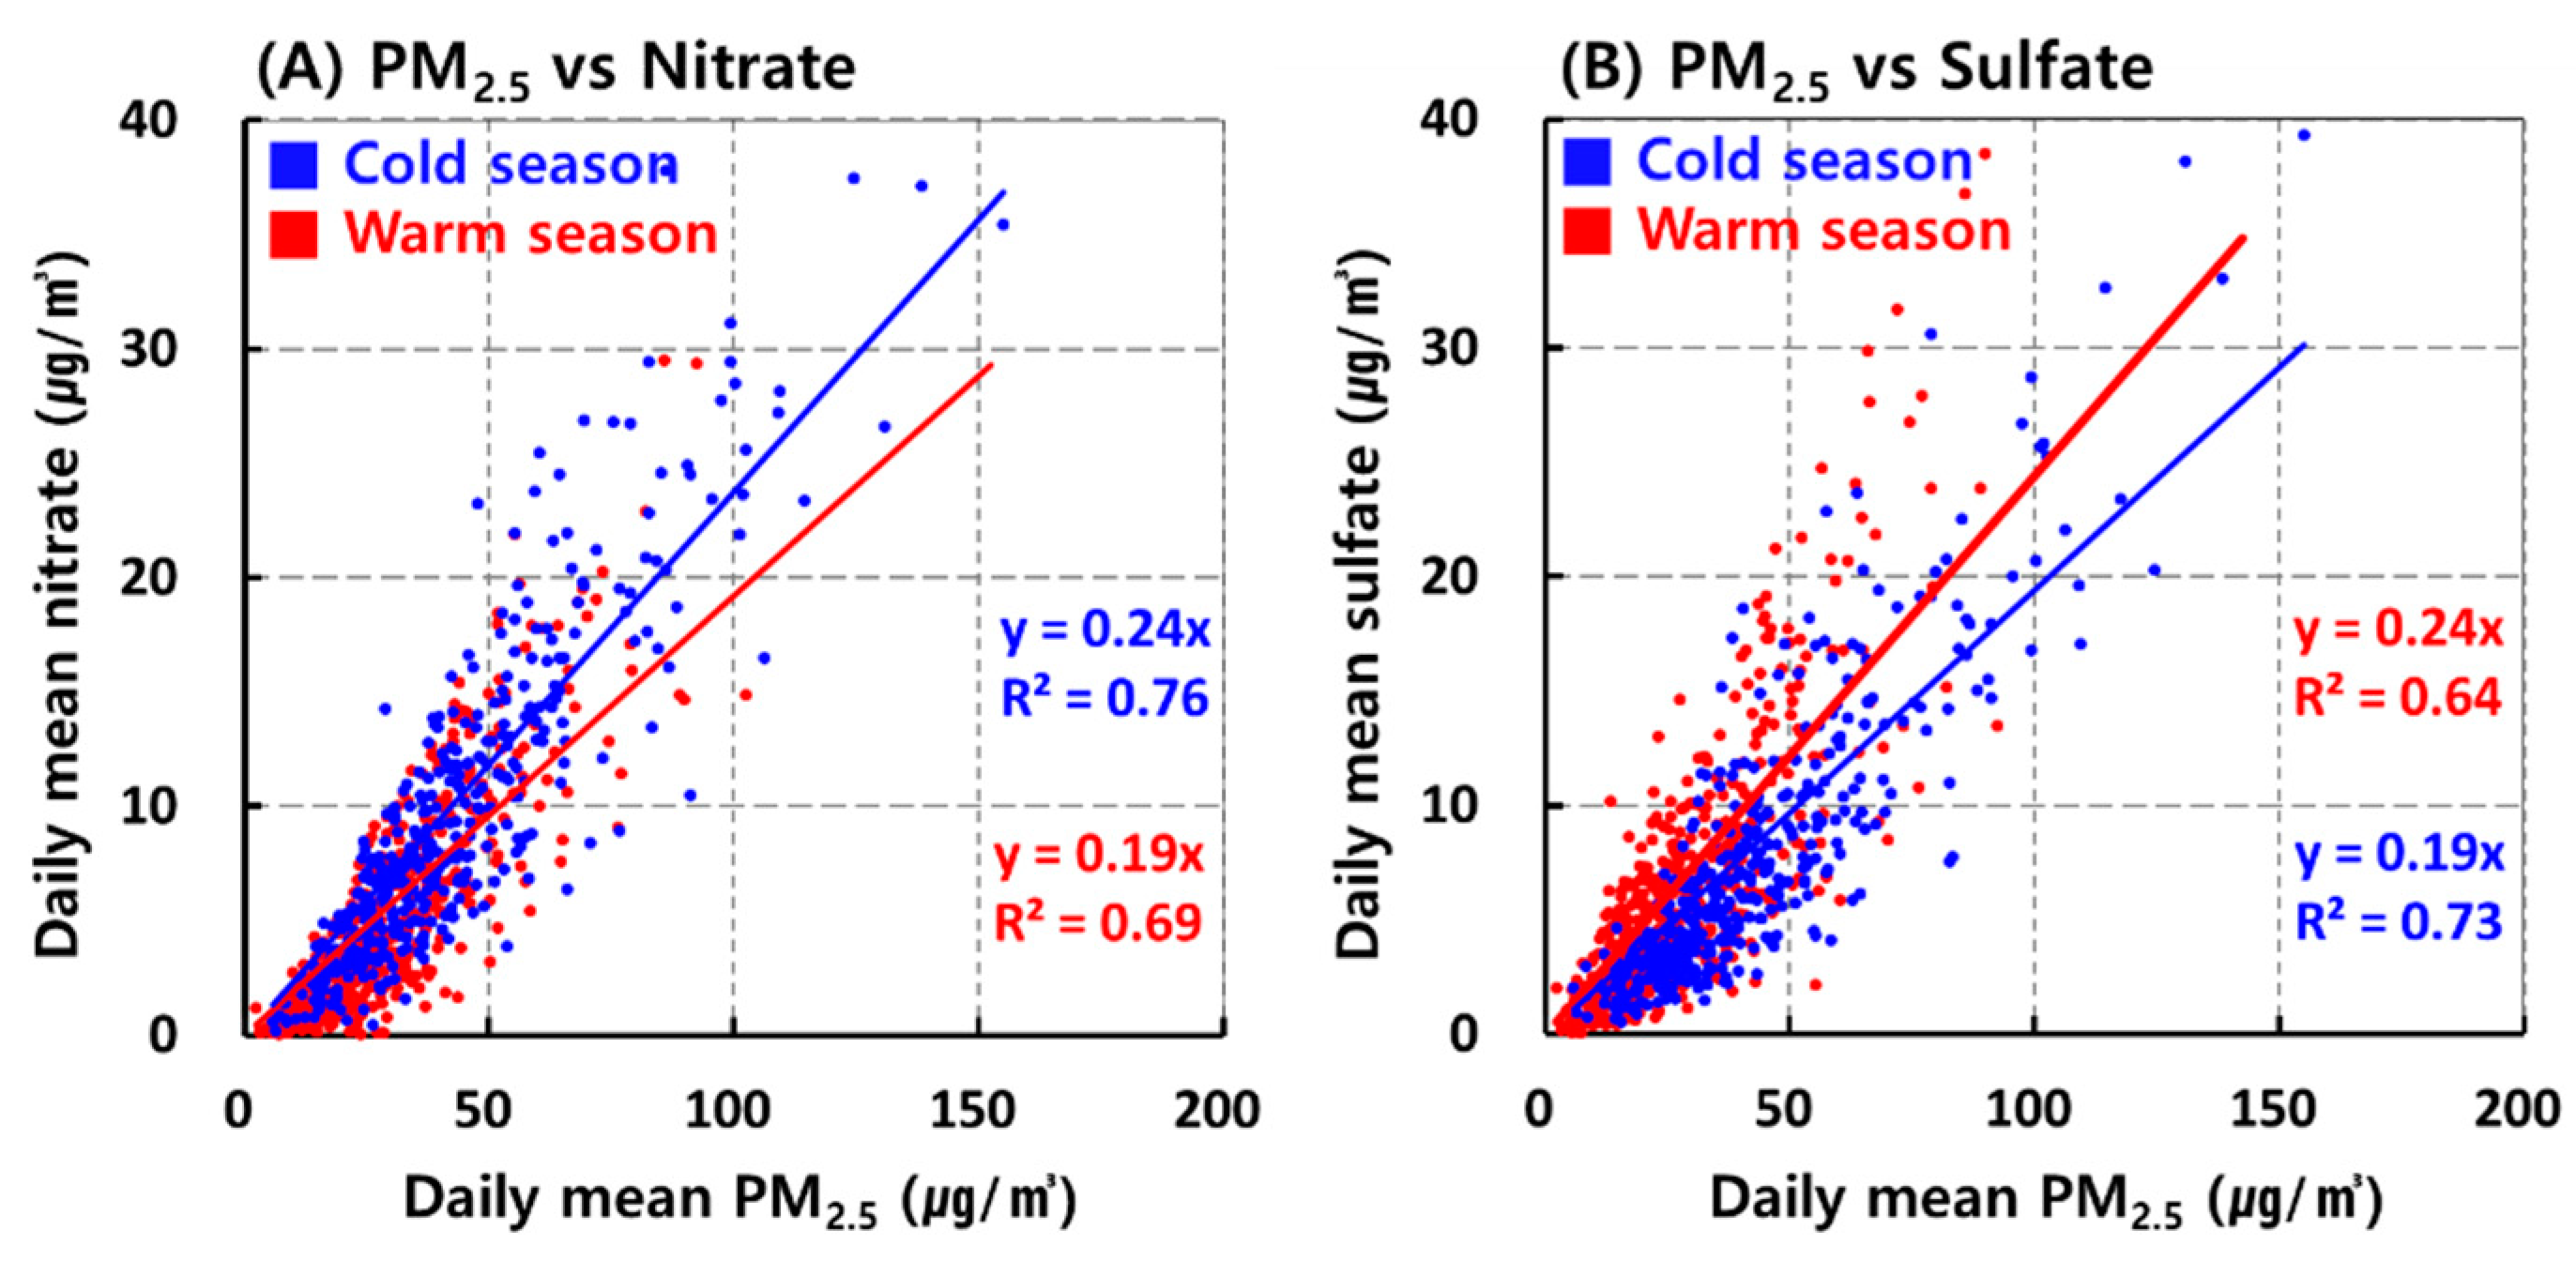
Figure 3B,C shows the frequency distribution of nitrate and sulfate concentrations during the cold and warm seasons. The mean concentrations of nitrate and sulfate were 9.4 µg/m3 (23%) and 7.6 µg/m3 (19%) respectively, in the cold season. Notably, the nitrate concentration in the cold season was twice that of the warm season. Conversely, the sulfate concentration was 6.3 µg/m3 (23%) during the warm season, higher by 1.6 µg/m3 as compared to nitrate. Figure 4 shows the correlation of nitrate and sulfate concentrations, with the daily mean PM2.5 concentration. It was found that, in the cold season, nitrate concentrations tend to be higher than sulfate concentrations for the same PM2.5 concentration, while in the warm season, this tendency was reversed. This clearly represents the seasonality in SMA of sulfate and nitrate, the major PM2.5 components. It is possible that, during the warm season, sulfate formation was enhanced due to temperature and relative humidity increase [70,71], while nitrate could be dissociated and evaporated at high temperatures [17,70,72]. Conversely, in the cold season, nitrate formation could be enhanced, and the nitrate concentration would remain high due to meteorological conditions facilitating the accumulation and conversion of air pollutants. Previous studies for measurements of PM2.5 and its chemical components in the SMA also showed the highest nitrate concentrations in spring and winter [4,16,35]. At the same time, nitrate concentrations were generally highest in winter and autumn in observational studies conducted in China [73,74,75,76]. The seasonal variances of nitrate concentrations in SMA seem to be influenced by regional characteristics of SMA.
Overall, the results suggest that managing inorganic ions is an important factor in controlling SMA PM2.5 concentrations. From an emission-control standpoint, this means that ionic aerosol precursors such as NOX, SO2, and NH3 should be reduced. In particular, Figure 3A shows that the nitrate ratio is high during the cold season, when high PM2.5 concentrations are frequently observed in the SMA. Hence, NOX emission control should be given a high priority for more effective control of annual PM2.5 concentrations and occurrence of days with high PM2.5 concentration over the region.
In this section, the seasonal concentration and chemical composition of PM2.5 are analyzed to determine how the composition of the particulates changed with concentration. However, there is uncertainty with the observed data with respect to mass closure, where the total mass of PM2.5 differs by approximately 30% from the mass of the major chemical components (nitrate, sulfate, ammonium, EC, and OC). Possible reasons for the discrepancy would be the missing measurements for some chemical components and uncertainties in automatic measurements. This shows that the quality of the observational data can affect the veracity of the research results. Park et al. [50] evaluated the reliability of automated hourly mean measurements by comparing them with 24 h filter-measurement results at a different super site, using the measurement methods employed in this study. They found underestimations in automated hourly mean measurements of 10%, 24%, 17%, and 17% for sulfate, nitrate, OC, and EC, respectively. If we assume that the observed data used in this study have a similar level of uncertainty, then the composition ratio of inorganic ions could be further increased, especially considering that Park et al. [50] found that the underestimation of nitrate was the most significant. Consequently, this uncertainty is unlikely to impact the results of this study, and because the underestimation of nitrate is the highest, the importance of NOX emission control is still valid.

3.3. Seasonal Chinese Emission Impacts on PM2.5

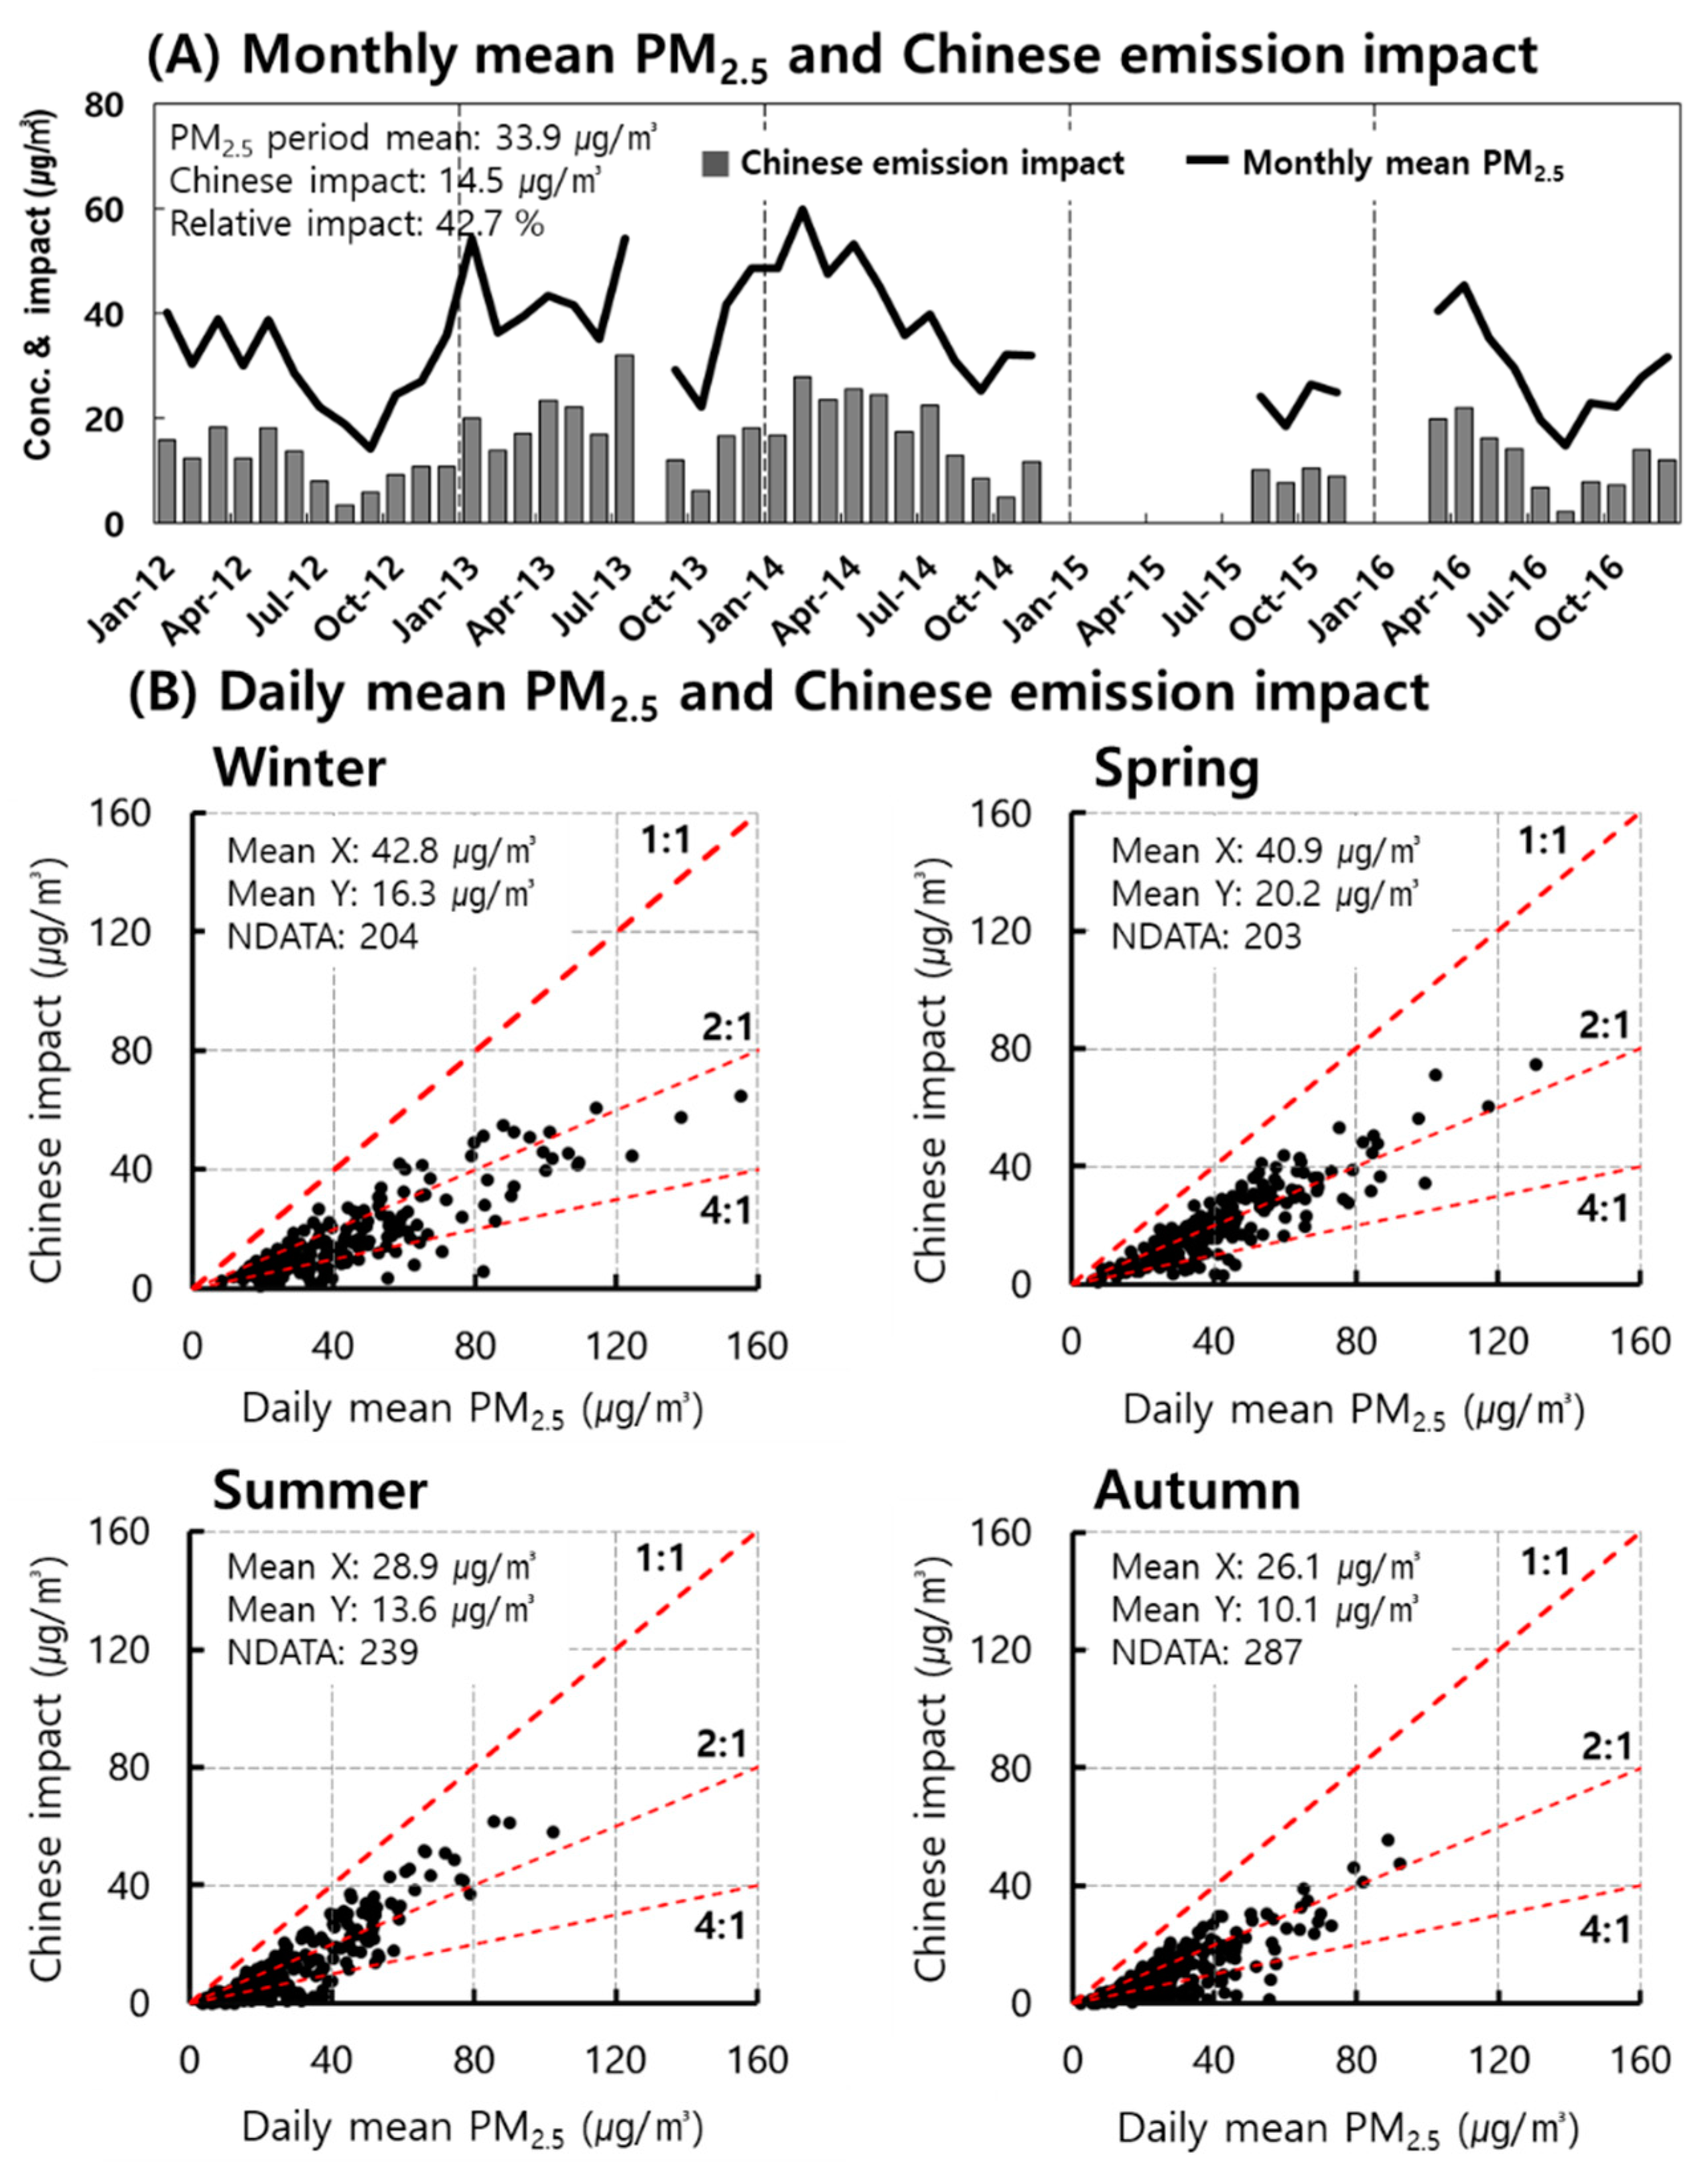
Previous studies have shown that the long-range transport of air pollutants in Northeast Asia affects PM2.5 concentrations [23,24,25,26,54]. When determining the major sources and impact estimation for the seasonal management of PM2.5 in South Korea, long-range transport impacts need to be quantified according to the season and chemical components. Simulation results in Figure 5A show that the period (2012–2016) mean impact of Chinese emissions on SMA PM2.5 concentrations was approximately 43% (14.5 µg/m3) and ranged between 41% (12.1 µg/m3; 2012) and 44% (17.9 µg/m3; 2014). The concentrations and impact were adjusted by CCF, as described in Section 2.4. In 2014, the annual mean SMA PM2.5 concentration was 40.7 µg/m3, the highest in the analysis period. Annual data for 2015 were excluded because of lack of data.
The estimated monthly mean impact of Chinese emissions on SMA PM2.5 ranged from 3 to 43 µg/m3. Chinese emission impacts increased in winter and spring possibly due to the prevailing winds of the northwest monsoon transporting air pollutants from upwind areas [46]. Figure 5B shows that the impact of Chinese emissions on daily mean PM2.5 concentrations in winter and spring were 16.3 µg/m3 (38%) and 20.2 µg/m3 (50%), respectively, decreasing to 13.6 µg/m3 (47%) and 10.1 µg/m3 (39%) in summer and autumn, respectively. In summer, the mass concentration impact of Chinese emissions is low; however, the relative impact (47%) is higher than in winter. Concentrations of the major chemical components changed seasonally (Figure 2 and Figure 3). As described above, inorganic ions are the dominant components of PM2.5 in SMA. Moreover, the relative importance of the carbonaceous components decreased as the PM2.5 concentration increased. Given this, we focused on the analysis of the Chinese emission impact on inorganic ions.
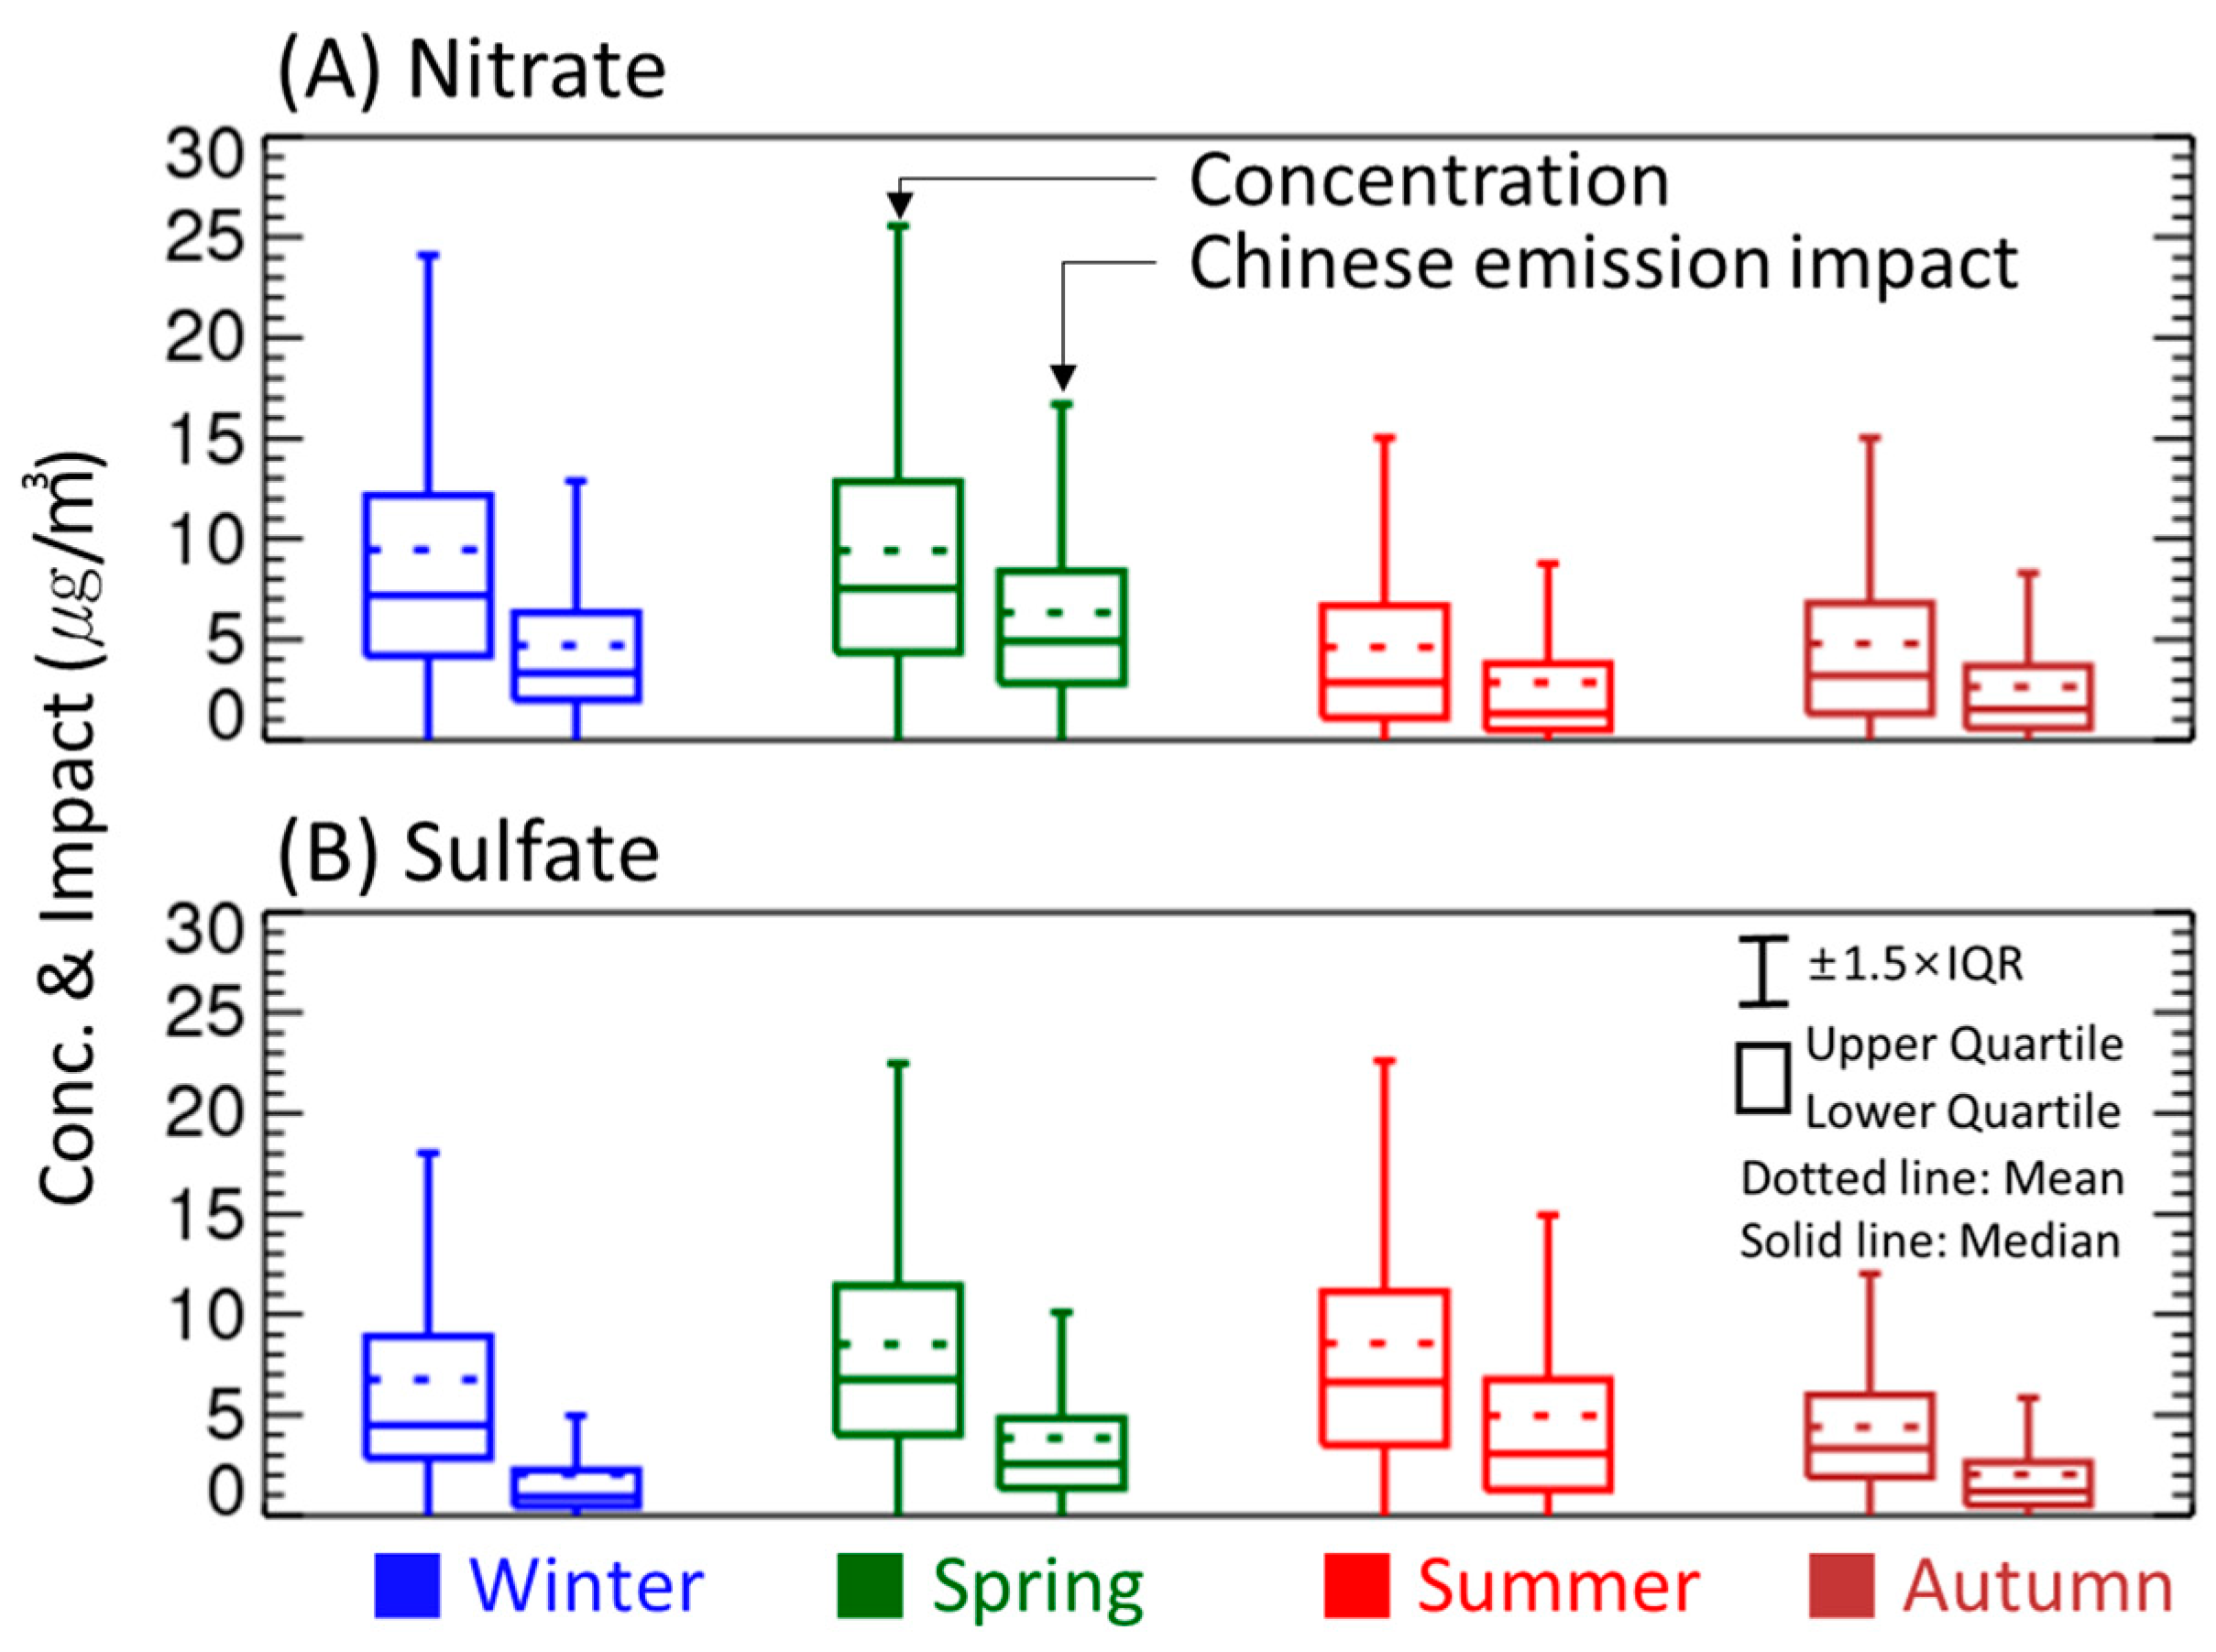
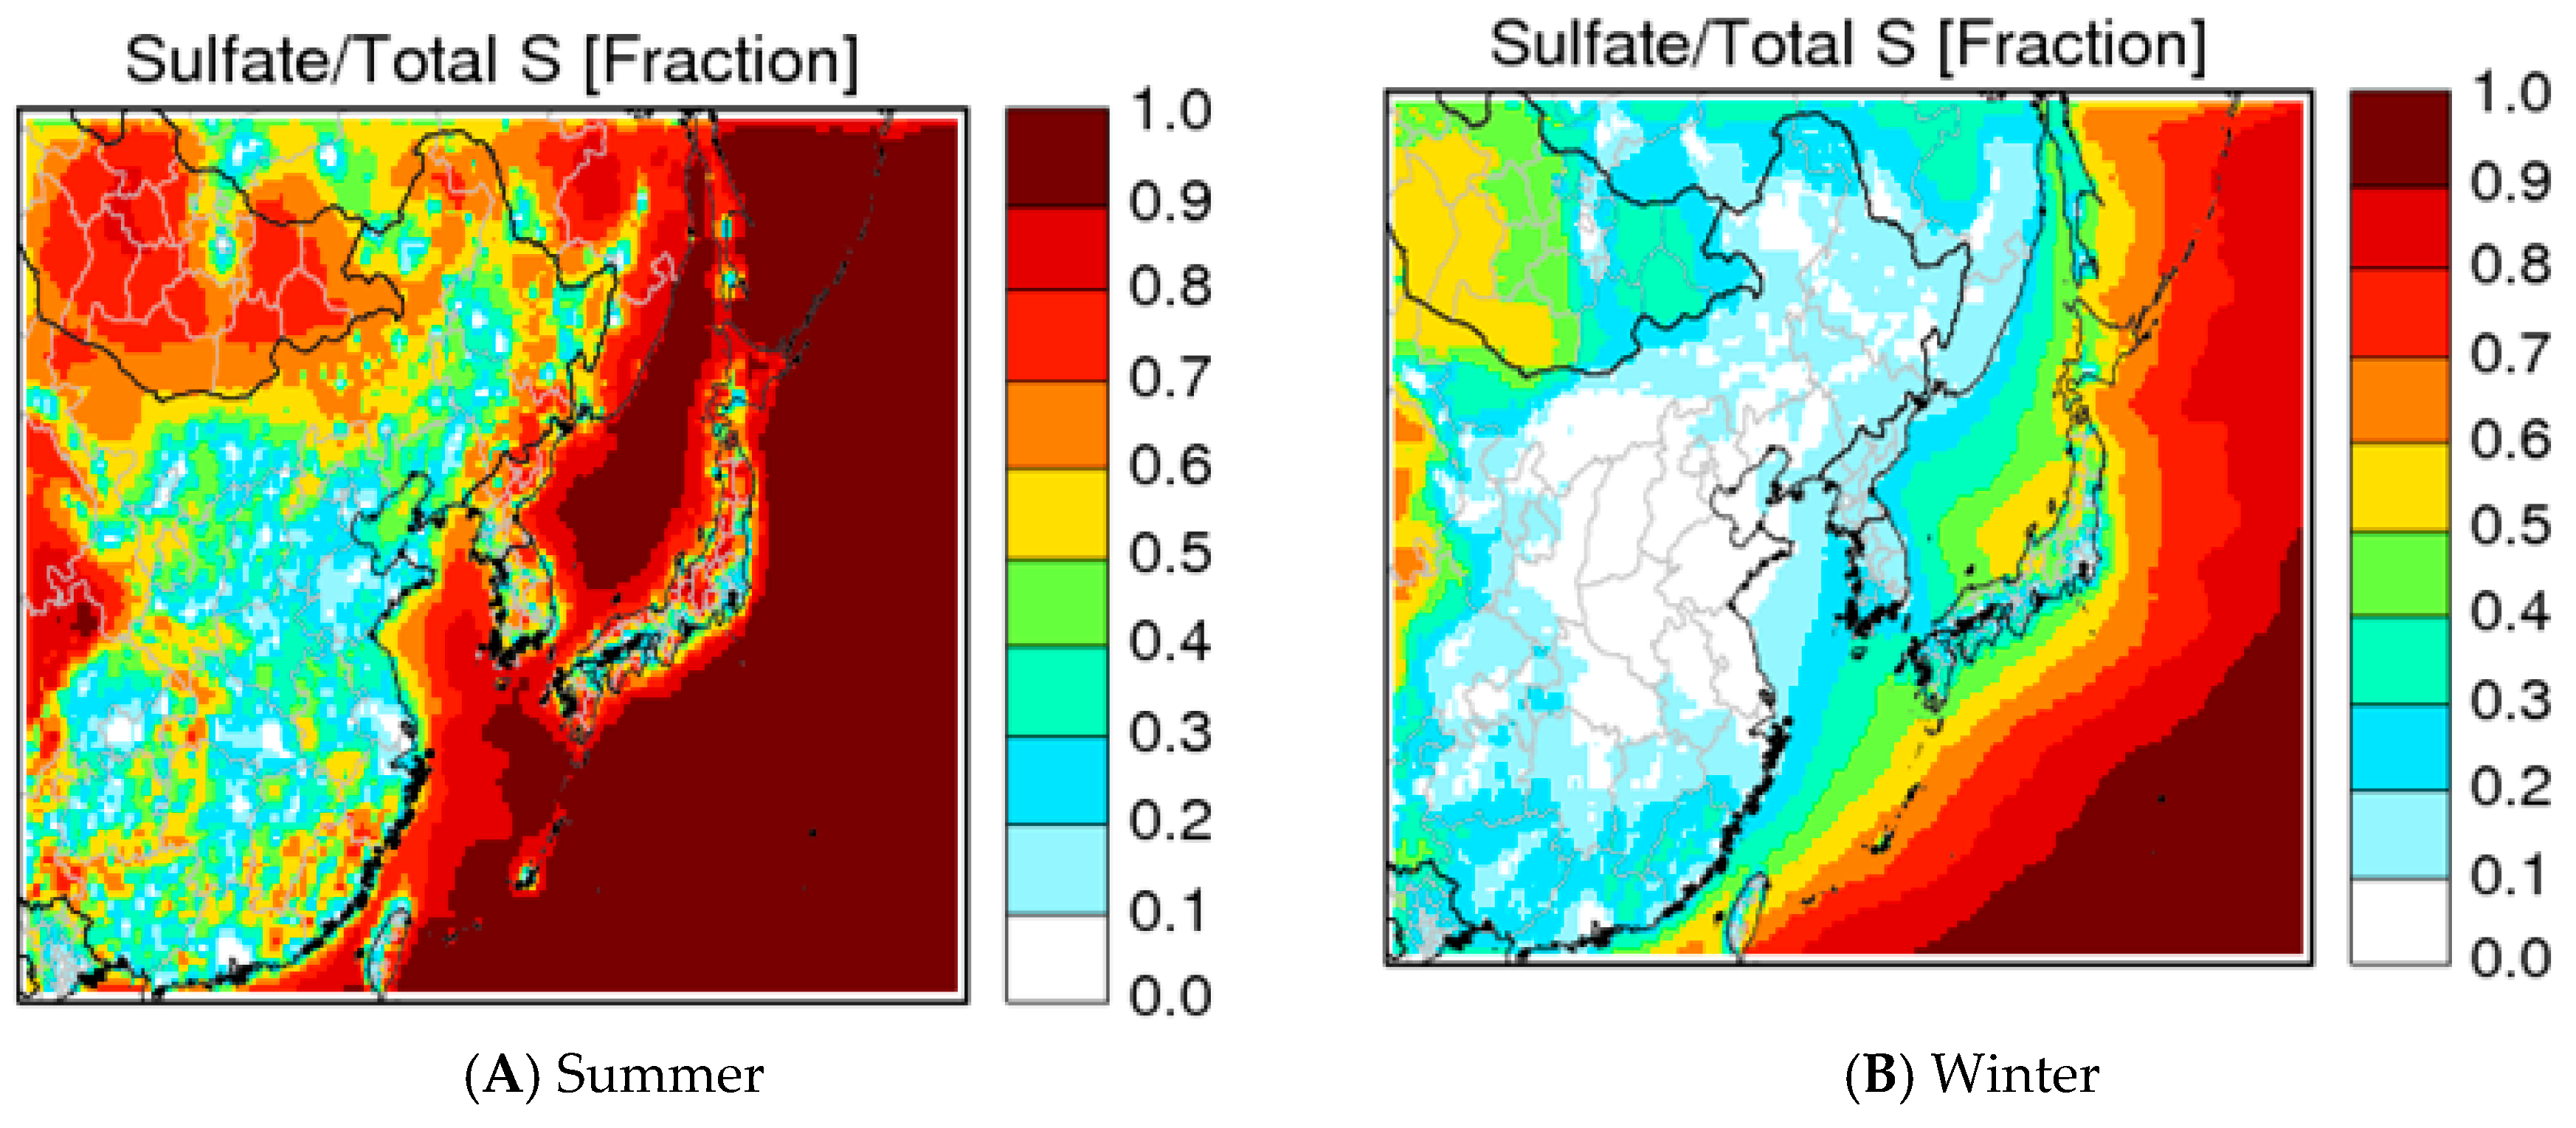
Figure 6 shows that the seasonal nitrate concentration ranged from 4.9 (summer) to 9.6 µg/m3 (winter) and that the Chinese impact on nitrate concentrations ranged from 50% (winter) to 67% (spring). During the spring, when the nitrate concentration was the highest, the impact of Chinese emissions on nitrate was 55%–74%, corresponding to 11%–24% of the PM2.5 mass concentration. Meanwhile, seasonal SMA sulfate concentrations ranged from 4.4 (autumn) and 8.7 µg/m3 (summer), and the impact of Chinese emissions was the highest in summer (58%) and lowest in winter (30%). It has been reported that winter and spring seasons have conditions favorable to the transport of air pollutants from China to South Korea [77,78]. Nevertheless, the Chinese impact on sulfate concentrations in winter was lower than that in summer. Figure S5 shows that the Chinese impact on a total S (defined as a sum of S mass in SO2 and S mass in sulfate) was higher in winter than in summer. Chinese impact on a total S and S mass in sulfate show different seasonal variations: higher for SO2 than for sulfate in the winter season. It may be caused by the (S in sulfate)/(total S) ratio being lower in winter than in summer (Figure 7). Consequently, low Chinese impact on sulfate concentration is evident during the cold months. Previous studies have reported SO2-to-sulfate conversion is slow due to limited liquid- and gas-phase oxidation during winter [79,80].
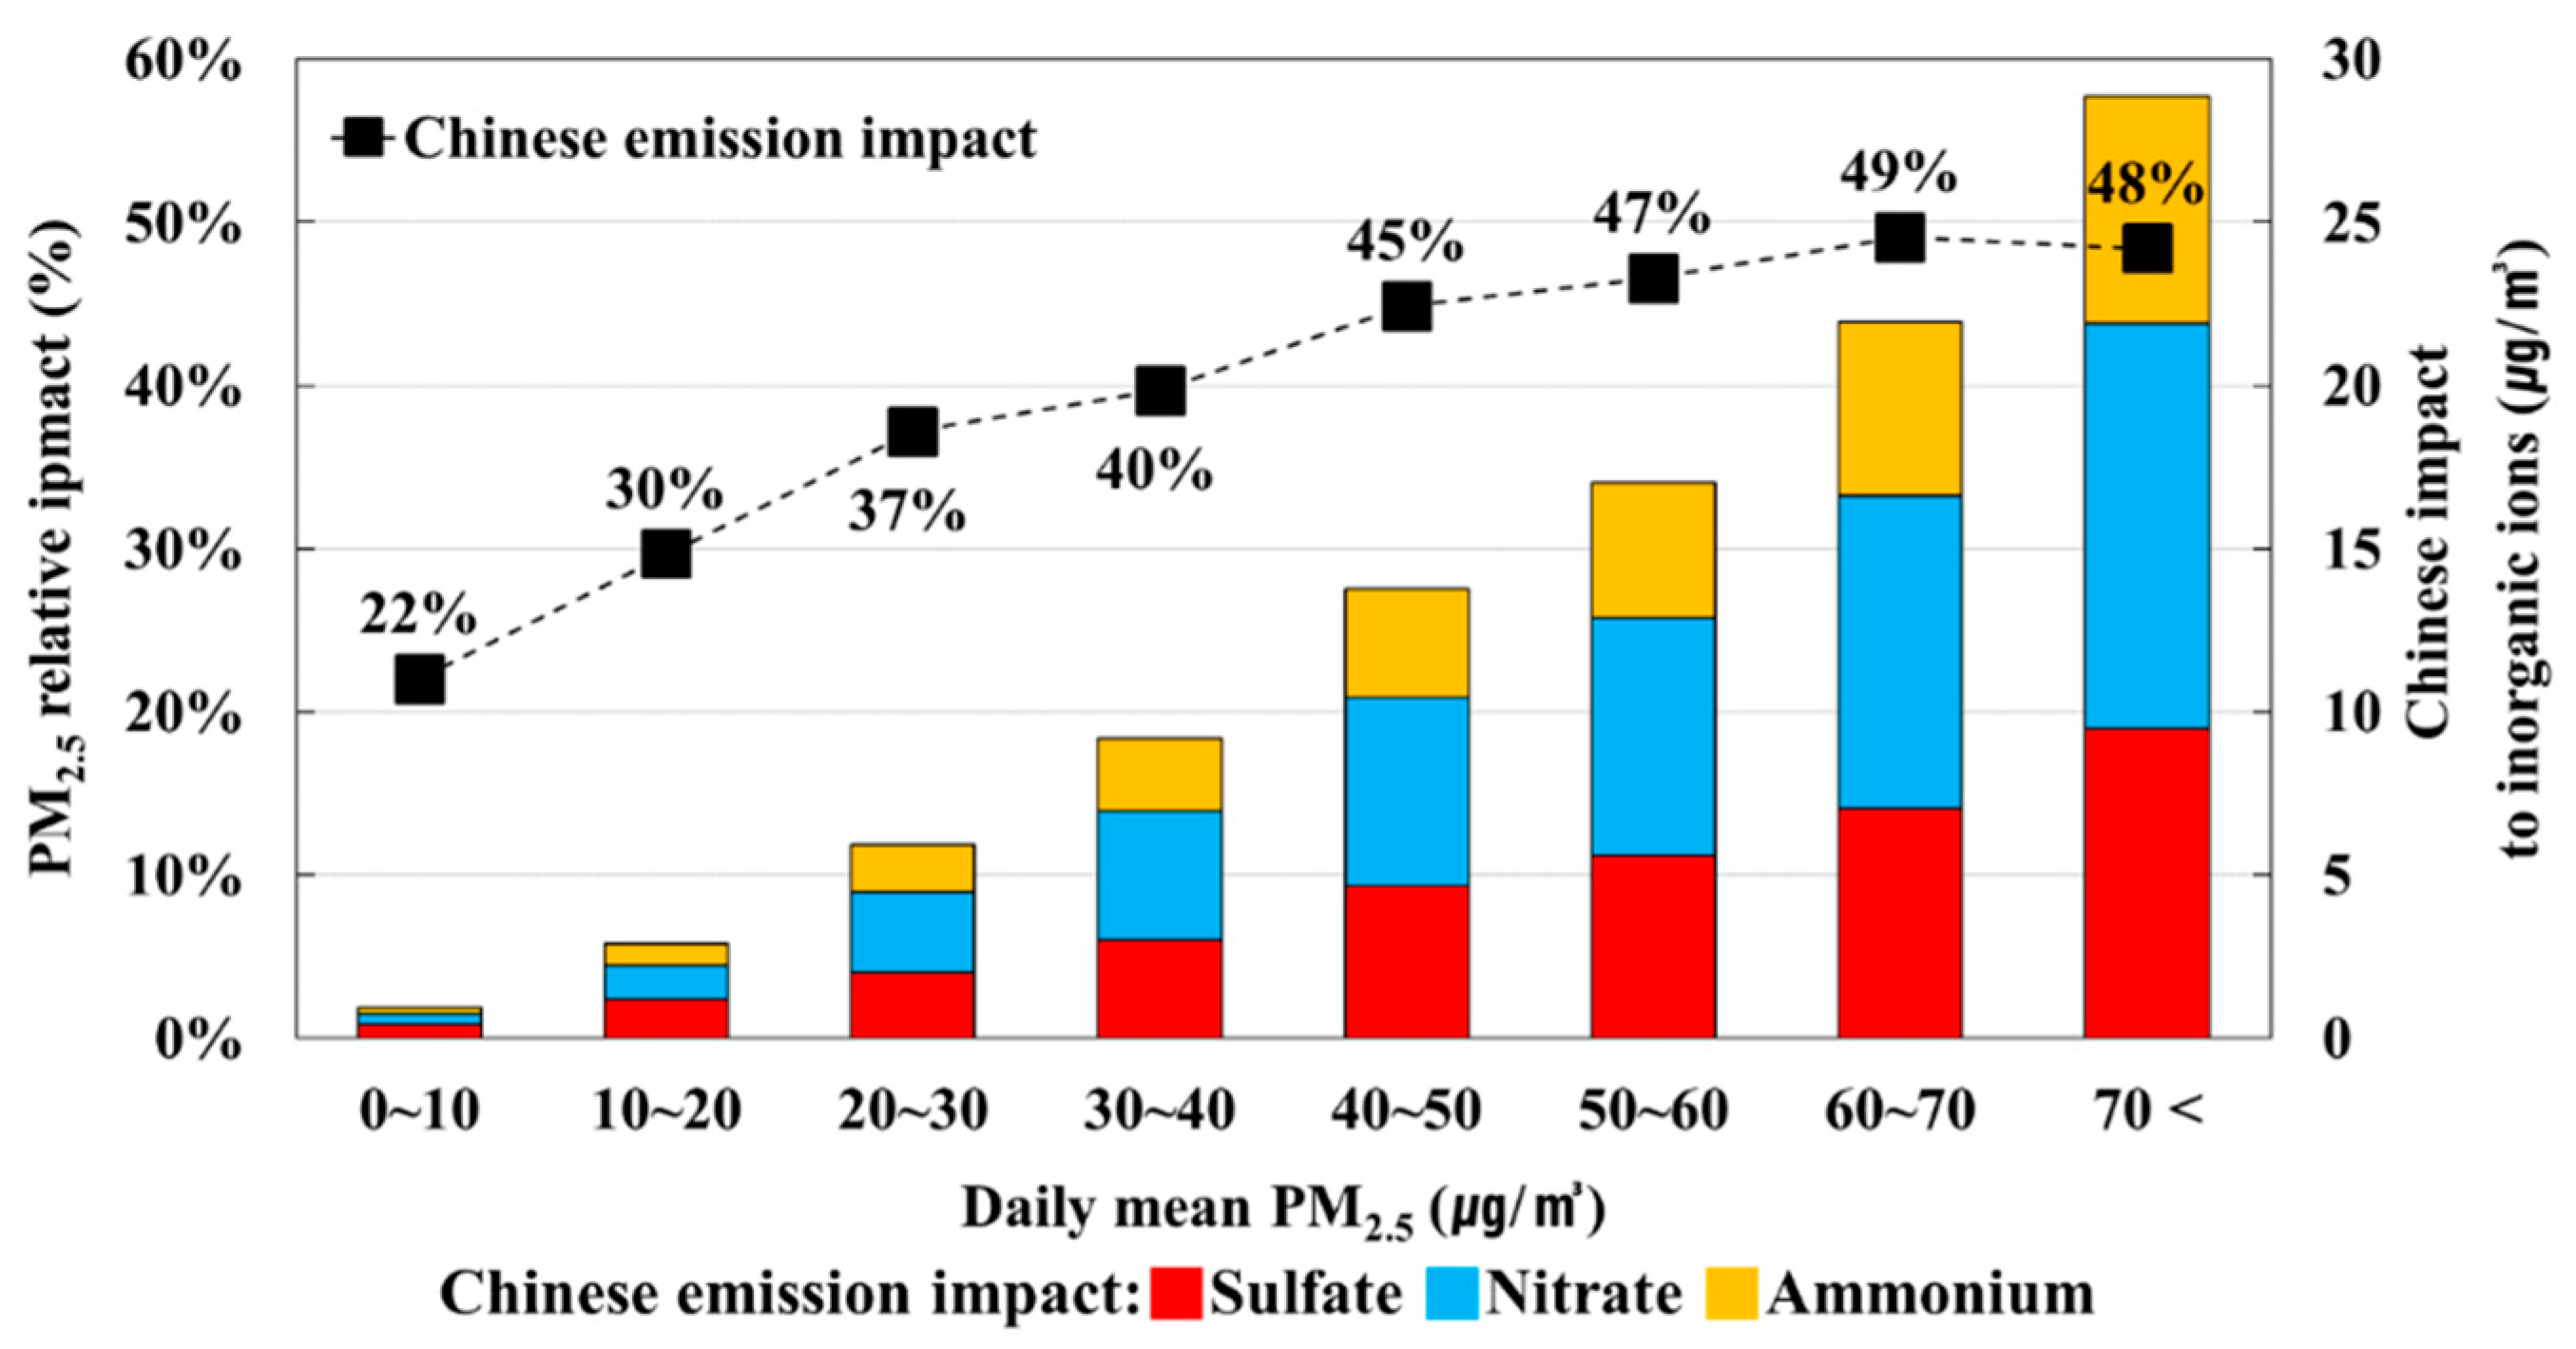
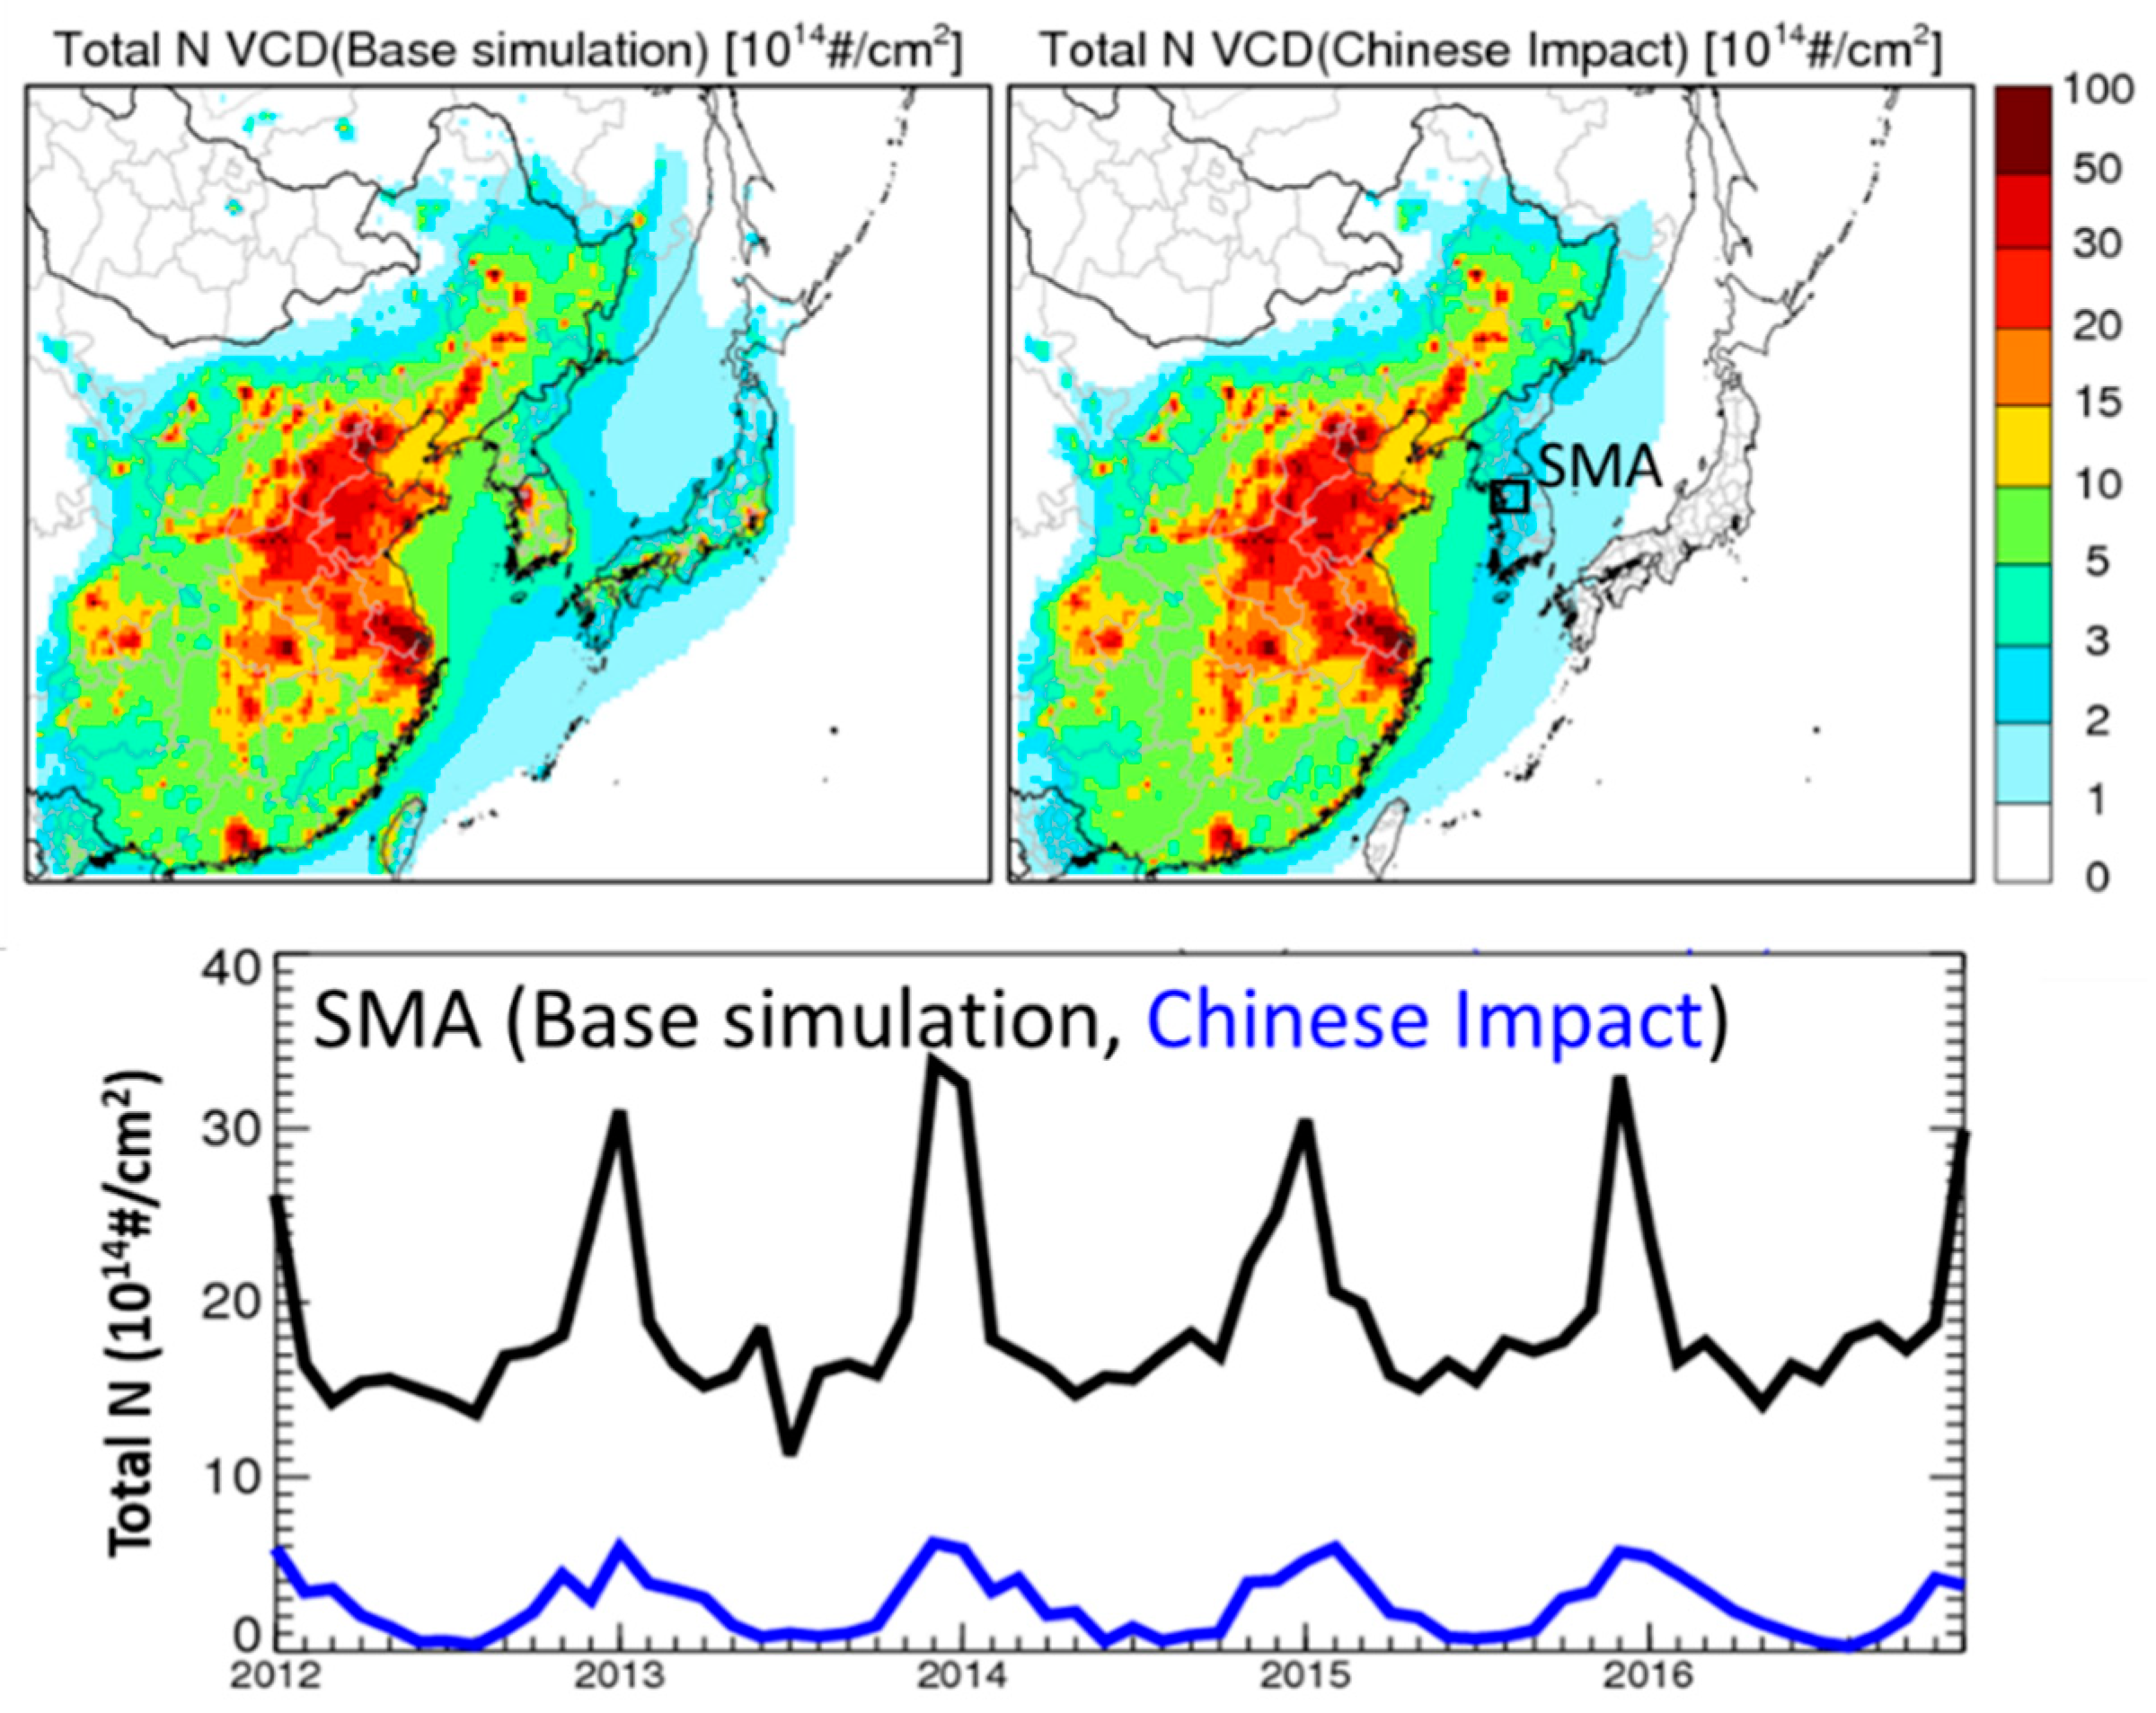
Figure 8 shows the relative impacts of Chinese emissions based on daily mean PM2.5 concentration in the SMA. Regardless of seasonality, as daily mean PM2.5 concentration increased, the impact of Chinese emissions increased, as well. A similar pattern is apparent for nitrate and sulfate. Below concentrations of 10 µg/m3, the Chinese emission impact is 22% of PM2.5 mass concentration and the impact on inorganic ions is 13% of PM2.5 mass concentration. In contrast, at concentrations of 60–70 µg/m3, the Chinese emission impact on SMA PM2.5 concentration increases to 49%, and the impact on inorganic ion concentration is 21.9 µg/m3, corresponding to 34% of the PM2.5 mass concentration. During high PM2.5 events, the impact of Chinese emissions on nitrate concentrations is the most significant, suggesting that Chinese NOX emissions can be a major factor driving high concentrations of PM2.5 in the SMA. NOX in the atmosphere has short residence time and is converted to HNO3, PAN (Peroxyl Acetyl Nitrate), HONO (nitrous acid), and so on. It is known that nitrate or PAN could be transported over long distances [81,82]. In order to quantify the influence of Chinese emission for SMA, we calculated Chinese impact of total N (defined as a sum of N mass concentrations in NOX, NOz, and nitrate). Previous studies for PM2.5 transboundary influence have reported that PM2.5 is often transported via the upper layer of the atmosphere [83,84]. Considering vertical changes of long-range transported total N inflow, we present the total N vertical column densities (VCDs) in this study. VCDs were calculated by integrating the number of total N molecules for all the vertical layers. Figure 9 shows the Chinses emission impact on total N VCDs in the SMA. Approximately 14 % of total N VCDs was influenced by Chinese emissions. In winter and spring, Chinese emission impacts on SMA total N VCDs ranged from 15% to 20%.
The composition ratio of nitrate in PM2.5 is currently increasing due to reduced SO2 emissions in Northeast Asia [85,86]; hence, NOX emission controls in Northeast Asia are expected to become important for PM2.5 management in the SMA.

4. Study Limitations

This study used a CCF, which corrects simulation results based on observed data, to estimate Chinese emission impacts. While a CCF has the advantage of correcting simulation results and analyzing observed concentrations through relatively simple post-processing, it is challenging to improve fundamental errors in the simulation results. When Chinese emission impacts for sulfate and nitrate concentrations were compared before and after applying the CCF, the ZOCs for sulfate and nitrate increased 1.4 times and 0.8 times, respectively (Table 4). In contrast, the relative impact of each component differed by 1%–2% before and after applying the CCF. Care must be taken when applying the CCF, because it can play an important role in prioritizing the precursors that need to be reduced first to decrease PM2.5 concentrations. However, it does not have a significant influence on estimating the relative impact of foreign emissions for single components. Given this, it is more advisable to interpret our results in terms of relative ratios rather than the mass concentration.
Recent changes in Chinese emissions can cause uncertainty in air-quality simulation. In this study, fixed emission input data were used for air-quality simulation. However, according to a recent report, Chinese SO2 and NOX emissions have decreased by 53% and 23%, respectively, during the period of 2012 to 2016 [19], and this decrease was marked in Eastern China which, is close to South Korea [87]. Therefore, it is possible that the impact of Chinese emissions estimated in this study could be overestimated. An additional emission impact analysis that reflects current Chinese emission reduction trends will be necessary in the future.

5. Conclusions

This study analyzed seasonal changes in the concentration and composition ratio of PM2.5 by using observational data from the SMA super site during the years 2012 to 2016. The impact of Chinese emissions on PM2.5 concentration and composition in SMA through long-range transport were quantified by using a three-dimensional chemistry transport model (CMAQ) and sensitivity simulations.
The mean PM2.5 mass concentration was 33.7 µg/m3, with inorganic ions comprising 53%. When PM2.5 concentration increased above 60 µg/m3, the ratio of inorganic ions increased up to 63%, suggesting that the role of inorganic ions is important during high PM2.5 concentration events. The highest PM2.5 concentrations were observed during winter and spring. PM2.5 concentrations ranged from 30.0 to 59.8 µg/m3 for the study period. During winter and spring, nitrate became the dominant chemical component, and its concentrations were 16%–26% (winter) and 17%–32% (spring) of the total PM2.5 mass concentrations. Consequently, NOX emission controls will be crucial for reducing PM2.5 concentration during the cold season (winter and spring).
The impact of Chinese emissions on PM2.5 concentrations were estimated to identify the sources of PM2.5 in the SMA. According to CMAQ results, Chinese emissions impact was 42% (40%–44%) of PM2.5 concentrations in the SMA. The impact of Chinese emissions on PM2.5 concentration and the composition varied seasonally. Chinese emissions impacts were 16.2 µg/m3 (38%) and 19.7 µg/m3 (48%) of SMA PM2.5 concentrations during winter and spring, respectively, and 13.0 µg/m3 (45%) and 9.5 µg/m3 (36%) during summer and autumn, respectively. The relative impact of Chinese emissions to PM2.5 concentration in summer was approximately 7% higher as compared to winter. The Chinese influence on nitrate and sulfate concentrations, the major PM2.5 chemical components, was also seasonally affected. Nitrate concentrations due to Chinese emissions were high in winter (2.7–7.6 µg/m3; 44%–63%) and spring (4.3–10.3 µg/m3; 55%–74%), while sulfate concentrations were high in spring (1.2–6.0 µg/m3; 25%–56%) and summer (1.1–12.5 µg/m3; 26%–70%).
The results of this study can be used to establish effective emission control strategies for PM2.5 concentration reduction. For high PM2.5 cases (exceeding a daily average concentration of 10 μg/m3), emission control of inorganic aerosol precursors over Northeast Asia is necessary. Considering recent SO2 emission reduction in Northeast Asia, reduction of NOX emissions in the region is a crucial factor driving PM2.5 concentrations in the SMA. A future work is warranted to verify the effect of changes in anthropogenic emissions over Northeast Asia on long-range transport and air-quality improvement.

Supplementary Materials

The following are available online at https://www.mdpi.com/2073-4433/11/1/48/s1: Table S1: Statistics of CMAQ model performance evaluation for daily mean PM2.5 concentration and chemical composition at the SMA super site for the period of 2012-2016.; Table S2: Statistics of WRF model performance evaluation for 1 hr average temperature and wind speed over Northeast Asia in modeling domain for the period of 2012-2016. Figure S1: PM2.5 chemical composition observed at the SMA super site for the period of 2012-2016.; Figure S2: Time series (left) and scatter (right) of monthly mean PM2.5 and its components at the SMA super site from 2012 to 2016. Black circles and red lines present the observed and modeled concentrations, respectively.; Figure S3: Spatial tile plot of simulated period mean PM2.5 concentrations overlaid by the observations at surface air quality monitoring sites in China during the period of 2015-2016. Circles represent the locations of air quality monitoring sites.; Figure S4: Time series (left) and scatter (right) of daily mean PM2.5 averaged over air quality monitoring sites in China for the period of 2015 to 2016. Black and red line presents the observed and modeled concentrations, respectively.; Figure S5: Seasonal Chinese impacts to Total S, SO2, and sulfate concentration estimated over the SMA for the period of 2015–2016. The percentages represent SO2 /Total S ratio and sulfate /Total S ratio.

Author Contributions

Conceptualization, C.B. and S.K.; data curation, C.Y.; formal analysis, C.B.; methodology, C.B., B.-U.K., and S.K.; project administration, S.K.; software, H.C.K.; validation, B.-U.K.; visualization, C.B. and H.C.K.; writing—original draft, C.B.; writing—review and editing, C.B., C.Y., B.-U.K., H.C.K., and S.K. All authors have read and agreed to the published version of the manuscript.

Funding

The study was supported by the National Strategic Project-Fine Particle of the National Research Foundation of Korea (NRF) and funded by the Ministry of Science and ICT (MSIT), the Ministry of Environment (ME), and the Ministry of Health and Welfare (MOHW) (2017M3D8A1092015) in South Korea.

Conflicts of Interest

The scientific results and conclusions, as well as any views or opinions expressed herein, are those of the author(s) and do not necessarily reflect the views of NOAA or the Department of Commerce.

References

  1. Snider, G.; Weagle, C.L.; Murdymootoo, K.K.; Ring, A.; Ritchie, Y.; Stone, E.; Walsh, A.; Akoshile, C.; Anh, N.X.; Balasubramanian, R.; et al. Variation in global chemical composition of PM 2.5:Emerging results from SPARTAN. Atmos. Chem. Phys. 2016, 16, 9629–9653. [Google Scholar]
  2. Cheng, Z.; Luo, L.; Wang, S.; Wang, Y.; Sharma, S.; Shimadera, H.; Wang, X.; Bressi, M.; de Miranda, R.M.; Jiang, J.; et al. Status and characteristics of ambient PM2.5 pollution in global megacities. Environ. Int. 2016, 89–90, 212–221. [Google Scholar] [CrossRef] [PubMed]
  3. Liu, F.; Choi, S.; Li, C.; Fioletov, V.E.; McLinden, C.A.; Joiner, J.; Krotkov, N.A.; Bian, H.; Janssens-Maenhout, G.; Darmenov, A.S. A new global anthropogenic SO2 emission inventory for the last decade: A mosaic of satellite-derived and bottom-up emissions. Atmos. Chem. Phys. 2018, 18, 16571–16586. [Google Scholar] [CrossRef] [Green Version]
  4. Park, E.H.; Heo, J.; Hirakura, S.; Hashizume, M.; Deng, F.; Kim, H.; Yi, S.-M. Characteristics of PM2.5 and its chemical constituents in Beijing, Seoul, and Nagasaki. Air Qual. Atmos. Health 2018, 11, 1167–1178. [Google Scholar]
  5. Moon, K.-J.; Park, S.-M.; Park, J.-S.; Song, I.-H.; Jang, S.-K.; Kim, J.-C.; Lee, S.-J. Chemical Characteristics and Source Apportionment ofPM 2.5 in Seoul Metropolitan Area in 2010. J. Korean Soc. Atmos. Environ. 2011, 27, 711–722, (In Korean with English Abstract). [Google Scholar]
  6. Zhang, X.Y.; Wang, Y.Q.; Niu, T.; Zhang, X.C.; Gong, S.L.; Zhang, Y.M.; Sun, J.Y. Atmospheric aerosol compositions in China: Spatial/temporal variability, chemical signature, regional haze distribution and comparisons with global aerosols. Atmos. Chem. Phys. 2012, 12, 779–799. [Google Scholar] [CrossRef] [Green Version]
  7. Li, H.; Ma, Y.; Duan, F.; He, K.; Zhu, L.; Huang, T.; Kimoto, T.; Ma, X.; Ma, T.; Xu, L.; et al. Typical winter haze pollution in Zibo, an industrial city in China: Characteristics, secondary formation, and regional contribution. Environ. Pollut. 2017, 229, 339–349. [Google Scholar] [CrossRef]
  8. Ma, Q.; Wu, Y.; Zhang, D.; Wang, X.; Xia, Y.; Liu, X.; Tian, P.; Han, Z.; Xia, X.; Wang, Y.; et al. Roles of regional transport and heterogeneous reactions in the PM2.5 increase during winter haze episodes in Beijing. Sci. Total Environ. 2017, 599–600, 246–253. [Google Scholar] [CrossRef]
  9. Saxena, M.; Sharma, A.; Sen, A.; Saxena, P.; Mandal, T.K.; Sharma, S.K.; Sharma, C. Water soluble inorganic species of PM10 and PM2.5 at an urban site of Delhi, India: Seasonal variability and sources. Atmos. Res. 2017, 184, 112–125. [Google Scholar]
  10. Dunker, A.M.; Yarwood, G.; Ortmann, J.P.; Wilson, G.M. Comparison of source apportionment and source sensitivity of ozone in a three-dimensional air quality model. Environ. Sci. Technol. 2002, 36, 2953–2964. [Google Scholar]
  11. Ghim, Y.S.; Kim, J.Y.; Chang, Y.-S. Concentration variations in particulate matter in Seoul associated with Asian dust and smog episodes. Aerosol Air Qual. Res. 2017, 17, 3128–3140. [Google Scholar] [CrossRef] [Green Version]
  12. Huang, X.H.; Bian, Q.; Ng, W.M.; Louie, P.K.; Yu, J.Z. Characterization of PM2. 5 major components and source investigation in suburban Hong Kong: A one year monitoring study. Aerosol Air Qual. Res. 2014, 14, 237–250. [Google Scholar] [CrossRef]
  13. Liu, H.-Y.; Dunea, D.; Iordache, S.; Pohoata, A. A Review of Airborne Particulate Matter Effects on Young Children’s Respiratory Symptoms and Diseases. Atmosphere 2018, 9, 150. [Google Scholar] [CrossRef] [Green Version]
  14. Di, Q.; Wang, Y.; Zanobetti, A.; Wang, Y.; Koutrakis, P.; Choirat, C.; Dominici, F.; Schwartz, J.D. Air Pollution and Mortality in the Medicare Population. N. Engl. J. Med. 2017, 376, 2513–2522. [Google Scholar] [CrossRef]
  15. Zhang, Q.; Jiang, X.; Tong, D.; Davis, S.J.; Zhao, H.; Geng, G.; Feng, T.; Zheng, B.; Lu, Z.; Streets, D.G.; et al. Transboundary health impacts of transported global air pollution and international trade. Nature 2017, 543, 705–709. [Google Scholar] [CrossRef] [Green Version]
  16. Yu, G.H.; Park, S.S.; Ghim, Y.S.; Shin, H.J.; Lim, C.S.; Ban, S.J.; Yu, J.A.; Kang, H.J.; Seo, Y.K.; Kang, K.S.; et al. Difference in Chemical Composition of PM2.5 and Investigation of its Causing Factors between 2013 and 2015 in Air Pollution Intensive Monitoring Stations. J. Korean Soc. Atmos. Environ. 2018, 34, 16–37, (In Korean with English Abstract). [Google Scholar] [CrossRef]
  17. Shin, H.J.; Park, S.-M.; Park, J.S.; Song, I.H.; Hong, Y.D. Chemical characteristics of high PM episodes occurring in Spring 2014, Seoul, Korea. Adv. Meteorol. 2016, 2016, 2424875. [Google Scholar] [CrossRef] [Green Version]
  18. Wang, L.; Hao, J.; He, K.; Wang, S.; Li, J.; Zhang, Q.; Streets, D.G.; Fu, J.S.; Jang, C.J.; Takekawa, H. A modeling study of coarse particulate matter pollution in Beijing: Regional source contributions and control implications for the 2008 Summer Olympics. J. Air Waste Manag. Assoc. 2008, 58, 1057–1069. [Google Scholar] [CrossRef]
  19. Zheng, B.; Tong, D.; Li, M.; Liu, F.; Hong, C.; Geng, G.; Li, H.; Li, X.; Peng, L.; Qi, J.; et al. Trends in China’s anthropogenic emissions since 2010 as the consequence of clean air actions. Atmos. Chem. Phys. 2018, 18, 14095–14111. [Google Scholar] [CrossRef] [Green Version]
  20. Zhang, Q.; Zheng, Y.; Tong, D.; Shao, M.; Wang, S.; Zhang, Y.; Xu, X.; Wang, J.; He, H.; Liu, W. Drivers of improved PM2. 5 air quality in China from 2013 to 2017. Proc. Natl. Acad. Sci. USA 2019, 116, 24463–24469. [Google Scholar] [CrossRef] [Green Version]
  21. Wang, L.; Zhang, F.; Pilot, E.; Yu, J.; Nie, C.; Holdaway, J.; Yang, L.; Li, Y.; Wang, W.; Vardoulakis, S.; et al. Taking Action on Air Pollution Control in the Beijing-Tianjin-Hebei (BTH) Region: Progress, Challenges and Opportunities. IJERPH 2018, 15, 306. [Google Scholar] [CrossRef] [PubMed] [Green Version]
  22. KORUS-AQ. Introduction to the KORUS-AQ Rapid Synthesis Report. 2017. Available online: https://espo.nasa.gov/sites/default/files/documents/KORUS-AQ-ENG.pdf (accessed on 28 December 2019).
  23. Oh, H.-R.; Ho, C.-H.; Kim, J.; Chen, D.; Lee, S.; Choi, Y.-S.; Chang, L.-S.; Song, C.-K. Long-range transport of air pollutants originating in China: A possible major cause of multi-day high-PM10 episodes during cold season in Seoul, Korea. Atmos. Environ. 2015, 109, 23–30. [Google Scholar] [CrossRef]
  24. Kaneyasu, N.; Yamamoto, S.; Sato, K.; Takami, A.; Hayashi, M.; Hara, K.; Kawamoto, K.; Okuda, T.; Hatakeyama, S. Impact of long-range transport of aerosols on the PM2.5 composition at a major metropolitan area in the northern Kyushu area of Japan. Atmos. Environ. 2014, 97, 416–425. [Google Scholar] [CrossRef]
  25. Heo, J.-B.; Hopke, P.K.; Yi, S.-M. Source apportionment of PM 2.5 in Seoul, Korea. Atmos. Chem. Phys. 2009, 9, 4957–4971. [Google Scholar] [CrossRef] [Green Version]
  26. Chen, L.; Gao, Y.; Zhang, M.; Fu, J.S.; Zhu, J.; Liao, H.; Li, J.; Huang, K.; Ge, B.; Wang, X. MICS-Asia III: Multi-model comparison and evaluation of aerosol over East Asia. Atmos. Chem. Phys. 2019, 19, 11911–11937. [Google Scholar] [CrossRef] [Green Version]
  27. Ying, Q.; Wu, L.; Zhang, H. Local and inter-regional contributions to PM2.5 nitrate and sulfate in China. Atmos. Environ. 2014, 94, 582–592. [Google Scholar] [CrossRef]
  28. Kim, H.-S.; Huh, J.-B.; Hopke, P.K.; Holsen, T.M.; Yi, S.-M. Characteristics of the major chemical constituents of PM2.5 and smog events in Seoul, Korea in 2003 and 2004. Atmos. Environ. 2007, 41, 6762–6770. [Google Scholar] [CrossRef]
  29. Park, S.-S.; Cho, S.-Y.; Jung, C.-H.; Lee, K.-H. Characteristics of water-soluble inorganic species in PM10 and PM2.5 at two coastal sites during spring in Korea. Atmos. Pollut. Res. 2016, 7, 370–383. [Google Scholar] [CrossRef]
  30. Koo, Y.-S.; Yun, H.-Y.; Choi, D.-R.; Han, J.-S.; Lee, J.-B.; Lim, Y.-J. An analysis of chemical and meteorological characteristics of haze events in the Seoul metropolitan area during January 12–18, 2013. Atmos. Environ. 2018, 178, 87–100. [Google Scholar] [CrossRef]
  31. Kang, C.-M.; Lee, H.S.; Kang, B.-W.; Lee, S.-K.; Sunwoo, Y. Chemical characteristics of acidic gas pollutants and PM2.5 species during hazy episodes in Seoul, South Korea. Atmos. Environ. 2004, 38, 4749–4760. [Google Scholar] [CrossRef]
  32. Han, S.H.; Kim, Y.P. Long-term Trends of the Concentrations of Mass and Chemical Composition in PM 2.5 over Seoul. J. Korean Soc. Atmos. Environ. 2015, 31, 143–156, (In Korean with English Abstract). [Google Scholar] [CrossRef] [Green Version]
  33. Kim, H.C.; Kwon, S.; Kim, B.-U.; Kim, S. Review of Shandong Peninsular Emissions Change and South Korean Air Quality. J. Korean Soc. Atmos. Environ. 2018, 34, 356–365, (In Korean with English Abstract). [Google Scholar] [CrossRef]
  34. Han, Y.-J.; Kim, T.-S.; Kim, H. Ionic constituents and source analysis of PM2.5 in three Korean cities. Atmos. Environ. 2008, 42, 4735–4746. [Google Scholar] [CrossRef]
  35. Han, Y.-J.; Kim, S.-R.; Jung, J.-H. Long-term measurements of atmospheric PM2.5 and its chemical composition in rural Korea. J. Atmos. Chem. 2011, 68, 281–298. [Google Scholar] [CrossRef]
  36. Choi, J.; Park, R.J.; Lee, H.-M.; Lee, S.; Jo, D.S.; Jeong, J.I.; Henze, D.K.; Woo, J.-H.; Ban, S.-J.; Lee, M.-D.; et al. Impacts of local vs. trans-boundary emissions from different sectors on PM2.5 exposure in South Korea during the KORUS-AQ campaign. Atmos. Environ. 2019, 203, 196–205. [Google Scholar] [CrossRef]
  37. U.S. EPA. Modeling Procedures for Demonstrating Compliance with PM2.5 NAAQS; U.S. EPA: Washington, DC, USA, 2010.
  38. Aikawa, M.; Ohara, T.; Hiraki, T.; Oishi, O.; Tsuji, A.; Yamagami, M.; Murano, K.; Mukai, H. Significant geographic gradients in particulate sulfate over Japan determined from multiple-site measurements and a chemical transport model: Impacts of transboundary pollution from the Asian continent. Atmos. Environ. 2010, 44, 381–391. [Google Scholar] [CrossRef]
  39. Cohan, D.S.; Boylan, J.W.; Marmur, A.; Khan, M.N. An Integrated Framework for Multipollutant Air Quality Management and Its Application in Georgia. Environ. Manag. 2007, 40, 545–554. [Google Scholar] [CrossRef]
  40. Skamarock, W.C.; Klemp, J.B.; Dudhia, J.; Gill, D.O.; Barker, D.M.; Wang, W.; Powers, J.G. A Description of the Advanced Research WRF Version 2; National Center for Atmospheric Research: Boulder, CO, USA, 2007; p. 100. [Google Scholar]
  41. Benjey, W.G. Implementation of the SMOKE Emission Data Processor and SMOKE Tool Input Data Processor in Models-3. Presented at the Emission Inventory Conference, Denver, CO, USA, 1–4 May 2001; p. 15. [Google Scholar]
  42. Byun, D.; Schere, K.L. Review of the governing equations, computational algorithms, and other components of the Models-3 Community Multiscale Air Quality (CMAQ) modeling system. Appl. Mech. Rev. 2006, 59, 51–77. [Google Scholar] [CrossRef]
  43. Kim, B.-U.; Bae, C.; Kim, H.C.; Kim, E.; Kim, S. Spatially and chemically resolved source apportionment analysis: Case study of high particulate matter event. Atmos. Environ. 2017, 162, 55–70. [Google Scholar] [CrossRef]
  44. Koo, Y.-S.; Kim, S.-T.; Yun, H.-Y.; Han, J.-S.; Lee, J.-Y.; Kim, K.-H.; Jeon, E.-C. The simulation of aerosol transport over East Asia region. Atmos. Res. 2008, 90, 264–271. [Google Scholar] [CrossRef]
  45. Yim, S.H.L.; Gu, Y.; Shapiro, M.A.; Stephens, B. Air quality and acid deposition impacts of local emissions and transboundary air pollution in Japan and South Korea. Atmos. Chem. Phys. 2019, 19, 13309–13323. [Google Scholar] [CrossRef] [Green Version]
  46. Kim, H.C.; Kim, E.; Bae, C.; Cho, J.H.; Kim, B.-U.; Kim, S. Regional contributions to particulate matter concentration in the Seoul metropolitan area, South Korea: Seasonal variation and sensitivity to meteorology and emissions inventory. Atmos. Chem. Phys. 2017, 17, 10315–10332. [Google Scholar] [CrossRef] [Green Version]
  47. Lee, H.-M.; Park, R.J.; Henze, D.K.; Lee, S.; Shim, C.; Shin, H.-J.; Moon, K.-J.; Woo, J.-H. PM2. 5 source attribution for Seoul in May from 2009 to 2013 using GEOS-Chem and its adjoint model. Environ. Pollut. 2017, 221, 377–384. [Google Scholar] [CrossRef] [PubMed]
  48. Lee, S.; Ho, C.-H.; Choi, Y.-S. High-PM10 concentration episodes in Seoul, Korea: Background sources and related meteorological conditions. Atmos. Environ. 2011, 45, 7240–7247. [Google Scholar] [CrossRef]
  49. Chung, A.; Chang, D.P.; Kleeman, M.J.; Perry, K.D.; Cahill, T.A.; Dutcher, D.; McDougall, E.M.; Stroud, K. Comparison of real-time instruments used to monitor airborne particulate matter. J. Air Waste Manag. Assoc. 2001, 51, 109–120. [Google Scholar] [CrossRef] [PubMed]
  50. Park, S.-S.; Jung, S.-A.; Gong, B.-J.; Cho, S.-Y.; Lee, S.-J. Characteristics of PM2.5 Haze Episodes Revealed by Highly Time-Resolved Measurements at an Air Pollution Monitoring Supersite in Korea. Aerosol Air Qual. Res. 2013, 13, 957–976. [Google Scholar] [CrossRef]
  51. Park, S.-S.; Kim, S.-J.; Gong, B.-J.; Lee, K.-H.; Cho, S.-Y.; Kim, J.-C.; Lee, S.-J. Investigation on a Haze Episode of Fine Particulate Matter using Semi-continuous Chemical Composition Data. J. Korean Soc. Atmos. Environ. 2013, 29, 642–655, (In Korean with English Abstract). [Google Scholar] [CrossRef] [Green Version]
  52. Guenther, A.; Karl, T.; Harley, P.; Wiedinmyer, C.; Palmer, P.I.; Geron, C. Estimates of global terrestrial isoprene emissions using MEGAN (Model of Emissions of Gases and Aerosols from Nature). Atmos. Chem. Phys. 2006, 6, 3181–3210. [Google Scholar] [CrossRef] [Green Version]
  53. Li, M.; Zhang, Q.; Kurokawa, J.; Woo, J.-H.; He, K.; Lu, Z.; Ohara, T.; Song, Y.; Streets, D.G.; Carmichael, G.R.; et al. MIX: A mosaic Asian anthropogenic emission inventory under the international collaboration framework of the MICS-Asia and HTAP. Atmos. Chem. Phys. 2017, 17, 935–963. [Google Scholar] [CrossRef] [Green Version]
  54. Itahashi, S.; Uno, I.; Kim, S. Source contributions of sulfate aerosol over East Asia estimated by CMAQ-DDM. Environ. Sci. Technol. 2012, 46, 6733–6741. [Google Scholar] [CrossRef]
  55. Lee, D.-G.; Lee, Y.-M.; Jang, K.-W.; Yoo, C.; Kang, K.-H.; Lee, J.-H.; Jung, S.-W.; Park, J.-M.; Lee, S.-B.; Han, J.-S.; et al. Korean National Emissions Inventory System and 2007 Air Pollutant Emissions. Asian J. Atmos. Environ. 2011, 5, 278–291. [Google Scholar] [CrossRef] [Green Version]
  56. Kim, S.; Moon1), N.; Byun, D.W. Korea Emissions Inventory Processing Using the US EPA’s SMOKE System. Asian J. Atmos. Environ. 2008, 2, 34–46. [Google Scholar] [CrossRef] [Green Version]
  57. Carter, W.P. Implementation of the SAPRC-99 Chemical Mechanism into the Models-3 Framework; Report to the United States Environmental Protection Agency; United States Environmental Protection Agency: Washington, DC, USA, 2000; p. 29.
  58. Carlton, A.G.; Bhave, P.V.; Napelenok, S.L.; Edney, E.O.; Sarwar, G.; Pinder, R.W.; Pouliot, G.A.; Houyoux, M. Model representation of secondary organic aerosol in CMAQv4. 7. Environ. Sci. Technol. 2010, 44, 8553–8560. [Google Scholar] [CrossRef] [PubMed]
  59. Emery, C.; Liu, Z.; Russell, A.G.; Odman, M.T.; Yarwood, G.; Kumar, N. Recommendations on statistics and benchmarks to assess photochemical model performance. J. Air Waste Manag. Assoc. 2017, 67, 582–598. [Google Scholar] [CrossRef] [Green Version]
  60. Emery, C.; Tai, E.; Yarwood, G. Enhanced Meteorological Modeling and Performance Evaluation for Two Texas Ozone Episodes; Prepared for the Texas natural resource conservation commission, by Environ International Corporation; Texas Natural Resource Conservation Commission: Austin, TX, USA, 2001. [Google Scholar]
  61. Bartnicki, J. Computing Source-Receptor Matrices with the Emep Eulerian Acid Deposition Model; Norwegian Meteorological Institute: Oslo, Norway, 1999; p. 37. [Google Scholar]
  62. Li, X.; Zhang, Q.; Zhang, Y.; Zheng, B.; Wang, K.; Chen, Y.; Wallington, T.J.; Han, W.; Shen, W.; Zhang, X. Source contributions of urban PM2. 5 in the Beijing–Tianjin–Hebei region: Changes between 2006 and 2013 and relative impacts of emissions and meteorology. Atmos. Environ. 2015, 123, 229–239. [Google Scholar] [CrossRef] [Green Version]
  63. Zhang, Z.; Wang, W.; Cheng, M.; Liu, S.; Xu, J.; He, Y.; Meng, F. The contribution of residential coal combustion to PM 2.5 pollution over China’s Beijing-Tianjin-Hebei region in winter. Atmos. Environ. 2017, 159, 147–161. [Google Scholar] [CrossRef]
  64. Tonnesen, G.S.; Dennis, R.L. Analysis of radical propagation efficiency to assess ozone sensitivity to hydrocarbons and NOx: 1. Local indicators of instantaneous odd oxygen production sensitivity. J. Geophys. Res. Atmos. 2000, 105, 9213–9225. [Google Scholar] [CrossRef]
  65. Marmur, A.; Unal, A.; Mulholland, J.A.; Russell, A.G. Optimization-based source apportionment of PM2.5 incorporating gas-to-particle ratios. Environ. Sci. Technol. 2005, 39, 3245–3254. [Google Scholar] [CrossRef]
  66. EPA, U. Guidance on the Use of Models and Other Analyses for Demonstrating Attainment of Air Quality Goals for Ozone, PM2. 5, and Regional Haze; US Environmental Protection Agency, Office of Air Quality Planning and Standards: Washington, DC, USA, 2007.
  67. Bae, C.; Kim, E.; Kim, B.-U.; Kim, H.C.; Woo, J.-H.; Moon, K.-J.; Shin, H.-J.; Song, I.H.; Kim, S. Impact of Emission Inventory Choices on PM10 Forecast Accuracy and Contributions in the Seoul Metropolitan Area. J. Korean Soc. Atmos. Environ. 2017, 33, 497–514, (In Korean with English Abstract). [Google Scholar] [CrossRef]
  68. Park, S.-M.; Song, I.-H.; Park, J.S.; Oh, J.; Moon, K.J.; Shin, H.J.; Ahn, J.Y.; Lee, M.-D.; Kim, J.; Lee, G. Variation of PM2.5 Chemical Compositions and their Contributions to Light Extinction in Seoul. Aerosol Air Qual. Res. 2018, 18, 2220–2229. [Google Scholar] [CrossRef]
  69. Kim, H.; Zhang, Q.; Heo, J. Influence of intense secondary aerosol formation and long-range transport on aerosol chemistry and properties in the Seoul Metropolitan Area during spring time: Results from KORUS-AQ. Atmos. Chem. Phys. 2018, 18, 7149–7168. [Google Scholar] [CrossRef] [Green Version]
  70. Khoder, M.I. Atmospheric conversion of sulfur dioxide to particulate sulfate and nitrogen dioxide to particulate nitrate and gaseous nitric acid in an urban area. Chemosphere 2002, 49, 675–684. [Google Scholar] [CrossRef]
  71. Eatough, D.J.; Caka, F.M.; Farber, R.J. The conversion of SO2 to sulfate in the atmosphere. Isr. J. Chem. 1994, 34, 301–314. [Google Scholar] [CrossRef]
  72. Matsumoto, K.; Tanaka, H. Formation and dissociation of atmospheric particulate nitrate and chloride: An approach based on phase equilibrium. Atmos. Environ. 1996, 30, 639–648. [Google Scholar] [CrossRef]
  73. Wang, P.; Cao, J.; Shen, Z.; Han, Y.; Lee, S.; Huang, Y.; Zhu, C.; Wang, Q.; Xu, H.; Huang, R. Spatial and seasonal variations of PM 2.5 mass and species during 2010 in Xi’an, China. Sci. Total Environ. 2015, 508, 477–487. [Google Scholar] [CrossRef] [PubMed]
  74. He, K.; Yang, F.; Ma, Y.; Zhang, Q.; Yao, X.; Chan, C.K.; Cadle, S.; Chan, T.; Mulawa, P. The characteristics of PM2.5 in Beijing, China. Atmos. Environ. 2001, 35, 4959–4970. [Google Scholar] [CrossRef]
  75. Zhang, F.; Cheng, H.; Wang, Z.; Lv, X.; Zhu, Z.; Zhang, G.; Wang, X. Fine particles (PM2.5) at a CAWNET background site in Central China: Chemical compositions, seasonal variations and regional pollution events. Atmos. Environ. 2014, 86, 193–202. [Google Scholar] [CrossRef]
  76. Zhang, T.; Cao, J.J.; Tie, X.X.; Shen, Z.X.; Liu, S.X.; Ding, H.; Han, Y.M.; Wang, G.H.; Ho, K.F.; Qiang, J.; et al. Water-soluble ions in atmospheric aerosols measured in Xi’an, China: Seasonal variations and sources. Atmos. Res. 2011, 102, 110–119. [Google Scholar] [CrossRef]
  77. Kundu, S.; Kawamura, K.; Kobayashi, M.; Tachibana, E.; Lee, M.; Fu, P.Q.; Jung, J. A sub-decadal trend in diacids in atmospheric aerosols in eastern Asia. Atmos. Chem. Phys. 2016, 16, 585–596. [Google Scholar] [CrossRef] [Green Version]
  78. Pani, S.K.; Lee, C.-T.; Chou, C.C.-K.; Shimada, K.; Hatakeyama, S.; Takami, A.; Wang, S.-H.; Lin, N.-H. Chemical characterization of wintertime aerosols over islands and mountains in East Asia: Impacts of the continental Asian outflow. Aerosol Air Qual. Res. 2017, 17, 3006–3036. [Google Scholar] [CrossRef]
  79. Seinfeld, J.H.; Pandis, S.N. Atmospheric Chemistry and Physics: From Air Pollution to Climate Change; John Wiley & Sons: Hoboken, NJ, USA, 2016. [Google Scholar]
  80. Pandis, S.N.; Seinfeld, J.H. Sensitivity analysis of a chemical mechanism for aqueous-phase atmospheric chemistry. J. Geophys. Res. Atmos. 1989, 94, 1105–1126. [Google Scholar] [CrossRef]
  81. Singh, H.B.; Salas, L.J.; Viezee, W. Global distribution of peroxyacetyl nitrate. Nature 1986, 321, 588. [Google Scholar] [CrossRef] [PubMed]
  82. Qu, Y.; An, J.; He, Y.; Zheng, J. An overview of emissions of SO2 and NOx and the long-range transport of oxidized sulfur and nitrogen pollutants in East Asia. J. Environ. Sci. 2016, 44, 13–25. [Google Scholar] [CrossRef] [PubMed]
  83. Lee, H.-J.; Jo, H.-Y.; Kim, S.-W.; Park, M.-S.; Kim, C.-H. Impacts of atmospheric vertical structures on transboundary aerosol transport from China to South Korea. Sci. Rep. 2019, 9, 13040. [Google Scholar] [CrossRef] [PubMed]
  84. Li, D.; Liu, J.; Zhang, J.; Gui, H.; Du, P.; Yu, T.; Wang, J.; Lu, Y.; Liu, W.; Cheng, Y. Identification of long-range transport pathways and potential sources of PM2. 5 and PM10 in Beijing from 2014 to 2015. J. Environ. Sci. 2017, 56, 214–229. [Google Scholar] [CrossRef]
  85. Itahashi, S.; Yumimoto, K.; Uno, I.; Hayami, H.; Fujita, S.; Pan, Y.; Wang, Y. A 15-year record (2001–2015) of the ratio of nitrate to non-sea-salt sulfate in precipitation over East Asia. Atmos. Chem. Phys. 2018, 18, 2835–2852. [Google Scholar] [CrossRef] [Green Version]
  86. Wang, X.; Chen, W.; Chen, D.; Wu, Z.; Fan, Q. Long-term trends of fine particulate matter and chemical composition in the Pearl River Delta Economic Zone (PRDEZ), China. Front. Environ. Sci. Eng. 2016, 10, 53–62. [Google Scholar] [CrossRef]
  87. Woo, J.-H.; Bu, C.; Kim, J.; Ghim, Y.S.; Kim, Y. Analysis of regional and inter-annual changes of air pollutants emissions in China. J. Korean Soc. Atmos. Environ. 2018, 34, 87–100, (In Korean with English Abstract). [Google Scholar] [CrossRef]
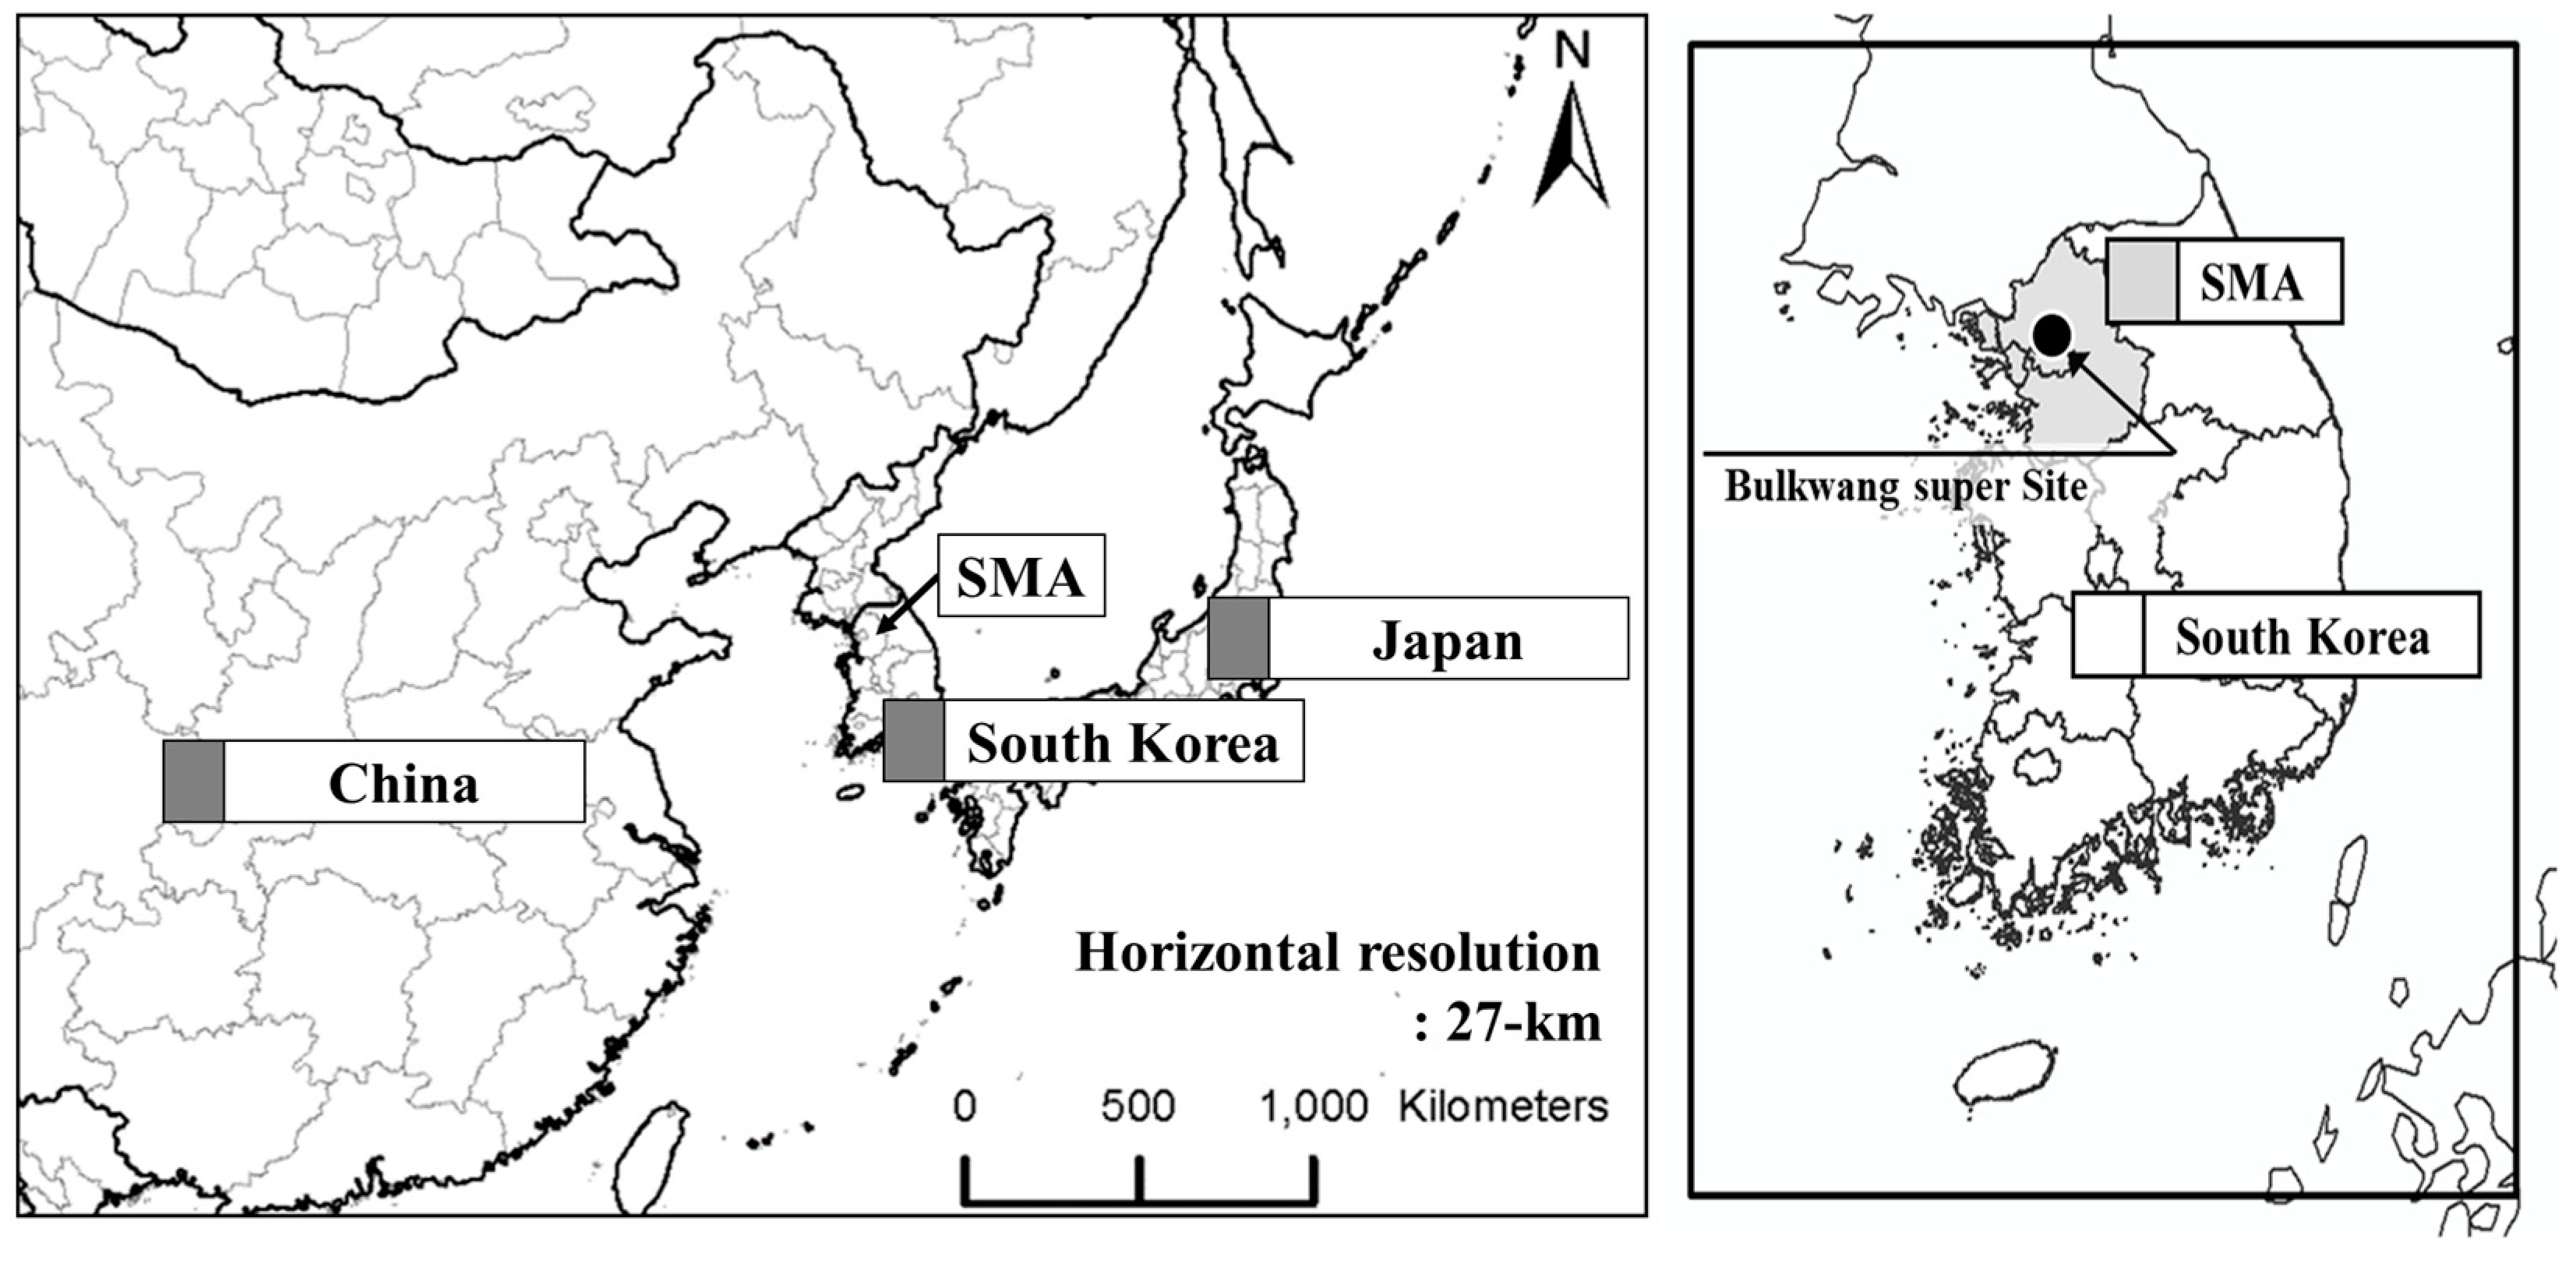
Figure 1. Community Multiscale Air Quality Model (CMAQ) domain used in this study. The gray area shows the Seoul Metropolitan Area (SMA), and the black dot represents the Bulkwang super site.
Atmosphere 11 00048 g001
Figure 2. (A) Frequency of observed daily mean PM2.5 and the mass fraction of inorganic ions for each concentration bin at the SMA super site, from 2012 to 2016. (B) Relative chemical composition of PM2.5 for each concentration bin at the same place and period as (A).
Atmosphere 11 00048 g002
Figure 3. Occurrence probability of (A) PM2.5, (B) nitrate, and (C) sulfate for each air pollutant concentration bin at the SMA super site from 2012 to 2016. Blue and red lines represent the cold (winter and spring) and warm seasons (summer and autumn), respectively.
Atmosphere 11 00048 g003
Figure 4. Scatter plots of (A) seasonal observed daily mean nitrate versus PM2.5 and (B) seasonal sulfate versus PM2.5 for each season at the SMA super site, from 2012 to 2016. Blue and red lines represent the cold (winter and spring) and warm seasons (summer and autumn), respectively.
Atmosphere 11 00048 g004
Figure 5. (A) Time series of monthly average PM2.5 concentration and the Chinese emission impact (adjusted by CCF). (B) Scatter plots of daily PM2.5 concentration and Chinese emission impact (adjusted by CCF) for each season.
Atmosphere 11 00048 g005
Figure 6. Seasonal Chinese emission impact on daily mean (A) nitrate and (B) sulfate concentrations in the SMA, from 2012 to 2016. Chinese emission impact was adjusted by CCF, as described in Section 2.4.
Atmosphere 11 00048 g006
Figure 7. Spatial distribution of ratios of vertical column densities (VCDs) of S in sulfate to total S VCDs for Northeast Asia during (A) summer (June 2016–August 2016) and (B) winter (December 2015–February 2016).
Atmosphere 11 00048 g007
Figure 8. Mean impact of Chinese inorganic ions and the relative impact from Chinese emission for each PM2.5 concentration bin.
Atmosphere 11 00048 g008
Figure 9. Spatial distribution of total N VCDs and Chinese impact on total N VCDs for Northeast Asia from 2012 to 2016 (top). Further, time series of monthly mean total N VCDs and Chinese impact on total N VCDs in the SMA during this period (bottom).
Atmosphere 11 00048 g009
Table 1. Available daily concentration samples for each month from 2012 to 2016.
JanFebMarAprMayJunJulAugSepOctNovDec
# of daily samples
(Daily Mean)
6960716765808178831079775
Table 2. Details of the weather research and forecasting (WRF) model configuration used in this study.
WRFDescription
Version3.4.1
Initial fieldFNL
Planetary boundary layer schemeYSU
MicrophysicsWSM6
Land surface model schemeNOAH
Short wave radiationNASA Goddard
Table 3. Details of the community multiscale air-quality model (CMAQ) configuration used in this study.
CMAQDescription
Version4.7.1
Chemical MechanismSAPRC99
Chemical SolverEBI
Aerosol ModuleAERO5
Boundary ConditionDefault profile
Advection SchemeYAMO
Horizontal DiffusionMultiscale
Vertical DiffusionEddy
Table 4. Chinese emission impact to Seoul Metropolitan Area (SMA) sulfate and nitrate concentrations (a: not adjusted; b: adjusted using the CCF).
Chinese Emission ImpactSulfateNitrate
(a) Base caseConcentration (µg/m3)2.35.1
Relative (%)46.257.8
(b) CCF caseConcentration (µg/m3)3.23.9
Relative (%)48.758.4