Article

The Significance of Wind Turbines Layout Optimization on the Predicted Farm Energy Yield

1
Department of Energy Engineering, German Jordanian University, Amman Madaba Street, P.O. Box 35247, Amman 11180, Jordan
2
Environmental Process Engineering, Department of Environmental Technology, Technische Universität Berlin, Office KF 2, Strasse des 17. Juni 135, 10623 Berlin, Germany
3
Royal Scientific Society (RSS), National Energy Research Centre, PO Box 1438, Amman 11941, Jordan
*
Author to whom correspondence should be addressed.
Atmosphere 2020, 11(1), 117; https://doi.org/10.3390/atmos11010117
Submission received: 31 December 2019 / Revised: 17 January 2020 / Accepted: 17 January 2020 / Published: 20 January 2020
(This article belongs to the Special Issue Climate Modeling for Renewable Energy Resource Assessment)

Abstract

:
Securing energy supply and diversifying the energy sources is one of the main goals of energy strategy for most countries. Due to climate change, wind energy is becoming increasingly important as a method of CO2-free energy generation. In this paper, a wind farm with five turbines located in Jerash, a city in northern Jordan, has been designed and analyzed. Optimization of wind farms is an important factor in the design stage to minimize the cost of wind energy to become more competitive and economically attractive. The analyses have been carried out using the WindFarm software to examine the significance of wind turbines’ layouts (M, straight and arch shapes) and spacing on the final energy yield. In this research, arranging the turbines facing the main wind direction with five times rotor diameter distance between each turbine has been simulated, and has resulted in 22.75, 22.87 and 21.997 GWh/year for the M shape, Straight line and Arch shape, respectively. Whereas, reducing the distance between turbines to 2.5 times of the rotor diameter (D) resulted in a reduction of the wind farm energy yield to 22.68, 21.498 and 21.5463 GWh/year for the M shape, Straight line and Arch shape, respectively. The energetic efficiency gain for the optimized wind turbines compared to the modeled layouts regarding the distances between the wind turbines. The energetic efficiency gain has been in the range between 8.9% for 5D (rotor diameter) straight layout to 15.9% for 2.5D straight layout.

1. Introduction

Nowadays, wind turbines are usually installed in so-called wind farms. For space and cost reasons, the wind turbines should be as close as possible to each other, but not mutually influence each other. To avoid mutual interference, the wind turbines need to be arranged in a layout according to the prevailing wind direction, in order to harvest the maximum energy [1].
There are several criteria which have been considered for the selection of a site for a largescale wind energy farm, such as annual average wind speed, main direction and energy generation. Also, other factors are considered that depend upon the site selection, such as local infrastructure, soil composition and availability of electrical network.
Wind turbines can be adapted to meteorological conditions due to their aerodynamic shape. In order to take the site conditions into account, the potential location of a wind turbine must be examined in advance. For the selection of suitable locations, numerical simulations are mostly used which examine the meteorological and orographic conditions in advance. The wake flow has effects on the environment, and in particular on the wind field of other wind turbines.
These effects of turbulent wake flow on meteorological sizes have been investigated with numerical simulations by Prósper et al. [2], Astolfi et al. [3] and Han et al. [4]. However, computer models can only be an approximation of nature, since the simulations are always subject to uncertainties. For each application an estimation of the representation of the relevant processes must be made. For processes that cannot be mapped, parameterizations need to be found. The different ways to model wind turbines depend upon the physics of the models, the used parameters and the objective of the study. The model and the parameterization must be selected according to the examination objective. Thus, very high-resolution models can calculate the aerodynamics of the rotor blade, but due to the numerical effort, they are not able to simulate the flow and wake-up flow over a larger area than in the immediate vicinity of the turbine. However, if the turbulent wake flows of a wind turbine or even an entire wind farm should be considered, a much coarser area must be used to capture the area of interest.
One of the main issues in designing an optimized wind farm layout is the definition of the optimal location of each single turbine, while simultaneously considering the avoidance of wake losses under certain restrictions like the topographic, land availability and the prominent wind direction. This issue has been examined in many recent studies using different optimization algorithms [5]. Wind farm turbines’ layout optimization and wake steering should correspond, since substantial annual energy generation enhancements can be obtained by wake steering in a wind farm layout that is optimized to minimize wake losses [6].
Several studies have developed mathematical models to optimize the wind turbine arrangement in the wind plant. Genetic algorithms have been applied to optimize the placement of wind turbines such as in Mosetti et al. [7], Grady, et al. [8], Ju et al. [9] and Brogna et al. [10], also by applying Monte Carlo simulation like in Wang et al. [11] and Marmidis et al. [12]. In a previous study, a new mathematical model has been developed to optimize the wind turbine arrangement in the wind farm. The new optimization method is based on numerical simulations focusing upon maximizing the total electricity generation of the wind farm. The results have shown significant improvements in wind farm power generation reaching up to 6% compared to other methods like genetic algorithms [13].
A Gaussian wake model has been applied in other studies to find the optimal layout for a wind farm [14]. The results have shown that the use of genetic algorithms can reduce annual maintenance costs and increase the efficiency of a wind farm in different scenarios [14].
Other studies have been carried out to solve the problem of wind farm layout optimization by developing new mathematical programming. By applying the new model to several previous layouts, it has been shown that these optimized layouts could generate extra energy with a higher symmetric layout [15].
Another study has analyzed the effect of wind turbine layout on the energy generation from the wind farm [16]. This research compared regular layouts to micro-siting models based on the energy output. The results have shown that the micro-siting model array shows higher conversion rate than the aligned and staggered layouts by 4.09% and 2.18%, respectively [16].
For the purpose of reaching the maximum wind energy generation, other studies have been developed to optimize the wind farm layout. In the research of [17], there has been designed a model based on parameters like wind distribution, wake loss and wind direction. The model results show significant improvements in energy generation compared to a regular layout without optimization.
Furthermore, some more related studies have optimized the wind farm layout using a three-dimensional model depending on the so-called “greedy” algorithm. The numerical method applied is based on multiple hub heights to maximize the energy output and minimize the cost. Compared to layouts created by the genetic algorithm and identical hub height, the proposed greedy algorithm shows lower computational requirements and better results [18].
The 2D Jensen–Gaussian wake model or Jensen’s wake model have been used as genetic algorithm wind farm turbines layout optimization programs, where recent studies indicate that the significance of the 2D Jensen–Gaussian wake model means more theoretical importance and real data in wind energy operation [19].
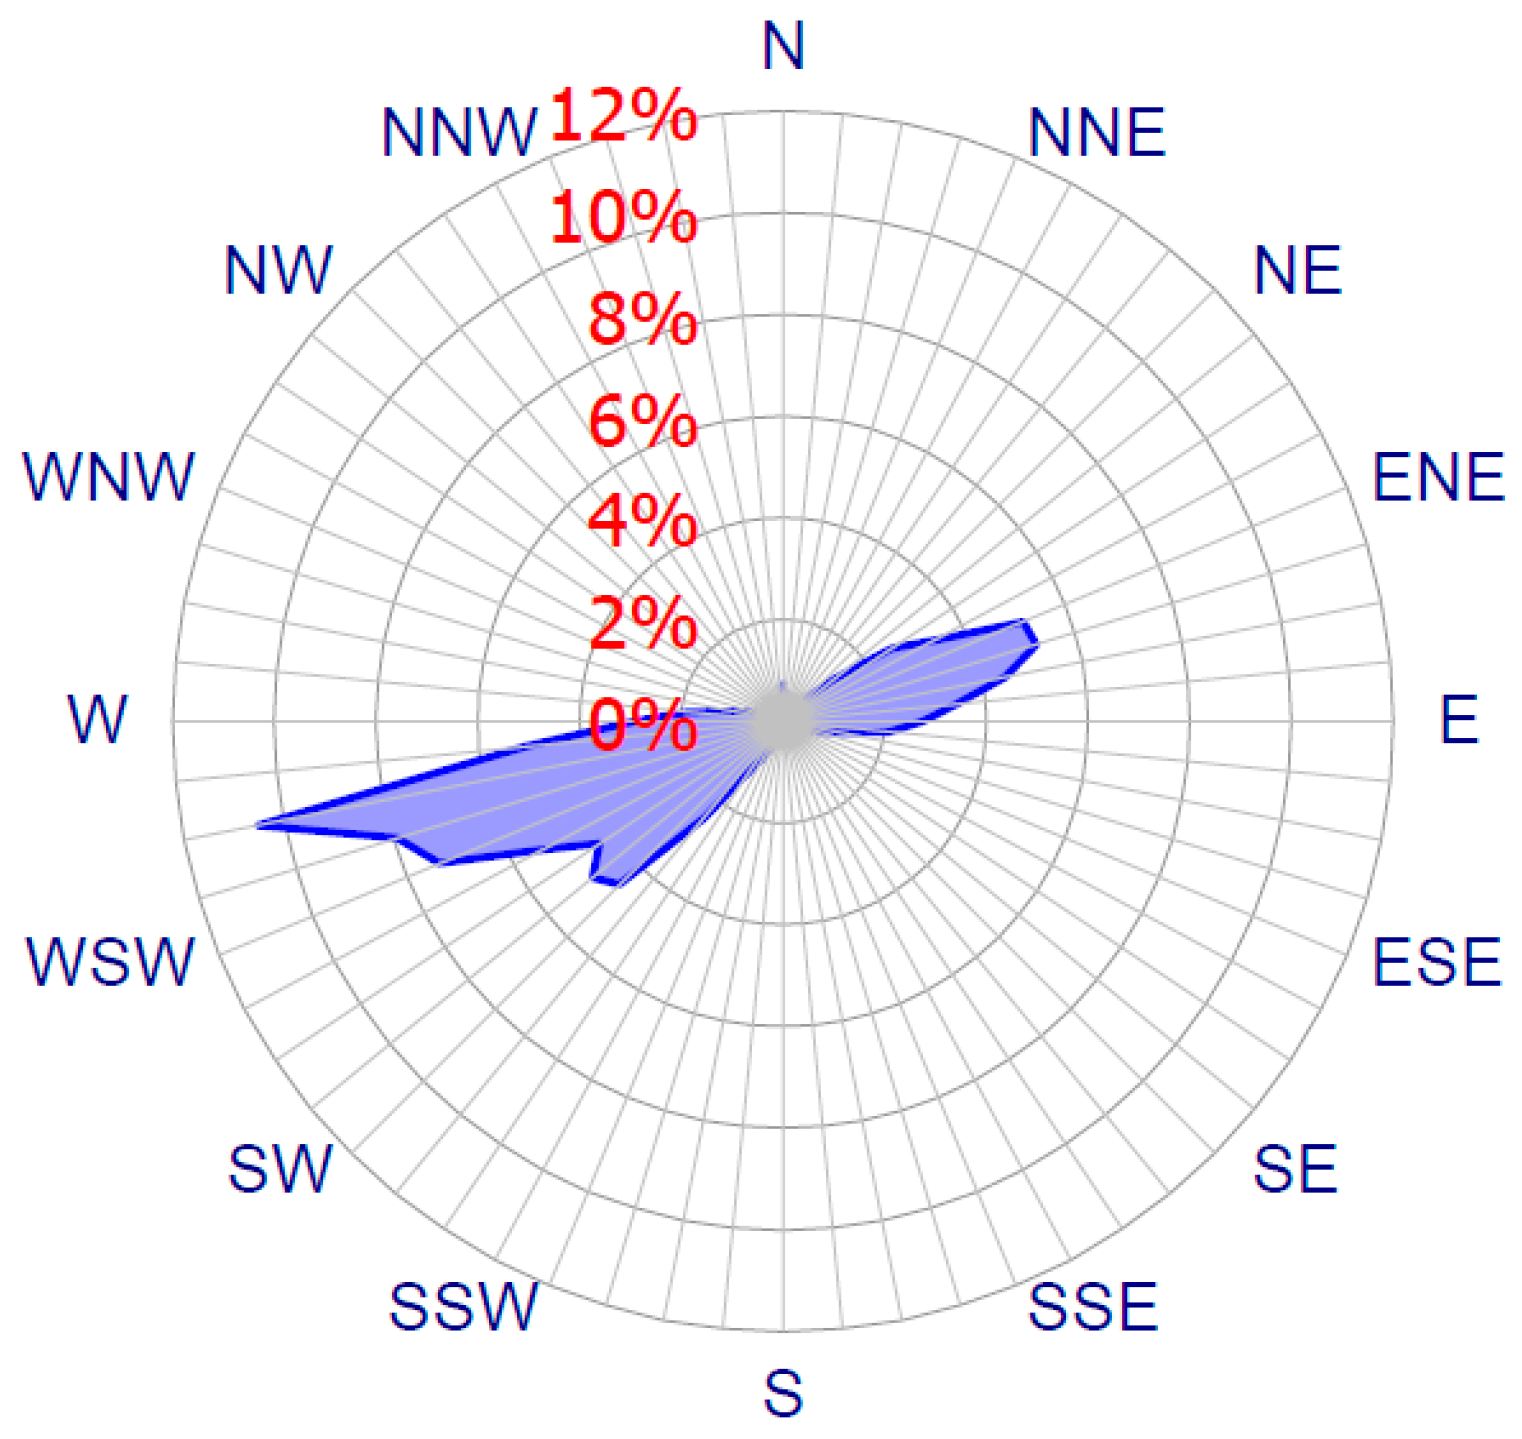
For the wind speed fluctuations, various statistical methods have been applied [20], where the Weibull distribution is most commonly used. The wind direction variation is typically presented in a wind rose diagram. Merging these two, the recorded wind data can be built into sector-wise Weibull distributions, which can be used for wind resource assessment and annual energy yield calculations. The wind modeling techniques have been implemented in different studies on wind farm layout optimization. In order to perform the analysis, the compass is divided into 12 sectors, each one representing 30 degrees of the horizon. A wind rose may also be drawn for 8 or 16 sectors, but a 12 sector layout tends to be the standard set by the European Wind Atlas, where some studies used 12 sectors for wind direction such as in Dobrić et al. [21] and Rivas et al. [22], while others used 24 sectors [23].
However, there is a need of more optimization techniques to optimize wind farm layout for harvesting the maximum possible energy, and in recent years more developments have been done for a better arrangement of wind turbines in larger wind farms [24].
In this research, a wind farm with five turbines located in Jerash in Jordan, has been designed and analyzed. The analyses are carried out using the WindFarm software to examine the significance of wind turbines’ layouts (M, straight and arch shapes) and spacing on the final energy yield.

2. Description of the Site

In this research, the examined wind farm is located in the Umm Al Rumman hill, Jerash, Jordan. The used wind data from the site has been collected by a meteorological station, which is located 2 km in linear distance from the study location. The hill has low, sparse vegetation, and is accessible by a small service road. However, it can be considered as a suitable location for a wind farm, as there are no obstacles or residential areas around. From an environmental point of view, the site is not considered as a protected nor a military area. The topography data for the wind farm location in meters is shown in Figure 1. The site is characterized by a valley in orientated directions. Furthermore, there are strong height differences of more than 800 m, creating an influence of the wind emergence on the downhill sides. The valley acts here like a funnel, concentrating the wind and increasing the velocity to allow an economical use of the wind.
Considering all given conditions and the topography of the site, a desired wind farm size of 10 MW shall be optimized. The proposed wind farm consists of five wind turbines with a design capacity of 2 MW each. In order to evaluate the local wind potential (mainly wind speed and wind direction) for long term wind conditions of the site, raw data from the nearest meteorological mast has been used. The first step is the determination of the exact location of the wind park and the specific topography of the open area of the wind farm, and the influence on wind velocity and directions. This step is performed by a site analysis in the WindFarm Software described in Section 3. Then, the topography data for the wind farm location and the transformation factors of the coordinates in Jordan (Central Meridian, origin latitude, scale factor, false easting and northing) have been applied in the Mensuration Services Program (MSP) Geographic Translator (GEOTRANS, Version 3.4) [25].

3. Methodology

3.1. Wind Data

For this research, there are 52,704 data sets available which have been recorded during one full year. They are represented in 10-min readings, taking into account that the year 2008 was a leap year. However, the total valid data during the measurement period is lowered to 49,098 data sets during 340.95 days of the year, while the calm wind speed, measuring less than 2 m/s, is 0%. The missing data in the examined time frame is 3605 samples representing 6.8% from all samples.
In order to identify the suitable site of the wind farm, and to analyze the wind potential of the wind farm location, the measured wind speeds and their directions for at least one calendar year should be analyzed.
In order to evaluate the local wind potential for long term wind conditions area, the raw data of wind speed and direction from the meteorological weather station which has been installed in Um Al Rumman have been used. The station is located within the latitude and longitude of 32°10′56.0′′ N and 35°49′36.1′′ E. The data set collected has been recorded from 1 July 2007 until 30 June 2008, and its sampling rate is one sample per second. The data acquisition system calculates 10 min averaged values, along with the minimum, maximum and the standard deviation for each measured sensor.
However, the data analysis is conducted using the Wind Rose software “version V4.15 A6.0”. Wind Rose is a tool used to analyze wind characteristics, such as direction, speed, temperature and turbulences. The data analysis complies with all of the mandatory requirements in the International Electrotechnical Commission (IEC) in Geneva-Switzerland and the Measuring Network of Wind Energy Institutes (MEASNET) standards that developed the guideline for the evaluation of site-specific wind conditions [26].

3.2. Wind Turbine Characteristics

Each of the turbines in the site is a 2 MW pitch-regulated wind turbine, where the Vestas, V90 Class II is selected. The Vestas V90-2.0 MW wind turbine is a pitch-regulated upwind turbine with active yaw and a three-blade rotor. The Vestas V90-2.0 MW turbine has a rotor diameter of 90 m with a generator rated at 2.0 MW, depending upon wind conditions. The turbine utilizes a microprocessor pitch control system called OptiTip® and the OptiSpeedTM (variable speed) feature. With these features, the wind turbine is able to operate the rotor at variable speed (rpm), helping to maintain the output at or near the rated power. The power curve of the turbine is used for the energy production calculations, whereas the thrust curve is used for the wake effects estimations. The cut in speed is 4 m/s, the rated speed is 13.5 m/s, and its cut off speed is 25 m/s, while the power is 89 kW, 2000 kW and 2000 kW, respectively.

3.3. Simulation Software

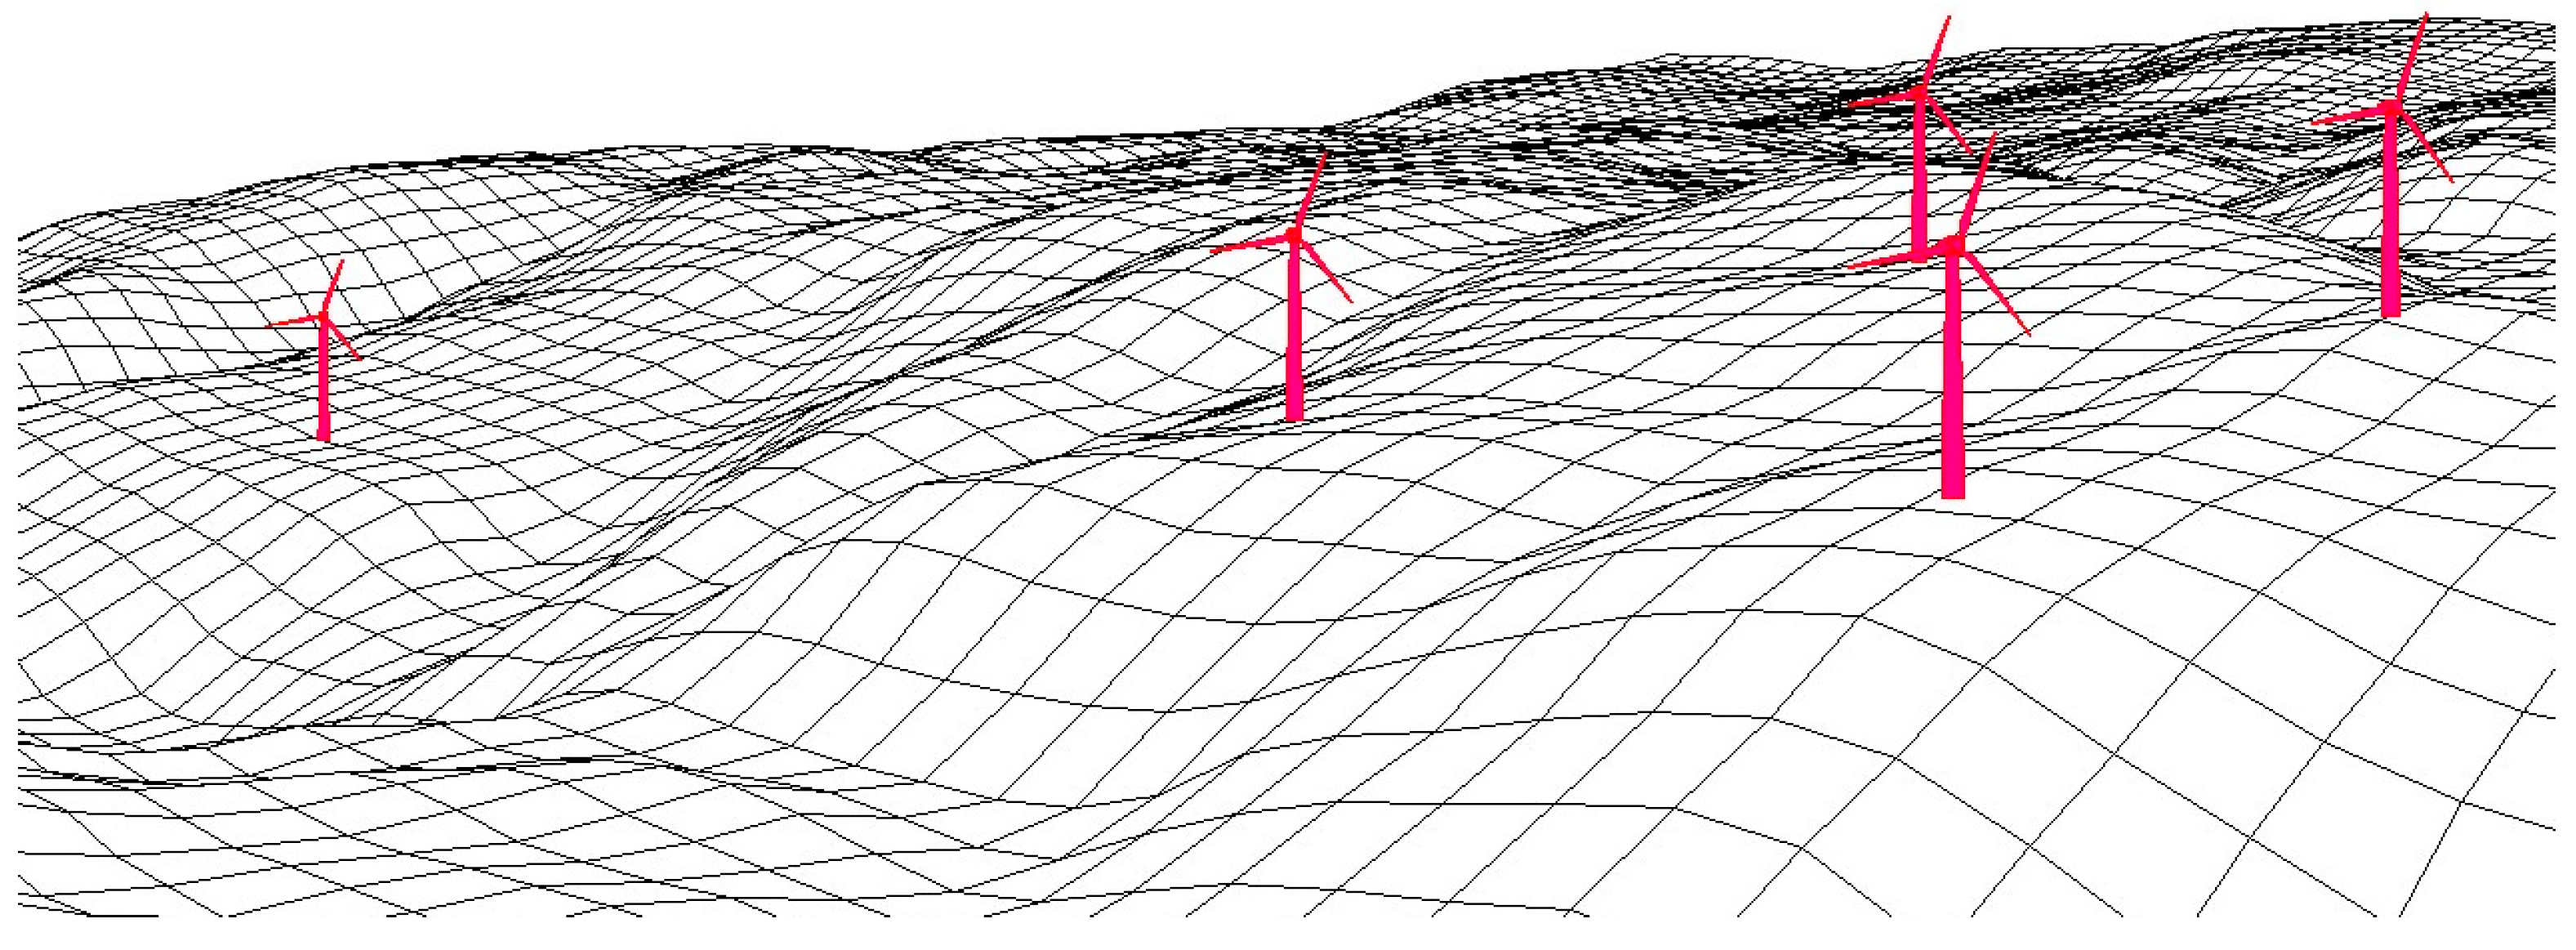
In this study, the WindFarm Simulation software is used, which is able to calculate the energy yield of a wind farm, including topographic and wake effects, optimizing the turbine layout for maximum energy yield. We then perform noise calculations (showing the noise contours), analyze wind turbine data, perform measure-correlate-predict analysis of wind speed data, create zone-of-visual-influence maps, display wire frame views of wind farms, calculate shadow flicker, and create 3D visualizations [27].
WindFarm by ReSoft Ltd., London-United Kingdom, is a computational fluid dynamics (CFD) model software package. It also employs the Reynolds-averaged Navier–Stokes method (RANS equations are time-averaged equations of motion for fluid flow) to solve the non-linear Navier–Stokes equations with an MS-Micro solver. It also has options to provide various closures to the turbulence equations. WindFarm takes into account geostrophic balance, roughness variations, height variations, turbulence, a logarithmic wind profile and a specific and uniform stability.
The model is based on a division of an assumed neutrally-stratified flow field into inner and outer layers. The outer layer is characterized by inviscid, potential flow, while in the inner layer, a balance between advective, pressure-gradient and turbulent-viscous forces is assumed, and turbulent transfers are modeled with a simple mixing length closure scheme. Fourier transforms are used to provide the solution. The wind turbulence information and wind profile are modeled during the wind distribution calculation in the WindFarm Software, which is considered as a vital model in the wind flow simulation.
A unique feature of WindFarm that has not been found on other CFD modeling software, is that it can be used alongside “WasP”, “WindSim” and “Meteodyn WT”, where wind field files from those programs can be imported and used in WindFarm. This is advantageous, because wind data from all of the models previously listed can be compared in WindFarm, and a user is able to find the most accurate and satisfying results for their project by using only one program (27).
The number of grid points to each direction is 161 × 161 × 51 points in the main-flow-direction (x), span wise direction (y) and vertical direction (z), respectively. The grid widths of directions x and y were approximately uniform intervals, with a horizontal resolution of approximately 100 m.
The WindFarm simulation tool has been used for the prediction of the wind flow over the topography. The background terrain height information extends 20 km × 20 km the simulation domain size extends 12.8 km × 12.8 km, and the inner region with boundary condition independency approximately 6 km × 6 km.

4. Results and Discussion

4.1. Wind Data Analysis

The wind rose and wind data analysis of the mast location Um Al Rumman are presented in the following. The wind data and the wind potential of the studied location are correlated based on the wind data of Um Al Rumman.

4.1.1. Wind Speed Brief Statistics

The mean wind speed at 10 m height is 5 m/s, where the maximum average wind speed was recorded in 29 January 2008, 20:00 is 19.8 m/s. The maximum gust happened in 29 January 2008, 8:30 and it reached 28.9 m/s. Moreover, the uncertainty of the measurement is 0.2 m/s and mean turbulence intensity is 13.3% at a height of 10 m.

4.1.2. Weibull Distribution Parameters

The identification of the Weibull distribution relies mainly on two parameters, being the shape factor (k) that describes the form of distribution and the scale factor (C) that represents the wind speed, where the values of these parameters are 1.88 and 5.8, respectively. Figure 2 shows the Weibull distribution curve of the selected location.
The main wind directions are WSW, W, ENE with 51.28%, 28.35% and 26.45%, respectively, as shown in Figure 2.

4.1.3. Expected Wind Energy Production

Wind Rose Software assumes the installation of the wind turbine rather than the meteorological mast in order to calculate the expected energy production of the wind turbine, based on the measured data and its power curve. Accordingly, the expected energy production produced by the software is 4,235,202 kWh, and the capacity factor is 25.9%. The results also show the annual energy production, with the capacity factors based on the time distribution and Weibull distribution.

4.1.4. The Best Sectors

The best sector regarding the energy content and the time distribution chart have been found to be WSW with 51.28%, and W with 28.35%, respectively. While the second-best sector in energy content is W, and the second-best sector in time distribution is ENE, as shown in Figure 3 and Figure 4.
The main wind speed, direction and data distribution for the Umm Al Rumman meteorological mast are shown in Figure 5, Figure 6 and Figure 7.
Figure 7 shows the mean and maximum wind speed for sample months during the test period over 12 months. The best month was January, in which the mean and maximum wind speed comes from three directions (WSW, SW and SSW). The wind direction comes from the specific sector WSW in March and April. Regarding the summer session, most wind comes from the west, while in the autumn session the wind comes from the WSW and ENE sectors.

4.2. Layout Arrangement

4.2.1. Conventional Arrangement

The distance between the wind turbines varies between 5 and 2.5 times of the respective rotor diameters of the selected wind turbine. The simulation results of the wind shear at the met mast location have an influence on the power generation of each turbine. The effect of the topography to the average wind speed results in an acceleration and concentration, especially where the slopes of the terrain are steep.
Arranging the turbines in different layouts (M shape, Straight line and Arch shape) facing main wind directions with 5 (5D) and 2.5 (2.5D) times the distance of the rotor diameter (D) between each turbine as shown in Figure 8.
It has been calculated that the maximum predicted energy generation from each turbine is around 6.89 GWh per year (in total for the five turbines: 34.47 GWh/year). Also, applying different layouts has resulted in different energy yields because of different losses, such as wake effects and topographic influences. The wake effect can be described as accumulated losses on the wind farm energy yield, caused by turbulences and reduced wind velocities by neighboring wind turbines. While the topography of the site includes hills, edges, cliffs and mountainous, the terrain has a substantial influence on the wind speed and direction at this specific site.
Arranging the turbines facing the main wind direction with five times the rotor diameter distance between each turbine results in 22.75, 22.87 and 21.997 GWh/a for the M shape (Figure 8a), Straight line (Figure 8c), and Arch shape (Figure 8e), respectively. While reducing the distance between turbines to 2.5 times the rotor diameter results in a reduction in the wind farm energy yield to 22.68 (Figure 8b), 21.498 (Figure 8d) and 21.546 (Figure 8f) GWh/a for M shape, Straight line and Arch shape, respectively. Table 1 summarizes the distances between the turbines, the topographic effects, the wake losses, and the total energy of the arrangement of the turbines in different layouts (a–f in Figure 8).

4.2.2. Optimized Arrangement

Designing the optimum layout of the wind turbines on this hypothetical site, including a few practical restrictions, is a fairly straightforward problem. However, applying optimization algorithms to real sites necessitates combining many boundary conditions that exist for a real site. These constraints include land ownership, property boundaries, wake effects of one turbine to another, the resulting noise level at nearby dwellings, as well as natural restrictions like steep slopes, rivers, bogs and planning constraints. The main points of the optimization are the following constraints:
  • Maximization of the energy yield;
  • Containment of the wind farm within the foreseen area for the development;
  • Distance between the wind turbines greater than three times the rotor diameter.
Figure 9 shows the position of the wind turbines after optimization, presented on the wind speed map.
The topography from a specific point of interest facing the wind farm area is shown in Figure 10. This facilitates the assessment of the visual impact of the wind farm within the close vicinity from the perspective of humans.
The optimization procedure aims to the arrangement of the wind turbines under the constraints of the exploitation of the region with the high wind potential, while simultaneously keeping the wake losses at the lowest possible level. For the optimized layout, it is evident that the wind farm units are optimally distributed over the high wind speed at the top of the hill. Figure 11 shows that the optimized layout significantly reduces topography losses while simultaneously keeping the wake effects at a low level.
The overall increase in energy yield from the optimization process ranges from 9% to almost 16%, compared to the final Jerash wind farm energy yield of 24.92 GWh/a, as shown in Figure 12. It could be shown that the percentage change in the overall energy generation for the optimized wind turbines compared to the modeled layouts has been in the range between 8.9% (for the 5D straight layout) to 15.9% (for the 2.5D straight layout). Figure 12 shows the comparison of the total energy generation of the six examined layouts and the optimized arrangement of the wind turbines.

5. Conclusions

During recent years, more developments have been done for an optimized arrangement of wind turbines in larger wind farms. In this research it could be shown that optimization techniques have been used to optimize the wind farm layout to harvest the maximum possible energy from the prevailing wind. It has been found that the maximum predicted energy generation from the optimized wind turbines is 34.47 GWh/a in total. Also, it has been shown that applying different layouts has a significant effect to the energy yields due to mainly effects like the wake effect and topographic losses. The wake can be described as the accumulated effect on the wind farm energy yield, resulting from fluctuations in wind speed caused by the neighboring wind turbines. While the topography of the site includes hills, edges, cliffs and mountainous terrain, the specific conditions have a substantial influence upon the wind speed and direction.
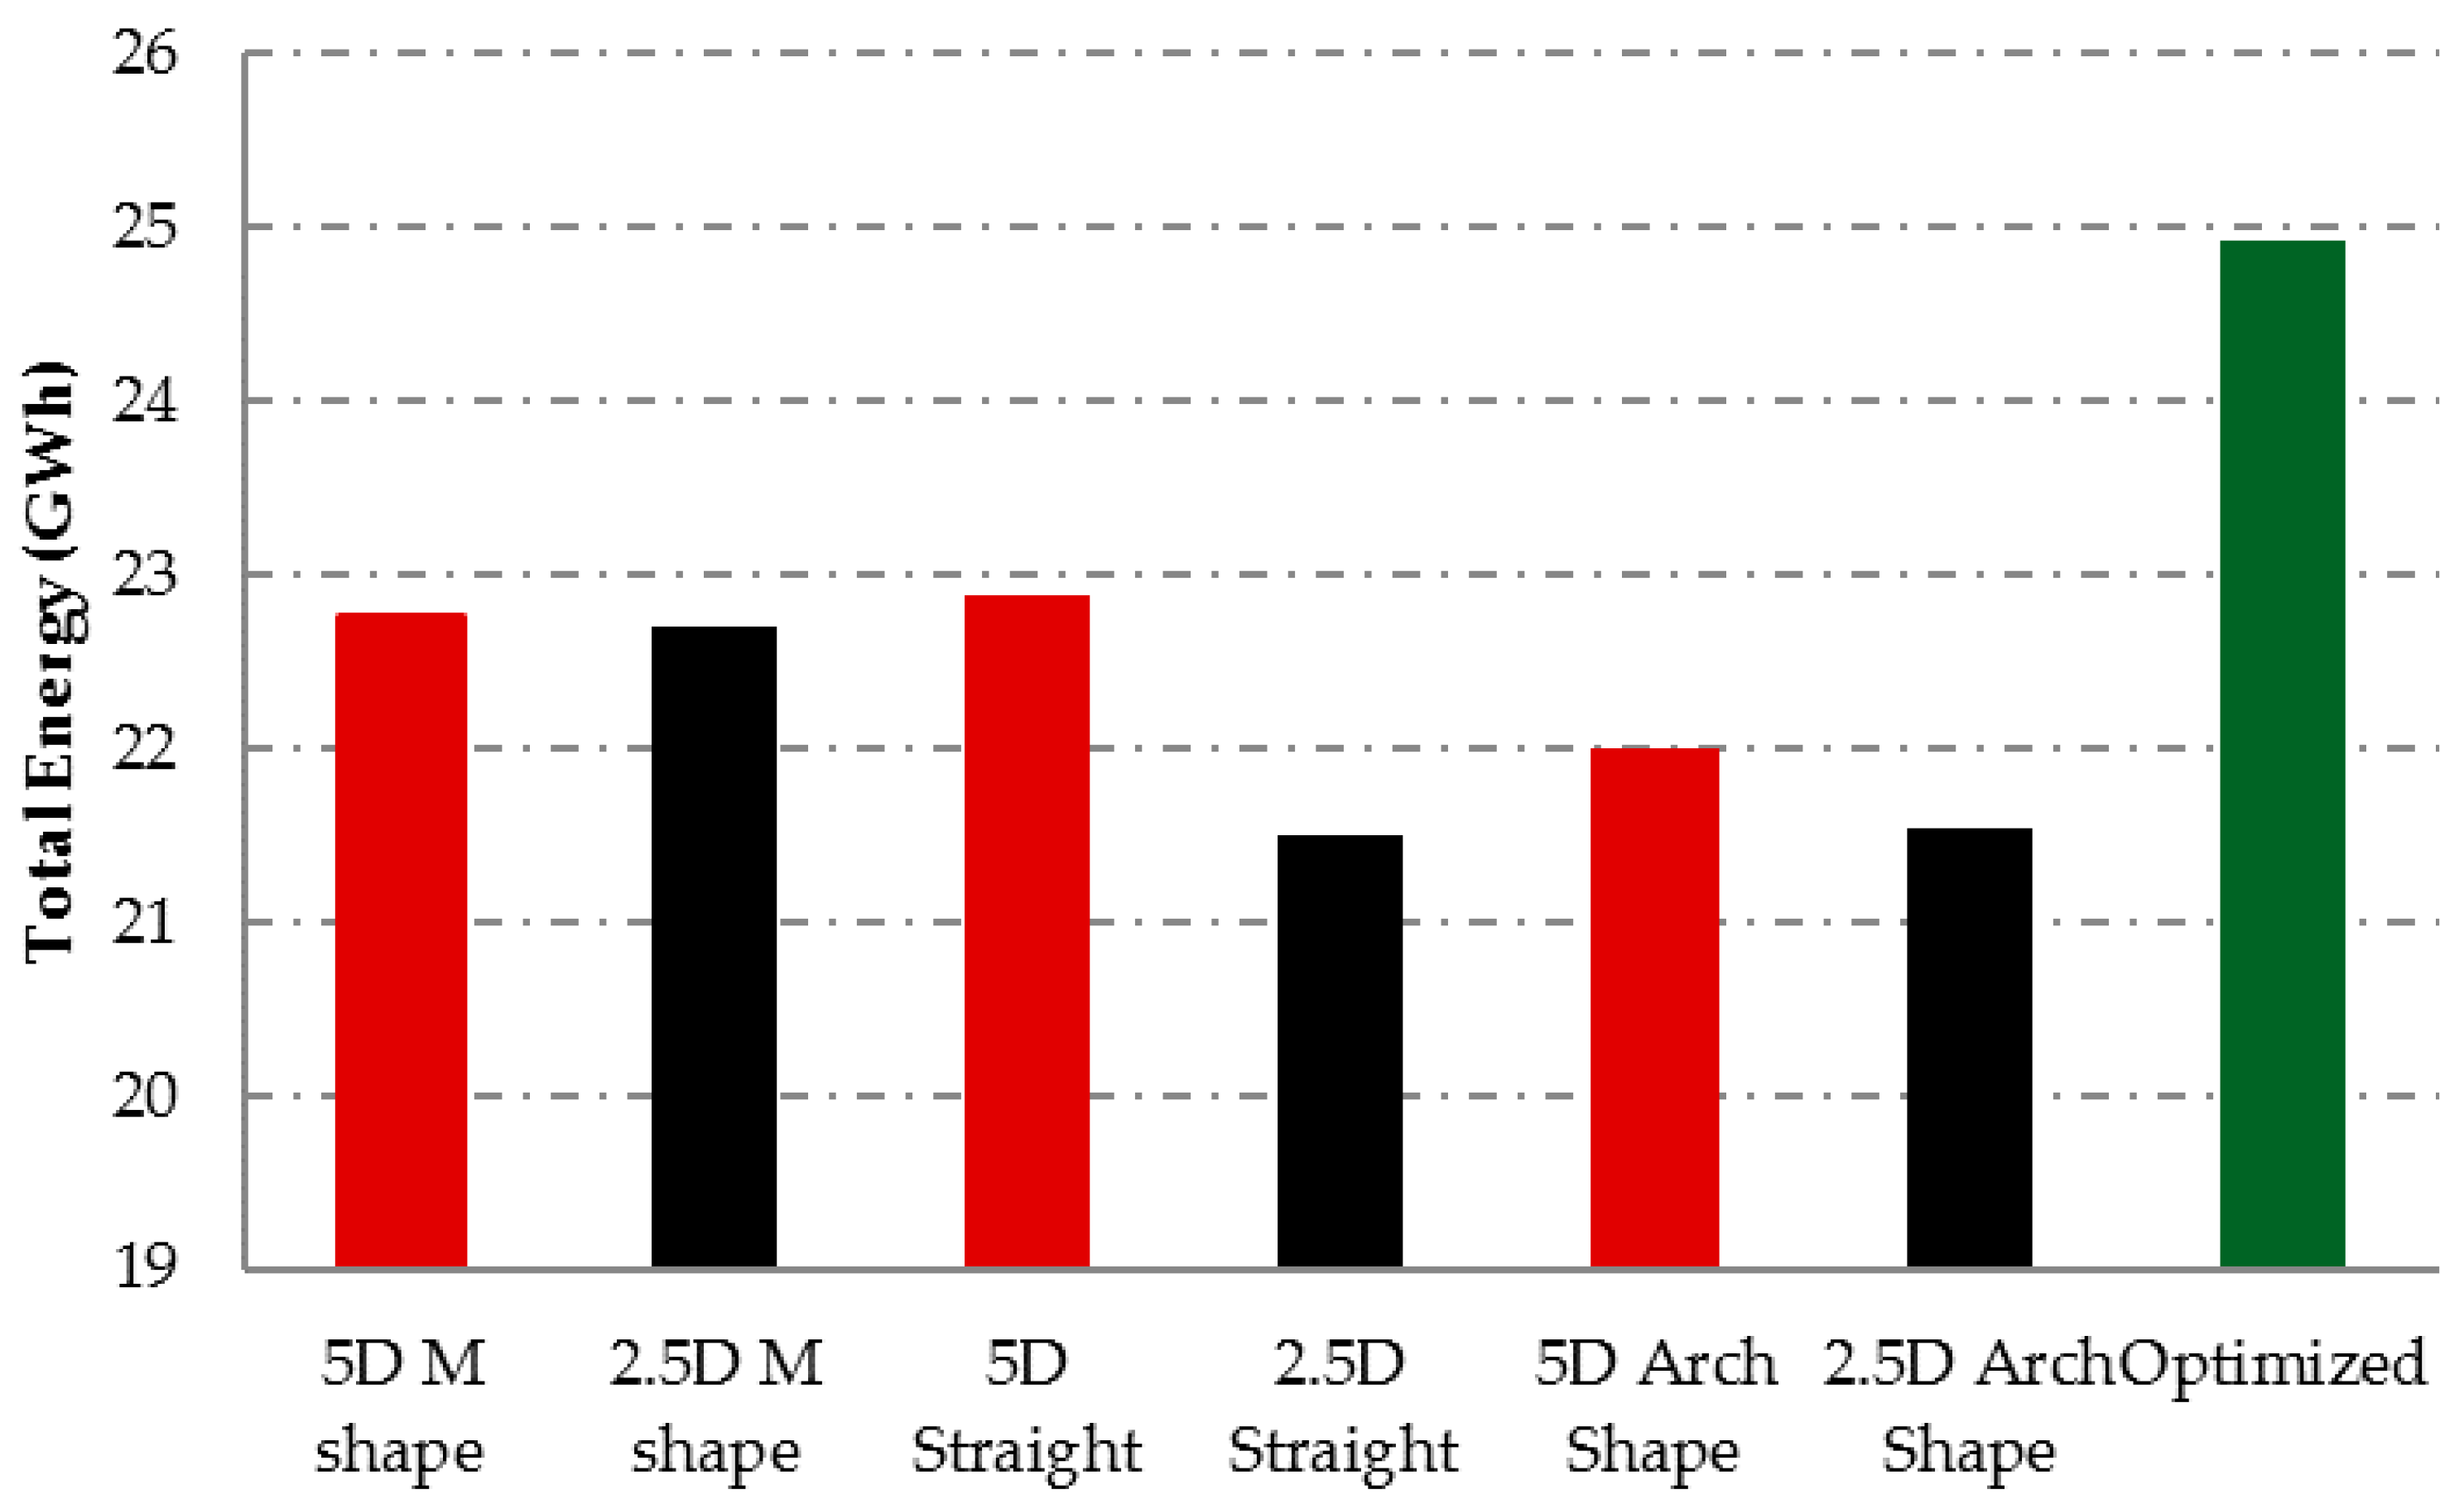
For the five turbines that have been optimized in the site, the arrangement of the turbines facing the main wind direction, with five times the rotor diameter distance between each turbine, resulted in 22.75, 22.87 and 21.997 GWh/a for the M shape, Straight line and Arch shape, respectively. Reducing the distance between THE turbines to 2.5 times the rotor diameter decreased the wind farm energy yield to 22.68, 21.498 and 21.5463 GWh/a for the M shape, Straight line and Arch shape, respectively. It can be concluded that an optimized arrangement allows a significant increase in power generation while consequently reducing the costs of the wind farm.

Author Contributions

Conceptualization, M.A.-A. and A.A.; methodology, M.J. and S.A.H.; software, S.A.H.; formal analysis, M.A.-A. and A.A.; investigation, M.J. and S.A.H.; resources, J.W.; data curation, M.A.-A.; writing—original draft, M.J.; writing—review and editing, J.W.; supervision, M.A.-A. All authors have read and agreed to the published version of the manuscript.

Funding

This research received no external funding.

Acknowledgments

The authors are grateful for the support of the Deanship of Graduate Studies and Research at the German Jordanian University.

Conflicts of Interest

The authors declare no conflict of interest.

References

  1. Al-Addous, M.; Saidan, M.; Bdour, M.; Dalalah, Z.; Albatayneh, A.; Class, C.B. Key Aspects and Feasibility Assessment of a Proposed Wind Farm in Jordan. Int. J. Low-Carbon Technol. 2019, ctz062. [Google Scholar] [CrossRef]
  2. Prósper, M.A.; Otero-Casal, C.; Fernández, F.C.; Miguez-Macho, G. Wind Power Forecasting for a Real Onshore Wind Farm on Complex Terrain Using WRF High Resolution Simulations. Renew. Energy 2019, 135, 674–686. [Google Scholar] [CrossRef]
  3. Astolfi, D.; Castellani, F.; Terzi, L. A Study of Wind Turbine Wakes in Complex Terrain Through RANS Simulation and SCADA Data. J. Sol. Energy Eng. 2018, 140, 031001. [Google Scholar] [CrossRef]
  4. Han, X.; Liu, D.; Xu, C.; Shen, W.Z. Atmospheric Stability and Topography Effects on Wind Turbine Performance and Wake Properties in Complex Terrain. Renew. Energy 2018, 126, 640–651. [Google Scholar] [CrossRef]
  5. Feng, J.; Shen, W. Modeling Wind for Wind Farm Layout Optimization Using Joint Distribution of Wind Speed and Wind Direction. Energies 2015, 8, 3075–3092. [Google Scholar] [CrossRef] [Green Version]
  6. Gebraad, P.; Thomas, J.J.; Ning, A.; Fleming, P.; Dykes, K. Maximization of the Annual Energy Production of Wind Power Plants by Optimization of Layout and Yaw-Based Wake Control: Maximization of Wind Plant AEP by Optimization of Layout and Wake Control. Wind Energy 2017, 20, 97–107. [Google Scholar] [CrossRef] [Green Version]
  7. Mosetti, G.; Poloni, C.; Diviacco, B. Optimization of Wind Turbine Positioning in Large Windfarms by Means of a Genetic Algorithm. J. Wind Eng. Ind. Aerodyn. 1994, 51, 105–116. [Google Scholar] [CrossRef]
  8. Grady, S.A.; Hussaini, M.Y.; Abdullah, M.M. Placement of Wind Turbines Using Genetic Algorithms. Renew. Energy 2005, 30, 259–270. [Google Scholar] [CrossRef]
  9. Ju, X.; Liu, F. Wind Farm Layout Optimization Using Self-Informed Genetic Algorithm with Information Guided Exploitation. Appl. Energy 2019, 248, 429–445. [Google Scholar] [CrossRef]
  10. Brogna, R.; Feng, J.; Sørensen, J.N.; Shen, W.Z.; Porté-Agel, F. A New Wake Model and Comparison of Eight Algorithms for Layout Optimization of Wind Farms in Complex Terrain. Appl. Energy 2019, 114189. [Google Scholar] [CrossRef]
  11. Wang, L.; Yuan, J.; Cholette, M.E.; Fu, Y.; Zhou, Y.; Tan, A.C. Comparative Study of Discretization Method and Monte Carlo Method for Wind Farm Layout Optimization under Weibull Distribution. J. Wind Eng. Ind. Aerodyn. 2018, 180, 148–155. [Google Scholar] [CrossRef]
  12. Marmidis, G.; Lazarou, S.; Pyrgioti, E. Optimal Placement of Wind Turbines in a Wind Park Using Monte Carlo Simulation. Renew. Energy 2008, 33, 1455–1460. [Google Scholar] [CrossRef]
  13. Zergane, S.; Smaili, A.; Masson, C. Optimization of Wind Turbine Placement in a Wind Farm Using a New Pseudo-Random Number Generation Method. Renew. Energy 2018, 125, 166–171. [Google Scholar] [CrossRef]
  14. Parada, L.; Herrera, C.; Flores, P.; Parada, V. Wind Farm Layout Optimization Using a Gaussian-Based Wake Model. Renew. Energy 2017, 107, 531–541. [Google Scholar] [CrossRef]
  15. Turner, S.D.O.; Romero, D.A.; Zhang, P.Y.; Amon, C.H.; Chan, T.C.Y. A New Mathematical Programming Approach to Optimize Wind Farm Layouts. Renew. Energy 2014, 63, 674–680. [Google Scholar] [CrossRef]
  16. Parada, L.; Herrera, C.; Flores, P.; Parada, V. Assessing the Energy Benefit of Using a Wind Turbine Micro-Siting Model. Renew. Energy 2018, 118, 591–601. [Google Scholar] [CrossRef]
  17. Kusiak, A.; Song, Z. Design of Wind Farm Layout for Maximum Wind Energy Capture. Renew. Energy 2010, 35, 685–694. [Google Scholar] [CrossRef]
  18. Chen, K.; Song, M.X.; Zhang, X.; Wang, S.F. Wind Turbine Layout Optimization with Multiple Hub Height Wind Turbines Using Greedy Algorithm. Renew. Energy 2016, 96, 676–686. [Google Scholar] [CrossRef]
  19. Lorca, A.; Sun, A. Adaptive Robust Optimization with Dynamic Uncertainty Sets for Multi-Period Economic Dispatch Under Significant Wind. IEEE Trans. Power Syst. 2014, 30, 1702–1713. [Google Scholar] [CrossRef] [Green Version]
  20. Carta, J.A.; Ramírez, P.; Velázquez, S. A Review of Wind Speed Probability Distributions Used in Wind Energy Analysis. Renew. Sustain. Energy Rev. 2009, 13, 933–955. [Google Scholar] [CrossRef]
  21. Dobrić, G.; Đurišić, Ž. Double-Stage Genetic Algorithm for Wind Farm Layout Optimization on Complex Terrains. J. Renew. Sustain. Energy 2014, 6, 033127. [Google Scholar] [CrossRef]
  22. Rivas, R.A.; Clausen, J.; Hansen, K.S.; Jensen, L.E. Solving the Turbine Positioning Problem for Large Offshore Wind Farms by Simulated Annealing. Wind Eng. 2009, 33, 287–297. [Google Scholar] [CrossRef]
  23. Wagner, M.; Day, J.; Neumann, F. A Fast and Effective Local Search Algorithm for Optimizing the Placement of Wind Turbines. Renew. Energy 2013, 51, 64–70. [Google Scholar] [CrossRef] [Green Version]
  24. Shakoor, R.; Hassan, M.Y.; Raheem, A.; Wu, Y.-K. Wake Effect Modeling: A Review of Wind Farm Layout Optimization Using Jensen׳s Model. Renew. Sustain. Energy Rev. 2016, 58, 1048–1059. [Google Scholar] [CrossRef]
  25. Sahil, A.H. Design and Analysis of a Hybrid Power System Wind-Hydroelectric with Water Pumping Storage. Master’s Thesis, German Jordanian University, Amman, Jordan, 2018. [Google Scholar]
  26. International Electrotechnical Commission. IEC 61400-1, Wind Turbines—Part 1: Design Requirements, 3rd ed.; International Electrotechnical Commission: Geneva, Switzerland, 2005. [Google Scholar]
  27. WindFarm Version 4; Computer Program; ReSoft Ltd., Chester House: London, UK, 2018.
Figure 1. Topography of the wind farm in the study site (Um Al Rumman, Jordan) as seen from south-west 3D (left) and 2D (right).
Atmosphere 11 00117 g001
Figure 2. Histogram of the wind speed and the approximated Weibull distribution.
Atmosphere 11 00117 g002
Figure 3. Wind Rose based on energy.
Atmosphere 11 00117 g003
Figure 4. Wind Rose based on time.
Atmosphere 11 00117 g004
Figure 5. Wind Rose main results regarding the mean wind speed for the Um Al Rumman meteorological mast.
Atmosphere 11 00117 g005
Figure 6. Wind Rose main results regarding the main wind directions for the Um Al Rumman meteorological mast.
Atmosphere 11 00117 g006
Figure 7. Mean and Max Wind Speed for selective months.
Atmosphere 11 00117 g007
Figure 8. Wind turbines layouts and spacing.
Atmosphere 11 00117 g008
Figure 9. Position of the wind turbines after optimization on wind speed map.
Atmosphere 11 00117 g009
Figure 10. Location of viewpoints of interest in the surrounding wind farms (WFs) from the SSW.
Atmosphere 11 00117 g010
Figure 11. Topographic effects and wake losses of six layouts and optimized arrangement of the wind turbines.
Atmosphere 11 00117 g011
Figure 12. Total energy generation of the six layouts and the optimized arrangement of the wind turbines.
Atmosphere 11 00117 g012
Table 1. Summary of the wind turbines arrangement.
LayoutDistance between
the Turbines (m)
Topographic
Effects (%)
Wake
Losses (%)
Total Energy
(GWh)
5D M shape45030.105.5722.75
2.5D M shape22527.8314.0322.68
5D Straight45029.296.1722.87
2.5D Straight22526.8014.821.498
5D Arch Shape45030.877.6821.997
2.5D Arch Shape22525.6115.9721.546

