Article

Differences in Model Performance and Source Sensitivities for Sulfate Aerosol Resulting from Updates of the Aqueous- and Gas-Phase Oxidation Pathways for a Winter Pollution Episode in Tokyo, Japan

1
Central Research Institute of Electric Power Industry, Abiko, Chiba 270-1194, Japan
2
Graduate School of Maritime Sciences, Kobe University, Kobe, Hyogo 658-0022, Japan
3
National Institute for Environmental Studies, Tsukuba, Ibaraki 305-8506, Japan
*
Author to whom correspondence should be addressed.
Atmosphere 2019, 10(9), 544; https://doi.org/10.3390/atmos10090544
Submission received: 31 July 2019 / Revised: 9 September 2019 / Accepted: 9 September 2019 / Published: 12 September 2019

Abstract

:
During the Japanese intercomparison study, Japan’s Study for Reference Air Quality Modeling (J-STREAM), it was found that wintertime SO42– concentrations were underestimated over Japan with the Community Multiscale Air Quality (CMAQ) modeling system. Previously, following two development phases, model performance was improved by refining the Fe- and Mn-catalyzed oxidation pathways and by including an additional aqueous-phase pathway via NO2 oxidation. In a third phase, we examined a winter haze period in December 2016, involving a gas-phase oxidation pathway whereby three stabilized Criegee intermediates (SCI) were incorporated into the model. We also included options for a kinetic mass transfer aqueous-phase calculation. According to statistical analysis, simulations compared well with hourly SO42– observations in Tokyo. Source sensitivities for four domestic emission sources (transportation, stationary combustion, fugitive VOC, and agricultural NH3) were investigated. During the haze period, contributions from other sources (overseas and volcanic emissions) dominated, while domestic sources, including transportation and fuel combustion, played a role in enhancing SO42– concentrations around Tokyo Bay. Updating the aqueous phase metal catalyzed and NO2 oxidation pathways lead to increase contribution from other sources, and the additional gas phase SCI chemistry provided a link between fugitive VOC emission and SO42– concentration via changes in O3 concentration.

1. Introduction

To improve our understanding of the behavior of air pollutants, advances in three-dimensional air quality modeling are necessary. Modeling systems can represent key environmental processes (emission, transport, chemical reactions, deposition) which determine the behavior of air pollutants; however, there are uncertainties in these processes. To better understand these uncertainties and improve modeling performance, intercomparison studies can be of great value. Based on the results and experience of projects in Japan, an intercomparison project called Japan’s Study for Reference Air Quality Modeling (J-STREAM) was initiated [1], and this has provided insights into how to improve modeling [2,3,4,5]. J-STREAM aims to establish reference air quality models for source apportionment and to formulate a strategy for mitigating air pollutants in Japan, including particulate matter with diameters less than 2.5 μm (PM2.5) and photochemical ozone (O3). The first phase of J-STREAM focused on understanding the ranges and limitations of PM2.5 and O3 concentrations simulated by participants using common input datasets. Simulations for the first phase were conducted over two weeks in each season from January 2013 to March 2014 in accordance with official monitoring programs for PM2.5 [1]. In Japan, sulfate (SO42–) aerosol is a major component of PM2.5 and it was found that models generally capture the observations but underestimate the concentrations in winter. Therefore, the model processes that were related to SO42– production were carefully reviewed, revealing inadequate oxidation of SO2 via aqueous-phase reactions of O2 catalyzed by Fe and Mn because of a lack of trace metal data over Asia in the current emission inventory [3]. For the second phase of J-STREAM, a winter haze episode for the period 13–25 December 2016 was targeted. In addition to the incorporation of refinements for the Fe- and Mn-catalyzed aqueous oxidation in the first phase, the aqueous-phase reaction via NO2 was introduced, and this increased the SO42– production levels to catch the SO42– observations. Intercomparison studies involving two state-of-the-art regional models, the Community Multiscale Air Quality Model (CMAQ) and the Comprehensive Air Quality Model with eXtensions (CAMx) were also conducted. As a result, it was suggested that differences in model performances were possibly [4] caused by wet deposition processes. Thus, a third phase of J-STREAM, which is the focus of the present study, was conducted, which again involved the winter haze episode examined in second phase. The main purpose of third phase was to obtain and compare the source sensitivities with respect to major emission sources by model intercomparison.
The remainder of this paper is organized as follows. The model setups for CMAQ are described in the next section. To improve the estimations for the ambient concentrations of SO42–, an additional gas-phase oxidation pathway involving stabilized Criegee intermediates (SCI) was included in the model and full details of the reaction chemistry are given. In the results and discussion section, model performances were evaluated for observations in Tokyo together with an analysis of source sensitivities. The conclusions are presented in the final section.

2. Modeling Design

The third phase of J-STREAM focuses again on the winter haze episode of 15–25 December 2016 [4]. The domain and the common input dataset for the emissions and the meteorology basically followed that for the J-STREAM framework [1]. Domain 1 covered the whole of Asia, domain 2 covered the whole of Japan and domains 3 and 4 covered the Kansai region (including Osaka and Nagoya) and the Kanto region (including Tokyo), respectively. The horizontal grid resolution was 45 km for domain 1, 15 km for domain 2, and 5 km for domains 3 and 4. In the second phase, the vegetation database for Japan was introduced and this revision helped to improve the meteorological fields and the emissions of biogenic volatile organic compounds [2]. For the emissions inventory, the compositions of metal elements in PM2.5 over Asia were considered in accordance with chemical composition reports [6] based on our recommendations in first phase [4]. In the third phase, anthropogenic emissions from China were revised by adjusting data for 2016 that included updated emission information. For example, the SO2 emissions from China in 2016 was almost half of emissions in 2010 [7]. For meteorology the revision was performed in this third phase on the configuration of Weather Research and Forecasting (WRF) version 3.7.1 [8]. The revised points are summarized as follows and others are based on the established J-STREAM framework in the first phase. The top pressure level was set on 50 hPa. The reanalysis data was taken from the National Centers for Environmental Prediction (NCEP) final analysis (ds083.3) with 6-h intervals and with a 0.25° horizontal grid resolution [9], and the sea surface temperature (SST) data was obtained from the Group for High Resolution Sea Surface Temperature (GHRSST) of level 4 with 24-h intervals and with 1-km horizontal grid resolution [10] for the initial and boundary conditions. The grid nudging on wind was conducted on all layers, and those on temperature and water vapor were not conducted in the planetary boundary layer (PBL). The nudging coefficient for wind was 1.0 × 10⁻⁴ for all domains and those for temperature and water vapor were 5.0 × 10⁻⁵ for domain 1, 3.0 × 10⁻⁵ for domain 2, and 1.0 × 10⁻⁵ for domains 3 and 4. The shortwave and longwave radiation scheme used RRTMG [11], and the microphysics and cumulus options respectively adopted the Morrison double-moment scheme [12] and the Grell–Devenyi ensemble scheme [13] based on the performance improvement on pre-simulation.
CMAQ version 5.2 [14] model simulations were performed in this study. The gas and aerosol chemistry were handled by SAPRC07 [15] and AERO6, respectively. In connection with SO42– production, CMAQ version 5.2 features one gas-phase chemical reaction and five aqueous-phase chemical reactions [16]. The original configuration released as CMAQ (hereafter referred to as the base-case simulation) was simulated first. Then, the simulation of chemistry updates A was performed based on our findings in the first phase [3]. The aqueous-phase oxidation pathways for O2 via Fe and Mn catalysis were refined by increasing the anthropogenic Fe and Mn solubilities from 10% to 25% and from 50% to 100%, respectively. In this aqueous-phase oxidation pathway for O2:
d [ S ( IV ) ] / dt = k 1 [ Fe ( III ) ] [ S ( IV ) ] + k 2 [ Mn ( II ) ] [ S ( IV ) ]   +   k 3 [ Fe ( III ) ] [ Mn ( II ) ] [ S ( IV ) ]
considered the pH dependency of the rate constants as follows when the synergistic existence of Fe and Mn,
k 3 [ H + ] 0.67 [ Fe ( III ) ] [ Mn ( II ) ] [ S ( IV ) ]   ( pH     4.2 ) , k 3 [ H + ] 0.74 [ Fe ( III ) ] [ Mn ( II ) ] [ S ( IV ) ]   ( pH   <   4.2 ) ,
where k3′ = 2.51 × 10¹³ M−1 s−1 and k3″ = 3.72 × 10⁷ M−1 s−1 [3]. Moreover, the aqueous-phase reaction pathway via NO2 was introduced in CMAQ:
d [ S ( IV ) ] / dt = k   [ NO 2 ( aq ) ] [ S ( IV ) ] ,
based on consideration of the neutralized or acidic features of aerosols in Asia and having a rate constant expression as follows:
k   =   1.24   ×   10 7   M 1   s 1   ( pH < 5.3 ) ,   k = 1.67 × 10 7   M 1   s 1   (   pH   >   8.7 ) ,
where for the pH range 5.3–8.7, the rate constant was linearly interpolated based on our findings in the second phase [4]. These revisions, which focused on aqueous-phase oxidation pathways, were included in chemistry updates A.
Previous studies [3,4] have focused on the need to refine the aqueous-phase sulfur oxidation pathways, but not the gas-phase reactions. Although refinements of the aqueous-phase oxidation pathways resulted in an improvement in model performance, underestimations of SO42– concentrations were not corrected. In addition, the increase in SO42– production via aqueous-phase oxidation also led to an increase in SO42– wet deposition. Regarding the relation between ambient concentrations of SO42– and deposition of SO42–, a comparison between CMAQ and CAMx with observation demonstrated the potential for overestimation of SO42– wet deposition by CMAQ [4]. Originally, the CMAQ model considered one gas-phase reaction of SO2 to be oxidized by an OH radical. Possible pathways of gas-phase oxidation involve SCI, which are produced from the reaction of alkenes and O3 [17,18]. A review of the SCI rate constants pointed out the wide range of values, covering three orders of magnitude [19]. This was due to the lack of direct measurement techniques available at the time to detect SCI. The impact of the simplest SCI of formaldehyde oxide (CH2OO) has been examined based on a recently measured rate constant [20]. Also, direct measurement of CH2OO has been reported by another research group who found a similarly elevated rate constant for SO42– production, but a different rate constant for H2O [21]. The reactions of CH2OO with methanol (CH3OH), ethanol (CH3CH2OH), and 2–propanol ((CH3)2CHOH) have also been reported [22]. In addition, the higher SCI of acetaldehyde oxide (CH3CHOO) and propionaldehyde oxide ((CH3)2COO) have also been reported recently [23,24]. A study on the application of CMAQ in the U.S.A., including the use of the representative SCI gas-phase oxidation into an updated 2005 Carbon Bond (CB05), reported the potential impacts on SO42– production [25]. Another study investigated the role of SCI based on the Master Chemical Mechanism (MCM) [26]. In this study, as a result of advances made in direct measurement of SCI, the gas-phase chemistry of three SCI (CH2OO, SCI1; CH3CHOO, SCI2; (CH3)2COO, SCI3) has been explicitly incorporated in SAPRC07. The yields of these three SCI species are derived directly from the yields of corresponded formic, acetic, and propanoic acids used in the gas-phase chemical reactions of SAPRC07 in CMAQ. The revised and added reactions are summarized in Table 1. The rate expression for SCI1 to H2O posed a potential issue for SO42– production given that previous studies concluded that a higher rate constant for the reaction of SCI and H2O led to the consumption of SCI by H2O [25,26]. In the case of SCI2, this specie has geometric isomers (the syn- and anti- forms) which exhibit different rate coefficients [23]; however, we simply averaged these values, treating SCI2 as a single entity. Thus, in addition to the revision of the aqueous-phase reactions in chemistry updates A, these gas-phase oxidation pathways involving the three SCI species were considered in the chemistry updates B.
The other approach for modeling the aqueous-phase reaction chemistry is the recently developed kinetic mass transfer (KMT) simulation for gas- and aqueous-phase species that simultaneously integrates phase transfer, scavenging, deposition, dissociation, and chemical kinetic processes (AQCHEM-KMT) [27,28] using the Kinetic PreProcessor [29]. It was reported that there was no significant impact on the monthly averaged data, but possible differences at the hourly timescale were noted [27]. To test this newly developed approach, a KMT simulation was also conducted. The simulations performed in this study are summarized in Table 2.

3. Results and Discussion

3.1. Model Performance

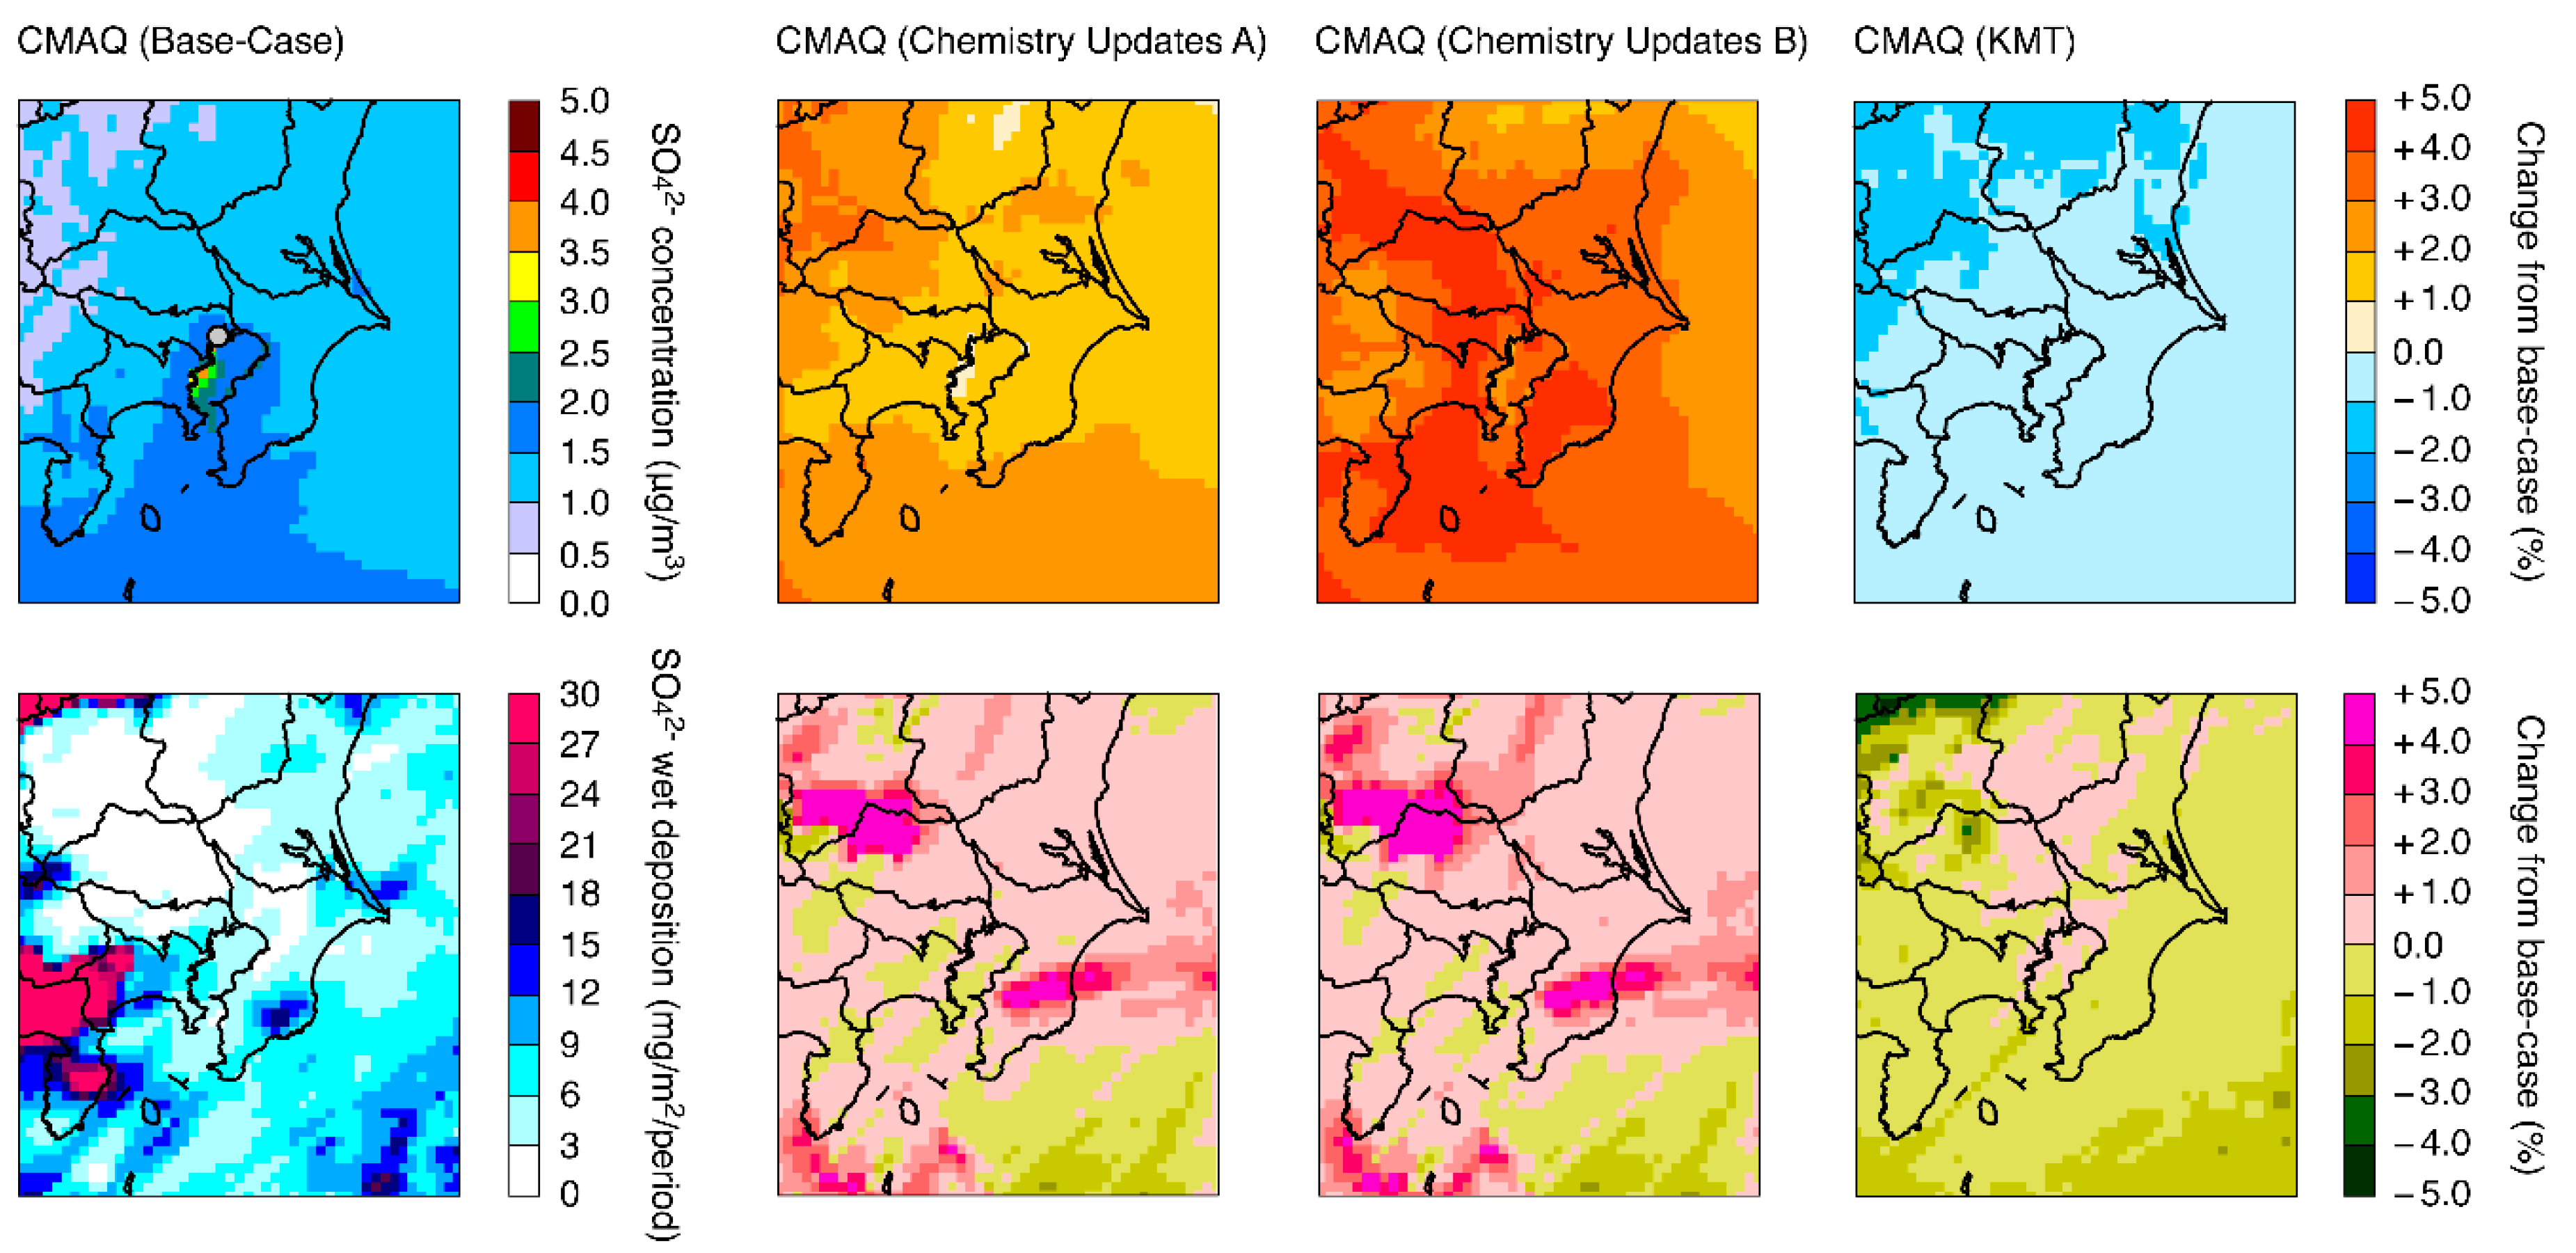
To gain an appreciation of the four simulations performed by CMAQ, the spatial distributions of SO42– concentrations simulated in domain 1 of J-STREAM are shown in Figure 1, based on averaging of the entire monitoring period. The high concentrations of SO42– over the Asian continent that included the downwind region of Japan were related to transboundary SO42– in Japan as discussed previously [30,31,32,33,34]. The differences in distributions of SO42– between the base-case simulations and those for the chemistry updates A and KMT are clearly evident. An increase in SO42– concentrations of greater than 5% for chemistry updates A compared with the base-case simulation was found for the Korean Peninsula and Japan which is the downwind region of the Asian continent. This finding was the same as demonstrated in our previous study [4]. However, when comparing KMT and the base-case simulation a negative effect was noted, the largest change in SO42– concentrations of more than −5% being detected over the Sea of Okhotsk. This region corresponded to a SO42– concentration of less than 1.0 μg/m3 with the absolute change in concentration being less than −0.1 μg/m3. This result suggests nonsignificant impacts by KMT on averaged SO42 and was consistent with the report on the KMT test case over the U.S.A. [27].
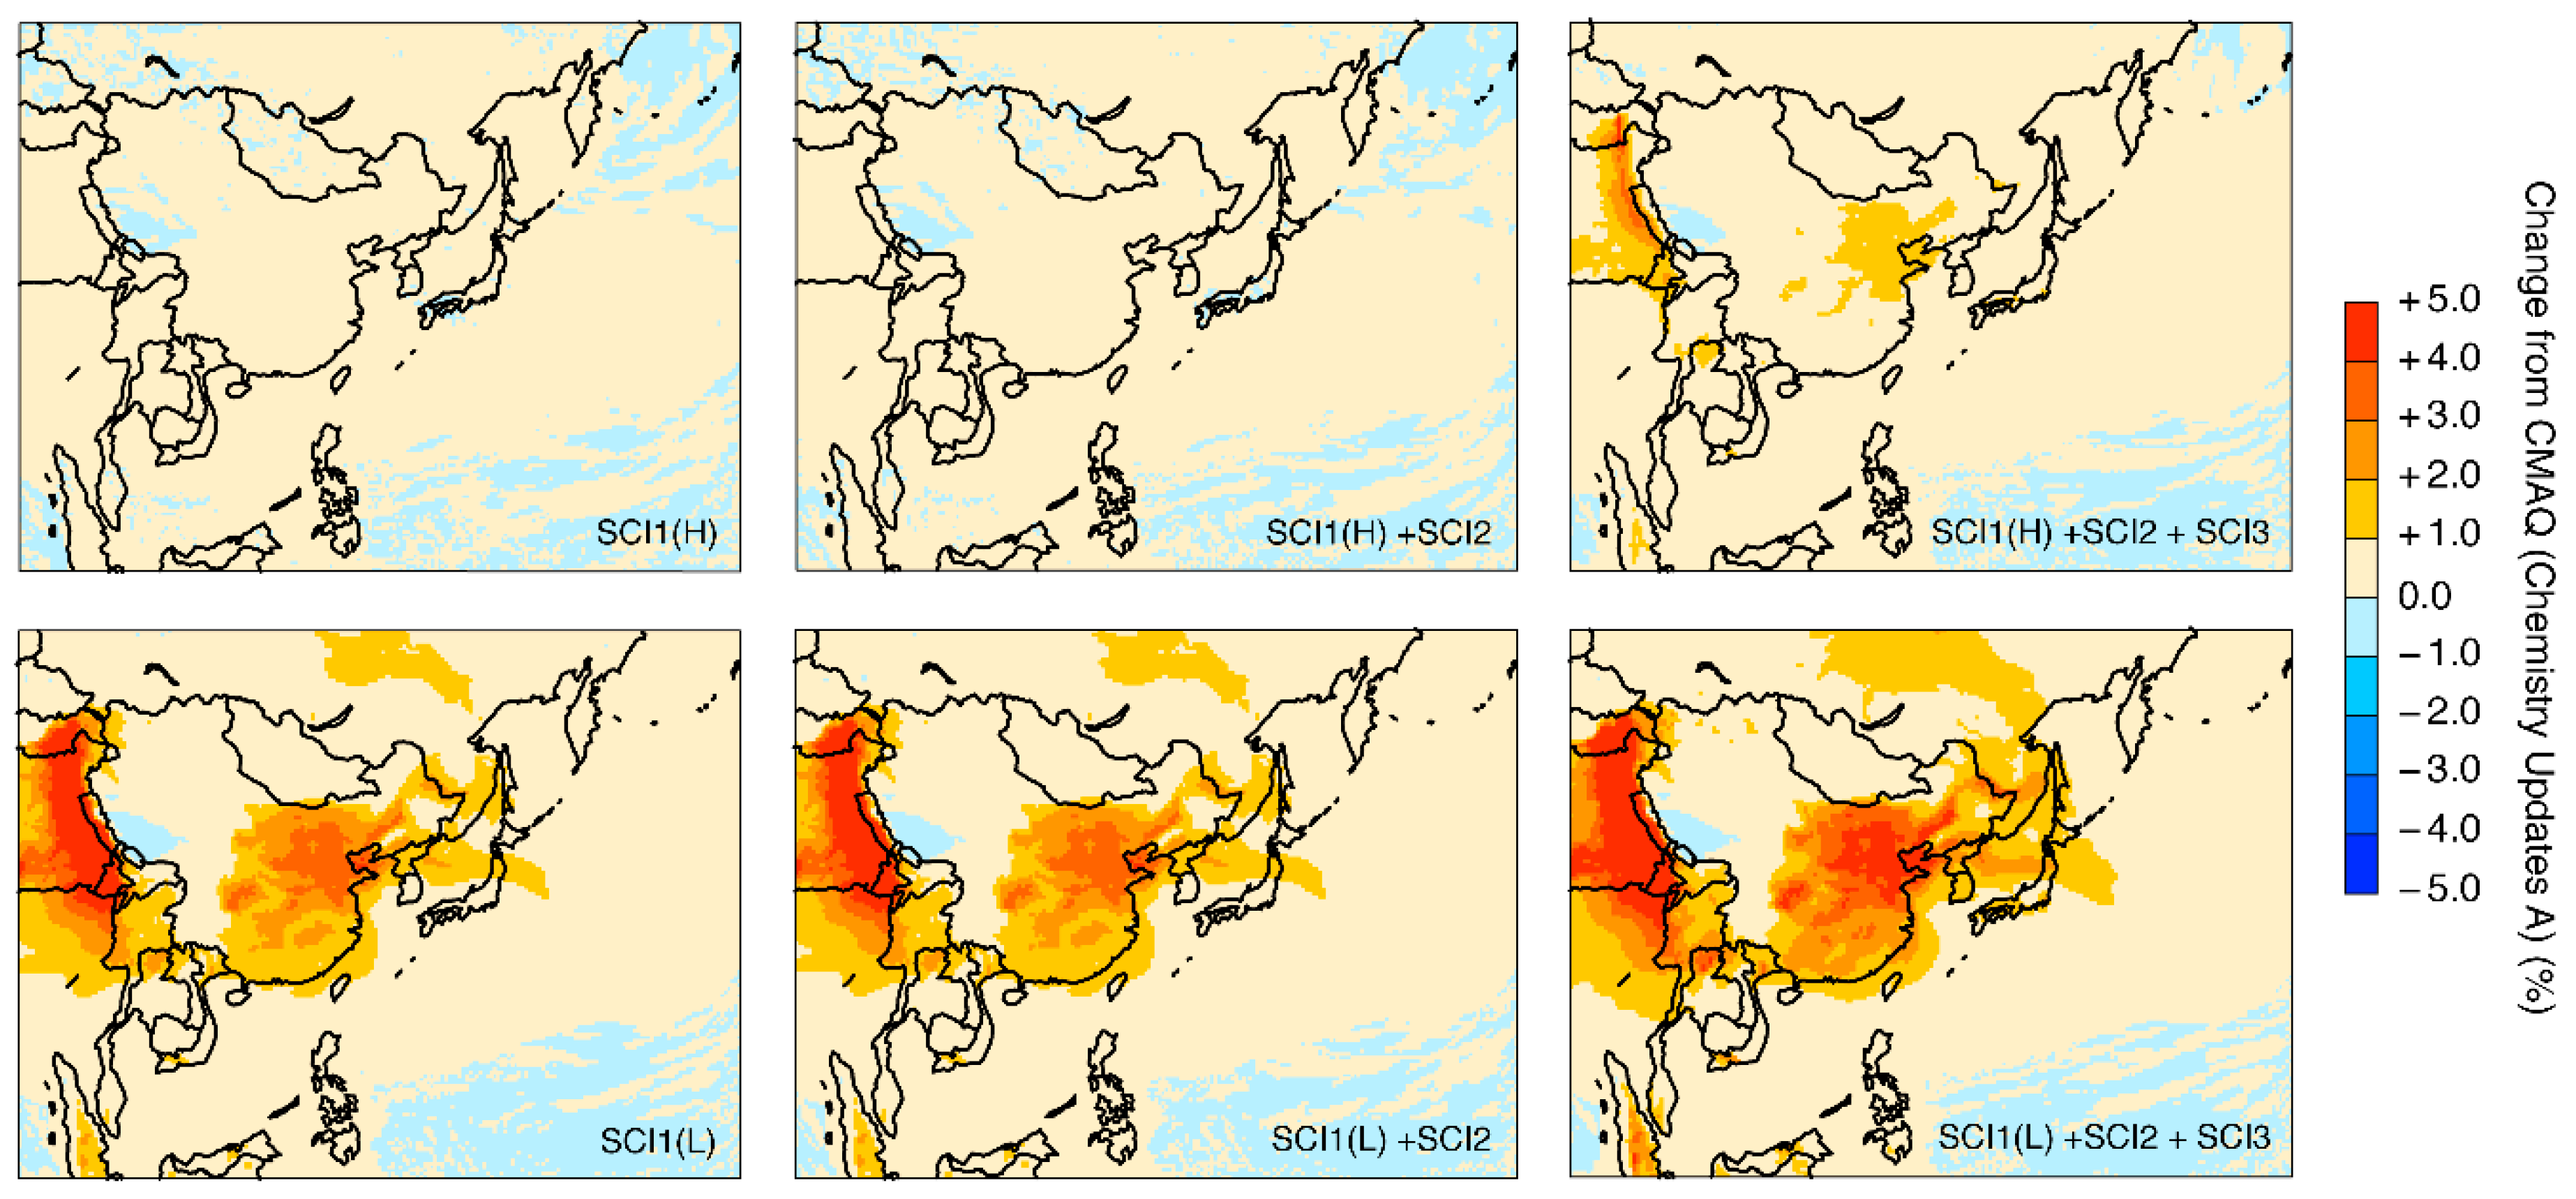
To investigate the effects of including the three SCI in the simulations, each SCI treated in this study was tested in an incremental manner. The results are shown in Figure 2 as the difference from the chemistry updates A. A total of six cases were tested: SCI1 with either a higher or lower rate constant for the reaction of SCI1 with H2O, SCI1 plus the addition of SCI2, and SCI1 plus SCI2 with the further inclusion of SCI3. The increase in SO42– production that occurred with the inclusion of SCI1 was not found in the simulation with the higher rate constant for SCI1 + H2O but was clearly observed in the simulation with the lower rate constant over mainland China and toward the downwind region of northern Japan, over India and extending to the Bay of Bengal, Bangladesh, and Myanmar, and over some parts of Indonesia. The importance of the rate constant for H2O which can consume SCI1, as demonstrated over Asia in this study, was suggested in research conducted over the U.S.A. [25]. The addition of SCI2 did not cause an increase in SO42– concentrations and this may well reflect the fact that only two chemical reactions were involved in producing SCI2 whose stochastic coefficients were smaller than those for SCI1 (Table 1). The further inclusion of SCI3 led to an increase in SO42– concentrations in spite of the use of a higher or a lower rate constant for the reaction of SCI1 with H2O. Chemistry updates B showed a 1–2% increase in SO42– concentrations over mainland China and a 1–3% increase over Northern India, even when using a higher rate constant for SCI1 + H2O, and showed a greater than 5% increase in SO42– concentrations over mainland China and a 1–2% increase over the northern part of Japan and the Kansai and Kanto regions when a lower rate constant for SCI1+H2O was used. Through incremental testing of the three SCI, the importance of the value of the rate constants for SCI1 + H2O over Asia was demonstrated as was also revealed in the study over the U.S.A., and clearly indicates the need for distinct treatments of the individual SCI given that SCI3 has a potential impact on SO42– production independent of that for the rate constant of SCI1 with H2O.
From the incremental testing of SCI, we selected the case for SCI1 with the low rate constant with H2O, SCI2, and SCI3, hereafter referred to as chemistry updates B. The modeling domain for J-STREAM covered the whole of Japan as domain 2 and the Kanto region (including Tokyo) as domain 4. The simulated ambient SO42– concentrations and the wet deposition over domain 4 are shown in Figure 3. High ambient concentrations of SO42– were limited to the region over the Tokyo Bay area, and a large amount of wet deposition was found over the southwest areas of the Kanto region. With respect to chemistry updates A and B, the reason for the increase in ambient concentrations of SO42– was clarified, whereas changes in the rates of wet deposition for SO42– between chemistry updates A and B were not apparent when compared with that for ambient SO42– concentrations. As expected, the revision of the gas-phase oxidation pathways, which included the SCI, successfully led to only an increase in ambient SO42– concentrations. Using the KMT simulation, slight decreases in both the ambient SO42– concentrations and wet deposition were revealed over the Kanto region.
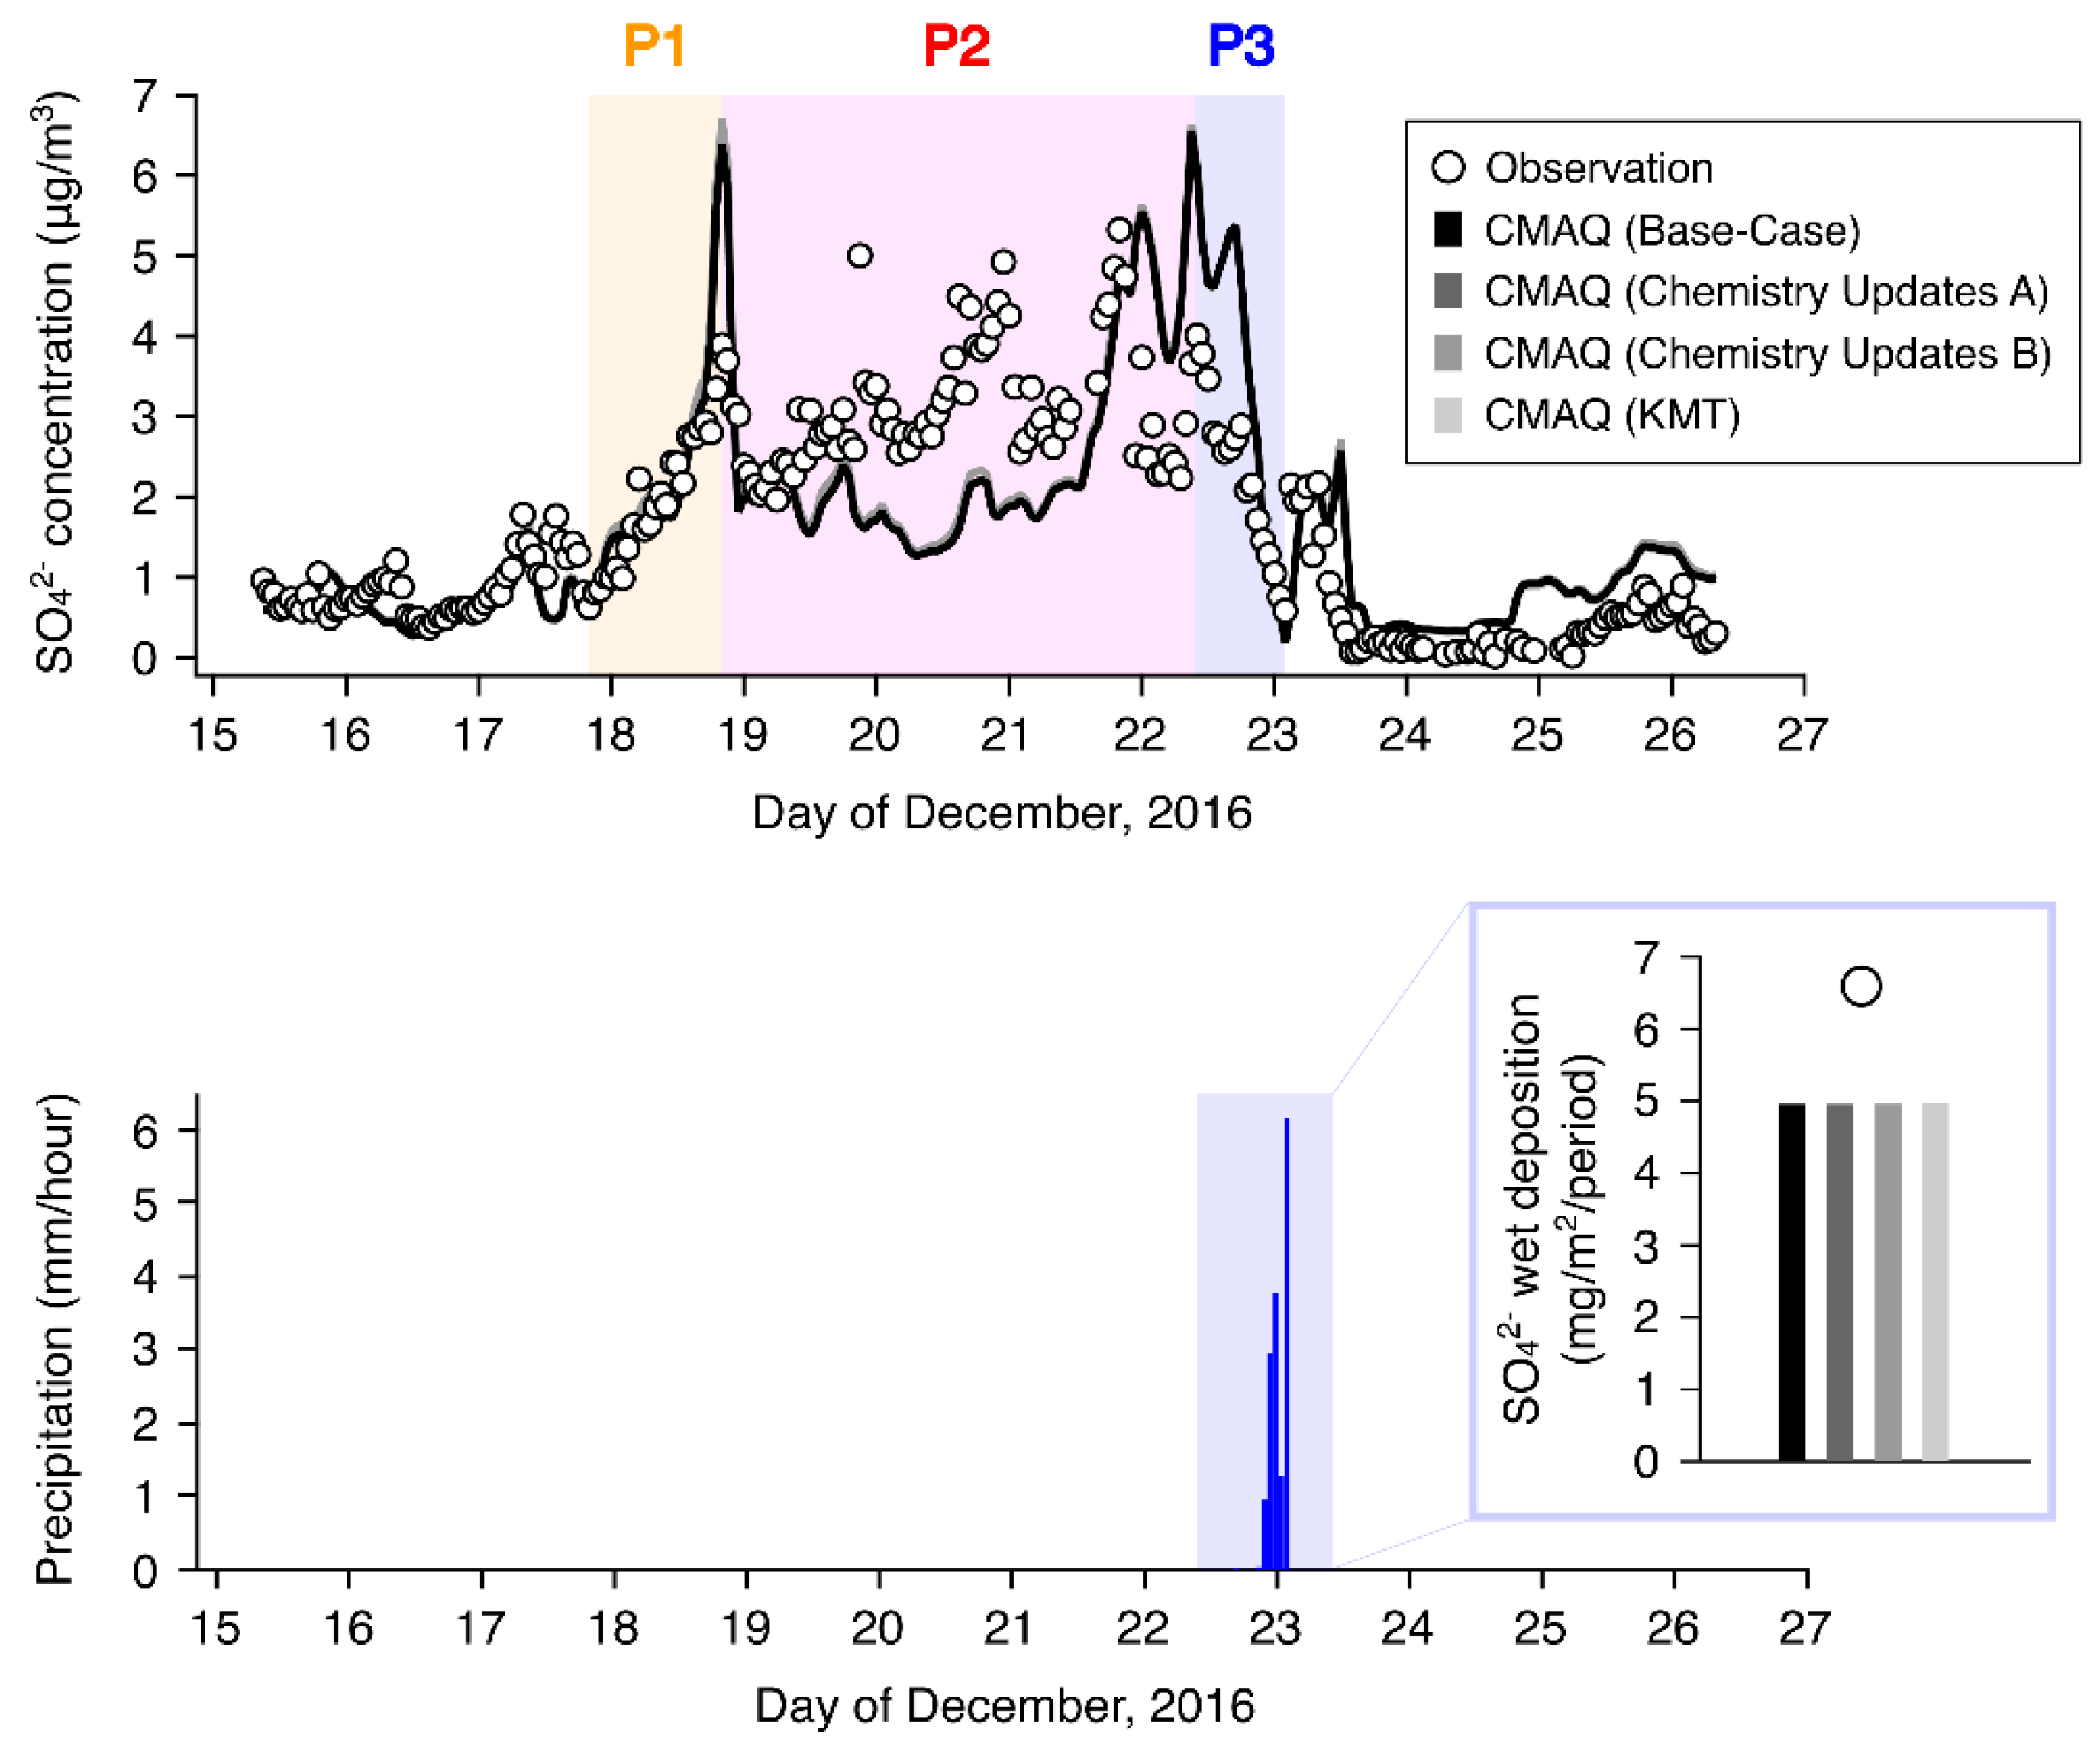
A detailed comparison with experimental observations was conducted using an aerosol chemical speciation analyzer (ACSA) automated monitoring system (Kimoto Electric, Co., Ltd., Osaka, Japan) at Mukoujima (139.81° E, 35.71° N) for hourly measurements of ambient concentrations of SO42– and the network observations from the Acid Deposition Monitoring Network in East Asia (EANET) at the Tokyo site (139.76° E, 35.69° N) for daily SO42– wet deposition (gray circle, Figure 3). This automated system for monitoring ambient concentrations of SO42– by ACSA has been evaluated in a previous study conducted in western Japan where the importance of high-resolution monitoring was demonstrated [35]. The wet deposition of aerosols was measured via the use of automated wet-only samplers and the concentration of SO42– in precipitation was determined by ion chromatography [36]. The time series of hourly observations and the CMAQ for ambient concentrations of SO42– are shown in Figure 4. The temporal variation of the observed ambient concentrations of SO42– gave the following variations during the analysis period: around 1 μg/m3 during 15–18 December; a subsequent increase from 0.6 μg/m3 to 3.9 μg/m3 within 1 day on 18 December; a consistently higher concentration of around 4 μg/m3 from 19 to 22 December; and a subsequent decrease from 3.8 μg/m3 to 0.6 μg/m3 within 1 day on 22 December. All of the four CMAQ simulations generally mimicked the observed temporal variations. A detailed discussion of model performance based on statistical analysis is presented later. The hourly precipitation data for the four models and the daily accumulated SO42– wet deposition by experimental observation at the Tokyo site over the campaign period is presented in Figure 4. From this data, it is possible to define an increasing SO42– concentration period (P1), a relatively stable period (P2), and a decreasing period (P3). From the modeled hourly precipitation results, P3 clearly corresponded to a rainy day. Over Tokyo, there was no observed rain except in the P3 period and this was also shown by the model. The EANET observation at the Tokyo site was conducted on a daily basis (from 9 a.m. to 9 a.m. the next day); the accumulated precipitation during 22–23 December was 15.5 mm, and the modeled result was 15.2 mm. Wet deposition was only observed and modeled during P3; the accumulated observed and modeled SO42– wet deposition data were 6.6 mg/m2 and 5.0 mg/m2, respectively. The four simulations by CMAQ did not show much difference in wet deposition.
For a comparison of the ambient concentrations of SO42–, the model performance was judged according to the statistical analysis data, namely, the correlation coefficient (R) with the significance level determined by the Students’ t-test, the normalized mean bias (NMB), the normalized mean error (NME), the mean fractional bias (MFB) and the mean fractional error (MFE). In line with the recommended benchmarks based on the modeling study over the U.S.A., the proposed model performance goals were NMB < ±10%, NME < +35%, and R > 0.70 for the best model performance, and the proposed model performance criteria were NMB < ±30%, NME < +50%, and R > 0.40 for acceptable model performance for the daily SO42– concentration levels [37]. The model performance goals were also proposed as MFB ±30% with MFE +50% for the best model performance, and model performance criteria were proposed as MFB ±60% with MFE +75% for acceptable model performance [38]. In addition, the corresponding percentages of the performance terms (within a factor of 2 and 3) were also calculated. The results for statistical analysis are listed in Table 3.
Compared with the hourly SO42– observations observed at Tokyo, all of CMAQ models showed R values of around 0.7 with a statistical significance level of p < 0.001. As shown in Figure 1 and Figure 2, chemistry updates A and B led to an increase in SO42– concentrations whereas KMT led to a slight decrease in SO42– concentrations. As seen in Figure 4, the differences by KMT were not clarified in hourly time scale in this case applied for the winter pollution episode at Tokyo. Judging from the proposed criteria [37,38], all four CMAQ model simulations were considered to have met the model performance criteria.
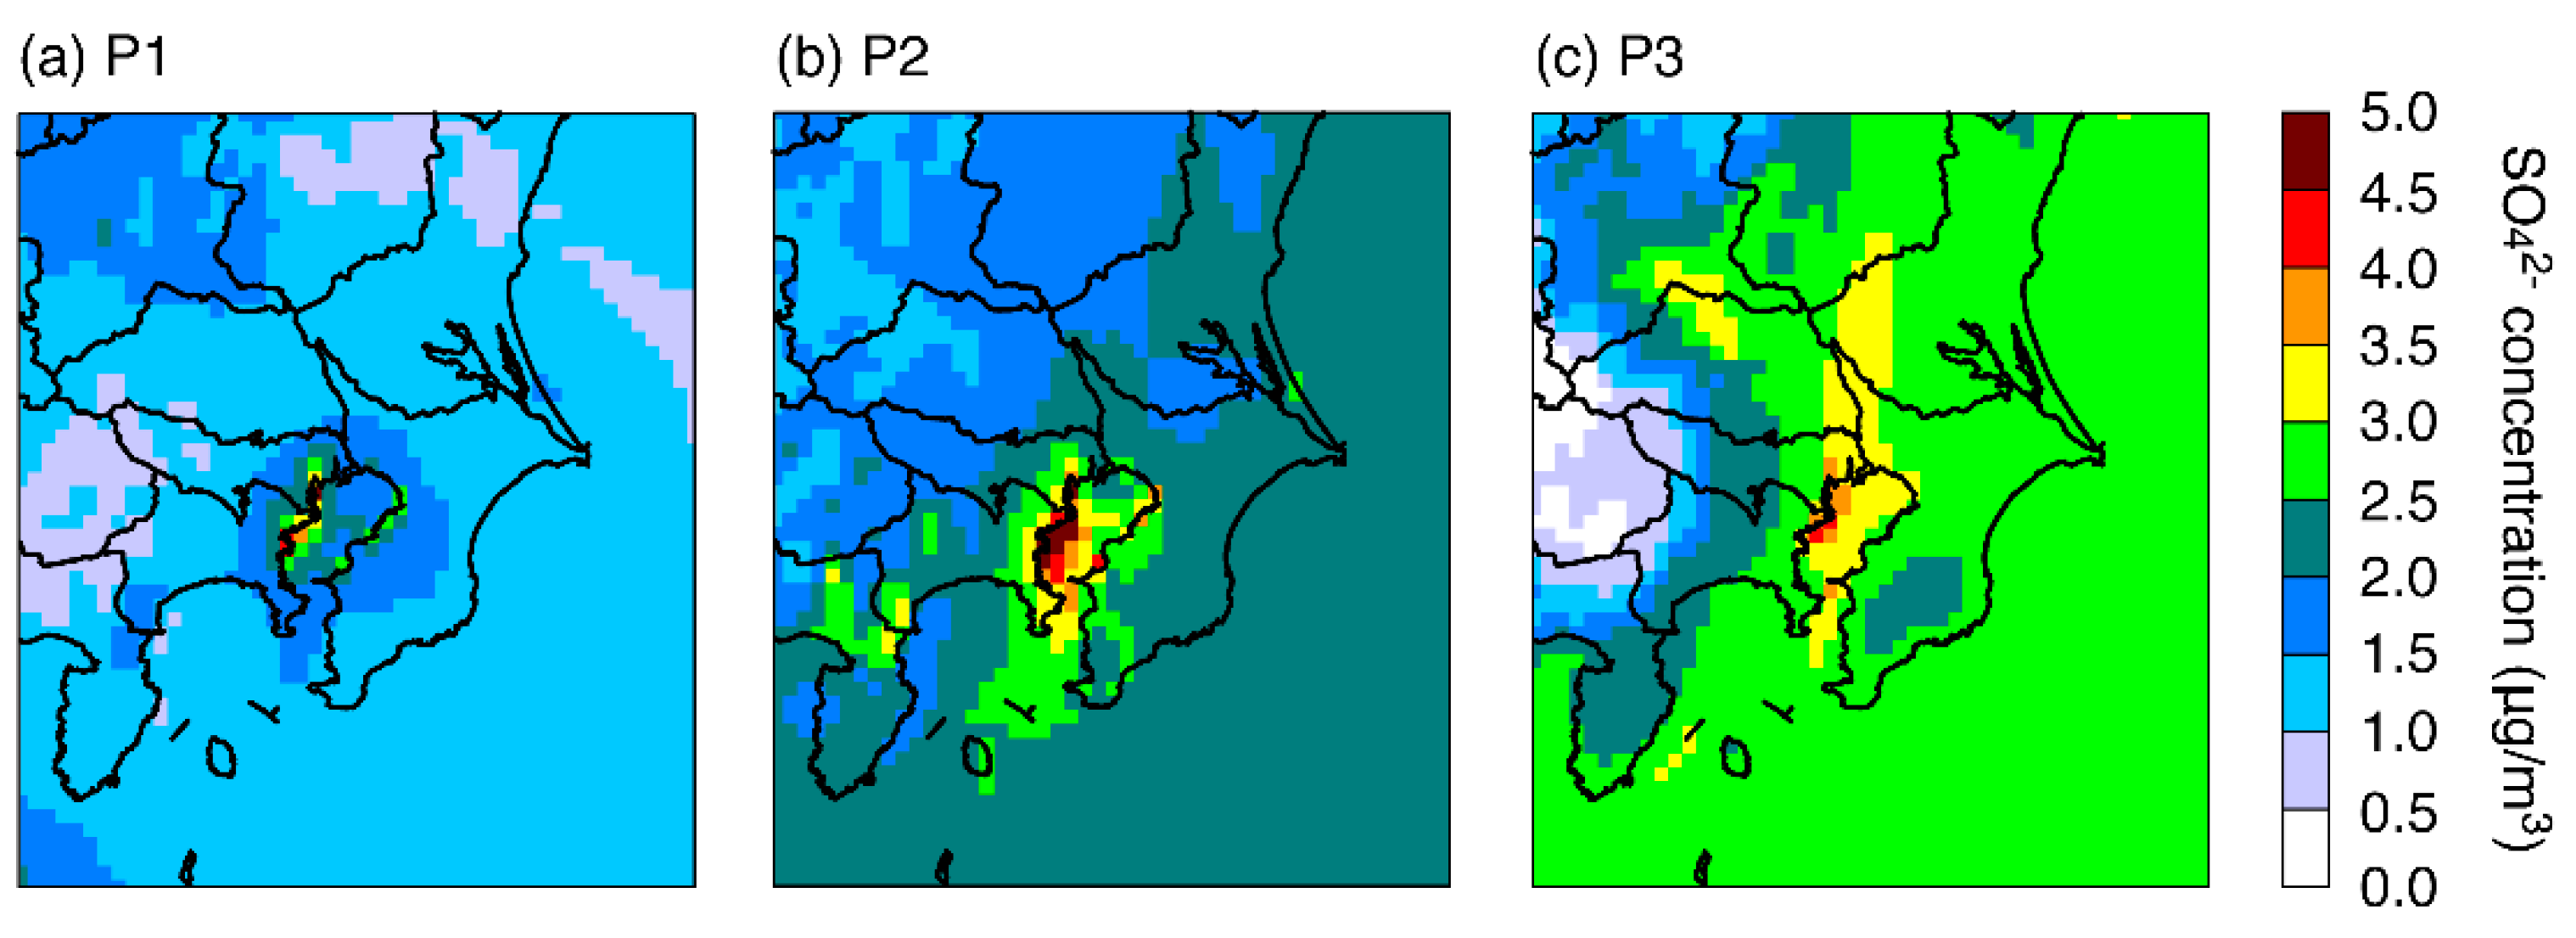
The spatial distributions of SO42– concentrations during the periods P1, P2, and P3 are displayed in Figure 5. The diagram indicates that the region with high SO42– concentrations greater than 2.0 μg/m3 in P1 was limited to near the coastline of Tokyo Bay, whereas other areas were below 2.0 μg/m3 on average. It can be considered that the increased SO42– concentrations indicated in Figure 3 were not associated with the broad feature spread over the Kanto region but with the limited haze episode over Tokyo. For P2, the high SO42– concentration regions expanded over the Tokyo Bay area, and nearly the whole of Eastern Kanto (the eastern part of this domain) was covered with high concentrations of SO42– of around 2.0–2.5 μg/m3 (dark green color). For P3, the high SO42– concentrations found over the Tokyo Bay area extended into the northern part of this domain, while the western boundary had lower concentrations of less than 0.5 μg/m3. The decreased concentrations of SO42– indicated in Figure 3 would have been be influenced by the intrusion of this low concentration zone. To clarify the reasons for this, a sensitivity analysis against the major domestic sources was conducted.

3.2. Model Sensitivities

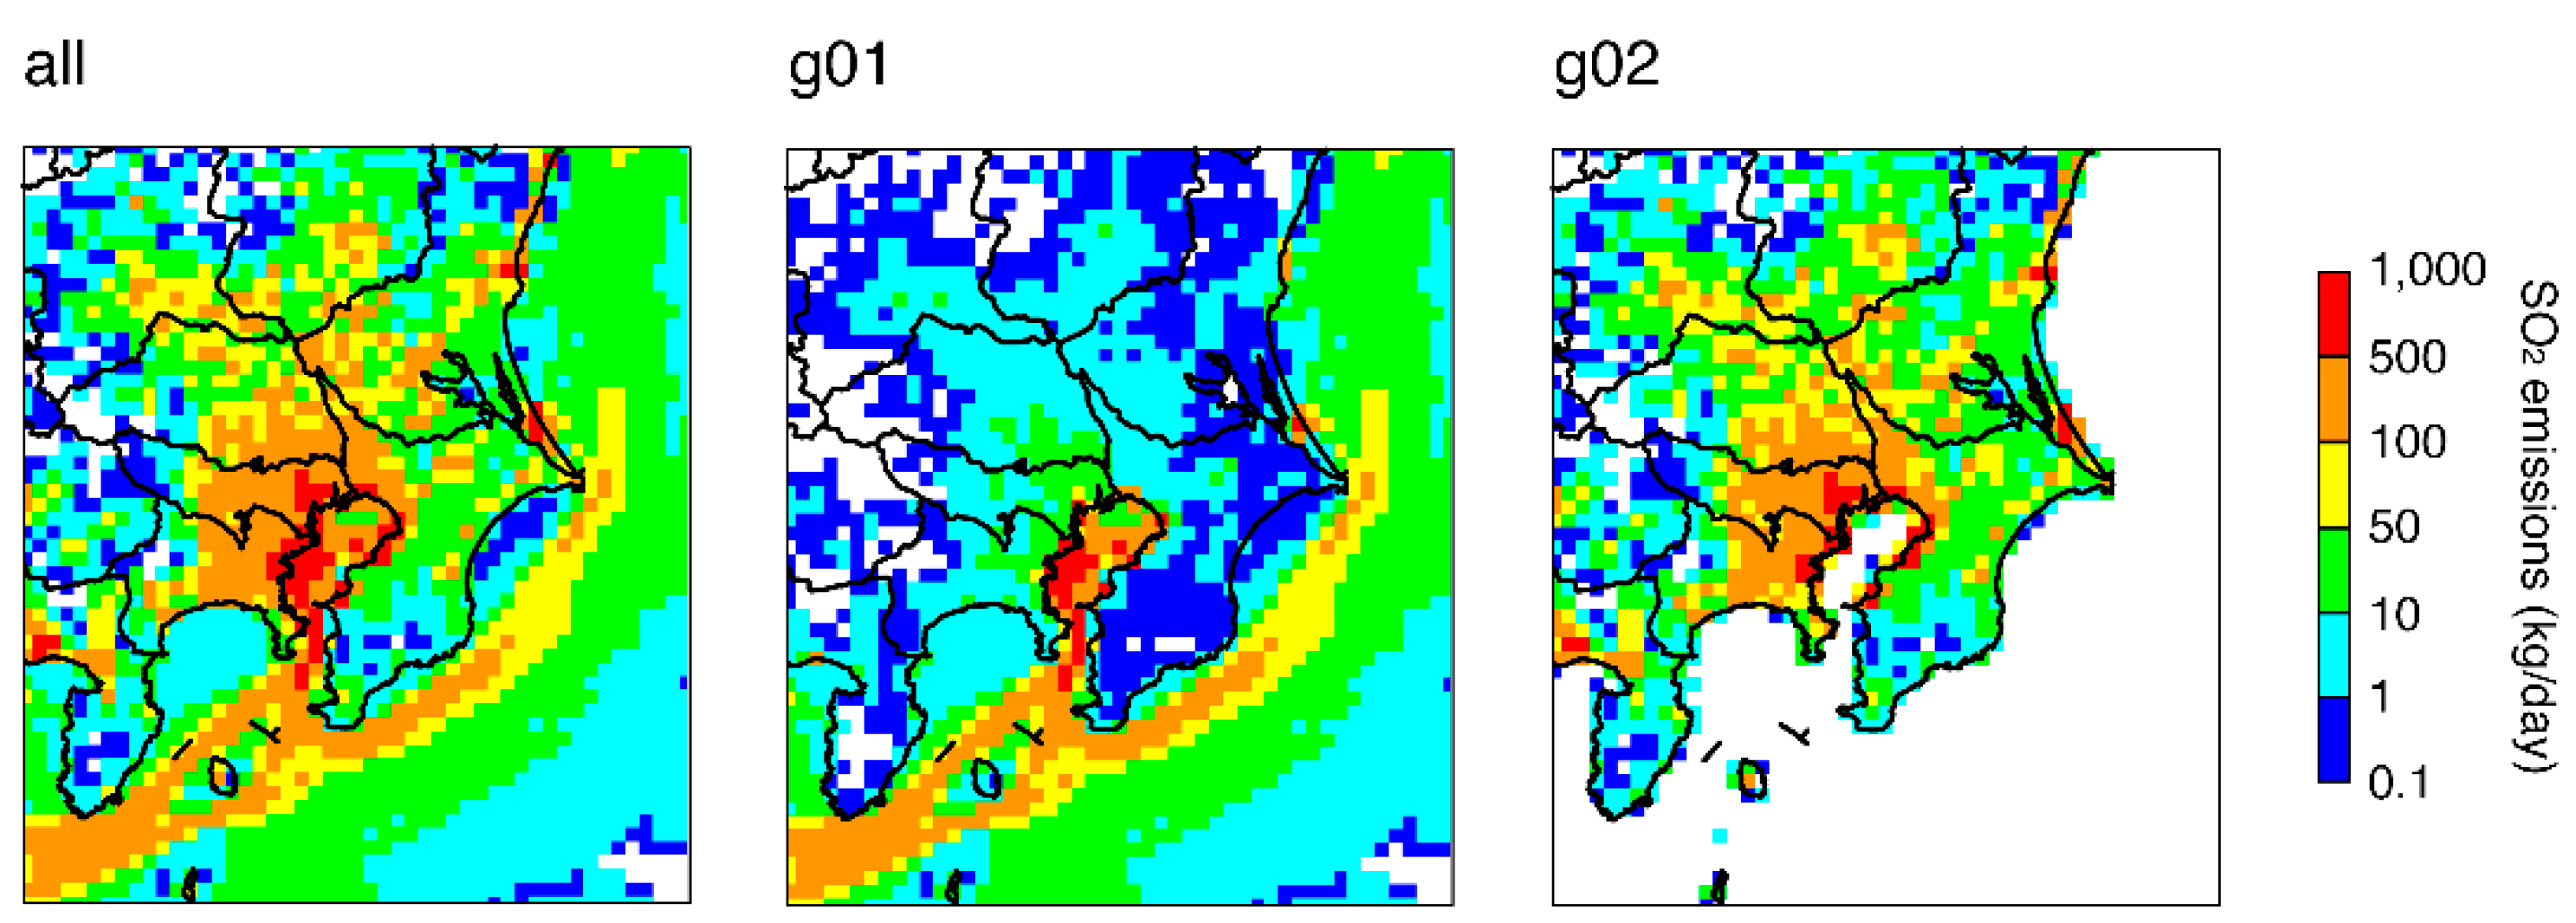
Here, the sensitivities for major domestic sources were investigated. Four major domestic sources, transportation (automobile, ship, aviation, and machinery), stationary combustion (power plant, industry, waste incinerator), fugitive VOC (fuel evaporation, and solvent use), and agricultural NH3 (livestock, and fertilizer application). These source groups were numbered g01, g02, g03, and g04, respectively. The SO2 emissions over domain 4 used in the simulation are shown in Figure 6 as the daily average distributed in two dimensions. High emission levels greater than 500 kg/day were found over the Tokyo Bay area and values greater than 100 kg/day were broadly observed over the central Kanto region and over the ocean. In the sensitivity analysis, SO2 emissions were contained in g01 and g02 but not in g03 and g04. The emissions from g01 and g02 are also illustrated in Figure 5. It can be clearly seen that SO2 emissions over the sea were dominated by g01 reflecting ship emissions as being the main source and that emissions over the land were dominated by g02. In this respect, the SO2 emissions from power plants and industries are mostly centered along the coastline; as a result, SO2 emissions in the Kanto region were densely concentrated over the Tokyo Bay area.
To obtain the sensitivity values, the traditional so-called “brute force” method was applied. The emission from each source group was reduced by 20% and the simulation was conducted as a sensitivity simulation; next, the difference between the base-case simulation and the sensitivity simulation was calculated. In this study, this difference was multiplied by 5 to correspond to a 100% reduction; accordingly, the source contribution can be regarded as follows:
Source contribution of gi = (Base-case simulation − Sensitivity simulation for gi) × 5,
where i = 01, 02, 03, and 04 are the four source groups as defined above. The source contribution of other sources (except the four domestic anthropogenic emissions), such as anthropogenic emissions from outside of Japan, biogenic emissions, biomass burning emissions, and volcanic emissions, are calculated as follows:
Source   contribution   of   others = Base case   simulation i = 01 04 Source   contribution   of   g i .
A perturbation magnitude of 20% was applied to achieve a compromise between producing a clear signal and applying a sufficiently small perturbation to allow the results to be scaled linearly to a different perturbation level according to the Task Force on Hemispheric Transport of Air Pollution (TF HTAP) modeling [39]. In this study, we focused on four domestic sources and conducted a total of four cases of CMAQ sensitivity simulations on the base-case simulation. In addition to this base-case simulation and the four sensitivity simulations, three other simulations for the chemistry updates A, B, and KMT were also performed against the four emission source groups; as a result, a total of 16 additional simulations (4 source groups × 4 simulation cases) were conducted over domain 4.
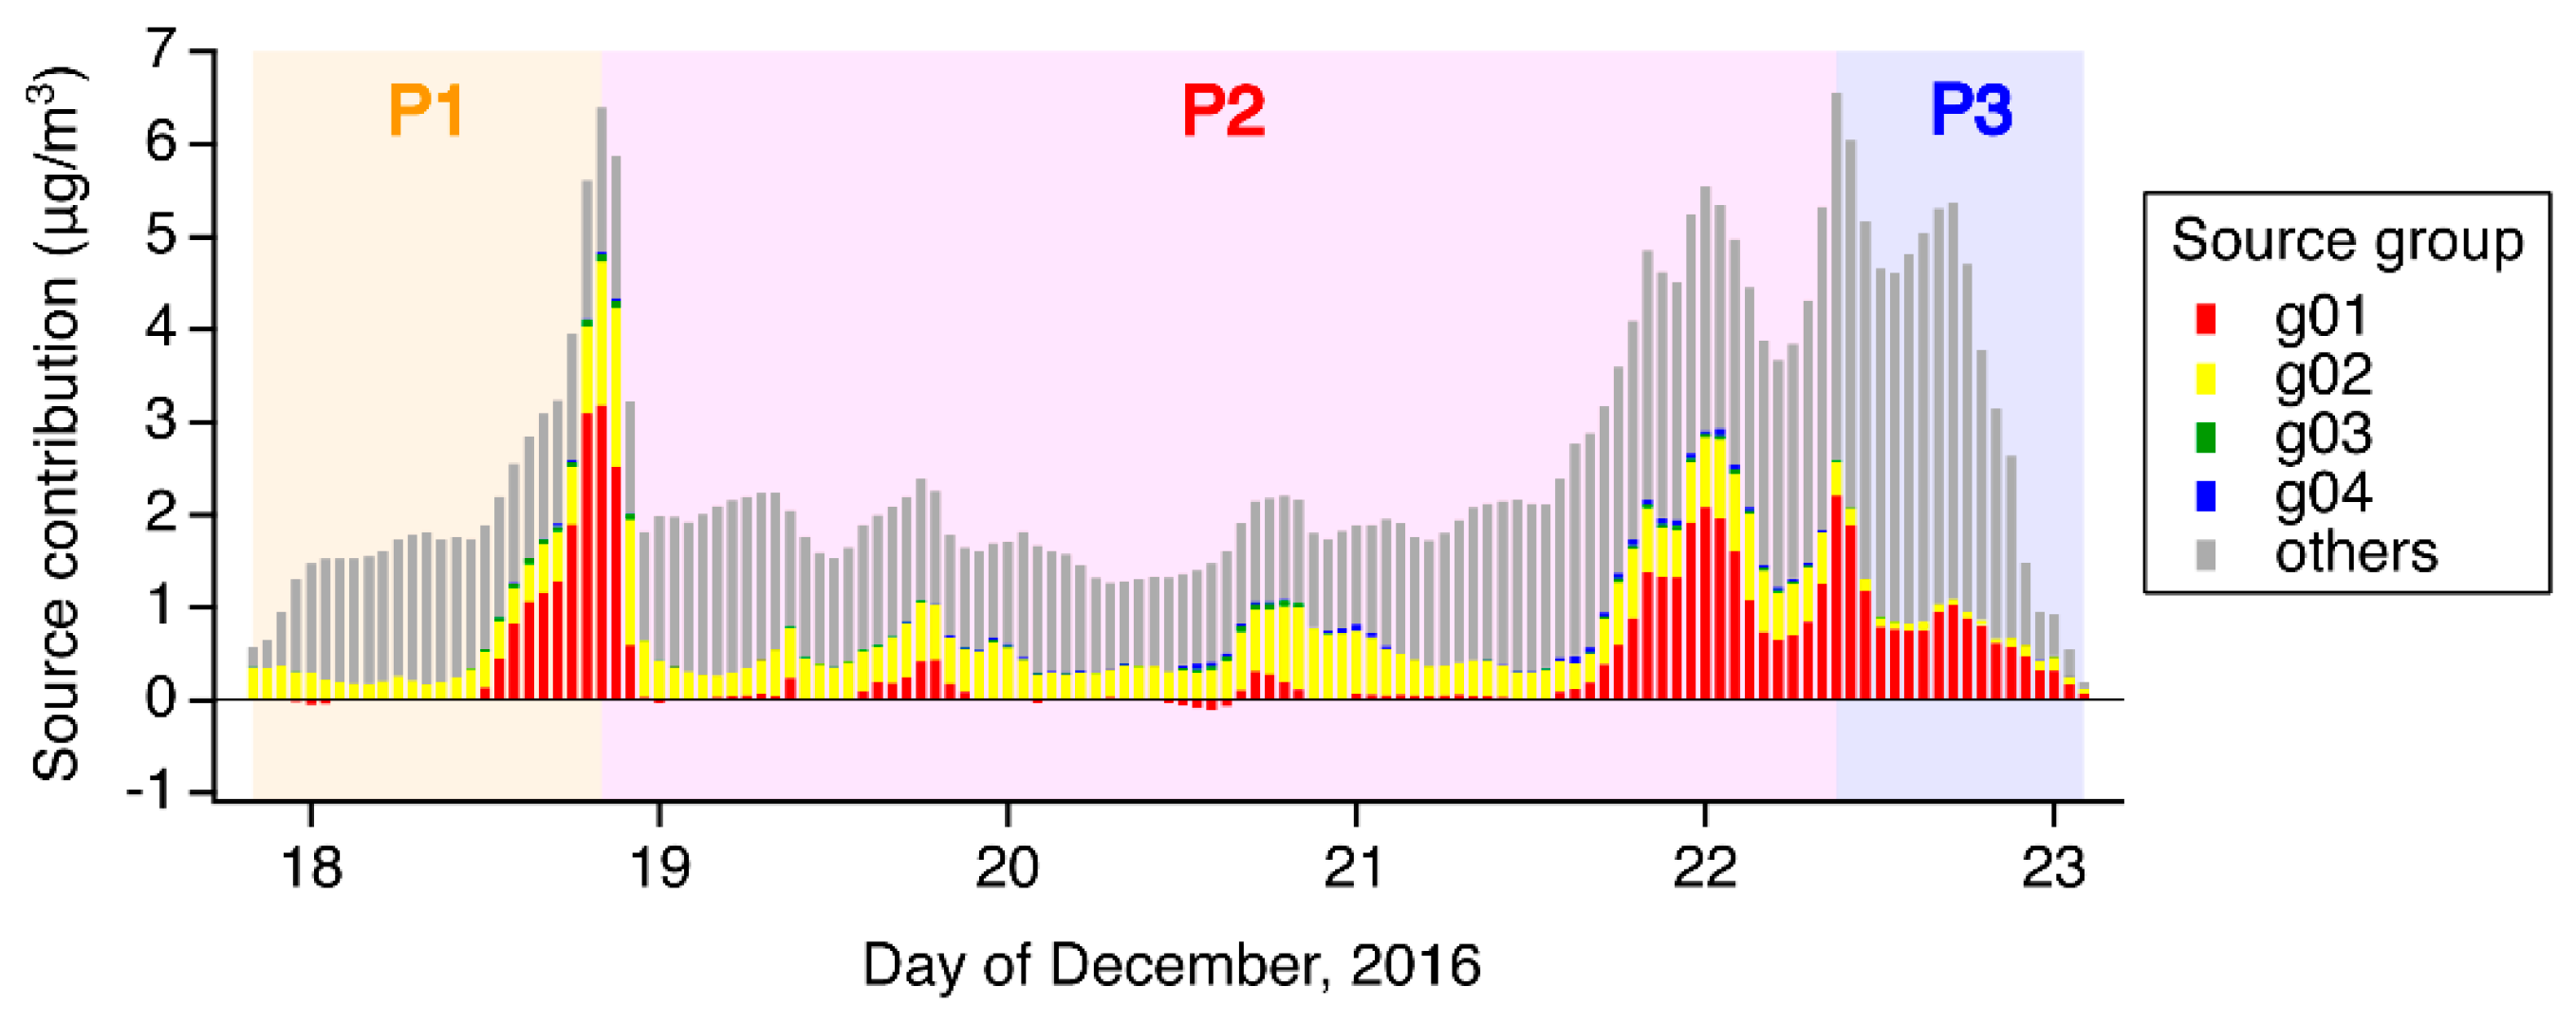
The temporal variations of source contributions during P1, P2, and P3 are shown in Figure 7, which gives an overview of source characteristics at the Tokyo site; this figure is based on the CMAQ base-case simulation. The first part of P1 was dominated by contributions from other sources but the latter part, when an increased SO42– concentration was revealed, was dominated by domestic sources of g01. Subsequently, P2 was dominated mainly by the contributions from other sources, and the contribution from g02 was the second largest factor. The contribution from g01 was small. During the latter part of P2, where there was an increase in SO42– concentration, the contribution from g01 was again observed. The period P3 was illustrated by declining contributions of other sources and g01, and the source contribution from g02 was negligible during P3. Throughout the entire period, source contributions from g03 and g04 were small because the g03 and g04 sources did not include SO2 emissions.
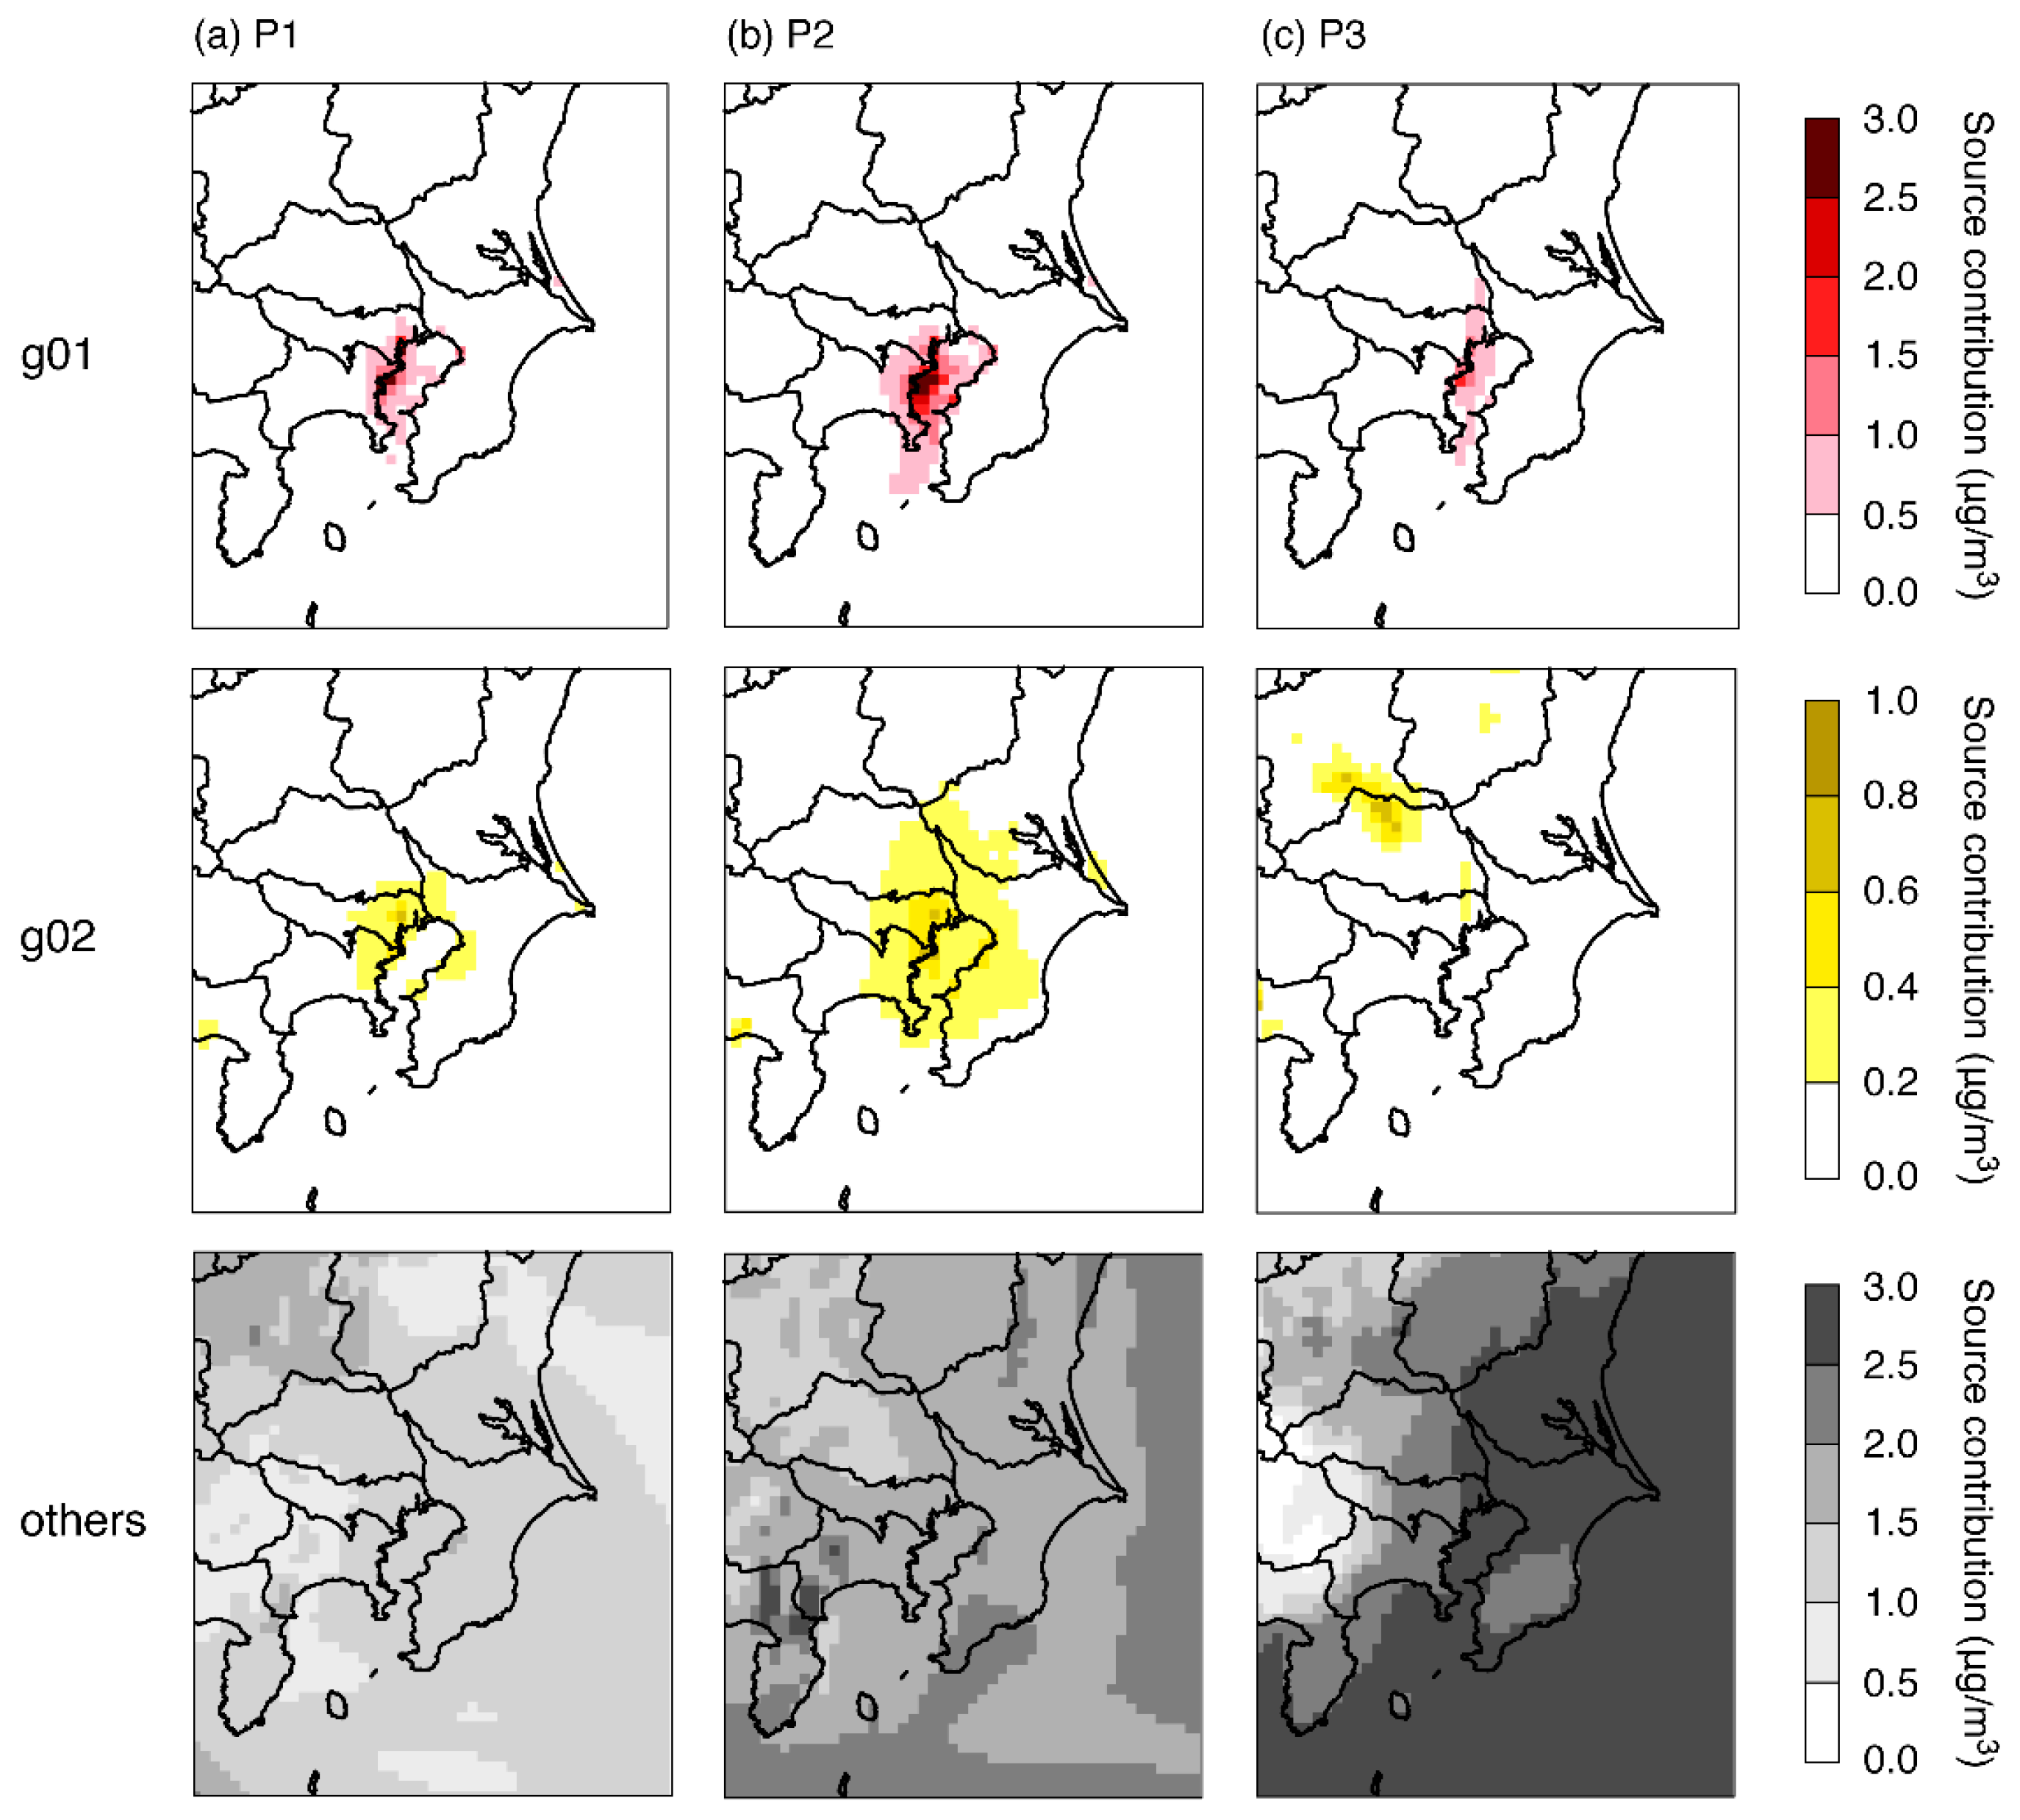
The spatial distributions of g01, g02, and other sources calculated in the CMAQ base-case simulation, shown in Figure 8, are based on the averages of data over P1, P2, and P3. During P1, the source contributions of g01 and g02 were limited over the Tokyo Bay area, and the source contributions of other sources, which were spread over the whole domain, were less than 2.0 μg/m3 on average. These spatial distribution patterns for the source contributions were well understandable in terms of the simulated SO42– concentrations shown in Figure 5. This clearly indicated that the high concentrations of SO42–, which were greater than 2.0 μg/m3 and limited to the coastline of Tokyo Bay, were due to the domestic contributions of g01 and g02. The impacts by domestic sources of g01 and g02 were spread over the Tokyo Bay area during P2, and the source contribution of g01 extended to the north during P3, whereas that of g02 was transported further into the northwestern area. The transportation of the source contribution of g02 in a northwestern direction may reflect a vertical emission distribution. Throughout P2 and P3, the source contributions of other sources were found over the whole domain. Therefore, it can be concluded that the simulated SO42– concentrations over the Kanto region were generally dominated by the source contribution of others and the higher concentrations of SO42– seen at the Tokyo observation site were attributed to the domestic sources of g01 and g02, which had limited impact around the Tokyo Bay area.
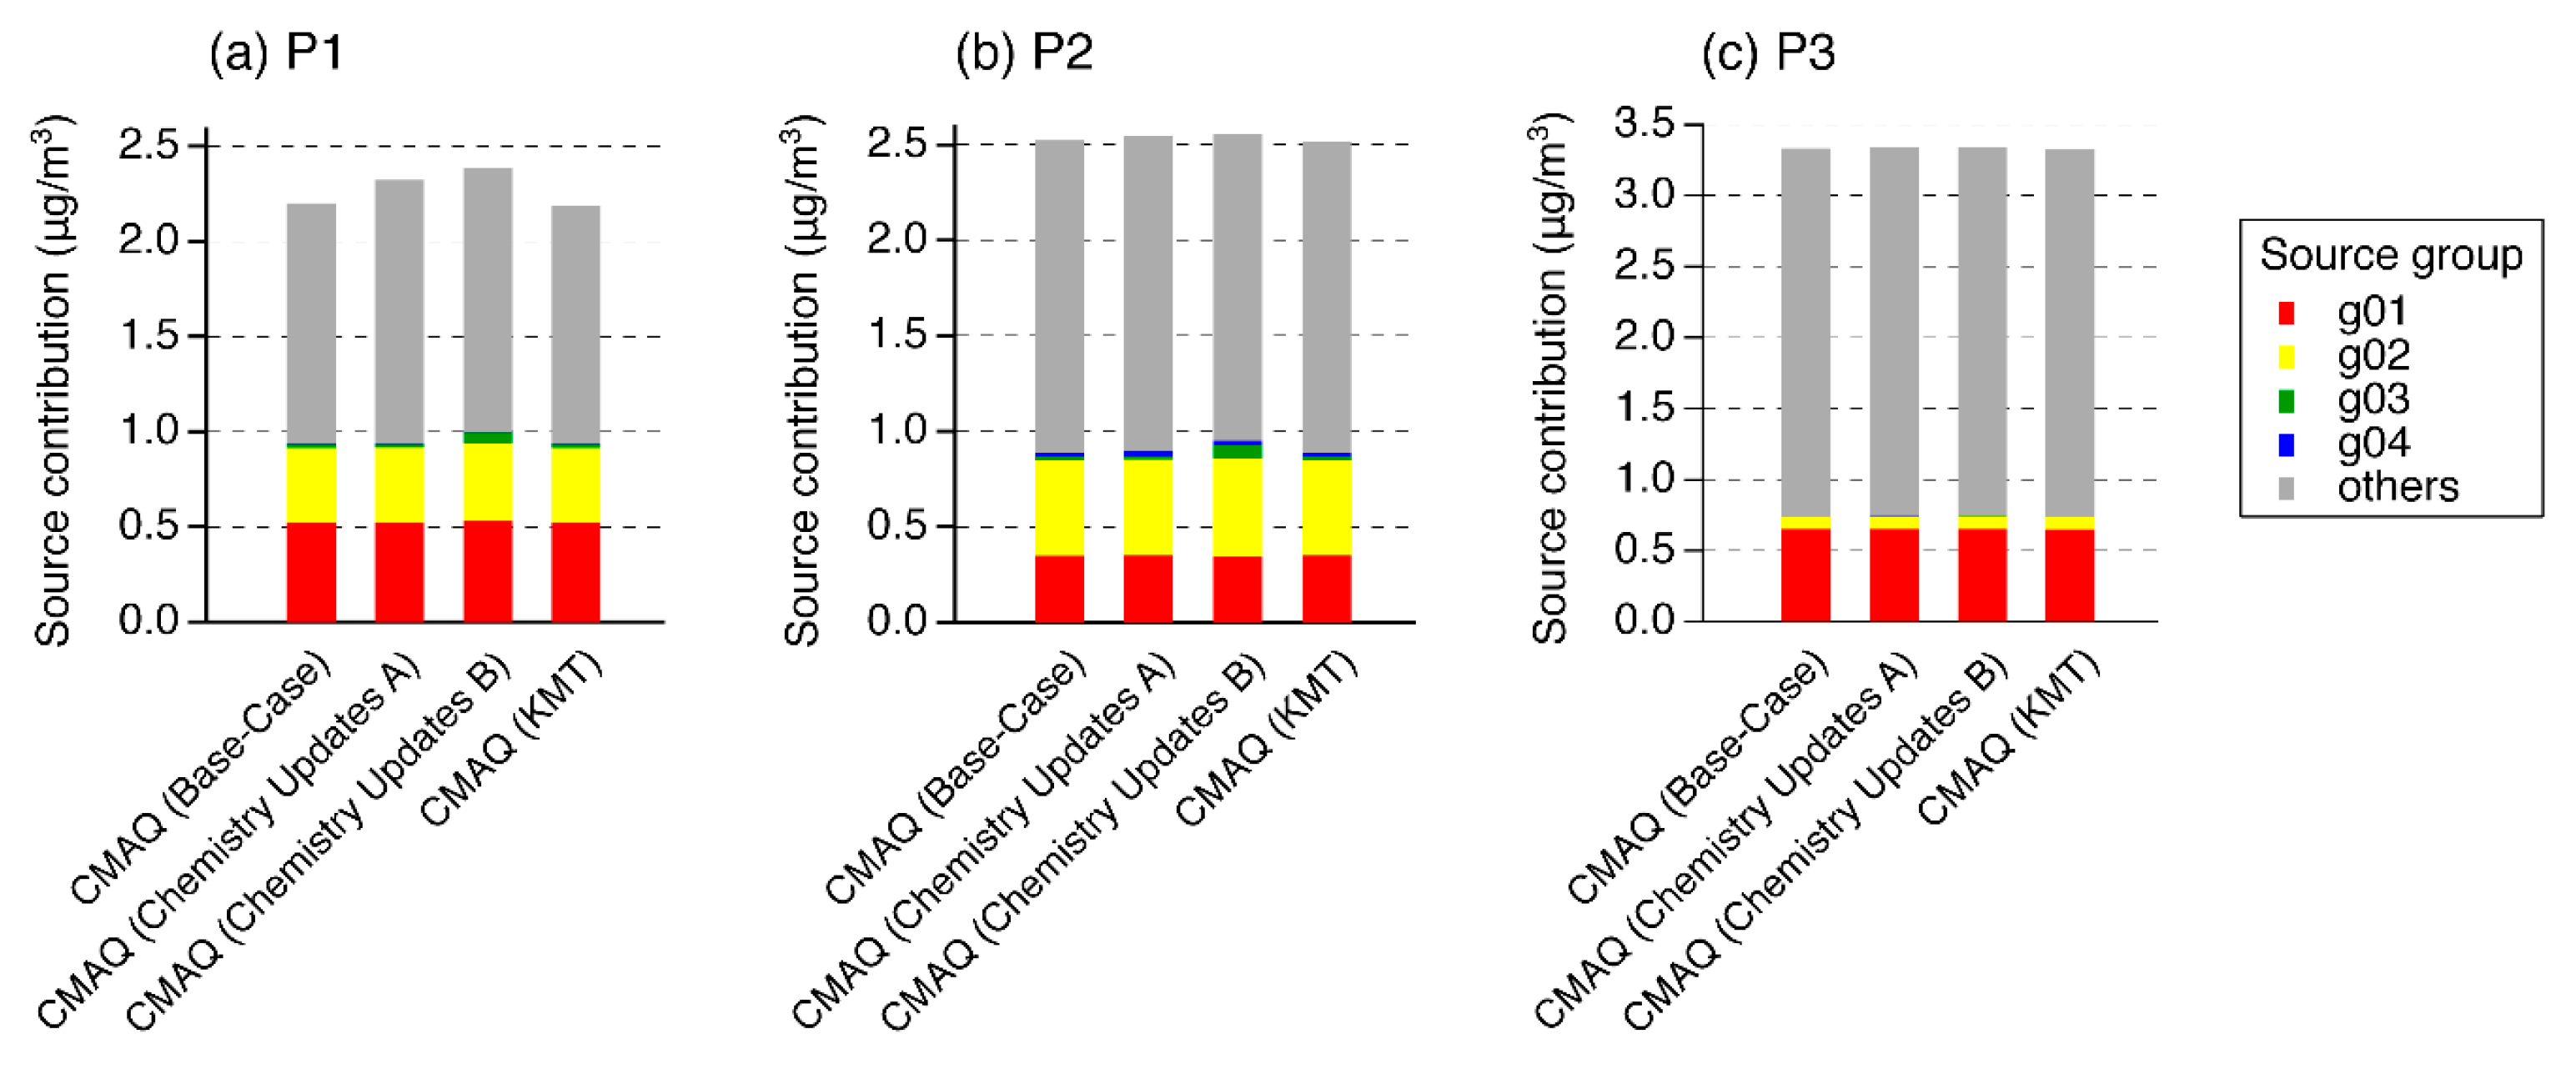
The similarities and differences of the source contributions conducted through the CMAQ base-case simulation and chemistry updates A, B, and KMT are summarized in Figure 9. The similarity of source contributions calculated by the CMAQ base-case simulation and the CMAQ KMT simulation are indicated for P1, P2, and P3. As revealed by the statistical analysis data listed in Table 3, this similarity was due to the similarity in model performances between the base-case simulation and KMT. Differences were found for chemistry updates A and B, and the magnitude of the differences was distinguishable during P1 compared with P2 and P3. Chemistry updates A, which was revised to enhance aqueous-phase oxidations, led to an increase in the source contribution of other sources. This result was also found in our previous study on the second phase of J-STREAM [4]. The aqueous-phase reactions considered were a refinement of the Fe- and Mn-catalyzed reactions and an additional NO2 oxidation pathway; in this context, the concentrations of Fe, Mn, and NO2 in Japan were much lower than those over Asia, thus the domestic source contributions were not enhanced. The approach taken in x was important for capturing the impact of transboundary air pollution.
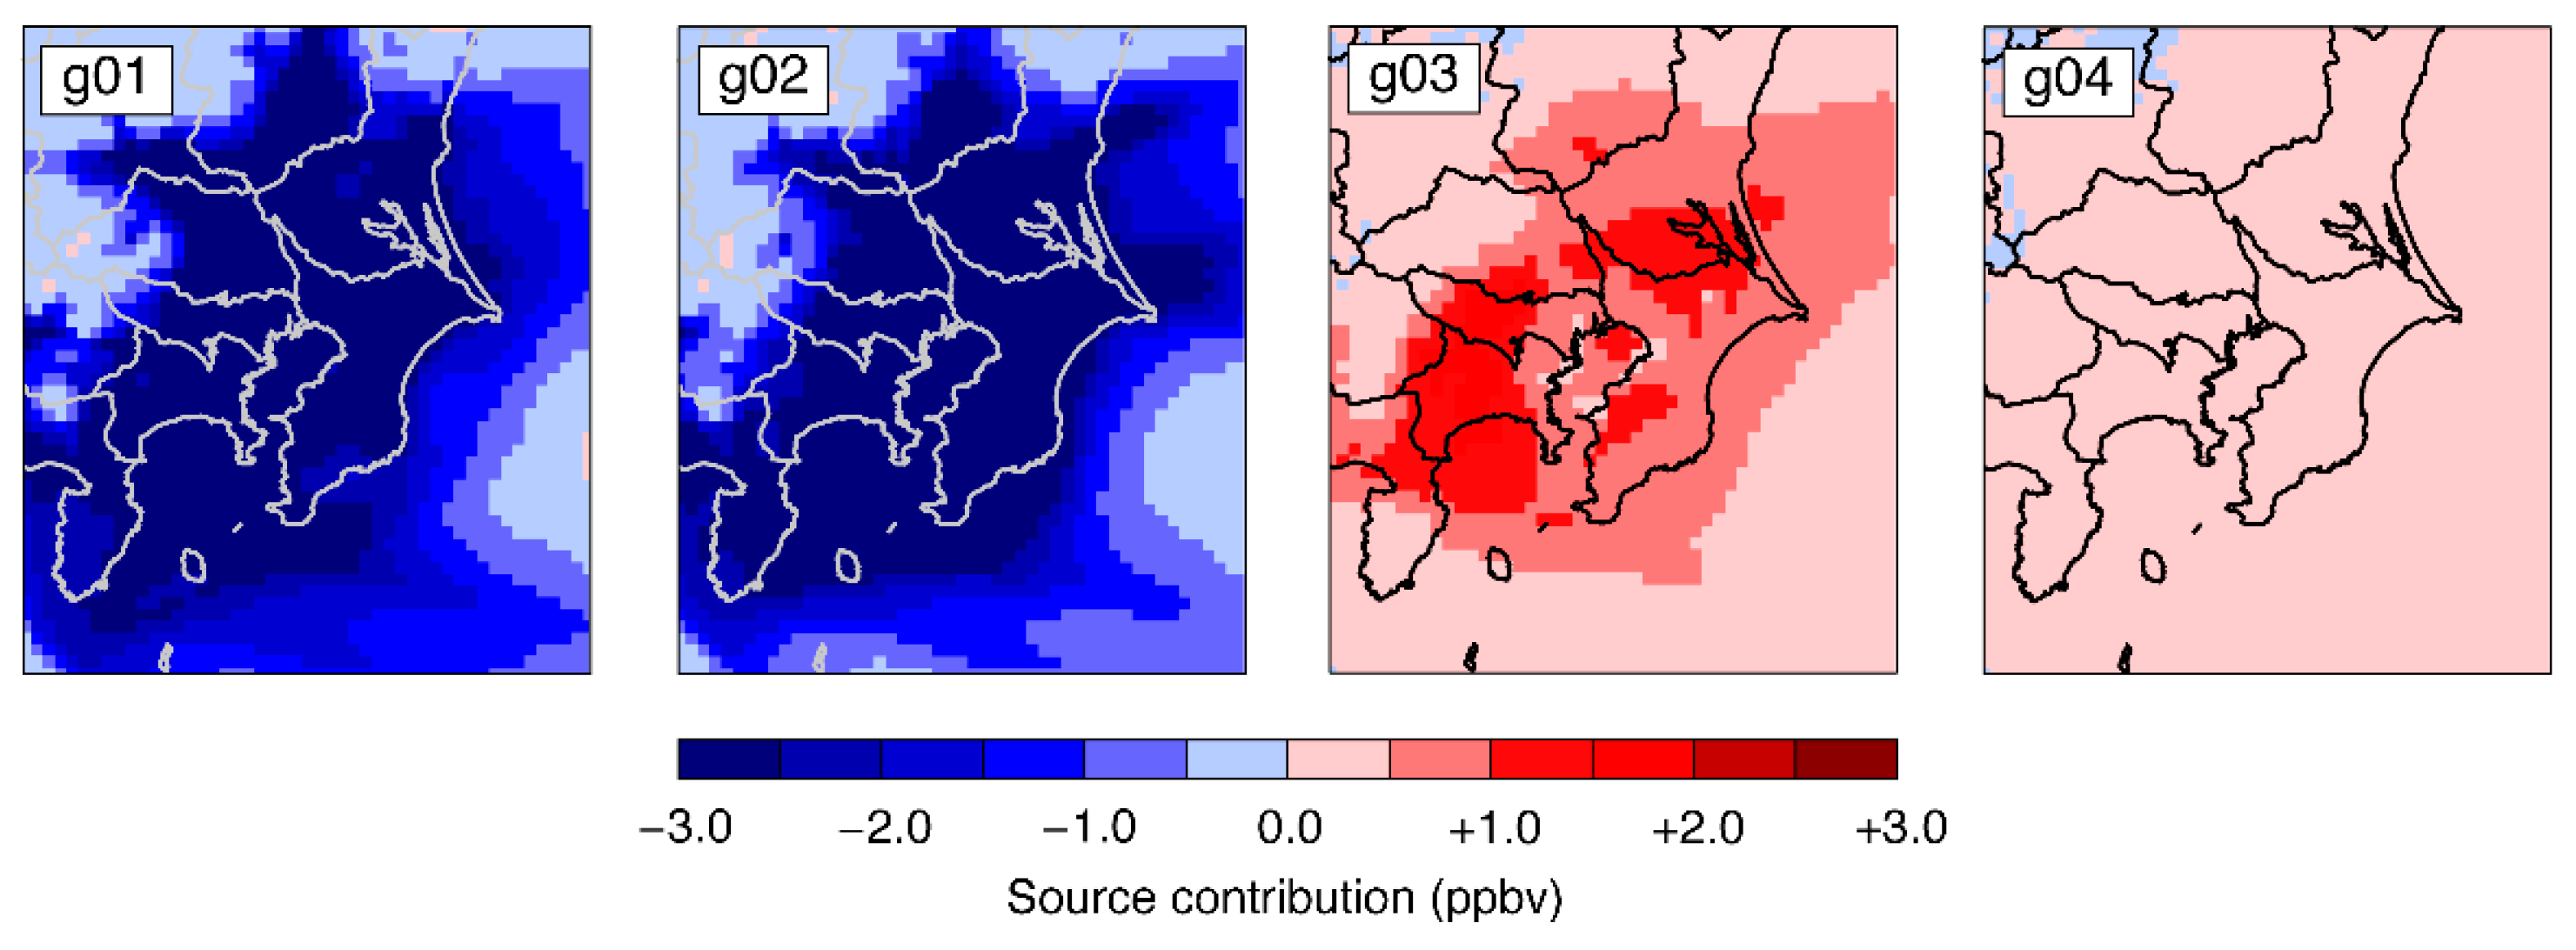
Chemistry updates B, which included three SCI species, led to an increase in the source contributions of g03. For other simulations, there was negligible impact by g03; however, the source contribution of g03 was found in chemistry updates B, especially during P1. The source group g03 is a domestic fugitive VOC source and did not contain SO2 emissions directly related to SO42– production. This is because a change in the O3 concentration. The source contributions of g01, g02, g03, and g04 on chemistry updates B during P1 are shown in Figure 10. The source contributions of g01 and g02 to the O3 concentration were negative. The sources g01 and g02 contain abundant NOx emissions and urban areas generally correspond to VOC-sensitive regimes during the winter [40], hence reflecting the NOx disbenefit effect. The source contribution of g03 was related to an increase in the O3 concentration, and this increment of the O3 concentration was further connected to the increase in the three SCI species as incorporated in this modeling study, and which yielded an increase in SO42– production. It was demonstrated that revision of the gas-phase SO42– oxidation via SCI can be connected to the source sensitivity of VOC sources via a change in the O3 concentration.

4. Conclusions

The Japanese air quality model intercomparison study, J-STREAM, has shown that although SO42– is generally well-captured by the models, concentrations of SO42– were underestimated during winter. In previous studies, the modeled SO42– concentrations were revised by focusing on the Fe- and Mn-catalyzed oxidation pathways and highlighting the importance of developing an emission inventory for trace metals over Asia in the first phase [3]. We further increased production of SO42– by the addition of an aqueous-phase NO2 oxidation pathway in the second phase [4]. To further improve the modeling performance of gas-phase oxidation, three SCI were incorporated in the third phase of J-STREAM and the KMT option available in the latest CMAQ model was examined. A difference between the KMT and the base-case simulation was found over the Sea of Okhotsk, and the absolute differences in SO42– concentrations were less than −0.1 μg/m3, giving essentially similar results with a test case for KMT over the U.S.A. Most previous studies have treated SCI in bulk; however, in this study, three SCI were treated separately with each SCI and incrementally tested and where the dependency of the rate constant of SCI1 with H2O was also examined by performing sensitivity simulations with a high and low rate constant. It was found that only when the lower rate constant for the SCI1 + H2O reaction was used that the production of SO42– was increased by SCI1, and the importance of the value of the rate constant of SCI1 with H2O for the Asian region was highlighted. This finding was consistent with a previous study conducted for the U.S.A. It was further demonstrated in the present study that the key role of SCI3 is to increase SO42– production because this reaction is independent of the rate constant of SCI1 with H2O. It was established that the explicit treatment of each SCI is required to enable clarification of the role of SCI on SO42– production.
In addition to the investigation of model performance, the third phase of J-STREAM included an intercomparison study on source sensitivities. Four major domestic sources (transportation, stationary combustion, fugitive VOC, and agricultural NH3) were investigated as source groups. The source sensitivities were estimated based on the traditional sensitivity simulation approach whereby a 20% emission reduction was calculated, the result of which was subtracted from the base-case simulation. It was clarified that the winter haze episode at the Tokyo site was generally dominated by emission sources from outside Japan, and the haze was enhanced by the domestic emission sources of transportation and fuel combustion. The estimations of source contributions were nearly the same between the base-case CMAQ simulation and KMT. With the chemistry updates involving the aqueous-phase Fe- and Mn-catalyzed oxidation reactions and NO2 oxidation, it was found that these revisions led to an increase in transboundary impacts. In the case of the chemistry updates with the inclusion of SCI, it was shown that the change to fugitive VOC emissions could impact SO42– concentrations by influencing O3 which in turn influences SCI.
As a result of conducting the first, second and third phases of J-STREAM, we have successfully demonstrated a means to enhance simulated SO42– production during the winter when underestimations of SO42– concentrations have been problematic. Given recent drastic reductions in SO2 emissions from China, further declines in SO42– can be expected, and reactive nitrogen will continue to play an important role in this process due to the abundance of freely available NH3. Because of the difficulty of producing reliable simulation models for reactive nitrogen species because of their semi-volatile nature, it is first necessary to establish accurate simulations for SO42–. The means to enhance SO42– production has been demonstrated for a single winter haze episode, and further tests on other haze episodes should be performed. Furthermore, the incorporation of SCI in this study suggests sensitivity to fugitive VOC sources that do not include direct SO2 emissions but can change O3 concentrations, and this effect should be tested in other seasons.

Author Contributions

S.I. coded the additional gas- and aqueous-phase reactions into the CMAQ model, conducted the model simulations and the comparison of models with observations, and wrote the manuscript; K.Y. is the sub-leader of the model intercomparison and prepared the meteorological inputs and initial and boundary conditions; H.H. is the sub-leader of the inorganic aerosol measurements and conducted the ACSA observations at Mukoujima, Tokyo; S.C. is the leader of the J-STREAM project and prepared the emission inputs and discussed the model intercomparison results.

Funding

This research was funded by the Environment Research and Technology Development Fund (5-1601) of the Environmental Restoration and Conservation Agency.

Acknowledgments

This research was supported by the Environment Research and Technology Development Fund (5-1601) of the Environmental Restoration and Conservation Agency.

Conflicts of Interest

The authors declare no conflict of interest.

References

  1. Chatani, S.; Yamaji, K.; Sakurai, T.; Itahashi, S.; Shimadera, H.; Kitayama, K.; Hayami, H. Overview of model inter-comparison in Japan’s study for reference air quality modeling (J-STREAM). Atmosphere 2018, 9, 19. [Google Scholar] [CrossRef]
  2. Chatani, S.; Okumura, M.; Shimadera, H.; Yamaji, K.; Kitayama, K.; Matsunaga, S. Effects of a detailed vegetation database on simulated meteorological fields, biogenic VOC emissions, and ambient pollutant concentrations over Japan. Atmosphere 2018, 9, 179. [Google Scholar] [CrossRef]
  3. Itahashi, S.; Yamaji, K.; Chatani, S.; Hayami, H. Refinement of modeled aqueous-phase sulfate production via the Fe- and Mn-catalyzed oxidation pathway. Atmosphere 2018, 9, 132. [Google Scholar] [CrossRef]
  4. Itahashi, S.; Yamaji, K.; Chatani, S.; Hisatsune, K.; Saito, S.; Hayami, H. Model performance differences in sulfate aerosol in winter over Japan based on regional chemical transport models of CMAQ and CAMx. Atmosphere 2018, 9, 488. [Google Scholar] [CrossRef]
  5. Kitayama, K.; Morino, Y.; Yamaji, K.; Chatani, S. Uncertainties in O3 concentrations simulated by CMAQ over Japan using four chemical mechanisms. Atmos. Environ. 2019, 198, 448–462. [Google Scholar] [CrossRef]
  6. Fu, X.; Wang, S.; Zhao, B.; Xing, J.; Cheng, Z.; Liu, H.; Hao, J. Emission inventory of primary pollutants and chemical speciation in 2010 for the Yangtze River Delta region, China. Atmos. Environ. 2013, 70, 39–50. [Google Scholar] [CrossRef]
  7. Zheng, B.; Tong, D.; Li, M.; Liu, F.; Hong, C.; Geng, G.; Li, H.; Li, X.; Peng, L.; Qi, J.; et al. Trends in China’s anthropogenic emissions since 2010 as the consequence of clean air actions. Atmos. Chem. Phys. 2018, 18, 14095–14111. [Google Scholar] [CrossRef]
  8. Skamarock, W.C.; Klemp, J.B.; Dudhia, J.; Gill, D.O.; Barker, D.M.; Duda, M.G.; Huang, X.Y.; Wang, W.; Power, J.G. A Description of the Advanced Research WRF Version 3; NCAR/TN-475+STR; National Center for Atmospheric Research: Boulder, CO, USA, 2008. [Google Scholar]
  9. National Centers for Environmental Prediction/National Weather Service/NOAA/U.S. Department of Commerce. NCEP GDAS/FNL 0.25 Degree Global Tropospheric Analyses and Forecast Grids, Research Data Archive at the National Center for Atmospheric Research, Computational and Information Systems Laboratory, Boulder, Colo. 2015. Available online: https://rda.ucar.edu/datasets/ds083.3/ (accessed on 7 May 2019).
  10. Group for High Resolution Sea Surface Temperature (GHRSST). Available online: https://www.ghrsst.org (accessed on 7 July 2019).
  11. Iacono, M.J.; Delamere, J.S.; Mlawer, E.J.; Shephard, M.W.; Clough, S.A.; Collins, W.D. Radiative forcing by long-lived greenhouse gases: Calculations with the AER radiative transfer models. J. Geophys. Res. 2008, 113, D13103. [Google Scholar] [CrossRef]
  12. Morrison, H.; Thompson, G.; Tatarskii, V. Impacts of cloud microphysics on the development of trailing stratiform precipitation in a simulated squall line: Comparison of one- and two-moment schemes. Mon. Weather Rev. 2009, 137, 991–1007. [Google Scholar] [CrossRef]
  13. Grell, G.A.; Devenyi, D. A generalized approach to parameterizing convection combining ensemble and data assimilation techniques. Geophys. Res. Lett. 2002, 29. [Google Scholar] [CrossRef]
  14. US EPA Office of Research and Development. Community Multiscale Air Quality (CMAQ) Model Version 5.2; US EPA Office of Research and Development: Washington, DC, USA, 2017. [CrossRef]
  15. Carter, W.P.L. Development of the SAPRC-07 chemical mechanism. Atmos. Environ. 2010, 44, 5336–5345. [Google Scholar] [CrossRef]
  16. CMAQ v5.0 Sulfur Chemistry. Available online: https://www.airqualitymodeling.org/index.php/CMAQv5.0_Sulfur_Chemistry (accessed on 10 May 2019).
  17. Seinfeld, J.H.; Pandis, S.N. Atmospheric Chemistry and Physics—From Air Pollution to Climate Change, 2nd ed.; John Wiley & Sons: New York, NY, USA, 2006. [Google Scholar]
  18. Akimoto, H. Atmospheric Reaction Chemistry; Springer: New York, NY, USA, 2016. [Google Scholar]
  19. Hatakeyama, S.; Akimoto, H. Reactions of Criegee intermediates in the gas phase. Res. Chem. Intermed. 1994, 20, 503–524. [Google Scholar] [CrossRef]
  20. Welz, O.; Savee, J.D.; Osborn, D.L.; Vasu, S.S.; Percival, C.J.; Shallcross, D.E.; Taatjes, C.A. Direct kinetic measurements of Criegee Intermediate (CH2OO) formed by reaction of CH2I with O2. Science 2012, 335, 204–207. [Google Scholar] [CrossRef]
  21. Stone, D.; Blitz, M.; Daubney, L.; Howes, N.U.M.; Seakins, P. Kinetics of CH2OO reactions with SO2, NO2, NO, H2O and CH3CHO as a function of pressure. Phys. Chem. Chem. Phys. 2014, 16, 1139. [Google Scholar] [CrossRef]
  22. Tadayon, S.V.; Foreman, E.S.; Murray, C. Kinetics of the reactions between the Criegee intermediate CH2OO and alcohols. J. Phys. Chem. A 2018, 122, 258–268. [Google Scholar] [CrossRef]
  23. Taatjes, C.A.; Welz, O.; Eskola, A.J.; Savee, J.D.; Scheer, A.M.; Shallcross, D.E.; Rotavera, B.; Lee, E.P.F.; Dyke, J.M.; Mok, D.K.W.; et al. Direct measurements of conformer-dependent reactivity of the Criegee intermediate CH3CHOO. Science 2013, 340, 177–180. [Google Scholar] [CrossRef]
  24. Huang, H.-L.; Chao, W.; Lin, J.M. Kinetics of a Criegee intermediate that would survice high humidity and may oxidize atmospheric SO2. Proc. Natl. Acad. Sci. USA 2015, 112, 10857–10862. [Google Scholar] [CrossRef]
  25. Sarwar, G.; Fahey, K.; Kwok, R.; Gilliam, R.C.; Roselle, S.J.; Mathur, R.; Xue, J.; Yu, J.; Carter, W.P.L. Potential impacts of two SO2 oxidation pathways on regional sulfate concentrations: aqueous-phase oxidation by NO2 and gas-phase oxidation by Stabilized Criegee Intermediates. Atmos. Environ. 2013, 68, 186–197. [Google Scholar] [CrossRef]
  26. Li, J.; Ying, Q.; Yi, B.; Yang, P. Role of stabilized Criegee Intermediates in the formation of atmospheric sulfate in eastern United States. Atmos. Environ. 2013, 79, 442–447. [Google Scholar] [CrossRef]
  27. CMAQ v5.1 Aqueous Chemistry. Available online: https://www.airqualitymodeling.org/index.php/CMAQv5.0_Sulfur_Chemistry (accessed on 28 June 2018).
  28. Fahey, K.M.; Carlton, A.G.; Pye, H.O.T.; Baek, J.; Hutzell, W.T.; Stanier, C.O.; Baker, K.R.; Appel, K.W.; Jaoui, M.; Offenberg, J.H. A framework for expanding aqueous chemistry in the Community Multiscale Air Quality (CMAQ) model version 5.1. Geosci. Model Dev. 2017, 10, 1587–1605. [Google Scholar] [CrossRef] [Green Version]
  29. Damian, V.; Sandu, A.; Damian, M.; Potra, F.; Carmichael, G.R. The kinetic preprocessor KPP—A software environment for solving chemical kinetics. Comput. Chem. Eng. 2002, 26, 1567–1579. [Google Scholar] [CrossRef]
  30. Itahashi, S.; Uno, I.; Kim, S.-T. Source contributions of sulfate aerosol over East Asia estimated by CMAQ-DDM. Environ. Sci. Technol. 2012, 46, 6733–6741. [Google Scholar] [CrossRef]
  31. Itahashi, S.; Hayami, H.; Yumimoto, K.; Uno, I. Chinese province-scale source apportionments for sulfate aerosol in 2005 evaluated by the tagged tracer method. Environ. Pollut. 2017, 220, 1366–1375. [Google Scholar] [CrossRef] [Green Version]
  32. Itahashi, S.; Hatakeyama, S.; Shimada, K.; Tatsuta, S.; Taniguchi, Y.; Chan, C.K.; Kim, Y.-P.; Lin, N.-H.; Takami, A. Model estimation of sulfate aerosol source collected at Cape Hedo during an intensive campaign in October-November, 2015. Aerosol Air Qual. Res. 2017, 17, 3079–3090. [Google Scholar] [CrossRef]
  33. Itahashi, S. Toward synchronous evaluation of source apportionments for atmospheric concentration and deposition of sulfate aerosol over East Asia. J. Geophys. Res. Atmos. 2018, 123, 2927–2953. [Google Scholar] [CrossRef]
  34. Itahashi, S.; Hatakeyama, S.; Shimada, K.; Takami, A. Sources of high sulfate aerosol concentration observed at Cape Hedo in spring 2012. Aerosol Air Qual. Res. 2019, 19, 587–600. [Google Scholar] [CrossRef]
  35. Itahashi, S.; Uno, I.; Osada, K.; Kamiguchi, Y.; Yamamoto, S.; Tamura, K.; Wang, Z.; Kurosaki, Y.; Kanaya, Y. Nitrate transboundary heavy pollution over East Asia in winter. Atmos. Chem. Phys. 2017, 17, 3823–3843. [Google Scholar] [CrossRef] [Green Version]
  36. EANET. Technical Manual for Wet Deposition Monitoring in East Asia. Available online: http://www.eanet.asia/product/manual/techwet.pdf (accessed on 3 September 2018).
  37. Emery, C.; Liu, Z.; Russell, A.G.; Odman, M.T.; Yarwood, G.; Kumar, N. Recommendations on statistics and benchmarks to assess photochemical model performance. J. Air Waste Manag. Assoc. 2017, 67, 582–598. [Google Scholar] [CrossRef] [Green Version]
  38. Boylan, J.W.; Russell, A.G. PM and light extinction model performance metrics, goals, and criteria for three-dimensional air quality models. Atmos. Environ. 2006, 40, 4946–4959. [Google Scholar] [CrossRef]
  39. Fiore, A.M.; Dentener, F.J.; Wild, O.; Cuvelier, C.; Schultz, M.G.; Hess, P.; Textor, C.; Schulz, M.; Doherty, R.M.; Horowitz, L.W.; et al. Multimodel estimates of intercontinental source-receptor relationships for ozone pollution. J. Geophys. Res. 2009, 114, D04301. [Google Scholar] [CrossRef]
  40. Itahashi, S.; Uno, I.; Kim, S.-T. Seasonal source contributions of tropospheric ozone over East Asia based on CMAQ-HDDM. Atmos. Environ. 2013, 70, 204–217. [Google Scholar] [CrossRef]
Figure 1. Spatial distribution of (left) SO42– concentrations simulated by the CMAQ base-case simulation for domain 1 and (right) changes in SO42– concentrations for chemistry updates A and KMT averaged over the period 15–25 December 2016.
Atmosphere 10 00544 g001
Figure 2. Spatial distribution of SO42– concentrations simulated by the CMAQ chemistry updates B as changes from chemistry updates A averaged over the period 15–25 December 2016 in domain 1. The inclusion of SCI was tested incrementally as (top-left) only SCI1 with a higher rate constant for H2O (SCI1(H)), (top-center) the addition of SCI2 to SCI1(H), and (top-right) the addition of SCI3 to SCI1(H) and SCI2, (bottom-left) SCI1 with a lower rate constant of H2O (SCI1(L)), (bottom-center) the addition of SCI2 to SCI1(L), and (bottom-right) the addition of SCI3 to SCI(L) and SCI2.
Atmosphere 10 00544 g002
Figure 3. Spatial distribution of (top) ambient concentrations of SO42– and (bottom) wet deposition simulated by (left) CMAQ base-case simulation and (right) changes by chemistry updates A, B, and KMT relative to the base-case averaged over the period 15–25 December 2016 over domain 4. The observation site at Tokyo is indicated by the gray circle.
Atmosphere 10 00544 g003
Figure 4. Temporal variation of (top) hourly observed and modelled ambient concentrations of SO42, and (bottom) hourly modelled precipitation at the Tokyo site for domain 4. The inset in bottom figure is the daily accumulated SO42– wet deposition for the observed and modelled results.
Atmosphere 10 00544 g004
Figure 5. Spatial distribution of SO42– concentrations simulated by the CMAQ base-case simulation averaged over (a) P1, (b) P2, and (c) P3 for domain 4.
Atmosphere 10 00544 g005
Figure 6. Spatial distribution of (left) all SO2 emission sources used in this study and SO2 emissions from sources g01 (center) and g02 (right) over domain 4. Note that emissions are shown in two dimensions and most of g01 is distributed on the surface layer of the model, whereas g02 is distributed over the upper layer of the model, considering the stack heights.
Atmosphere 10 00544 g006
Figure 7. Temporal variation of source contributions of g01, g02, g03, g04, and others calculated for the CMAQ base-case simulation.
Atmosphere 10 00544 g007
Figure 8. Spatial distributions of source contributions g01, g02, and other sources calculated by CMAQ base-case simulation, averaged during the analyzed periods defined as (a) P1, (b) P2, and (c) P3. Note that the color scale for g02 is different from that of g01 and other sources.
Atmosphere 10 00544 g008
Figure 9. Summary of the source contributions calculated by the four CMAQ simulations averaged during (a) P1, (b) P2, and (c) P3.
Atmosphere 10 00544 g009
Figure 10. Source contributions of O3 from four domestic sources of g01, g02, g03, and g04, calculated by chemistry updates B, averaged during P1.
Atmosphere 10 00544 g010
Table 1. Reactions involving the three stabilized Criegee intermediates (SCI) species on SAPRC07 adapted in this study.
ReactionRate ConstantReference
O3 + ETHE → … + 0.370 × SCI1 [15]
O3 + PRPE → … + 0.185 × SCI1 + 0.075 × SCI2 [15]
O3 + BD13 → … + 0.185 × SCI1 [15]
O3 + OLE1 → … + 0.185 × SCI1 + 0.159 × SCI3 [15]
O3 + OLE2 → … + 0.024 × SCI1 + 0.065 × SCI2 + 0.235 × SCI3 [15]
O3 + ISOP → … + 0.204 × SCI1 [15]
O3 + IPRD → … + 0.100 × SCI1 + 0.372 × SCI3 [15]
O3 + TERP → … + 0.172 × SCI1 + 0.068 × SCI3 [15]
O3 + SESQ → … + 0.172 × SCI1 + 0.058 × SCI3 [15]
SCI1 + SO2 → HCHO + SULF3.9 × 10−11[20]
SCI1 + NO2 → HCHO + NO31.5 × 10−12[21]
SCI1 + NO → HCHO + NO22.0 × 10−13[21]
SCI1 + H2O → 2.4 × 10⁻¹⁵
9.0 × 10⁻¹⁷
[20]
[21]
SCI1 + MEOH → 1.4 × 10⁻¹³[22]
SCI1 + ETOH → 2.3 × 10⁻¹³[22]
SCI1 + ALK4 → 1.9 × 10⁻¹³[22]
SCI2 + SO2 → CCHO + SULF4.55 × 10−11[23]
SCI2 + H2O → 7.0 × 10⁻¹⁴[23]
SCI3 + SO2 → RCHO + SULF1.3 × 10−10[24]
SCI3 + H2O → 1.5 × 10⁻¹⁶[24]
Note: Unit of rate constant is cm3 s–1. The names are based on the nomenclature used in the expressions in SAPRC07; O3, ozone; ETHE, ethene; PRPE, propene; BD13, 1,3-butadiene; OLE1 refers to alkenes with reaction rates with OH < 7.0 × 10⁻⁴ ppm–1 min–1 (excluding ethene); OLE2 refers to alkenes with reaction rates with OH > 7.0 × 10⁻⁴ ppm–1 min–1; ISOP, isoprene; IPRD, lumped isoprene products; TERP, terpene; SESQ, sesquiterpenes; SO2, sulfur dioxide; SULF, sulfate (SO3 or H2SO4); NO2, nitrogen dioxide; NO3, nitrate radical; NO, nitric oxide; H2O, water; MEOH, methanol; ETOH, ethanol; ALK4 refers to alkanes and other non-aromatic compounds that react only with OH with a rate constant range between 5.0 × 10⁻³ and 1.0 × 10⁻⁴ ppm–1 min–1; CCHO, acetaldehyde; RCHO, lumped aldehydes; SCI species: SCI1 refers to CH2OO, SCI2 refers to CH3CHOO and SCI3 refers to (CH3)2COO.
Table 2. Summary of Community Multiscale Air Quality (CMAQ) simulations conducted in this study.
NameDescription
Chemistry Updates AFe and Mn solubilities are increased and the rate constant expression for the Fe- and Mn-catalyzed oxidation by O2 includes a pH dependency. Addition of an NO2 aqueous-phase reaction (a total of six aqueous-phase reactions were treated).
Chemistry Updates BSame as sensitivity Simulation A, but with addition of gas-phase oxidation pathways related to SCI (see Table 1).
Kinetic Mass Transfer (KMT)Selection of the AQCHEM-KMT option
Table 3. Statistical analysis of model performance for SO42– concentrations at the Tokyo site in domain 4 of J-STREAM.
Base-CaseChemistry Updates AChemistry Updates BKMT
N247
Mean (observation) [μg/m3]1.70
Mean (model) [μg/m3]1.681.701.741.66
R0.68 *
(p < 0.001)
0.68 *
(p < 0.001)
0.69 *
(p < 0.001)
0.68 *
(p < 0.001)
NMB [%]−1.4 **0.0 **+2.6 **−2.1 **
NME [%]45.0 *45.1 *44.1 *44.9 *
MFB [%]+10.7 **+12.0 **+14.4 **+9.8 **
MFE [%]52.1 *52.1 *51.4 *51.9 *
% within a factor of 269.669.270.570.4
% within a factor of 387.987.987.988.3
Note: ** indicates model performance goal, and * indicates model performance criteria, see text for these judgements.