Next Article in Journal
Use of Low-Cost Ambient Particulate Sensors in Nablus, Palestine with Application to the Assessment of Regional Dust Storms
Next Article in Special Issue
Can the MerPAS Passive Air Sampler Discriminate Landscape, Seasonal, and Elevation Effects on Atmospheric Mercury? A Feasibility Study in Mississippi, USA
Previous Article in Journal
Added Value of Atmosphere-Ocean Coupling in a Century-Long Regional Climate Simulation
Previous Article in Special Issue
Fluxes of Gaseous Elemental Mercury on a Mediterranean Coastal Grassland
 
 
Correction published on 22 October 2019, see Atmosphere 2019, 10(10), 635.
Article

Air/Surface Exchange of Gaseous Elemental Mercury at Different Landscapes in Mississippi, USA

1
Department of Chemistry and Biochemistry, University of Mississippi, University, MS 38677, USA
2
Department of Biology, University of Mississippi, University, MS 38677, USA
*
Author to whom correspondence should be addressed.
Atmosphere 2019, 10(9), 538; https://doi.org/10.3390/atmos10090538
Submission received: 8 August 2019 / Revised: 5 September 2019 / Accepted: 6 September 2019 / Published: 11 September 2019
(This article belongs to the Special Issue Atmospheric Mercury: Sources, Sinks, and Transformations)

Abstract

:
Mercury (Hg) is a global pollutant with human health and ecological impacts. Gas exchange between terrestrial surfaces and the atmosphere is an important route for Hg to enter and exit ecosystems. Here, we used a dynamic flux chamber to measure gaseous elemental Hg (GEM) exchange over different landscapes in Mississippi, including in situ measurements for a wetland (soil and water), forest floor, pond, mowed field and grass-covered lawn, as well as mesocosm experiments for three different agricultural soils. Fluxes were measured during both the summer and winter. Mean ambient levels of GEM ranged between 0.93–1.57 ng m−3. GEM emission fluxes varied diurnally with higher daytime fluxes, driven primarily by solar radiation, and lower and more stable nighttime fluxes, dependent mostly on temperature. GEM fluxes (ng m−2 h−1) were seasonally dependent with net emission during the summer (mean 2.15, range 0.32 to 4.92) and net deposition during the winter (−0.12, range −0.32 to 0.12). Total Hg concentrations in the soil ranged from 17.1 ng g−1 to 127 ng g−1 but were not a good predictor of GEM emissions. GEM flux and soil temperature were correlated over the forest floor, and the corresponding activation energy for Hg emission was ~31 kcal mol−1 using the Arrhenius equation. There were significant differences in GEM fluxes between the habitats with emissions for grass > wetland soil > mowed field > pond > wetland water ≈ forest ≈ agriculture soils. Overall, we demonstrate that these diverse landscapes serve as both sources and sinks for airborne Hg depending on the season and meteorological factors.

1. Introduction

Mercury (Hg) is a major global pollutant that at higher concentrations can cause serious human health and ecological impacts, and thus is among the top 10 hazardous chemicals listed by the World Health Organization. Gaseous elemental mercury (GEM), which consists of over 95% of the total-Hg in the air, has a relatively long residence time of ~0.5 to 2 years [1,2]. Thus, it undergoes long distance transport after emission from sources and plays an important role in the global Hg cycle.
GEM exchange between the atmosphere and terrestrial or aquatic surfaces serves as an important, but poorly characterized, route for the heavy metal to enter and exit ecosystems. Measuring and modeling of Hg emissions from representative surfaces are crucial to evaluate the role of natural landscapes on the cycling of Hg on both regional and global scales [2]. Unlike point sources, non-point sources of Hg are relatively under-characterized and include active geothermal areas, biomass burning, soil and geologically enriched substrates, lakes, and wetlands [3]. GEM fluxes from natural surfaces are typically measured using either enclosure (e.g., dynamic flux chamber (DFC)) or micrometeorological methods, and are reported as ng of Hg emitted or deposited per m2 per hour [4]. Both methods have their advantages and limitations, with the DFC being portable, simple to deploy, and not subject to the strict site constraints of the micro-meteorological method, but also having a small footprint and potentially influencing soil temperature and other properties [2,4]. In general, DFC methods are good to study processes, but not to measure exact emission and deposition rates. Air/surface GEM fluxes are largely influenced by substrate Hg concentration, sunlight, temperature, atmospheric turbulence, relative humidity, soil moisture content, rain events, and vegetation cover [5]. Another important factor in both soil and aquatic environments is reduction of oxidized divalent Hg species (Hg2+) to Hg0 catalyzed by solar radiation [6].
Measuring and modeling of GEM fluxes from representative surfaces are crucial to evaluate the role of terrestrial and aquatic environments in the cycling of Hg on both regional and global scales. This paper presents the first GEM air-surface flux measurements for natural landscapes in the mid-South, USA. The main objectives were to better understand natural sources of Hg in the region and to evaluate the factors controlling GEM from these landscapes. More specifically, we used a DFC to measure the exchange of Hg in-situ over a wetland (both soil and water surfaces), forest floor, pond, a mowed field, and a residential grass lawn, while simultaneously monitoring a range of meteorological parameters. In addition, we measured GEM fluxes over three types of agricultural soils in outdoor mesocosm experiments. GEM fluxes were measured during both the summer and the winter.

2. Materials and Methods

2.1. Site Descriptions

Hg gas exchange was measured over a wetland (soil and water), pond, forest floor, three different types of agricultural soil, a mowed field, and a residential lawn (Table 1). Hereafter soil refers to the ground surface, which is either bare (agriculture soil), covered by decaying organic matter (wetland and forest), or grass (mowed field and residential lawn).

2.1.1. In Situ Measurements

Wetland

We investigated Hg air-surface gas exchange at an ancient baldcypress (Taxodium distichum) wetland connected to Sky Lake during July 2014. Sky Lake is an oxbow lake located 10 km north of Belzoni Mississippi, which serves as a functioning backwater ecosystem, with a seasonally inundated, forested fringe up to 0.8 km wide surrounding the lake [7]. The wetland undergoes large-scale water level fluctuations that are thought to affect the redox conditions in the sediment resulting in alternating periods of oxic and anoxic conditions [8]. These oscillations in redox conditions may influence the speciation and bio-availability of Hg in the system. Wetlands are widely considered hot-spots for Hg methylation.

Pond and Mowed Field

We also measured fluxes over a ~3000 m3 pond (#179) and adjacent mowed field at the University of Mississippi Field Station (UMFS) during winter (March 2014) and summer (July 2014). The UMFS is a research facility located on a 3 km2 site 11 miles northeast of the UM Oxford campus. The site lies within the Eocene Hills of the interior coastal plain of the southeastern U.S. and is characterized by sandy and sandy-loam soils. The area was row crops prior to 1947. The depth of the pond was ~1 m.

Forest and Residential Lawn

In situ measurements were also taken from a mature commercial loblolly pine (Pinus taeda) forest floor (planted in the 1990′s) and from a residential lawn with fescue grass (Festuca), both located in Lafayette County, near Oxford, MS. Forests cover about 65% Mississippi, which has more tree-farms than any other state.

2.1.2. Mesocosm Measurements

The Mississippi River alluvial flood plain, commonly known as the Mississippi Delta, is located in northwest Mississippi and is one of the most intensive agricultural areas in the nation, with primarily corn, cotton, rice, and soybean production. Agricultural practices include turning-over soils which exposes new surface areas for exchange with the atmosphere. Two types of Delta soils were analyzed. Dundee soils consist of poorly drained loamy soils. Dowling soils are relatively acidic, fine-textured soils on flats or in depressions. In addition, agricultural soil was collected 8 km south of Oxford, Mississippi, from an active cotton field and wetland soil was collected from a wetland located near the University of Mississippi main campus. Soils in this region have a thermic soil temperature regime, an udic or aquic soil moisture regime, and siliceous or kaolinitic mineralogy [9].
Due to logistical difficulties of deploying instrumentation at these actively farmed and remote sites, we collected bulk soil to a depth of about ~0.3 m using a shovel and transferred it into plastic bins (~0.5 m × ~0.5 m × ~0.5 m). The soil was mixed with a plastic trowel, sealed to maintain moisture, and brought to a testing site near the UM, where there was little traffic and no known point sources of Hg. Measurements were collected outdoors within week of collection. While in-situ measurements are preferred to minimize altering of soil properties, agricultural soils are routinely tilled disrupting the soil and exposing new surfaces to the atmosphere. Our soil sampling strategy essentially mimicked this process; thus, our measurements reflect conditions that are experienced in the field sometimes several times per year. Due to disruption in the soil microbiology, there may be major differences for Hg flux between the mesocosm and in situ approaches. Thus, our mesocosm measurements are not in situ and should be considered in this light with a large uncertainty margin.

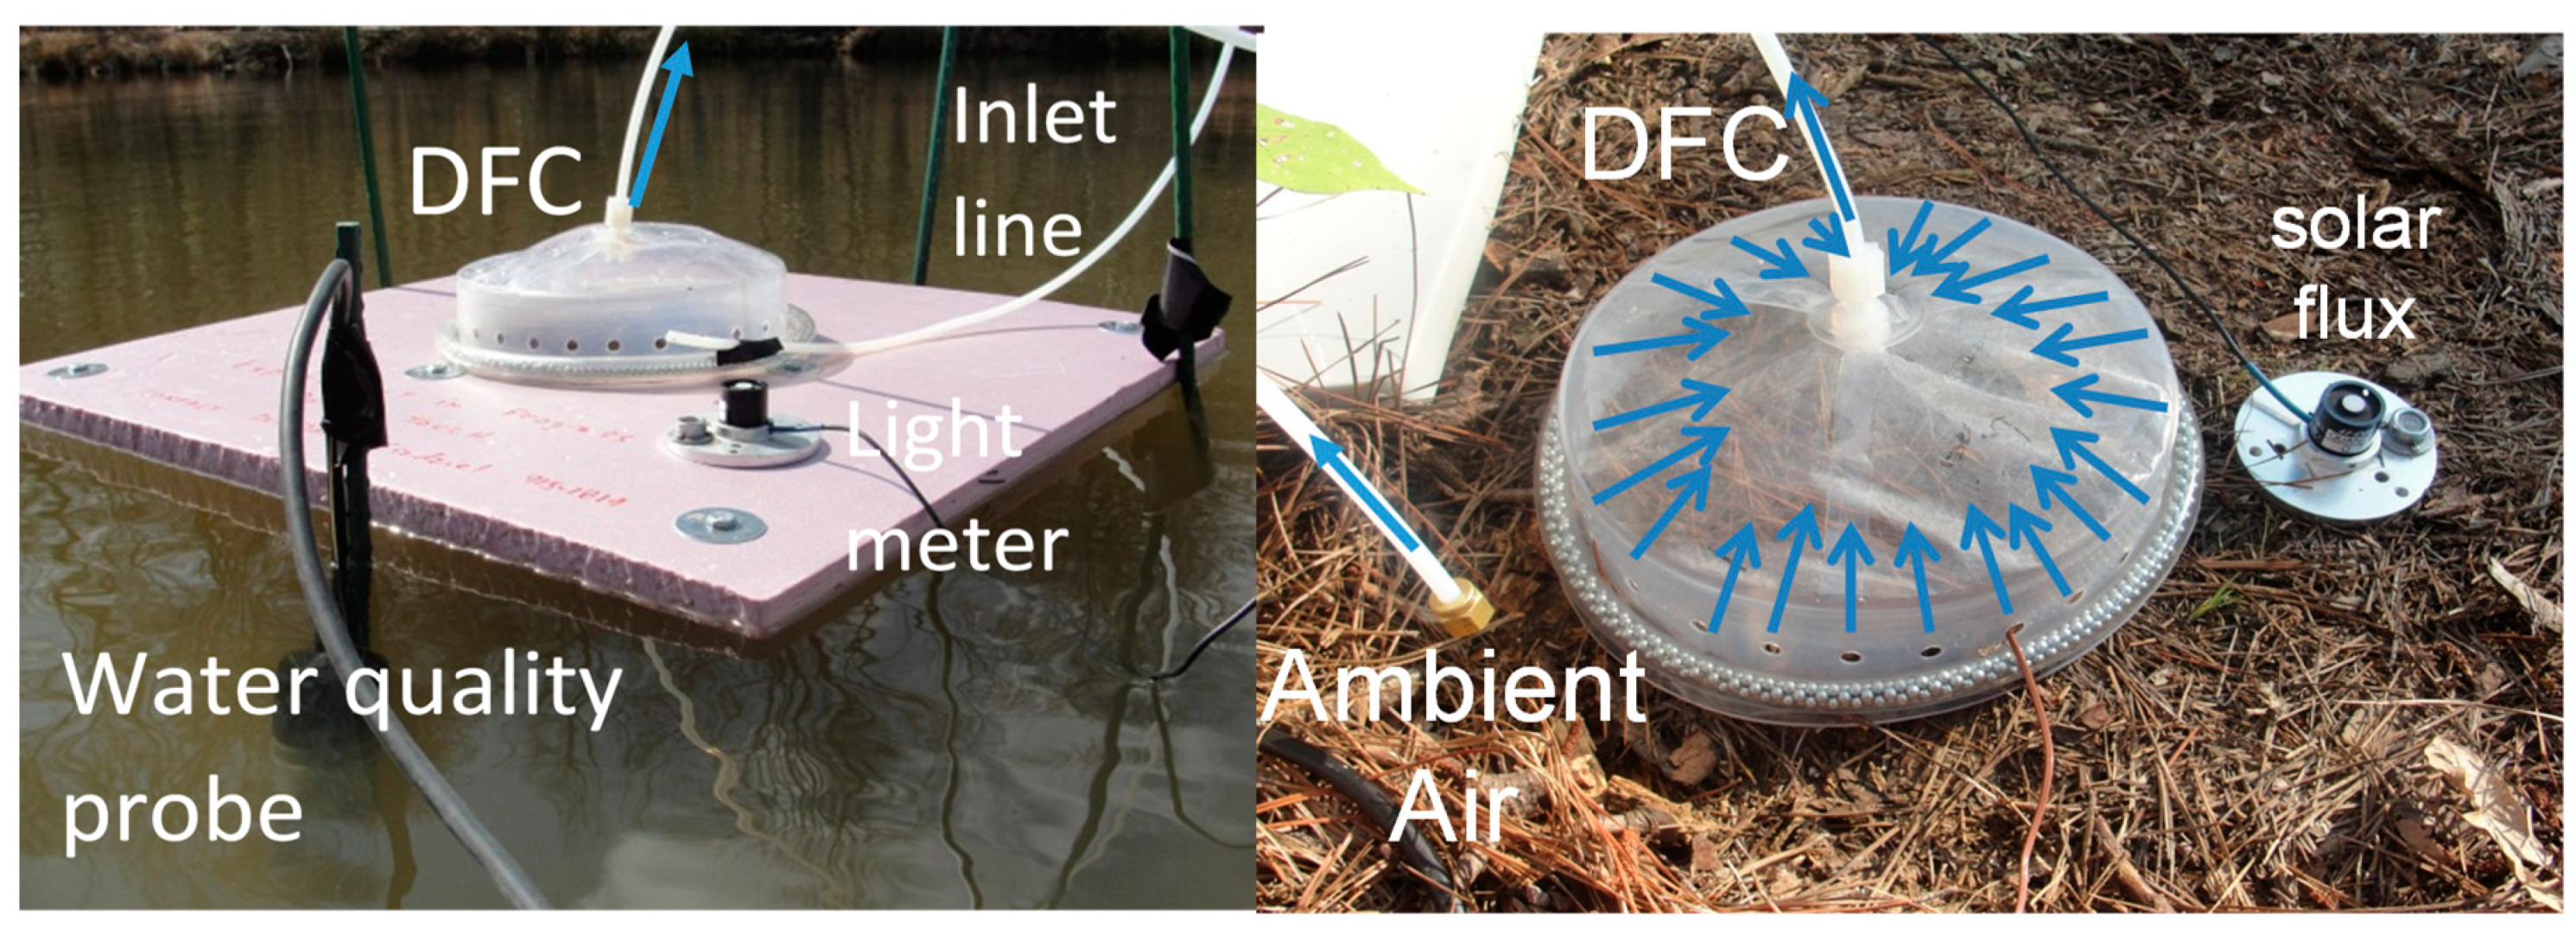
2.2. Gaseous Elemental Mercury (GEM) Flux Measurements

We used a Teflon DFC coupled to a Hg vapor analyzer for GEM exchange measurements (Figure 1). The DFC was set directly on the wetland soil, forest floor, mowed field and grass-covered lawn. On the water surface (wetland and pond), the DFC was fit into a foam board and floated. For the agricultural soils, the DFC was placed on top of the soil in the bins. The Hg analyzer and laptop computer was placed in an outdoor storage container to protect it from the weather. Fluxes were measured at the same sites during both the winter and summer seasons, except for the wetland where winter measurements were not collected due to personnel and logistical issues. A detailed description of the DFC method has been reported elsewhere [10,11,12,13]. Briefly, air is drawn through the DFC by a pump to a Hg vapor analyzer. This is considered the outlet. Air is also drawn through a second tube located external to the DFC for ambient air measurements of GEM. This is considered the inlet. The Hg flux is calculated with Equation (1):
F = Q*(CoCi)/A
where F is the Hg flux (ng m−2 h−1), Q is the flushing flow rate through the chamber (0.09 m3 h−1) and controlled by a mass flow controller inside the Hg analyzer, Co is the air Hg concentration at the outlet (ng m−3) and Ci is the air Hg concentration at the inlet, and A is the footprint area of the chamber (0.036 m2). The inlet measures ambient atmospheric Hg, whereas the outlet measures either the sum of atmospheric Hg and Hg emitted from the soil or, if deposition is occurring, atmospheric Hg minus Hg deposited on the soil surface. So, when the outlet concentration is higher than the inlet concentration, Hg is emitted from the soil; when the outlet concentration is lower than the inlet concentration, Hg is deposited on the soil.
Here, we used a Tekran model 2537A elemental Hg vapor analyzer and a Tekran model 1110 automated dual switching unit (Tekran Inc., Toronto, Canada) to sequentially sample the air at the inlet and outlet in 10-min intervals providing a flux data point every 20 min. Turnover time for the chamber was ~1.3 min (less than the 5 min sampling interval). The inlet sampling tube was placed at a height similar to the holes on the flux chamber. Prior to the measurements, all tubing and the chamber cover were rinsed with D.I. water and methanol. The Tekran analyzer was calibrated using injections of gaseous elemental Hg using a Tekran 2505 Hg vapor calibration unit; replicate injections produced recoveries >90%. The system was tested to ensure that the concentration difference between inlet and outlet was less than 5% when placed on a clean impermeable Teflon sheet. The system blank was negligible (mean = 0.08 ng m−2 h−1). The Hg analyzer detection limit was ~0.1 ng m−3. The DFC method detection limit (3σ criterion), estimated using night fluxes during stable meteorological periods, was 0.3 ng m−2 h−1; this represents the uncertainty in the flux measurements.
We measured Hg fluxes over water and soil concurrently at both the wetland at Sky Lake and the pond and mowed field at the UM Field Station. To that end, port one was used to sample ambient Hg, port two for the soil/air DFC, and port three for the water/air DFC. The gas lines were connected to a synchronized multiport sampler (Tekran 1115) which directs flows to the Hg vapor analyzer.

2.3. Meteorological and Solar Radiation Measurements

Meteorological conditions, including ambient air temperature, wind speed, wind direction, relative humidity, pressure and precipitation, were measured using Vaisala WXT 520 automatic weather station located near the flux chamber. Solar radiation was measured using LI-1400 datalogger equipped with a pyranometer. Data logging for both systems were programmed to record data at 5 min intervals to match the analysis interval of the Hg vapor analyzer. For the forest floor we also measured soil temperature near the surface at a depth of ~1 cm using a calibrated type k thermocouple from Cole Parmer.

2.4. Total-Hg and Organic Matter Content Measurements

The total-Hg concentration in the soils was determined with a Milestone Direct Mercury Analyzer (DMA-80) following the U.S. Environmental Protection Agency Method 7473, based on thermal decomposition-atomic absorption spectrometry. The method has been described elsewhere [14]. Sample boats were pre-heated to remove Hg and blanks were analyzed before testing the samples. Loss-on-ignition (LOI) was used as an estimate of organic matter, and was determined by weighing the sample before and after the combustion analysis [15].

2.5. Statistical Analysis

Raw data was initially processed in Excel (2013) spreadsheets. Regression analyses were conducted using JMP v. 5.0.1. Analysis of covariance (ANCOVA) was used to examine habitat differences in Hg flux and relationships between flux and environmental variables. Residuals were examined for normality for all tests and Cook’s D were used to determine if any outliers were influential observations. Humidity was excluded from the analyses to avoid collinearity with temperature. An additional continuous variable, “cos time of day” was included in place of day and night categories. “Cos time of day” was created by first converting time of day on the 24-h scale to a proportion. The proportion was then converted to degrees then radians and the cosine taken. All values were then multiplied by −1 so that noon got a value of 1 and midnight a value −1 (the two extreme values). ANCOVA was also conducted separately for daytime and nighttime measurements. The relative importance of the different predictors was determined from the F-ratios of the effects tests. Tukey’s tests were used to provide pairwise differences in means among habitats. Differences were deemed significant at the p < 0.05 level.

3. Results and Discussion

3.1. Total-Hg Concentrations in the Soils

Total-Hg concentrations in the soil varied between 17.1 and 127 ng g−1 for agricultural and wetland soil, respectively (Table S1). Except for the wetland, the concentrations are comparable to other “background” soils in the U.S and Canada [16,17,18,19], but are lower than those reported over human impacted soils and naturally enriched terrestrial landscapes in China and Australia [20,21,22]. The correlation between Hg concentrations and Loss-On-Ignition (LOI) in the soils was borderline significant (r = 0.74, p = 0.029).

3.2. Total GEM Concentrations in the Ambient Air

GEM concentrations were generally consistent with background levels for the northern hemisphere, which is believed to be ~1.5 ng m−3 [23] (Table S2). In the summer, there were generally positive GEM fluxes (evasion > deposition) and GEM fluxes were significantly correlated with ambient GEM concentrations, suggesting that these landscapes can be characterized as a source of Hg to the air (Table 2). The strength of the correlation is strongly influenced by the corresponding diurnal variations for GEM and Hg emission fluxes [21]. Significant negative correlations between GEM and Hg fluxes, indicating that the soils are serving as sinks (Hg deposition), were only found in the winter for grass, wetland, and Delta Dundee soil.
In this study, net deposition of Hg was more common in winter likely due in part to lower air and soil temperatures (less available energy). However, the situation for gross deposition may be different given the higher evasion in the summer. For example, GEM fluxes from a forest floor were highest in the summer and lowest in the winter [24]. When GEM and Hg emission fluxes were not significantly correlated, other meteorological parameters may be influencing the Hg exchange rates. The lowest GEM levels were measured during the summer at night over grass, possibly due to localized dry deposition of Hg0 on the vegetation (grass surface). In the winter ambient levels of GEM over grass were relatively high (1.48 ± 0.19 ng m−3) yet Hg fluxes were the lowest measured (−0.32 ± 0.25 ng m−2 h−1), suggesting that vegetation over soils plays an important role on Hg gas exchange.

3.3. Hg Fluxes over a Loblolly Pine Forest Floor

The mean Hg flux from the forest floor was 0.50 ± 1.20 ng m−2 h−1 during the summer and −0.19 ± 0.14 ng m−2 h−1 during the winter (Table 3). During the summer 73 of 139 data points (53%) were net emissions, whereas during the winter 69 of 75 data points (92%) were net depositions. The highest Hg flux (5.63 ng m−2 h−1) was observed at maximum solar radiation, and there were strong correlations between Hg emission fluxes with both solar radiation (r = 0.90) and temperature (r = 0.66), indicating that solar radiation has an immediate and predominant effect on Hg emission from forest soils and that thermal and/or photochemical reactions are involved (Figure 2). The forest flux was generally lower than that measured from other (bare) soils, possibly because the forest canopy limits the solar radiation reaching the ground. Humidity (r = −0.69), wind speed (r = 0.53), and GEM (r = 0.61) were also correlated (p < 0.05) with Hg emission flux in the summer, but to a much less extent than solar radiation and temperature. In contrast, there were no significant correlations observed between Hg emission fluxes and meteorological parameters in winter, which is likely due to relatively cold temperatures and low levels of solar radiation reaching the ground. Relationships between Hg fluxes and other meteorological parameters (temp., wind speed, and humidity) are given in Figure 2.

3.4. GEM Fluxes over a Residential Grass Lawn

The grass lawn gave a mean GEM release flux during the summer of 4.38 ± 1.71 ng m−2 h−1 (Table 3). It also had the lowest difference between day and night fluxes, suggesting that the grass may be contributing to emissions during the night. To test this hypothesis we removed grass from an area exposing the soil below and alternated measuring fluxes over grass and bare soil during the night (removing the effect of solar radiation). The mean GEM concentration increased from 0.63 ng m−3 over the grass to 1.32 ng m−3 over the soil and fluxes were higher over the grass (1.72 ± 0.2 ng m−2 h−1) compared to the bare soil (0.01 ± 0.35 ng m−2 h−1). Ericksen [23] proposed that the relatively high fluxes over grass during night are unrelated to decreasing soil temperatures, rather the high Hg fluxes are the result of the soil Hg pool replenishing in the absence of light. In our study, Hg emission fluxes from grass in the winter ranged from −0.94 to 0.22 ng m−2 h−1 with a mean of −0.32 ± 0.25 ng m−2 h−1. This was lowest among the soils, and suggests that other factors (e.g., vegetation surfaces) were dominant.

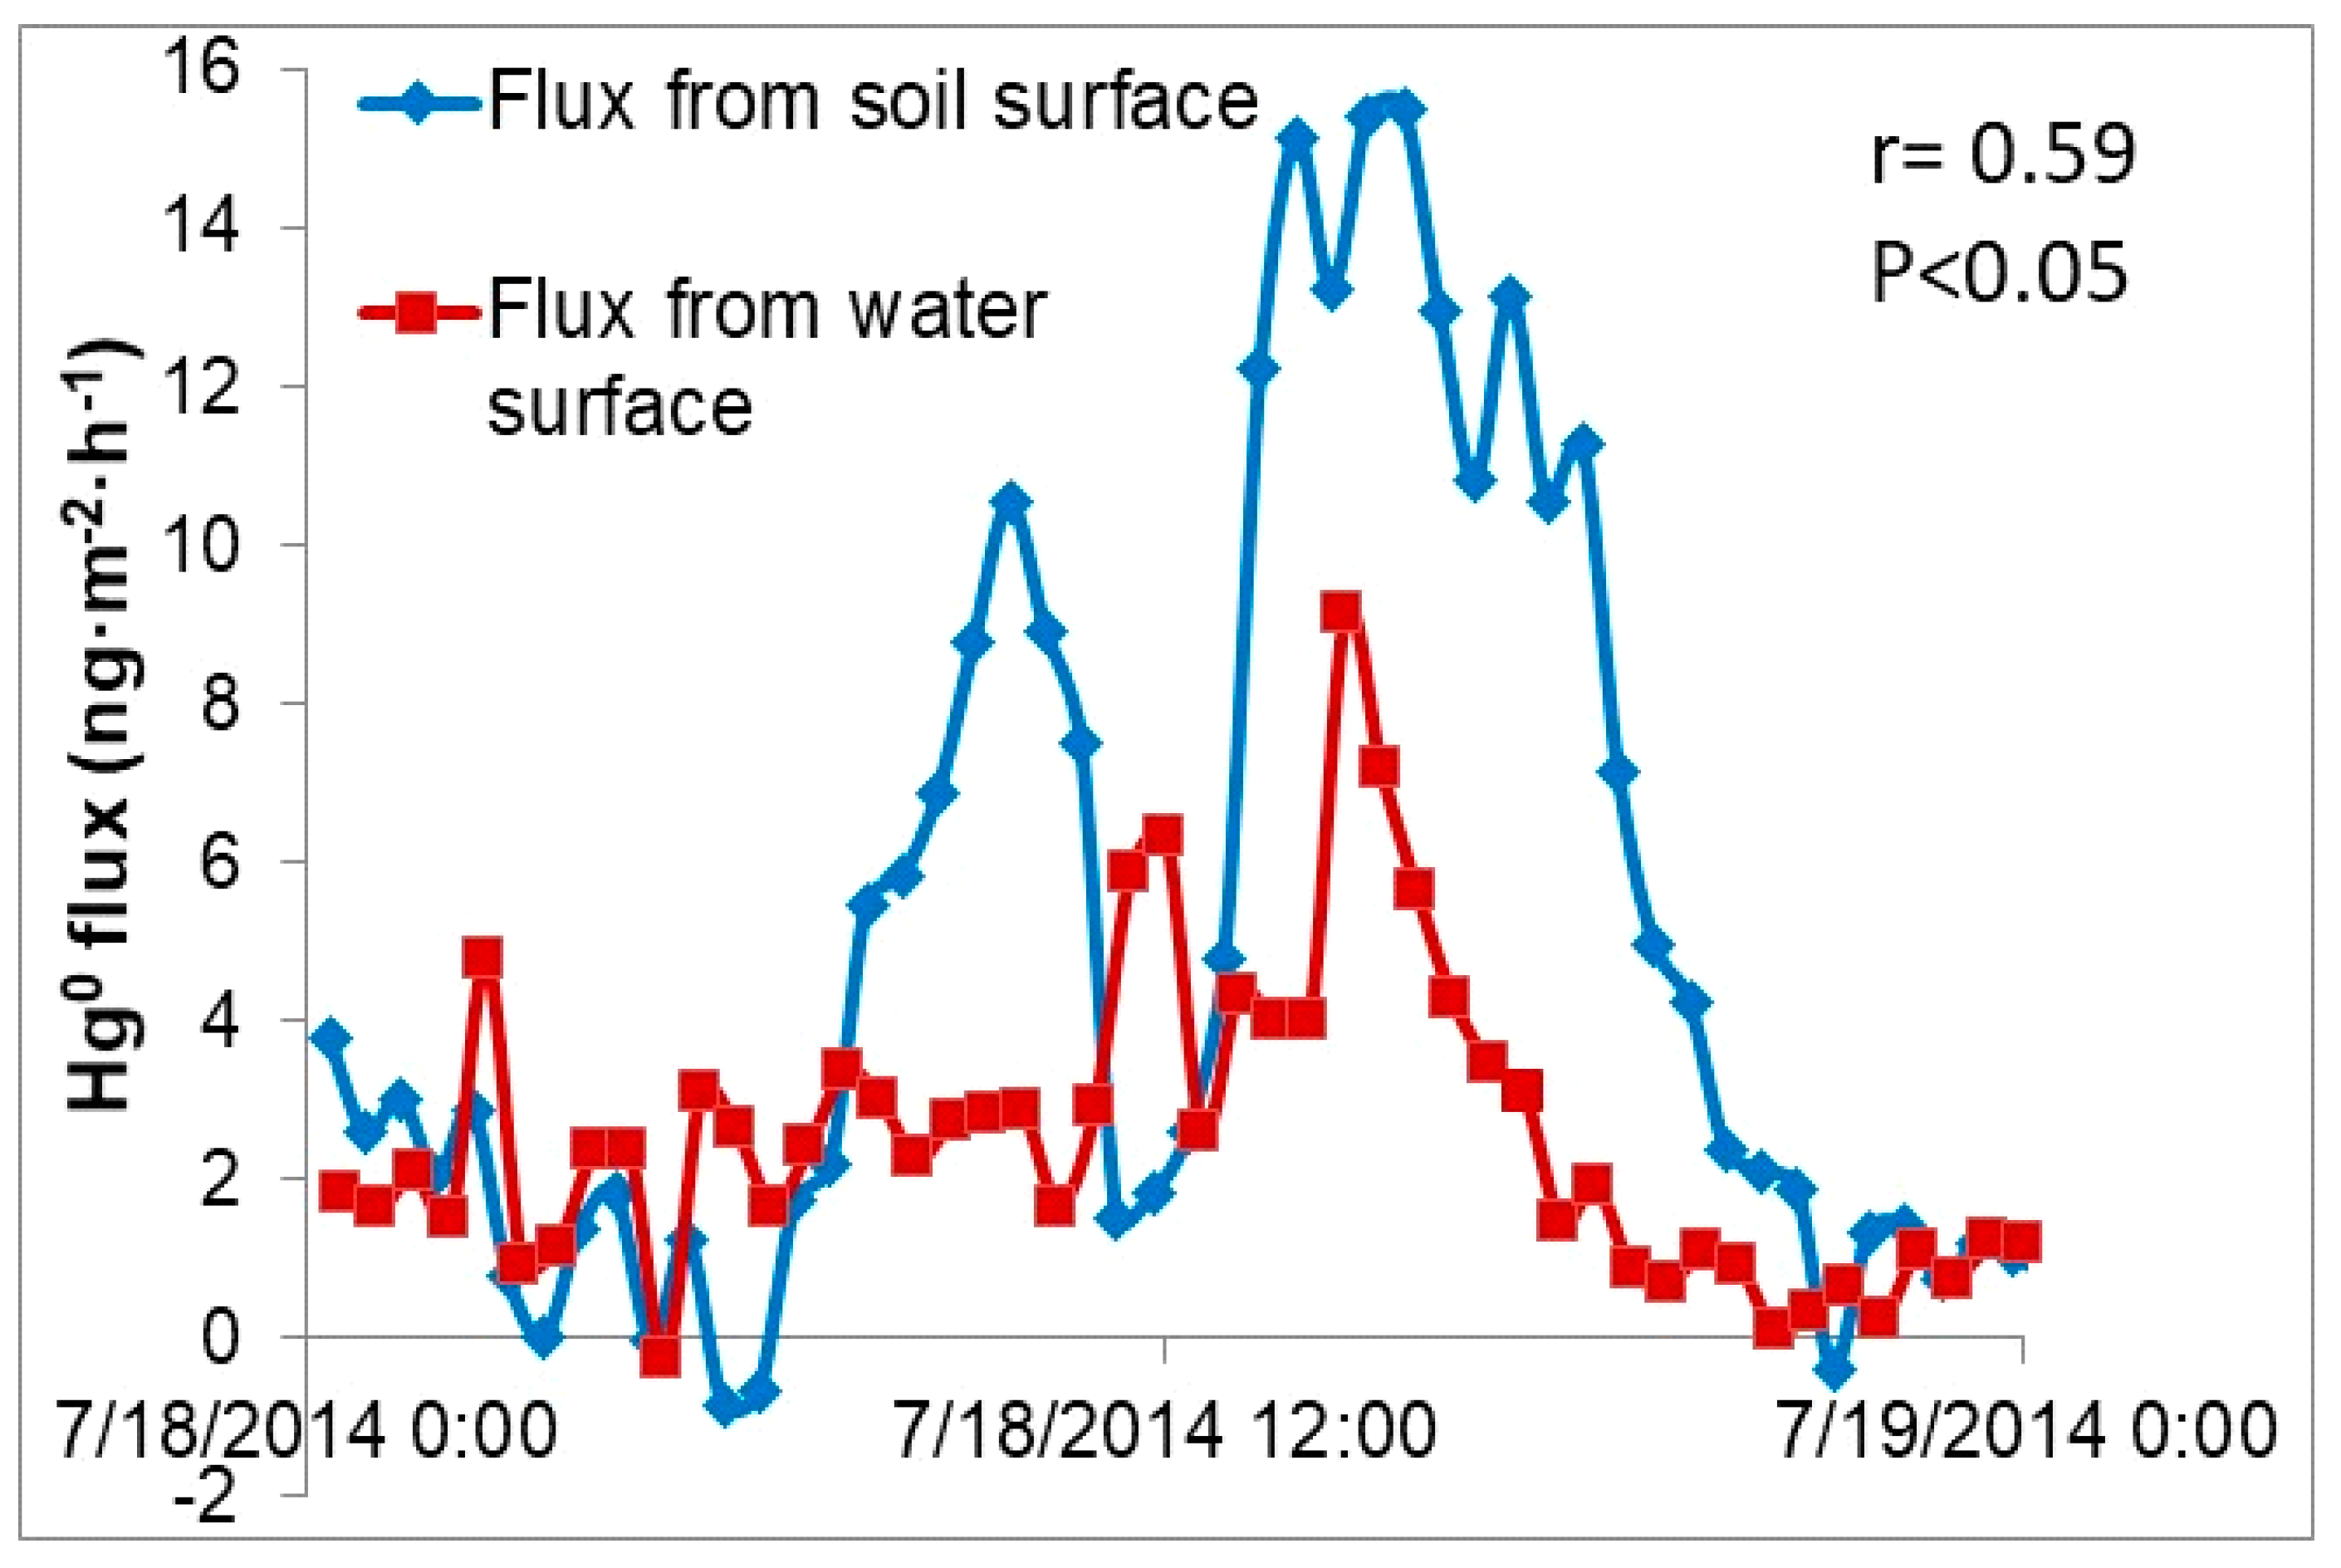
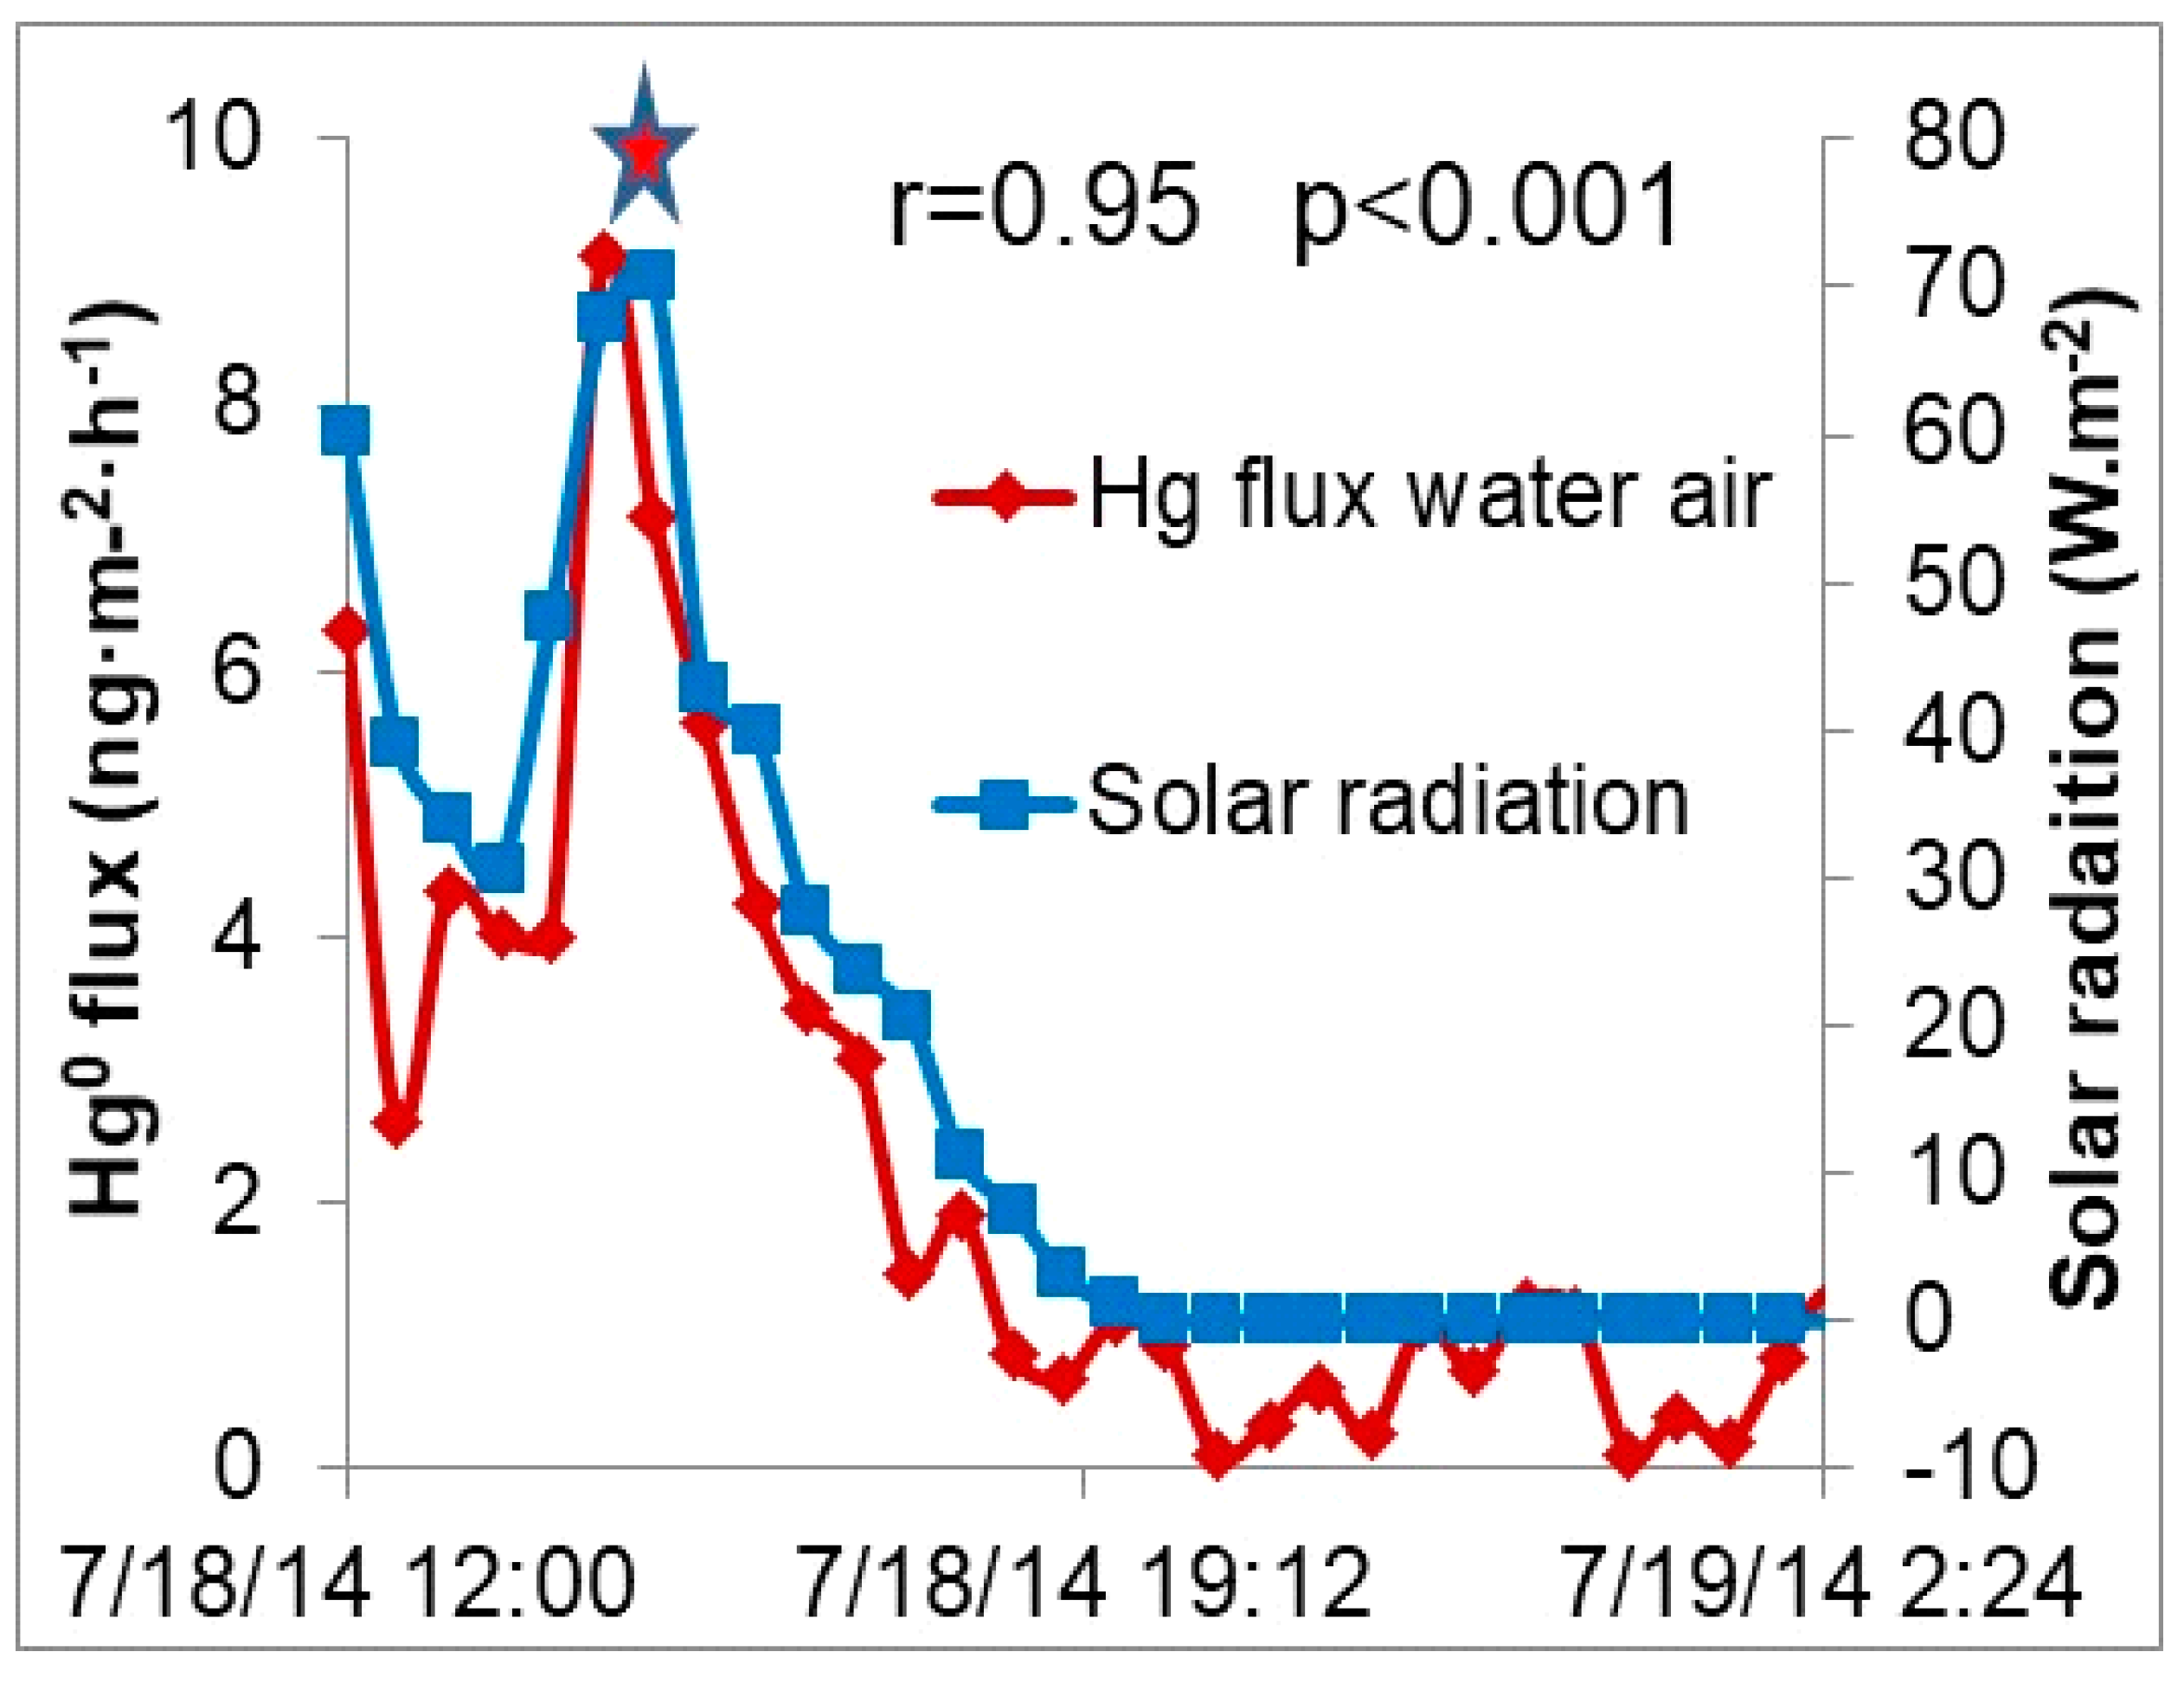
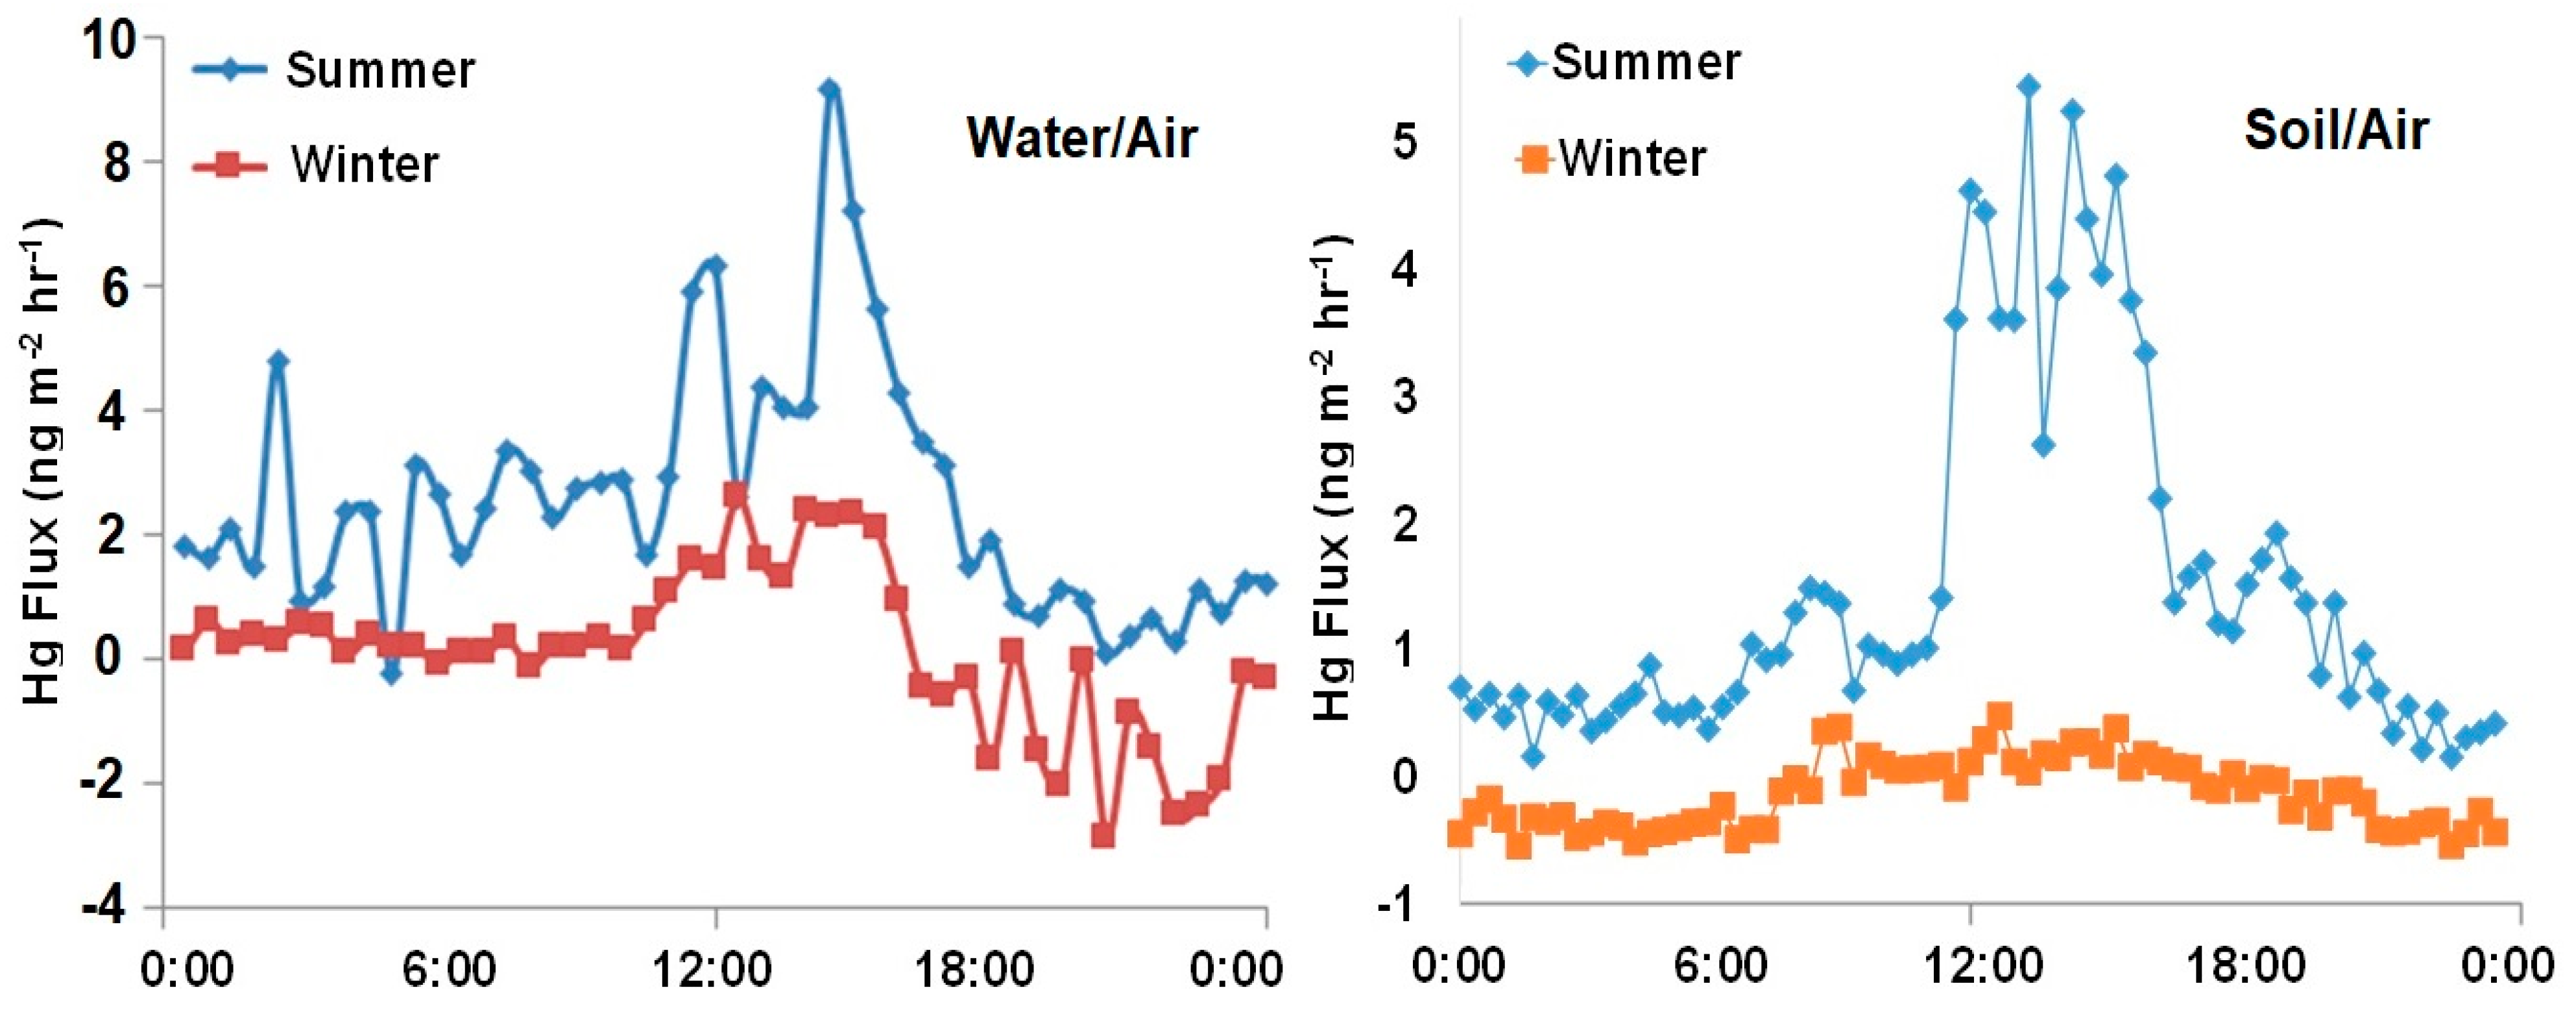
3.5. GEM Fluxes over Wetland Water, Wetland Soil, a Pond and a Mowed Field

At the UMFS, the mean GEM flux over the mowed field was 4.52 ± 4.8 ng m−2 h−1 (range 0.84–15.50) compared to 4.92 ± 2.8 ng m−2 h−1 (range 1.74–13.1) for the wetland soil at Sky Lake. There were 55 data points for UMFS soil, of which 50 were net emissions and 5 were net depositions (Table 3). Similarly, there were 54 data points for soil at the wetland, all of which were net emissions (Table 3).
For water/air exchange, the mean flux over the UMFS pond (2.3 ± 1.9 ng m−2 h−1) was higher than the Sky Lake wetland (0.25 ± 0.49 ng m−2 h−1). The lower flux and higher variability at the wetland may be due to the wetland/forest canopy limiting and fluctuating the intensity of solar radiation reaching the water surface; whereas the UMFS pond was out in the open with no shade. There were 55 data points at the pond, of which 54 were net emissions and 1 was deposition. For the wetland, there were 54 data points, of which 37 were net emissions and 16 were depositions.
In nearly all the cases GEM flux from terrestrial (soil) surfaces were greater than from aquatic (water) surfaces (Figure 3). This is not surprising given the significantly different characteristics of the surfaces and the properties of each media. Moreover, concentrations of Hg in soil are typically orders of magnitude higher than in surface waters. Typical water quality parameters (conductivity, dissolved oxygen, oxidizing-reducing potential and water temperature) varied only slightly over the period flux measurements were conducted. Thus, there was little correlation between the two suggesting that these factors are not controlling Hg exchange between the air/water interface.
The greatest GEM fluxes were observed at maximum solar radiation (Figure 2 and Figure 4), suggesting that thermal and/or photochemical reactions are contributing to the enhanced emissions for both soil/air and water/air interfaces. Relationships between GEM fluxes and four meteorological parameters (solar radiation, temperature, wind speed, and pressure) are given in Table 2. The relatively strong correlation between Hg emission and solar radiation (r = 0.95, p < 0.05), suggests that solar radiation is a primary factor controlling Hg emissions from wetlands. Others have found photo-induced dissolved GEM correlates with incident radiation [25].
Another factor that promotes reduction of dissolved metal ions like Hg+2 in natural waters is dissolved organic carbon (DOC) [26]. DOC can serve to absorb light and transfer energy to an electron acceptor, and thus enhance Hg emission in natural waters containing high levels of DOC [27,28]. Given the high biological productivity in the swamp at Sky Lake, one would expect to find higher levels of DOC in its water compared to the field station pond. However, the emission Hg flux from wetland water was lower than the flux from the pond, perhaps due to the forest canopy limiting radiation reaching the water surface (Table 4).
Solar radiation can also enhance Hg emission by indirectly increasing the overall temperature of the soil and water [11]. The solubility and saturation potential of Hg0 is dependent on temperature, as well as pressure and water salinity [26]. We found a significant correlation between Hg flux and temperature for the UMFS soil (r = 0.67, p < 0.05) but not for the nearby pond, suggesting that the water/air Hg exchange is driven more by photo-reduction than thermal effects. When temperature effects dominate, the evasion is thermodynamically controlled by the enthalpy of volatilization.
GEM emission flux at the UMFS was also correlated with pressure (Table 2) but had weaker linear correlations with wind speed. Both of these factors can affect the dynamics of the Hg exchange at interfaces. As noted, the fluxes at the wetland were more variable, possibly because of the foliage resulted in solar radiation which intermittently hit the surface of the water. Thus, the correlation between Hg flux and meteorological variables for the wetland were generally weaker than for the pond and mowed field (Table 2).

3.6. GEM Fluxes over Agriculture Soils

GEM fluxes over soil from a cotton field in Lafayette County, Mississippi (17.1 ng∙g−1 total-Hg, lowest among the tested soils) ranged from 0.08–5.46 ng m−2 h−1 with a mean of 1.58 ± 1.37 ng m−2 h−1 in the warm season (Table 3). While Hg evasion was observed in the summer, Hg deposition dominated in the winter, with a mean flux of −0.11 ± 0.26 ng m−2 h−1. This seasonal difference is clearly exhibited in Figure 3, and, as discussed earlier, stems from increased intensity of solar radiation and higher temperatures (Table 4). Overall, our results for agricultural soils are similar to those reported for agricultural fields in North Dakota (−1.4–5.0 ng m−2 h−1) [23] and Canada (1.1–2.9 ng m−2 h−1) [29]. However, the fluxes are lower than those measured in Guangzhou, China (135 ng m−2 h−1) and Sichuan, China ((−4.1)–132 ng m−2 h−1) [21,22].
During the summer, mean GEM emission fluxes over Dundee and Dowling soils were 0.32 ± 0.57 ng m−2 h−1 and 0.55 ± 1.48 ng m−2 h−1, respectively (Table 3). For Dundee soil, ~67% of the data points were net emissions, whereas for Dowling soil less than half (48%) were emissions, and the median flux was near neutral. The differences observed for these two soil types, obtained from the same general area, suggests that soil texture and structure can be important factors governing Hg emission fluxes. Fluxes for both of these soils were lower in the winter, with the majority of the data showing a net deposition. The Delta soils are only moderately permeable and are relatively acidic which may influence Hg fluxes as follows. Acidic soil strongly binds Hg+2 reducing volatilization and photo-reduction, while high permeability facilitates soil–air Hg gas exchange [2,30].

3.7. Summary of Seasonal Differences for GEM Fluxes

We found that GEM deposition was greater during the winter compared to the summer for all landscapes (Figure 5). Indeed, both day and night emission rates were higher during the summer suggesting that both temperature and solar radiation are contributing factors for Hg gas exchange. For example, in the summer, water/air GEM fluxes over the pond ranged from (−0.25) to 9.12 ng m−2 h−1 and the predominant flux of was emission, with a mean of 2.3 ± 1.9 ng m−2 h−1. The flux diminished in the winter season with an average of 0.12 ± 0.71 ng m−2 h−1. In summer, the Hg fluxes over the same pond were strongly correlated solar radiation (r = 0.95, p < 0.05), and pressure (r = 0.91, p < 0.05). In contrast, the fluxes in winter were only correlated with solar radiation (r = 0.38, p < 0.05).

3.8. Comparison of GEM Fluxes between Landscapes and with Other Studies Worldwide

Here we show the differences for GEM emission fluxes between the Mississippi soils, focusing on summer because of low fluxes in the winter. There were significant differences for GEM fluxes among the soils during both day and night (Table 5). Hg emission fluxes were highest for grass, followed by wetland, agriculture and forest, although the difference between forest and at least one of the agricultural soils from the Delta was not significant. While there were strong correlations between Hg flux and some environmental variables (as described above for each individual habitat), none of the correlations negated the habitat differences, which means that some unmeasured variable accounts for at least some of the differences among habitats.
Whereas this work presents and discusses the first study of air/soil Hg gas exchange measurements in Mississippi, others have conducted similar measurements over various surfaces worldwide (Table S3). In general, the Hg flux measured from the loblolly forest floor (0.50 ± 1.20 ng m−2 h−1) is comparable to other measurements from forest soils: ~1.0 ng m−2 h−1 [24], 0.9 ± 0.2 ng m−2 h−1 [23], and ~2.2 ng m−2 h−1 [28]. Hg fluxes from Mississippi agriculture soils are similar to the value of 1.1–2.9 ng m−2 h−1 reported for agricultural soil from Canada [31], but are lower than measurements from Guangzhou and Sichuan, China [21,22]. For grass, our mean Hg flux was higher than reported by Ericksen [23], but lower than the 1–8.3 ng m−2 h−1 reported by Poissant [31] and −18.7–13.4 ng m−2 h−1 reported by Fu [21], though the species of grass varied between studies. Our wetland Hg flux was higher than fluxes reported for wetlands by Kyllönen [32].

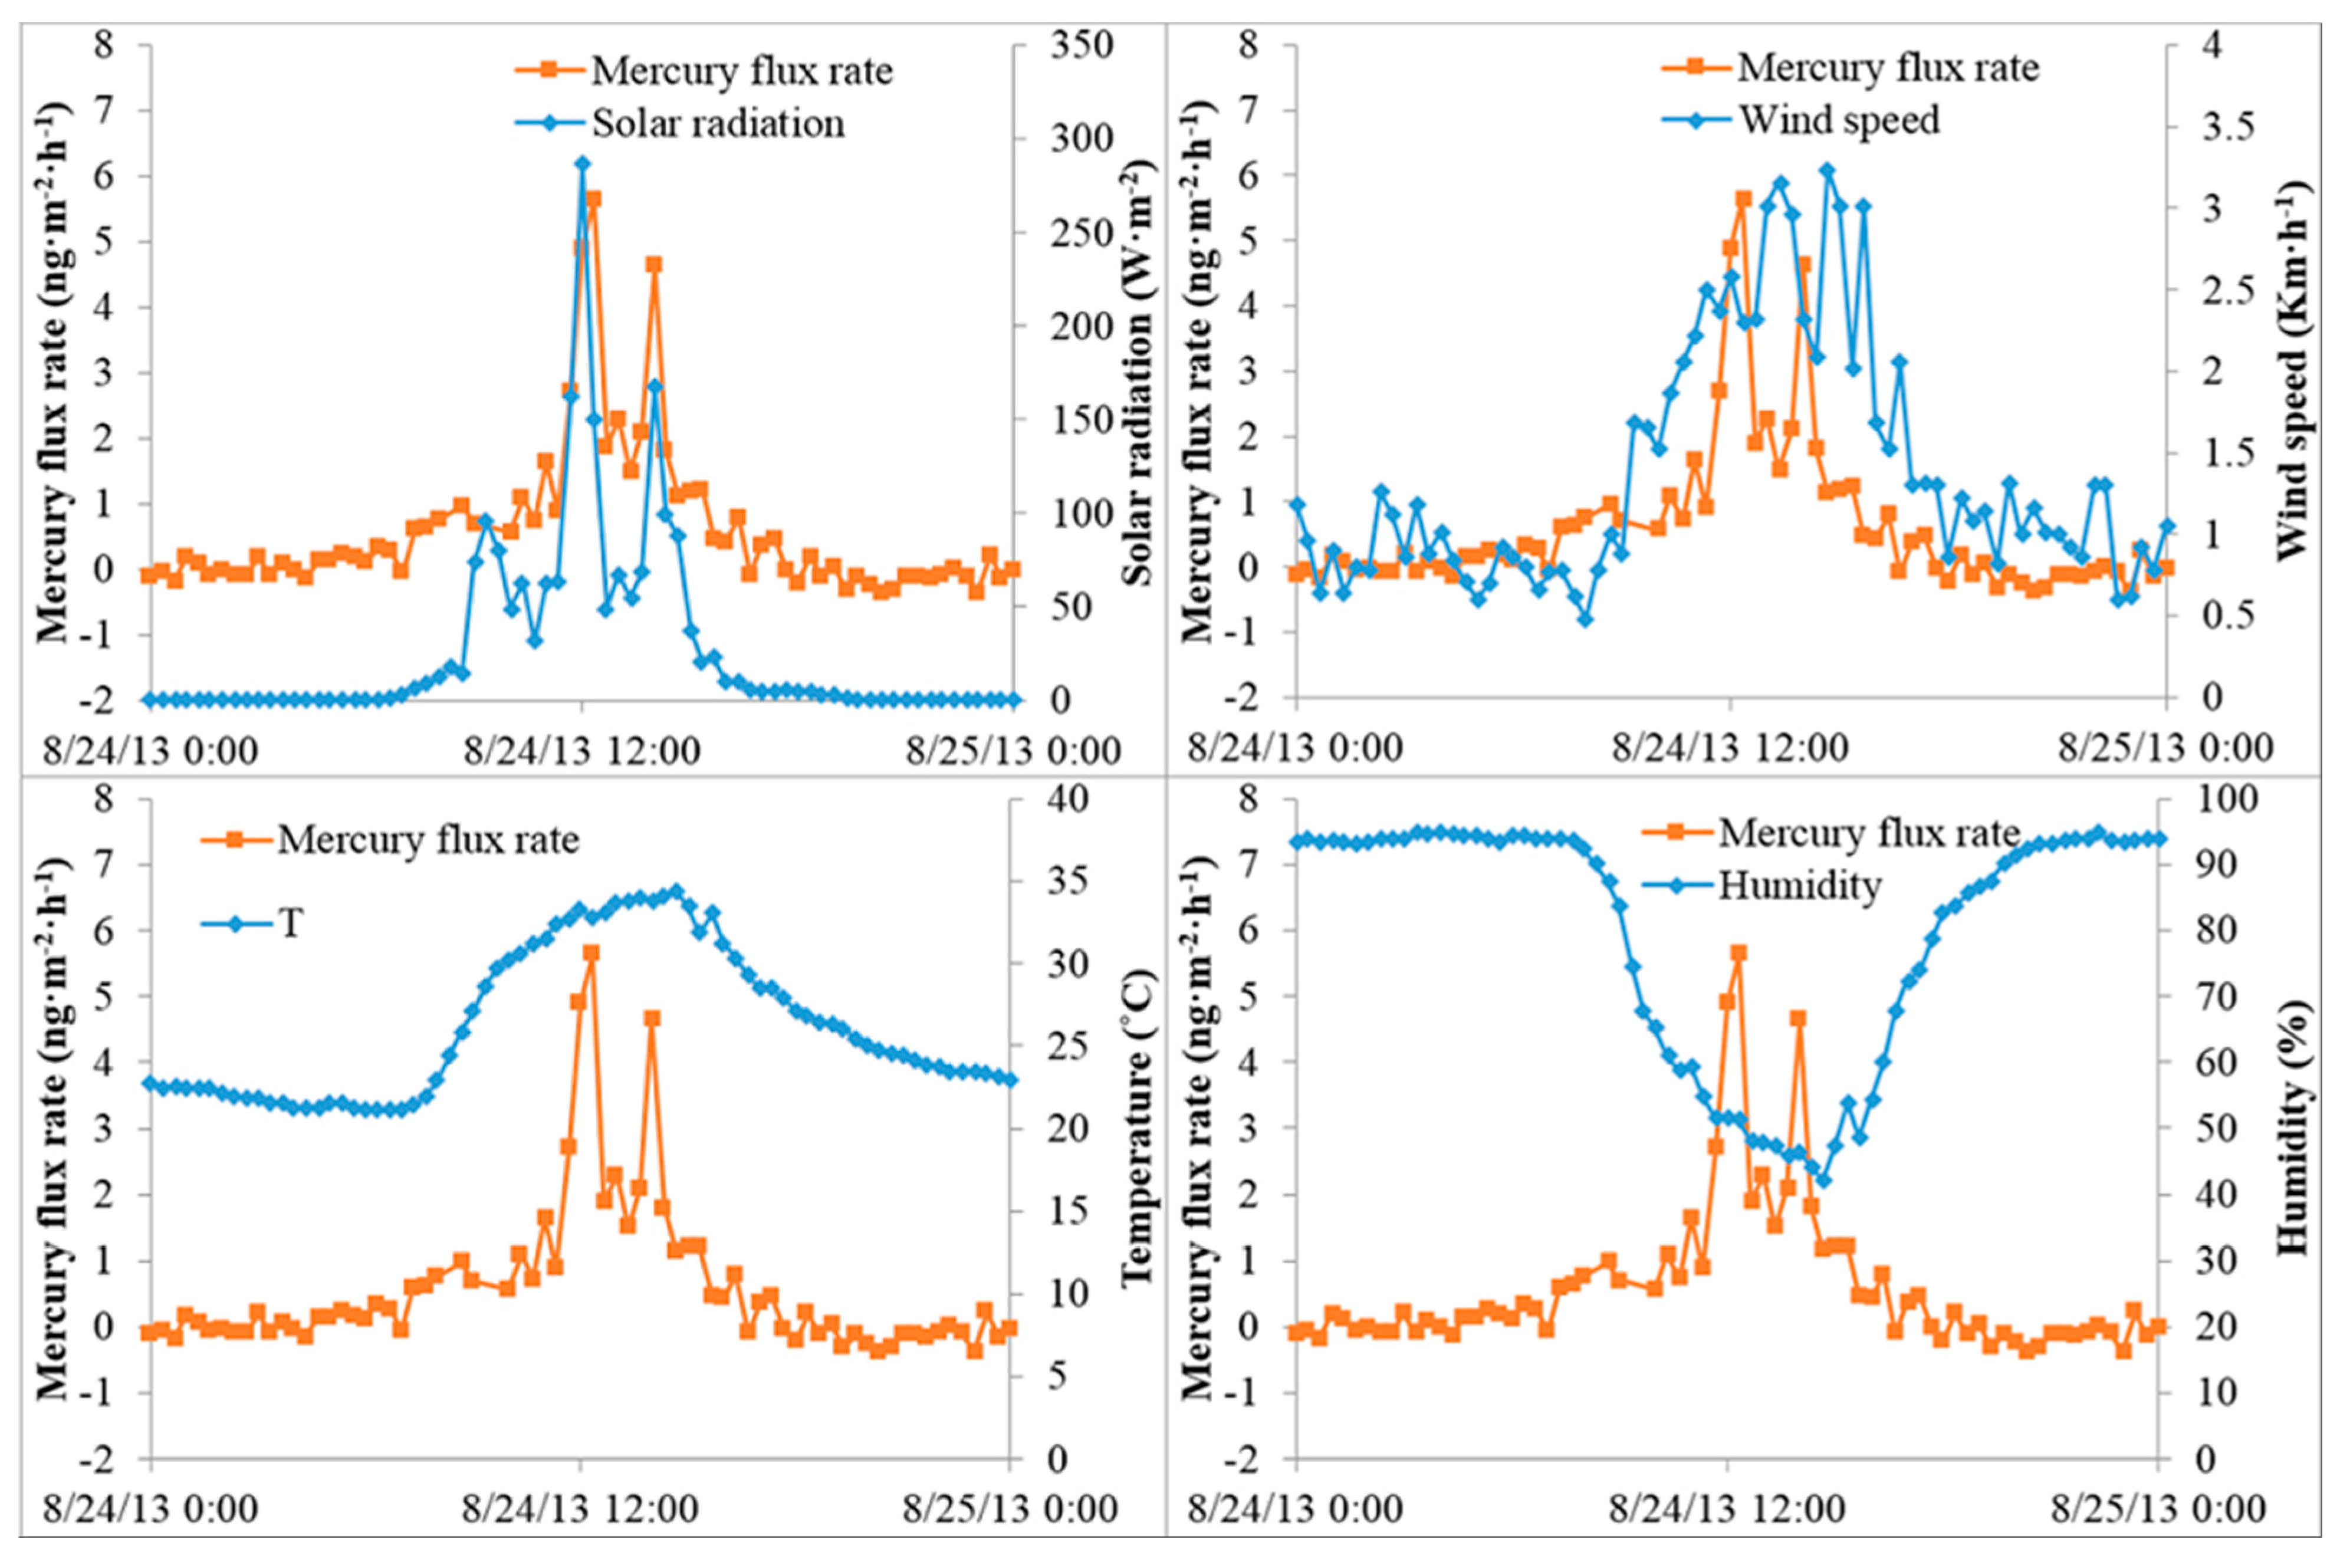
3.9. Impact of Soil Temperature on Hg Air–Surface Exchange

Clear diurnal patterns of Hg emission fluxes were observed for each soil (especially in summer), with maximum flux rates at midday and minimum fluxes during the night. This cycle has been attributed to three primary meteorological parameters: solar radiation, soil temperature, and to a lesser extent humidity [18,21]. Previous studies have documented an exponential relationship between Hg flux and soil temperature, and has been attributed to physicochemical characteristics of elemental Hg (high vapor pressure and low water solubility) and photo-induced reactions [2,33]. A study conducted on Hg enriched soil found that as soil temperature increased Hg flux increased by a similar magnitude [34]. Gustin [35] suggested that elevated temperature could accelerate Hg desorption from soil and movement up through the soil column. Schlüter [36] suggested that the rise of soil temperature would increase the activity of Hg+2, facilitating the photo-reduction to Hg0.
The apparent activation energy (Ea) can help elucidate the processes driving the evasion of Hg from soils. The approach has been described elsewhere [9,37]. Briefly, Ea is considered the energy which the system must absorb in order to initiate a Hg flux increase [2]. Even though multiple mechanisms may be involved in Hg absorption/desorption over the soils, the approach is used to describe the general temperature dependence of kinetic constants for various processes [21,37]. Assuming that the transfer of Hg0 from soil to atmosphere is governed by a pseudo-first order reaction, the reaction rate of Hg flux over the soil surface can be described using the Arrhenius relationship with activation energy (Equation (2)):
Ln(F) = Ln(A) − Ea/RT
where F is Hg flux, R is the gas constant (1.9872 cal∙K−1∙mol−1), T is the soil temperature in Kelvin, A is a pre-exponential factor (a frequency factor or the number of times Hg atoms gain sufficient energy to be thermally desorbed from the surface), and Ea is the apparent activation energy. Thus, Ea can be calculated by fitting the Arrhenius equation to the data for the measured fluxes at different soil temperatures. When Ea is close to the enthalpy of volatilization (~14.5 kcal∙mol−1 at 20 °C) fluxes are likely controlled by direct emission of elemental Hg from the soil surface, whereas if the Ea is higher (~30 kcal∙mol−1, for example) then other processes, such as the conversion of Hg+2 to Hg0, are involved [9,37]. For example, higher Ea values (dark measurements) have been found for Hg contaminated sites where HgS is the predominant form of Hg [33,38].
Others proposed that there are at least two sources of Hg0 emitted from soil, a natural “pool” of Hg0 which is primarily adsorbed on surfaces, and Hg+2 which can be photo-chemically reduced to Hg0 by sunlight [2]. The later process seems to be enhanced in soils with higher levels of organic matter [2]. Thus, under “dark” conditions the primary factor leading to emission of Hg from soils is likely related to the enthalpy of volatilization, whereas under “light” conditions emissions are related to both enthalpy of volatilization (warming soil) and photo-reduction processes.
Here, we found a significant correlation between Hg fluxes and soil temperature (r = 0.92) over forest soil in the summer (Figure 6). The activation energy for Hg emission over forest soil was estimated to be 31.3 kcal∙mol−1 using the Arrhenius equation, which is comparable to other published soil Hg activation energies: 18.6–69.1 kcal∙mol−1 [33] and 14.6–29.4 kcal∙mol−1 [18,19] and for background soils [23]. Thus, while solar radiation was driving Hg emission during daylight, soil temperature was the most important factor at night.

4. Conclusions

This work represents the first measurements of the exchange of GEM between air/soil and air/water for different landscapes in the mid-south, USA. Fluxes exhibited both seasonal and diurnal patterns. Soils served primarily as sources of Hg to the air during the summer and as sinks during the winter. Clear diurnal patterns of Hg flux were also observed, especially during the summer season, with the maximum flux at midday and the minimum flux at night. Fluxes had significant correlations with solar radiation, temperature and humidity. Other meteorological parameters had negligible to no influence on flux rates. Hg emissions generally followed the pattern: grass > wetland soil > mowed field > pond > wetland water ≈ forest ≈ agriculture soils. Hg flux rates were in the range reported for background soils for similar landscapes outside the region. Overall, our data supports prior findings on relationships between environmental conditions and Hg fluxes from terrestrial and aquatic surfaces. To scale up emission estimates from such landscapes requires a larger data set to reduce uncertainties.

Supplementary Materials

The following are available online at https://www.mdpi.com/2073-4433/10/9/538/s1: Table S1: Total-Hg and loss-on-ignition (LOI) data for study soils; Table S2: Ambient air GEM (ng m−3) concentrations at each site; Table S3: Hg fluxes and ancillary data for natural landscapes worldwide; Figure SI: Mercury flux and ambient air Hg concentrations over agricultural soil from Lafayette County, Mississippi.

Author Contributions

J.C. and Y.J. conceptualized the study, carried out field measurements and data interpretation, and were the main authors of the manuscript. D.N. was involved in the measurement campaign for Sky Lake and the Field Station. S.B. provided data analysis. Z.G. provided data interpretation and editing. J.C. supervised and was project administrator.

Funding

The Hg vapor analyser used in this study was funded by the U.S. Environmental Protection Agency (Grant #CD-95450510-0).

Acknowledgments

We thank L. Hawkins and E. Prestbo (Tekran Inc.) for technical advice, and M. Gustin and A. Carpi for sharing dynamic flux chambers. Zhen Guo helped with the meteorological data collection. We thank colleagues at the U.S. Department of Agriculture (National Sedimentation Laboratory) for providing the Delta soils.

Conflicts of Interest

The authors declare no conflict of interest.

References

  1. Schroeder, W.H.; Munthe, J. Atmospheric mercury—An overview. Atmos. Environ. 1998, 32, 809–822. [Google Scholar] [CrossRef]
  2. Gustin, S.M.; Coolbaugh, M.; Engle, M.; Fitzgerald, B.; Keislar, R.; Lindberg, S.; Nacht, D.; Quashnick, J.; Rytuba, J.; Sladek, C.; et al. Atmospheric mercury emissions from mine wastes and surrounding geologically enriched terrains. Environ. Geol. 2003, 43, 339–351. [Google Scholar] [CrossRef]
  3. Engle, M.A.; Gustin, M.S.; Goff, F.; Counce, D.A.; Janik, C.J.; Bergfeld, D.; Rytuba, J.J. Atmospheric mercury emissions from substrates and fumaroles associated with three hydrothermal systems in the western United States. J. Geophys. Res. 2006, 111, D17304. [Google Scholar] [CrossRef]
  4. Sommar, J.; Zhu, W.; Lin, C.-J.; Feng, X. Field approaches to measure Hg exchange between natural surfaces and the atmosphere—A Review. Crit. Rev. Environ. Sci. Technol. 2013, 43, 1657–1739. [Google Scholar] [CrossRef]
  5. Gustin, M.S.; Kolker, A.; Gårdfeldt, K. Transport and fate of mercury in the environment. Appl. Geochem. 2008, 23, 343–344. [Google Scholar] [CrossRef]
  6. Fitzgerald, W.F.; Engstrom, D.R.; Mason, R.P.; Nater, E.A. The case for atmospheric mercury contamination in remote areas. Environ. Sci. Technol. 1998, 32, 1–7. [Google Scholar] [CrossRef]
  7. Davidson, G.R.; Carnley, M.; Lange, T.; Galicki, S.J.; Douglas, A. Changes in sediment accumulation rate in an Oxbow Lake following late 19th century clearing of land for agricultural use: A 210Pb, 137Cs, and 14C study in Mississippi, USA. Radiocarbon 2004, 46, 755–764. [Google Scholar] [CrossRef]
  8. Davidson, G.R.; Laine, B.C.; Galicki, S.J.; Threlkeld, S.T. Root-zone hydrology: Why bald cypress in flooded wetlands grow more when it rains. Tree-Ring Res. 2006, 62, 3–13. [Google Scholar] [CrossRef]
  9. United States Department of Agriculture (USDA). Major Land Resource Regions Custom Report. In USDA Agricultural Handbook; USDA: Washington, DC, USA, 2006; p. 296. [Google Scholar]
  10. Carpi, A.; Lindberg, S.E. Sunlight-mediated emission of elemental mercury from soil amended with municipal sewage sludge. Environ. Sci. Technol. 1997, 31, 2085–2091. [Google Scholar] [CrossRef]
  11. Carpi, A.; Lindberg, S.E. Application of a TeflonTM dynamic flux chamber for quantifying soil mercury flux: Tests and results over background soil. Atmos. Environ. 1998, 32, 873–882. [Google Scholar] [CrossRef]
  12. Lindberg, S.E.; Price, J.L. Airborne emissions of mercury from municipal landfill operations: A short-term measurement study in Florida. J. Air Waste Manag. Assoc. 1999, 49, 520–532. [Google Scholar] [CrossRef] [PubMed]
  13. Eckley, C.S.; Gustin, M.; Lin, C.J.; Li, X.; Miller, M.B. The influence of dynamic chamber design and operating parameters on calculated surface-to-air mercury fluxes. Atmos. Environ. 2010, 44, 194–203. [Google Scholar] [CrossRef]
  14. Cizdziel, J.V.; Hinners, T.A.; Heithmar, E.M. Determination of total Hg in fish tissues using combustion atomic absorption spectrometry with gold amalgamation. Water Air Soil Pollut. 2002, 135, 357–372. [Google Scholar] [CrossRef]
  15. Chen, J.; Chakravarty, P.; Davidson, G.R.; Wren, D.G.; Locke, M.A.; Zhou, Y.; Brown, G., Jr.; Cizdziel, J.V. Simultaneous Determination of Mercury and Organic Carbon using a Direct Mercury Analyzer based on Thermal Decomposition—Atomic Absorption Spectrophotometry. Anal. Chim. Acta 2015, 871, 9–17. [Google Scholar] [CrossRef] [PubMed]
  16. Kuiken, T.; Zhang, H.; Gustin, M.; Lindberg, S. Mercury emission from terrestrial background surfaces in the eastern USA. II: Air/surfaces exchange of mercury within forests from South Carolina to New England. Appl. Geochem. 2008, 23, 356–368. [Google Scholar] [CrossRef]
  17. Nacht, D.M.; Gustin, M.S. Mercury emissions from background and altered geologic units throughout Nevada. Water Air Soil Pollut. 2004, 151, 179–193. [Google Scholar] [CrossRef]
  18. Poissant, L.; Pilote, M.; Constant, P.; Beauvais, C.; Zhang, H.H.; Xu, X. Mercury gas exchanges over selected bare soil and flooded sites in the bay St. Francois wetlands (Quebec, Canada). Atmos. Environ. 2004, 38, 4205–4214. [Google Scholar] [CrossRef]
  19. Zhang, H.; Lindberg, S.E.; Marsik, F.J.; Keeler, G.J. Mercury air/surface exchange kinetics of background soils of the Tahquamenon river watershed in the Michigan upper peninsula. Water Air Soil Pollut. 2001, 126, 151–169. [Google Scholar] [CrossRef]
  20. Edwards, G.C.; Howard, D.A. Air-surface exchange measurements of gaseous elemental mercury over naturally enriched and background terrestrial landscapes in Australia. Atmos. Chem. Phys. 2013, 13, 5325–5336. [Google Scholar] [CrossRef] [Green Version]
  21. Fu, X.; Feng, X.; Wang, S. Exchange fluxes of Hg between surfaces and atmosphere in the eastern flank of Mount Gongga, Sichuan province, southwestern China. J. Geophys. Res. 2008, 113, D20306. [Google Scholar] [CrossRef]
  22. Fu, X.; Feng, X.; Zhang, H.; Yu, B.; Chen, L. Mercury emissions from natural surfaces highly impacted by human activities in Guangzhou province, South China. Atmos. Environ. 2012, 54, 185–193. [Google Scholar] [CrossRef]
  23. Ericksen, J.A.; Gustin, M.S.; Xin, M.; Weisberg, P.J.; Fernandez, G.C.J. Air/soil exchange of mercury from background soils in the United States. Sci. Total Environ. 2006, 366, 851–863. [Google Scholar] [CrossRef] [PubMed]
  24. Choi, H.D.; Holsen, T.M. Gaseous mercury fluxes from the forest floor of the Adirondacks. Environ. Pollut. 2009, 157, 592–600. [Google Scholar] [CrossRef] [PubMed]
  25. Amyot, M.; Mierle, G.; Lean, D. Sunlight-induced formation of dissolved gaseous Hg in lake waters. Environ. Sci. Technol. 1994, 28, 2366–2371. [Google Scholar] [CrossRef] [PubMed]
  26. Zhu, J.; Wang, D.Y.; Ming, M.A. Mercury release flux and its influencing factors at the air-water interface in paddy field in Chongqing, China. Chin. Sci. Bull. 2013, 58, 266–274. [Google Scholar] [CrossRef]
  27. Nriagu, J.O. Mechanistic steps in the photoreduction of mercury in natural waters. Sci. Total Environ. 1994, 149, 167–181. [Google Scholar] [CrossRef]
  28. Cost, M.; Liss, P. Photoreduction of mercury in seawater and its possible implications for Hg air-sea fluxes. Mar. Chem. 1999, 68, 87–95. [Google Scholar] [CrossRef]
  29. Schroeder, W.H.; Beauchamp, S.; Edwards, G.; Poissant, L.; Rasmussen, P.; Tordon, R.; Dias, G.; Kemp, J.; Van Heyst, B.; Banic, C.M. Gaseous mercury emissions from natural sources in Canadian landscapes. J. Geophys. Res. 2005, 110, D18302. [Google Scholar] [CrossRef]
  30. Gu, B.; Bian, Y.; Miller, C.L.; Dong, W.; Jiang, X.; Liang, L. Mercury reduction and complexation by natural organic matter in anoxic environments. Proc. Natl. Acad. Sci. USA 2011, 108, 1479–1483. [Google Scholar] [CrossRef] [Green Version]
  31. Poissant, L.; Casimir, A. Water–air and soil–air exchange rate of total gaseous mercury measured at background sites. Atmos. Environ. 1998, 32, 883–893. [Google Scholar] [CrossRef]
  32. Kyllönen, K.; Hakola, H.; Hellén, H.; Korhonen, M.; Verta, M. Atmospheric Mercury Fluxes in a Southern Boreal Forest and Wetland. Water Air Soil Poll. 2012, 223, 1171–1182. [Google Scholar] [CrossRef]
  33. Feng, X.; Wang, S.; Qiu, G.; Hou, Y.; Tang, S. Total gaseous mercury emissions from soil in Guiyang, Guizhou, China. J. Geophys. Res. 2005, 110, D14306. [Google Scholar] [CrossRef]
  34. Moore, C.; Carpi, A. Mechanisms of the emission of mercury from soil: Role of UV radiation. J. Geophys. Res. 2005, 110, D24302. [Google Scholar] [CrossRef]
  35. Gustin, M.S.; Ericksen, J.A.; Schorran, D.E.; Johnson, D.W.; Lindberg, S.E.; Coleman, J.S. Application of controlled mesocosms for understanding mercury air/soil-plant exchange. Environ. Sci. Technol. 2004, 38, 6044–6050. [Google Scholar] [CrossRef] [PubMed]
  36. Schlüter, K. Review: Evaporation of mercury from soils. An integration and synthesis of current knowledge. Environ. Geol. 2000, 39, 249–271. [Google Scholar] [CrossRef]
  37. Kocman, D.; Horvat, M. A laboratory based experimental study of mercury emission from contaminated soils in the River Idrijca catchment. Atmos. Chem. Phys. 2010, 10, 1417–1426. [Google Scholar] [CrossRef] [Green Version]
  38. Bahlmann, E.; Ebinghaus, R.; Ruck, W. Development and application of a laboratory flux measurement system (LFMS) for the investigation of the kinetics of mercury emissions from soils. J. Environ. Manag. 2006, 81, 114–125. [Google Scholar] [CrossRef]
Figure 1. Photos showing the dynamic flux chamber for air/water and soil/air measurements. Also shown is the direction of air flow, light meter, ambient air inlet and YSI water quality probe.
Atmosphere 10 00538 g001
Figure 2. Relationship between gaseous elemental mercury (GEM) flux and solar radiation (top left), wind speed (top right), air temperature (lower left), and humidity (lower right) at a loblolly pine forest in Mississippi during the summer.
Atmosphere 10 00538 g002
Figure 3. Concurrent gaseous elemental mercury (GEM) fluxes over a pond and adjacent mowed field at the University of Mississippi (UM) Field Station.
Atmosphere 10 00538 g003
Figure 4. Gaseous elemental mercury (GEM) emissions from the pond were highly correlated with solar radiation, with the greatest flux at maximum solar radiation (star).
Atmosphere 10 00538 g004
Figure 5. Examples of seasonal differences for gaseous elemental mercury (GEM) fluxes over the course of a day. Pond water/air fluxes (left) and agricultural soil/air fluxes (right).
Atmosphere 10 00538 g005
Figure 6. Arrhenius relationship between GEM flux and soil temperature over a loblolly pine forest floor in Mississippi during the summer.
Atmosphere 10 00538 g006
Table 1. General description and location of sampling sites.
SurfaceDescriptionLocationLatitudeLongitude
Grass aResidential lawnLafayette County, MS34.379189−89.601822
Agricultural Soil bCotton field34.272125−89.522294
Pond Water aUMFS c34.432188−89.391557
Mowed Field aUMFS34.432190−89.391559
Wetland Soil bUM Campus Trail34.351175−89.555886
Forest aLoblolly Pine34.379406−89.601697
Agricultural Soil bDundee SeriesMississippi Delta33.395056−90.682278
Agriculture Soil bDowling Series33.389972−90.682028
Wetland Soil aSky Lake33.228820−90.487100
Wetland Water aSky Lake33.228822−90.487102
a In situ measurements; b Mesocosm measurements; c Univ. of Mississippi Field Station.
Table 2. Pearson correlations for gaseous elemental mercury (GEM) fluxes with meteorological parameters and ambient GEM concentrations. Numbers that are italic and red have p values < 0.05.
SeasonSiteTemp.PressureHumidityWindSolar Rad.GEM
SummerForest0.66−0.15−0.690.530.900.61
Grass0.250.08−0.340.070.760.18
Wetland soil0.580.52NA (not available)0.050.36NA
Wetland water0.310.22NA0.070.08NA
Pond0.120.38NA0.340.95NA
Mowed field0.670.91NA0.130.81NA
Agriculture0.770.32−0.800.670.900.63
Delta (Dundee)0.77−0.06−0.710.280.770.29
Delta (Dowling)0.81−0.08−0.800.620.920.62
WinterForest−0.090.08−0.060.05NA *−0.47
Grass0.580.26−0.260.300.40−0.64
Pond0.04−0.80NA0.100.38NA
Agriculture0.80−0.35−0.800.470.750.69
Delta (Dundee)−0.150.30−0.36−0.110.36−0.56
Delta (Dowling)0.52−0.07−0.550.050.530.43
* Power failure prevented measurements. Measurements were not collected at the wetland in the winter due to logistical issues.
Table 3. Summary statistics for air/surface gaseous elemental mercury (GEM) exchange rates over landscapes in Mississippi.
SiteHg Flux (ng m−2 h−1)n Emission
RangeMedianMean ± SD *(Deposition)
Summer
Forest(−0.93) to 6.710.040.50 ± 1.2073 (66)
Grass (lawn)1.34 to 11.414.184.38 ± 1.71125 (0)
Wetland soil1.74 to 13.14.104.92 ± 2.854 (0)
Wetland water(−0.87) to 11.80.260.25 ± 0.4937 (16)
Field Station Pond(−0.25) to 9.11.822.3 ± 1.954 (1)
Mowed field(−0.84) to 15.52.204.52 ± 4.850 (5)
Agriculture0.08 to 5.461.101.58 ± 1.37157 (0)
Delta (Dundee)(−0.58) to 2.470.180.32 ± 0.5754 (31)
Delta (Dowling)(−0.52) to 4.87−0.070.55 ± 1.4833 (36)
Winter
Forest(−0.50) to 0.12−0.17−0.19 ± 0.146 (69)
Grass(−0.94) to 0.22−0.32−0.32 ± 0.259 (64)
Field Station Pond(−2.87) to 2.580.120.12 ± 0.71125 (73)
Agriculture(−0.52) to 0.50−0.09−0.11 ± 0.2627 (50)
Delta (Dundee)(−0.43) to 0.30−0.03−0.03 ± 0.1433 (45)
Delta (Dowling)(−0.64) to 0.24−0.2−0.20 ± 0.2317 (54)
* SD = Standard Deviation.
Table 4. Mean gaseous elemental mercury (GEM) fluxes and meteorological parameters for the study sites during the measurement campaign. Winter measurements were not collected at the wetland due to logistical issues. A single set of meteorological measurements was collected at the wetland and University of Mississippi Field Station sites.
SiteHg Flux (ng m−2 h−1)Solar Rad. (W m−2)Air Temp. (°C)Relative Humidity (%)Wind Speed (km∙h−1)
Summer
Forest0.50 ± 1.2025 ± 5226.4 ± 4.279 ± 181.54 ± 0.79
Grass (lawn)4.38 ± 1.7133 ± 7023.8 ± 4.878 ± 181.82 ± 0.97
Wetland soil4.92 ± 2.801.5 ± 2.723.2 ± 3.587 ± 120.63 ± 0.21
Wetland water0.25 ± 0.491.5 ± 2.723.2 ± 3.587 ± 120.63 ± 0.21
Field Station Pond2.3 ± 1.938 ± 7119.1 ± 0.792 ± 142.11 ± 1.54
UMFS Mowed field4.52 ± 4.838 ± 7119.1 ± 0.792 ± 142.11 ± 1.54
Agriculture1.58 ± 1.3784 ± 13424.9 ± 5.770 ± 221.90 ± 0.89
Delta (Dundee)0.32 ± 0.5759 ± 8824.5 ± 3.177 ± 122.72 ± 1.20
Delta (Dowling)0.55 ± 1.4853 ± 10024.5 ± 4.677 ± 192.16 ± 1.14
Winter
Forest−0.19 ± 0.14NA *10.4 ± 2.163 ± 71.84 ± 0.50
Grass (lawn)−0.32 ± 0.2566 ± 1246.8 ± 1.674 ± 242.02 ± 0.84
Pond0.12 ± 0.7146.7 ± 85.67.1 ± 6.975 ± 221.31 ± 0.79
Agriculture−0.11 ± 0.2636 ± 455.7 ± 7.171 ± 231.40 ± 0.91
Delta (Dundee)−0.03 ± 0.1445 ± 773.3 ± 1.877 ± 51.63 ± 0.47
Delta (Dowling)−0.20 ± 0.2335 ± 503.4 ± 4.170 ± 241.92 ± 0.51
* NA = Not Available (power failure prevented measurements).
Table 5. Differences air/surface Hg fluxes (ng m−2 h−1) between landscapes during the summer. LS = least squares mean from analysis of covariance (ANCOVA). Soils not connected by the same letter are significantly different (p < 0.05).
Mississippi SoilsLS Mean DaySignificanceLS Mean NightSignificance
Grass2.04A1.86A
Wetland (Lafeyette) a1.60B1.30B
Agriculture a1.41C1.12C
Delta (Dundee) a1.31D0.99D
Delta (Dowling) a1.36C, D0.75E
Forest 1.21D0.82E
a Sky Lake and UMFS were not included because they were measured in a different year.

