Article

Reduction of Bioaerosols Emitted from a Swine Confinement Building by a Percolating Biofilter During a 10-Month Period

1
Département de Biochimie, de Microbiologie, et de Bio-Informatique, Faculté des Sciences et de Génie, Université Laval, Québec, QC G1V 0A6, Canada
2
Centre de Recherche de l’Institut Universitaire de Pneumologie et de Cardiologie, Université Laval, Québec, QC G1V 4G5, Canada
3
Research and Development Institute for the Agri-Environment (IRDA), Québec, QC G1P 3W8, Canada
*
Author to whom correspondence should be addressed.
Atmosphere 2019, 10(9), 525; https://doi.org/10.3390/atmos10090525
Submission received: 4 July 2019 / Revised: 21 August 2019 / Accepted: 4 September 2019 / Published: 6 September 2019
(This article belongs to the Special Issue Detection and Monitoring of Bioaerosols)

Abstract

:
The release of pathogens into the air from swine confinement buildings are mitigated through preventative measures, such as outgoing air filtration, to reduce the risk of spread to nearby barns and communities. The present study aims to characterize the effectiveness of a percolating biofilter developed by the Research and Development Institute for the Agri-environment (IRDA) to capture airborne contaminants, such as bacteria and viruses emitted from a swine finishing room. Over a 10-month period (summer, fall, and winter), air was sampled upwind and downwind of the biofilter using two wet walled cyclonic samplers. Culture-dependent and molecular biology analyses were used to track changes in microbial concentrations and populations both captured and emitted by the percolating biofilter. Results revealed a minor reduction (median reduction efficiency 14.4%) in culturable bacteria. There was a decrease in total bacteria (qPCR) (75.0%) and other qPCR targeted organisms: archaea (42.1%), coliphages (25.6%), Enterococcus (76.1%), and Escherichia coli (40.9%). The community analyses showed similar bacterial diversity in the air upwind and downwind of the biofilter although more Proteobacteria were present downwind of the unit, likely attributable to the Proteobacteria-rich nutritive solution. Evidence is provided for bioaerosols reduction by a percolating biofilter treating air from a swine fattening-finishing room.

1. Introduction

The swine industry in Canada exported approximately $4 billion worth of pork products and $465 million in live pigs in 2017 [1], a financial portrait achieved by an industry continually moving away from small farms to large-scale operations [2]. The increased number of pigs per building leads to larger amounts of air contaminants generated by swine confinement buildings (SCB) potentially posing a risk to surrounding farms and communities [3]. SCB emit contaminants such as dust particles, unpleasant odours, ammonia, hydrogen sulfide, various organic compounds and bioaerosols [4]. Bioaerosols are airborne particles containing whole or components of living organisms such as bacteria, archaea, fungi, and viruses. The bacterial fraction in swine buildings are likely derived from the feces [5,6] and, consequently, workers may be exposed to and inhale pathogens [7,8]. These bioaerosols are capable of being emitted from SCB and travelling kilometers and, therefore, may pose serious concerns for neighboring farms, workers, and surrounding communities [9]. Efforts are deployed to enhance public acceptability of SCB by controlling environmental emissions [10,11,12,13]. When examining air filtration methods for swine building exhaust air, the ability to remove a wide range of air contaminants, including bioaerosols, should be considered.

1.1. Potential Costs of Disease and Mitigation

Disease outbreaks in SCB can be extremely costly to producers. Post-weaning diarrhea (PWD) caused by Escherichia coli can cause serious economic damages but may be treated with the antimicrobial drug colistin although there has been an increase in colistin-resistance identified in various countries with a link to agricultural usage [14,15]. The use of colistin is not permitted in Canada but is still used as a growth promoter or therapeutically in many countries, including European countries [16]. Alternatives to antibiotics could be breeding strategies for pigs resistant to infection and vaccination [17,18]. Viral infections can be detrimental to the industry, such as Porcine reproductive and respiratory syndrome (PRRS), caused by the PRRS virus (PRRSV), responsible for yearly losses of $130 million in Canada and $664 million in the United States (between 2005 and 2010) [19,20,21]. Also, Porcine circovirus (PCV), the agent responsible for post weaning multisystemic wasting syndrome (PMWS) and PCV-associated diseases, were previously responsible for $560 million in losses between 2004 and 2009 in Canada [19]. PRRSV has been detected up to 10 km from an infected swine building thus constituting a risk for a long-distance spreading during outbreaks [22,23]. These viruses can be controlled through vaccination but the prevention of exposure may be done through sanitation of pig transport vehicles and the treatment of air [19,24,25]. The adoption of biosecurity measures, vaccination, breeding strategies, and the use of antibiotics can mitigate the risk and damages of viral and bacterial outbreaks, although each has its limitations, such as an increased resistance to antibiotics [17,18,19]. Vaccination may be costly and have a variable efficiency against high mutation rate viruses such as RNA viruses. An alternative strategy for protecting herds is the use of air treatment of both incoming and emitted air from SCB. A benefit to the treatment of emitted air is the combination of potential reduction of bioaerosols and other unwanted air contaminants, and the reduced likelihood of spreading diseases to multiple other swine buildings.
Different methods of treating air have been applied with varying degrees of success and include physical, chemical, and biological-based filtration [26]. Biofilters incorporate active biofilms for the intention of utilizing microbial metabolism to reduce airborne contaminants. A biotrickling or percolating biofilter, an air treatment unit (ATU), was designed by the Research and Development Institute for the Agri-environment (IRDA) for treating emitted air from swine buildings [13]. In the ATU, the biofilm develops and matures on an inert support and is maintained active by the constant trickle down of a nutritive solution over the biofilm microbial community. The flow of air is perpendicular to the flow of the nutritive solution which may capture bioaerosols and other air contaminants and collect them to be metabolized on the biofilm (e.g., ammonia). Re-aerosolization of intercepted bioaerosols may also be possible from the circulating nutritive solution. In Canada, due to variation in temperatures and relative humidity during the different seasons, the ATU must be efficient within different operation conditions responding to the variable air flow patterns of swine building ventilation systems. The Pork Production Reference Guide (2000) by the Prairie Swine Centre has recommended ventilation rates from as low as 0.8 CFM (cubic feet per minute) per pig in the winter to 305.1 CFM per pig in the summer (variation in ventilation linked to outside environment (temperature and relative humidity), building, and pig weight) (rates converted to CFM). Rates determined from a study of a swine building in Saskatchewan (Canada) were 182.0 CFM per pig in the beginning of summer and 19.4 CFM per pig in winter (rates converted to CFM) (outdoor temperatures ranged from −22.3 °C to 23.3 °C) [27]. These changes in ventilation rates have previously been found to affect the airborne bacterial amounts within swine buildings which result in a statistical difference of concentrations associated with winter and summer [6].

1.2. Biofiltration of Air

Treatment of emitted air by biofilters composed of microorganisms developing on an inorganic or organic solid media (e.g., woodchips) were proven effective at reducing culturable bacteria (up to 90% reduction on DG18 agar) but at varying effectiveness depending on the solid media used [28]. Additionally, the application of plasma ions was responsible for some reductions of bioaerosols (22% and 25% for culturable bacteria and fungi on tryptic soy agar) although did not significantly reduce ammonia or hydrogen sulfide [29]. The use of acid scrubbers (e.g., sulfuric acid) to reduce alkaline compounds with acids, resulted as well in the decrease of culturable bacteria (70%) [30]. On the other hand, increases in airborne bacteria (279%) cultured on sheep blood agar plates were observed downwind of a biotrickling filter [30]. Even though the ATU developed by the IRDA was designed mainly for ammonia and odour removal, the system was found effective to reduce bacteria quantified by PCR during laboratory-scale experiments [31]. The removal mechanism of bacteria by IRDA’s biotrickling filter is thought to be the impaction of bacteria-laden particulate on the wet surface of the filter bed. The trapped particles are then be removed from the filter bed by the percolating liquid.
It is unclear whether the active biofilm plays a significant role in bioaerosol removal, but it does represent a source of microorganisms that could potentially be emitted into the treated air. This risk should be considered when operating a biotrickling filter, particularly concerning Legionella [32]. Shedding from the internal biofilm could possibly be unraveled by high-throughput 16S rRNA amplicon sequencing and community diversity analyses. Previous studies have established that the air of swine buildings is predominately composed of sequences classified into Firmicutes with Bacteroidetes making up a lesser proportion [5,33,34,35,36]. The proportions of phyla in the air of SCB may vary according to sequencing approach, SCB location, or even the amplified 16S rRNA regions (V1–V3, V3, V3–V4). Kumari et al., (2014) evaluated the changing bacterial community during two seasons, winter and summer, in swine buildings in South Korea using Illumina HiSeq (16S rRNA V3 region) and found a reduced representation from winter to summer of Firmicutes and Bacteroidetes (~55–50% and ~25–20%, respectively) with significant gains in Proteobacteria and Actinobacteria (~15–25% and ~5–10%, respectively). Comparatively, in another study by the same authors using 454 pyrosequencing of the V1–V3 16S rRNA region, it was found that Firmicutes comprised 72.4% [36]. Two Danish studies similarly showed important relative abundances of Firmicutes (up to 90%) using two approaches (Illumina MiSeq and clone libraries) and two air sampling strategies (an electrostatic dust collector and a filtering membrane) [5,35]. An American study found high Firmicutes abundance inside (~80%) while more diversity across phyla outside the swine buildings (Firmicutes 26%, Actinobacteria 26%, Bacteroidetes 19%, and Proteobacteria 15%) based on clone libraries [34]. Common among all studies is the very low relative abundance of Proteobacteria in the air of swine buildings, regardless of room. The dominant genera in most studies are Prevotella and Lactobacillus [33,37]. Previous studies found that bacteria in swine building air ranged in concentrations from 1.55 × 10⁴ to 1.55 × 10⁶ CFU/m3 and 8.06 × 10⁷ to 3.34 × 10⁹ copies/m3, culturable and qPCR respectively [38]. Targeted bacteria in the study varied from below detection limit to 1.07 × 10⁶ copies/m3 or 9.05 × 10⁴ CFU/m3 depending on method and target [38].
Limited knowledge is available about biotrickling filters’ ability to reduce bioaerosols from swine buildings. Past studies on air treatment units differ by the used sampling and analysis methods, the targeting microorganisms, the location (climate), and duration of sampling. Consequently, more studies on commercial scale percolating biofilters are needed, particularly in Canada with seasons greatly affecting the emitted air volumes to be treated.
The present study aims to evaluate the efficiency of bioaerosol removal by a commercial scale percolating biofilter, an ATU developed by the IRDA to treat emitted air from a finishing room. The impact of seasonal changes towards bioaerosol reduction efficiency was investigated during a 10-month period.

2. Experiments

2.1. Air Treatment Unit Design and Operation

For 10 months, two identical ATUs (units A and B) were treating in parallel the emitted air from a SCB housing about 260–360 grower-finisher pigs. Pigs inside were provided pelleted food with an ad libitum feed strategy and manure was accumulated underneath the slatted floor.
The units were built in two insulated shipping containers stacked vertically. The lower container housed electronic control panels and the reservoir of the recycled nutritive solution pumped up to the ceiling spray nozzles of the upper container in which the inert filter bed (DURA-PAC XF68 PVC modular cross-flow media, Raschig-USA Inc., Arlington, TX, USA) and growing biofilm were located. The upper container was divided in half to allow two separate ATUs functioning in parallel (units A and B). A series of 36 spray nozzles for each unit (0.5-inch full cone square pattern nozzles, BEX model number 1/2S29SQ), operating with a flowrate of 108 US gallons per minute and a water pressure of approximately 10 psi, were used to ensure complete wetting of the filter bed. Each unit has a maximum design capacity of treating 4320 CFM of air supplied by a blower (Dehli Bi15, Canam HVAC, Brockville, ON, Canada) corresponding to an empty bed residence time (EBRT) of 3 s. Relative humidity, upwind and downwind temperatures, and airflow rates inside units were measured by CS500 (Campbell Scientific, Edmonton, AB, Canada), type T thermocouples, and 20” IRIS dampers (Continental Fan Canada Inc., Mississauga, ON, Canada).

2.2. Air Sampling and Data Acquisition

The ATUs were sampled 17 times between May 2017 and April 2018 with the following data recorded during each sampling visit: relative humidity, temperature, and airflow rate within each unit. Air samples were collected upwind and downwind of the ATUs using Coriolisμ Biological Air Samplers (Bertin Corp., Rockville, MD, USA) with collection recipients containing 15 mL of 1× PBS (phosphate buffered saline). The sampling rate of the Coriolis μ was adjusted according to the airflow within the air treatment unit at the time of sampling to ensure isokinetic sampling (from 100 to 300 L/min). Inlets of sampling probes (metallic tubing) were located in ventilation ducts connecting the ATUs independently to the building ventilation system (upwind) and inside the two ducts exhausting air from each unit (downwind). Air from each sampling site was collected twice for 10 min. For high throughput sequencing analysis, additional samplings of 30 min were performed during sampling visits 14 to 17 (from February 14, 2018, to March 13, 2018). All collection recipient volumes were completed to 15 mL with 1× PBS.
For the 10-min air samples and subsequent qPCR analysis, aliquots of 1 mL were pelleted (21,000 × g for 10 min) and the supernatants discarded. Total DNA was extracted using the DNeasy PowerLyzer PowerSoil Kit (Qiagen, Mississauga, ON, Canada) according to the manufacturer’s instructions with a few modifications. The PowerBead Solution was used to solubilize the pellet and a Mixer Mill MM301 (30 Hz for 10 min, Retsch, Haan, Germany) for bead beating. Extracted DNA was stored at −20 °C. For RT-qPCR analysis of RNA (F+) coliphages (group I), RNA was extracted from aliquots using the QIAamp Viral RNA Mini Kit (Qiagen). cDNA was synthesized from the extracted RNA using the iScript cDNA Synthesis Kit (Bio-Rad, Hercules, CA, USA) and 10 μL of RNA with 10 μL of reaction mixture containing iScript reaction mix, iScript reverse transcriptase, and nuclease free water. The synthesized cDNA was stored at −20 °C until further analysis.
For the 30-min air samples to be analyzed by high throughput sequencing, samples were filtered onto a 0.2 μm polycarbonate membrane (Merck Millipore, Cork, Ireland). As previously described [39], the membrane was inserted into a 1.5 mL tube containing a tungsten carbide bead (Retsch) and 750 µL of PowerBead Solution (Qiagen), frozen at −80 °C for 16 h, and pulverized by shaking in a Mixer Mill MM301 (30 Hz for 20 min, Retsch). DNA was then extracted from the broken membrane using the DNeasy PowerLyzer PowerSoil Kit (Qiagen, Mississauga, ON, Canada).
DNA was analyzed by qPCR for total archaea [40], Clostridium perfringens, Escherichia coli, Enterococcus, Legionella pneumophila, Legionella longbeachae, PCV, and total bacteria. C. perfringens protocols were run on a CFX384 Touch Real-Time PCR Detection System (Bio-Rad) and the remainder on a CFX96 Touch Real-Time PCR Detection System (Bio-Rad). Data was acquired with the Bio-Rad CFX Manager software (Version 3.1) and analyzed using the linear regression of the log10 (target number copy) = f (threshold cycle) function. All PCR run had percent efficiency (%E = (10 (−1/slope of standard curve) − 1) × 100) between 90% and 110%. Primers and probes obtained from Integrated DNA Technologies are listed in Table 1 [41,42,43,44,45,46,47,48,49,50]. PCR reaction mixtures were composed of 5 µL of extracted DNA or cDNA, iQ Supermix or iQ SYBR Green Supermix (Bio-Rad), primers, probe, and DNase/RNase-free water. Genomic DNA from E. coli (ATCC 25922), L. pneumophila (ATCC® 33152), L. longbeachae (ATCC® 33462D-5) and from Methanosarcina mazei (ATCC BAA-159D) were quantified by spectrophotometry (NanoDrop 2000 Spectrophotometer, ThermoScientific, Rochester, NY, USA) and 10-fold dilutions used as a standard curve. Standard curve for quantification of C. perfringens, E. coli, Enterococcus, RNA (F+) coliphages (group I) and PCV were 10-fold dilutions of DNA plasmid constructions consisting of pCR4TOPO (Invitrogen, Carlsbad, CA, USA) with specific 16S rDNA, pIDTSMART-AMP plasmid containing the targeted region (69 bp) of the coliphage replicase gene (IDT, Coralville, IA, USA) or pCR2.1TOPO (Invitrogen) for whole PCV-A genome cloned in E. coli [7,51]. Total bacteria concentration was then expressed as equivalent E. coli per cubic metre of air (equivalent E. coli m−3) and archaea as equivalent M. mazei m−3. Concentration of specific targeted bacteria or viruses were expressed as PCR target copies per cubic metre of air (copies/m3).
Culturable airborne bacteria were quantified on tryptic soy agar (TSA, BD, Sparks, MD, USA) with amphotericin (5 μg/mL, Sigma-Aldrich, St. Louis, MO, USA). Aliquots of 1 mL and 0.1 mL of a 10-fold dilution series (10−1 to 10−6) were spread on TSA plates. Plates were incubated at 25 °C for 72 h. Concentration of culturable bacteria were expressed as colony forming units per cubic metre of air (CFU/m3).
ATU reduction efficiency (expressed in %) was calculated using the following equation:
Reduction efficiency = ((upwind concentration − downwind concentration)/upwind concentration) × 100
For air samples with no PCR detectable target, the limit of detection (LOD) was used to calculate the associated reduction efficiency. The resulting reduction efficiency is associated with an arrow in Figures. Arrow direction indicates a possible underestimation or overestimate of the reduction efficiency by using PCR LOD for downwind or upwind air samples, respectively.
For bacterial diversity analysis by high throughput sequencing, samples were sent to the Plateforme d′analyse génomique de l′Institut de biologie intégrative et des systèmes (IBIS, Université Laval, Québec, QC, Canada). PCR amplified V6–V8 regions of the 16S rRNA genes were sequenced on an Illumina MiSeq platform [52]. Sequencing data received were cleaned and analyzed in the mothur bioinformatics software package mostly according to the MiSeq SOP [mothur v.1.39.5; [53]). Briefly, contigs were generated and sequence reads longer than 450 bp, with more than 0 ambiguous base pairs, and more than 8 homopolymers were removed. Cleaned reads were then aligned to the Silva SSU reference database v.128, shortened to the V6–V8 region for performance, and chimeras removed using the UCHIME function [54]. Cleaned and trimmed sequences were classified by the Bayesian classifier in mothur according to the Silva taxonomy database v.128 with 80% confidence cut-offs. Sequences were clustered into operational taxonomic units (OTUs) according to a 0.03 dissimilarity (or 97% similarity) cut-off. Good’s index was used as an indicator of coverage using the subsampled quantity. Chao1 and the number of OTUs generated were used as richness indices. Inverse-Simpson index was used as a measure of diversity. Samples were grouped according to sampling location and visit for comparisons. The beta diversity was examined through the use of PCoA plots as well as the analysis of molecular variance (AMOVA) calculations for statistical analyses of significance.

2.3. Statistical Analysis

Data were expressed as medians with inter-quartile range (IQR) due to outliers and the potential for larger negative values. T-tests were used to identify significance between studied sets and were considered significant if p ≤ 0.05. Statistical tests performed outside the mothur software were made using GraphPad Prism 5 (ver. 5.03).

3. Results

The ATUs had changing airflow rates during the course of the study due to changing seasons and outdoor temperatures and the consequent variable airflow patterns of swine building ventilation systems (ventilation rates from 250 to 3500 CFM). The average temperatures across all samplings upwind and downwind of the ATUs were 20.8 °C and 19.8 °C, respectively, with a greater standard deviation for downwind temperatures (4.5 °C compared to 2.5 °C). The relative humidity averaged 66.9% with a standard deviation of 13.4%. See Table 2 for details. Upwind concentration for airborne culturable and total bacteria and archaea ranged from 333 CFU/m3 to 226,857 CFU/m3, 975 E. coli equivalent m−3 to 240,748 E. coli equivalent m−3, and 896 M. mazei equivalent m−3 to 5579 M. mazei equivalent m−3, respectively. No correlation was found between airborne bacteria and archaea upwind concentration and the monitored ATU airflow rate, temperature or relative humidity. Among specific targeted microorganisms, larger amounts of airborne Enterococcus than E. coli were revealed by qPCR analysis in non-treated air samples (upwind).
There was no significant difference between the two ATUs’ median percent reduction of total bacteria, and units A and B results were then pooled together. Culturable bacteria had a median of 1.1 × 10⁴ copies/m3 upwind, with a minimum of 9.52 × 10² CFU/m3 and maximum of 6.05 × 10⁵ copies/m3, and 1.6 × 10⁴ CFU/m3 downwind. The upwind air had median concentrations of total bacteria (by qPCR) of 2.99 × 10⁴ copies/m3 (min: 3.36 × 10³ copies/m3, max: 1.03 × 10⁶ copies/m3), Enterococcus at 1.30 × 10³ copies/m3 (min: 2.30 × 10² copies/m3, max: 7.10 × 10³ copies/m3), archaea at 3.85 × 10³ copies/m3 (min: 1.45 × 10³ copies/m3, max: 1.38 × 10⁴ copies/m3), E. coli at 7.57 × 10² copies/m3 (min: 2.50 × 10² copies/m3, max: 1.00 × 10⁵ copies/m3) and coliphages at 7.88 × 10³ copies/m3 (min: 1.46 × 10³ copies/m3, max: 8.61 × 10⁴ copies/m3). The ATUs were effective at reducing total bacteria (a 75% median reduction efficiency, n = 34) and Enterococcus (76.1%, n = 23), while moderately effective at diminishing archaea (42.1%, n = 10) and E. coli (40.9%, n = 22), and even less at reducing culturable bacteria (14.4%, n = 34). There was no detectable C. perfringens or PCV (by qPCR) in any air samples. Coliphages were reduced by 25.6% (n = 23). There was no correlation identified between environmental conditions (temperature, relative humidity) and percent reduction efficiency.
For evaluating the impact of ATU airflow rate and seasons on bioaerosol reduction efficiency, air samples were classified into three groups (See Figure 1, Table 3); group A representing the start-up period or biofilm establishment (sampling visits 1 to 6, n = 24), group B was characterized by high ATU airflow rates (visits 7 to 9, n = 12), and group C associated with a variable ATU airflow rate (visits 10 to 17, n = 32). Although differences in reduction efficiency can be seen between groups, there was only a statistically significant difference between the percent reduction of E. coli in Group B–Group C (p = 0.0155). Although there was a trend of decreasing reduction efficiency of coliphages over the year from highest to lowest (Group A (40.8%), Group B (28.8%) and Group C (17.6%)), there was no significant difference between the three groups.
For diversity analysis, following the formation of contigs, the screening and the filtering, a total of 882, 096 sequence reads were available to characterize the bacterial diversity of air samples (n = 16) and nutritive solution samples (n = 7).
The generation of OTUs resulted in 22,102 OTUs at the 3% cut-off. The largest quantity of OTUs were in the nutritive solution samples followed by upwind and then downwind air samples. When samples are plotted according to similarity on a distance matrix and dendrogram, two groups appear (air samples and nutritive solution samples) (Figure 2). There is a significant difference in sample diversity between air samples and nutritive solution samples (p-value < 0.001).
The cleaned sequencing data revealed that air samples, both upwind and downwind of ATUs, contained primarily the phyla Bacteroidetes and Firmicutes while the bacterial microbiota of the nutritive solution was primarily composed of Proteobacteria (Figure 3). In treated air samples, there was an increase in relative abundance of Proteobacteria compared to upwind air samples, an average of 1.8% across all non-treated air samples to 9.5% (from 0.9% to 22.9%) downwind of ATUs. The most dominant genera found in air samples were Prevotella, Terrisporobacter, Streptococcus, and Clostridium. Legionella were present in air samples (from 0.0% to 2.4% in relative abundances). L. longbeachae and L. pneumophila specific qPCR were then run in samples with the highest relative abundances of Legionella classified sequences. However, these two species of Legionella were undetectable.

4. Discussion

The ATUs were able to reduce bacteria emitted from the swine building, as determined by qPCR targeting total bacteria. Results show similar efficiency to laboratory-scale tests of the ATUs for phage (36.6%) [31,55]. Although culturable bacteria was associated with an overall low ATU percent reduction efficiency, it may not be representative of the efficiency of the ATU over extended use, as the first sampling group (group A) had a median increase of 218% but subsequent sampling groups had median reductions of 26% and 29% (groups B and C, respectively). It could potentially be due to the biofilm not being established on the inert support during the start-up period and an increased ATU bacterial shedding. A mixed inoculum was used during the start-up period to aid in biofilm establishment. Aarnink et al., also mentioned a 279% increase when investigating culturable bacterial reduction by a biotrickling filter treating air from a pig building [30]. The operational duration of the biotrickling filter was, however, not reported by Aarnink et al., (2011) and as such, no comparison can be made regarding the potential impact of time on reduction efficiencies for culturable bacteria. It is important to note that not all bacteria can be grown on TSA at 25 °C in aerobic conditions used in the present study. Organisms that do not utilize the substrates available or that are anaerobic could not be cultured on the media used in the present study. Some major genera detected in sequencing were anaerobic bacteria and as such represent an underrepresented community in culturable data.
There was no correlation between environmental factors and the PCR quantified airborne bacteria and archaea concentration. The sampling covered a diverse range of temperatures, airflow rates, and relative humidity. There was the appearance of an association between low upwind concentrations and increases in concentrations after the ATU but this could not be determined statistically. The only statistically significant difference in quantities of non-treated air samples according to seasonal groupings (groups A through C) was E. coli in groups B and C but the limited number of samples in group B (n = 4) may have biased the median. The non-statistically significant difference between culturable bacteria in group A and the others may be due to the greater variation (IQR of 559).
Targeted bacteria such as E. coli were reduced (40.9%) by the ATU, this is not always consistent as 5 of 22 samples with detectable E. coli had increases after the ATU. An important consideration because of the potential economic ramifications of an exacerbated E. coli outbreak. Post-weaning diarrhea (PWD), caused by Escherichia coli, is a major cause of piglet fatality worldwide. PWD was estimated to cost $20,000 per year for a 500 sow herd (Ontario, Canada) and can be particularly troublesome due to recurring yearly outbreaks [56]. Total piglet scours (E. coli and other causes included) were estimated to cost the Australian swine industry about $7 million a year [57]. Certain strains of E. coli were found to be transferable by air within the same building [58]. Enterococcus was reduced by 76.1% which may be an important reservoir for antibiotic resistance in swine buildings. Enterococcus of swine origin has been discovered carrying antimicrobial resistance genes outside SCB [59]. Additionally, Enterococcus has been identified as comprising the majority of airborne bacteria in swine buildings which makes it a potentially important reservoir for antibiotic resistance genes and a marker to establish bacterial reductive efficiency of studied strategies [9]. These concentration of bacteria in the air in this study were similar to those found in previous swine buildings although existing at the lower edges of the ranges described previously [38]. This could indicate the natural loss of bacteria through the exhaust fans and due to the distance to the first air sampler.
Unlike the previous finding of airborne PCV (eukaryotic viruses) inside all visited Eastern Canadian SCB [51], there was no detectable PCV in any samples likely due to the widespread use of effective vaccines in Canada prior to the present study [19]. F+ RNA coliphages (group I), bacterial viruses specific to coliforms, were, however, detected and concentration reduced by the ATUs. The reduction efficiency varied but overall was low (25.6%) which is comparable to the lab-scale ATU tests using nebulized phages (36.6%) [31]. These results enhance the knowledge of the percolating biofilter’s ability to reduce viral loads in the air emitted from SCB by targeting and detecting genes from viruses that are naturally aerosolized in swine buildings. However, the detection rate of the coliphages was 48.5% and better targets still need to be found. A viral marker is then needed for subsequent studies in order to unravel the ATU efficiency of removing viral aerosols. A viral marker should be airborne and generated naturally inside swine buildings.
The high-throughput amplicon sequencing largely corroborated previous work on the airborne bacterial diversity inside SCB [33]. Although the duration of this study lasted 10 months, sequencing data was not available for the entire duration due to sampling limitations and as such no comparison can be made regarding seasonal differences in bacterial communities in emitted air. The major differences being in the lower relative abundances of Firmicutes when compared to sequencing techniques like 454 pyrosequencing or clone libraries [5,34,36]. The results of the present study are similar to the a study with different 16S rRNA regions targeted and the use of Illumina HiSeq (V6–V8 in the present study compared to V3) [33]. Dissimilarities in data could be explained by: the use of different air samplers (the wetted wall cyclone Coriolis μ vs. dry filtering membranes or other liquid or solid impactors) and the differences in the classification database (SILVA compared to RDP database). Indeed, these authors found that RDP database did not assign as many sequences to Terrisporobacter when compared with SILVA using the same confidence cut-off (data not shown). When classifying sequences according to the RDP database, the genus Terrisporobacter is identified as an unclassified member of the Peptostreptococcaceae family and as such may not be reported in literature. Moreover, clone libraries and 454 pyrosequencing results are more dissimilar to Illumina sequencing. Finally, differences between the present study and others could result from the air being not directly sampled inside SCB. Bacterial diversities were instead characterized in bioaerosols environmentally emitted from the building.

5. Conclusions

The present study provides evidence that a biotrickling filter, an air treatment unit (ATU) designed by the IRDA, is effective at removing environmentally emitted bioaerosols, even with highly variable air flowrates, without significantly impacting the bacterial communities through ATU shedding. The overall effectiveness of the ATU design was revealed with the use of qPCR, high throughput sequencing and culture approaches. No sign of decline in ATU functionality over the 10-month period was observed although variability in reduction efficiency for culturable bacteria characterized the period of biofilm establishment. This study does not exclude the potential for biotrickling filters to be sources of emitted bacteria. There was no pathogenic agent of serious concern detected during the present study. Future work includes evaluating the efficiency of ATUs against viruses using a viral marker or during outbreaks, such as during PRRSV episodes, and the incorporation of anaerobic bacterial considerations during culture and molecular biology methods.

Author Contributions

Conceptualization, C.D., M.G., A.L. and V.L.; methodology, C.D., M.G., A.L. and V.L.; formal analysis, A.L. and J.M.V.; investigation, A.L., J.M.V., M.G., and V.L.; resources, V.L.; data curation, A.L. and J.M.V.; writing—original draft preparation, J.M.V.; writing—review and editing, A.L., C.D., M.G., and V.L.; visualization, J.M.V.; supervision, C.D. and V.L.; project administration, C.D., M.G., and V.L.; funding acquisition, C.D., M.G., and V.L.

Funding

This research was funded by Agriculture and Agri-Food Canada through the Agri-Innovation Program.

Acknowledgments

The authors would like to thank Agriculture and Agri-Food Canada for their financial support (Agri-Innovation Program) and IRDA’s team for their technical support (Jérémie Tremblay Gravel, Cédric Morin, Christian Gauthier, Harold Dusablon and Antoine Lamontagne). The authors would also like to thank Serge Simard of the IUCPQ for statistical analyses support and the CDPQ for authorizing access to their site.

Conflicts of Interest

The authors declare no conflict of interest.

References

  1. Canadian Pork Council. Canadian Live Swine and Pork Exports. Available online: http://www.cpc-ccp.com/canadian-pork-and-live-swine-exports (accessed on 27 July 2018).
  2. Brisson, Y. The Changing Face of the Canadian Hog Industry; Statistics Canada: Ottawa, ON, Canada, 2014. [Google Scholar]
  3. Walker, J.T.; Aneja, V.P.; Dickey, D.A. Atmospheric transport and wet deposition of ammonium in North Carolina. Atmos. Environ. 2000, 34, 3407–3418. [Google Scholar] [CrossRef]
  4. Cambra-López, M.; Aarnink, A.J.; Zhao, Y.; Calvet, S.; Torres, A.G. Airborne particulate matter from livestock production systems: A review of an air pollution problem. Environ. Pollut. 2010, 158, 1–17. [Google Scholar] [CrossRef]
  5. Kristiansen, A.; Saunders, A.M.; Hansen, A.A.; Nielsen, P.H.; Nielsen, J.L. Community structure of bacteria and fungi in aerosols of a pig confinement building. FEMS Microbiol. Ecol. 2012, 80, 390–401. [Google Scholar] [CrossRef] [PubMed]
  6. Nehme, B.; Létourneau, V.; Forster, R.J.; Veillette, M.; Duchaine, C. Culture-independent approach of the bacterial bioaerosol diversity in the standard swine confinement buildings, and assessment of the seasonal effect. Environ. Microbiol. 2008, 10, 665–675. [Google Scholar] [CrossRef] [PubMed]
  7. Létourneau, V.; Nehmé, B.; Mériaux, A.; Massé, D.; Cormier, Y.; Duchaine, C. Human pathogens and tetracycline-resistant bacteria in bioaerosols of swine confinement buildings and in nasal flora of hog producers. Int. J. Hyg. Environ. Health 2010, 213, 444–449. [Google Scholar] [CrossRef]
  8. Bonifait, L.; Veillette, M.; Létourneau, V.; Grenier, D.; Duchaine, C. Detection of Streptococcus suis in bioaerosols of swine confinement buildings. Appl. Environ. Microbiol. 2014, 3296–3304. [Google Scholar] [CrossRef]
  9. Cole, D.; Todd, L.; Wing, S. Concentrated swine feeding operations and public health: A review of occupational and community health effects. Environ. Health Perspect. 2000, 108, 685–699. [Google Scholar] [CrossRef] [PubMed]
  10. Schiffman, S.S.; Miller, E.A.S.; Suggs, M.S.; Graham, B.G. The effect of environmental odors emanating from commercial swine operations on the mood of nearby residents. Brain Res. Bull. 1995, 37, 369–375. [Google Scholar] [CrossRef]
  11. Lim, T.-T.; Heber, A.J.; Ni, J.-Q.; Kendall, D.C.; Richert, B.T. Effects of manure removal strategies on odor and gas emission from swine finishing. Trans. ASAE 2004, 47, 2041–2050. [Google Scholar] [CrossRef]
  12. Girard, M.; Belzile, M.; Lemay, S.; Feddes, J.; Godbout, S. Innovative Air Treatment Unit for Swine Exhaust Air–Laboratory-Scale Tests. In Proceedings of the CSBE/SCGAB 2013 Annual Conference, Saskatoon, SK, Canada, 7–10 July 2013. [Google Scholar]
  13. Belzile, M.; Lemay, S.P.; Zegan, D.; Feddes, J.J.; Godbout, S.; Larouche, J.-P.; Martel, M. Reduction of gas and odour emissions from a swine building using a biotrickling filter. In Proceedings of the XVIIth World Congress of the International Commission of Agricultural Engineering, Québec City, QC, Canada, 13–17 June 2010. [Google Scholar]
  14. Morales, A.S.; Fragoso de Araújo, J.; de Moura Gomes, V.T.; Reis Costa, A.T.; Prazeres Rodrigues, D.D.; Porfida Ferreira, T.S.; de Lima Filsner, P.H.N.; Felizardo, M.R.; Micke Moreno, A. Colistin resistance in Escherichia coli and Salmonella enterica strains isolated from swine in Brazil. Sci. World J. 2012, 2012, 1–4. [Google Scholar] [CrossRef]
  15. Harada, K.; Asai, T.; Kojima, A.; Oda, C.; Ishihara, K.; Takahashi, T. Antimicrobial susceptibility of pathogenic Escherichia coli isolated from sick cattle and pigs in Japan. J. Vet. Med. Sci. 2005, 67, 999–1003. [Google Scholar] [CrossRef] [PubMed]
  16. Kempf, I.; Jouy, E.; Chauvin, C. Colistin use and colistin resistance in bacteria from animals. Int. J. Antimicrob. Agents 2016, 48, 598–606. [Google Scholar] [CrossRef] [PubMed]
  17. Fairbrother, J.M.; Nadeau, É.; Gyles, C.L. Escherichia coli in postweaning diarrhea in pigs: An update on bacterial types, pathogenesis, and prevention strategies. Anim. Health Res. Rev. 2005, 6, 17–39. [Google Scholar] [CrossRef] [PubMed]
  18. Kolotilin, I.; Kaldis, A.; Devriendt, B.; Joensuu, J.; Cox, E.; Menassa, R. Production of a subunit vaccine candidate against porcine post-weaning diarrhea in high-biomass transplastomic tobacco. PLoS ONE 2012, 7, 1–12. [Google Scholar] [CrossRef] [PubMed]
  19. Agriculture and Agri-Food Canada. Evaluation of the Control of Diseases in the Hog Industry. Available online: http://www.agr.gc.ca/eng/about-us/offices-and-locations/office-of-audit-and-evaluation/evaluation-reports/evaluation-of-the-control-of-diseases-in-the-hog-industry/?id=1435868137804 (accessed on 5 September 2019).
  20. Mussell, A.; Oginskyy, A.; Grier, K.; Morin, M.; Lachance, M.; Whittington, L.; Friendship, R. A Risk, Benefit, Strength, Weakness, Opportunity and Threat Analysis for the Control and Possible Eradication of Porcine Reproductive and Respiratory Syndrome (PRRS) Virus Within the Canadian Swine Herd; The George Morris Center: Guelph, ON, Canada, 2011. [Google Scholar]
  21. Holtkamp, D.J.; Kliebenstein, J.B.; Neumann, E.; Zimmerman, J.J.; Rotto, H.; Yoder, T.K.; Wang, C.; Yeske, P.; Mowrer, C.L.; Haley, C.A. Assessment of the economic impact of porcine reproductive and respiratory syndrome virus on United States pork producers. J. Swine Health Prod. 2013, 21, 72–84. [Google Scholar]
  22. Otake, S.; Dee, S.; Corzo, C.; Oliveira, S.; Deen, J. Long-distance airborne transport of infectious PRRSV and Mycoplasma hyopneumoniae from a swine population infected with multiple viral variants. Vet. Microbiol. 2010, 145, 198–208. [Google Scholar] [CrossRef] [PubMed]
  23. Alonso, C.; Goede, D.P.; Morrison, R.B.; Davies, P.R.; Rovira, A.; Marthaler, D.G.; Torremorell, M. Evidence of infectivity of airborne porcine epidemic diarrhea virus and detection of airborne viral RNA at long distances from infected herds. Vet. Res. 2014, 45, 1–5. [Google Scholar] [CrossRef] [PubMed]
  24. Dee, S.; Spronk, G.; Reicks, D.; Ruen, P.; Deen, J. Further assessment of air filtration for preventing PRRSV infection in large breeding pig herds. Vet. Rec. 2010, 167, 976–977. [Google Scholar] [CrossRef] [PubMed]
  25. Dee, S.A.; Philips, R. Using vaccination and unidirectional pig flow to control PRRSV transmission. J. Swine Health Prod. 1998, 6, 21–25. [Google Scholar]
  26. Van der Heyden, C.; Demeyer, P.; Volcke, E.I. Mitigating emissions from pig and poultry housing facilities through air scrubbers and biofilters: State-of-the-art and perspectives. Biosyst. Eng. 2015, 134, 74–93. [Google Scholar] [CrossRef]
  27. Guo, H.; Dehod, W.; Agnew, J.; Laguë, C.; Feddes, J.; Pang, S. Annual odor emission rate from different types of swine production buildings. Trans. Asabe 2006, 49, 517–525. [Google Scholar] [CrossRef]
  28. Martens, W.; Martinec, M.; Zapirain, R.; Stark, M.; Hartung, E.; Palmgren, U. Reduction potential of microbial, odour and ammonia emissions from a pig facility by biofilters. Int. J. Hyg. Environ. Health 2001, 203, 335–345. [Google Scholar] [CrossRef] [PubMed]
  29. Cho, M.S.; Ko, H.J.; Kim, D.; Kim, K.Y. On-site application of air cleaner emitting plasma ion to reduce airborne contaminants in pig building. Atmos. Environ. 2012, 63, 276–281. [Google Scholar] [CrossRef]
  30. Aarnink, A.; Landman, W.; Melse, R.; Zhao, Y.; Ploegaert, J.; Huynh, T. Scrubber capabilities to remove airborne microorganisms and other aerial pollutants from the exhaust air of animal houses. Trans. ASABE 2011, 54, 1921–1930. [Google Scholar] [CrossRef]
  31. Lemay, S.P.; Girard, M.; Belzile, M.; Hogue, R.; Duchaine, C.; Létourneau, V.; Martel, M.; Jeanne, T.; Feldes, J.; Godbout, S. Un Concept Innovateur Pour Traiter L’air émis des Batiments porcins Réduisant L’impact Environnemental et Favorisant la Cohabitation; Rapport Final; IRDA: Québec, QC, Canada, 2012; p. 125. [Google Scholar]
  32. Walser, S.M.; Brenner, B.; Wunderlich, A.; Tuschak, C.; Huber, S.; Kolb, S.; Niessner, R.; Seidel, M.; Höller, C.; Herr, C.E. Detection of Legionella-contaminated aerosols in the vicinity of a bio-trickling filter of a breeding sow facility—A pilot study. Sci. Total Environ. 2017, 575, 1197–1202. [Google Scholar] [CrossRef] [PubMed]
  33. Kumari, P.; Choi, H.L. Seasonal variability in airborne biotic contaminants in swine confinement buildings. PLoS ONE 2014, 9, 1–9. [Google Scholar] [CrossRef] [PubMed]
  34. Rodríguez de Evgrafov, M.; Kõll, P.; Frank, D.N.; Baumgartner, L.K.; Robertson, C.E.; Hernández, M.T.; Pace, N.R. Molecular analysis of bacterial and circovirus bioaerosols in concentrated animal feeding operations. Aerosol Sci. Technol. 2013, 47, 755–766. [Google Scholar] [CrossRef]
  35. Vestergaard, D.V.; Holst, G.J.; Basinas, I.; Elholm, G.; Schlünssen, V.; Linneberg, A.; Šantl-Temkiv, T.; Finster, K.; Sigsgaard, T.; Marshall, I.P.G. Pig farmers’ homes harbor more diverse airborne bacterial communities than pig stables or suburban homes. Front. Microbiol. 2018, 9, 870, 1–14. [Google Scholar] [CrossRef]
  36. Kumari, P.; Choi, H.L. Manure removal system influences the abundance and composition of airborne biotic contaminants in swine confinement buildings. Environ. Monit. Assess. 2015, 187, 1–10. [Google Scholar] [CrossRef]
  37. Hong, P.Y.; Li, X.; Yang, X.; Shinkai, T.; Zhang, Y.; Wang, X.; Mackie, R.I. Monitoring airborne biotic contaminants in the indoor environment of pig and poultry confinement buildings. Environ. Microbiol. 2012, 14, 1420–1431. [Google Scholar] [CrossRef]
  38. Pilote, J.; Létourneau, V.; Girard, M.; Duchaine, C. Quantification of airborne dust, endotoxins, human pathogens and antibiotic and metal resistance genes in Eastern Canadian swine confinement buildings. Aerobiologia 2019, 35, 283–296. [Google Scholar] [CrossRef]
  39. Mbareche, H.; Veillette, M.; Bilodeau, G.; Wösten, H.; Duchaine, C. Fungal cells recovery from air samples, a tale of loss and gain. Appl. Environ. Microbiol. 2019. under review. [Google Scholar] [CrossRef] [PubMed]
  40. Just, N.; Blais Lecours, P.; Marcoux-Voiselle, M.; Kirychuk, S.; Veillette, M.; Singh, B.; Duchaine, C. Archaeal characterization of bioaerosols from cage-housed and floor-housed poultry operations. Can. J. Microbiol. 2012, 59, 46–50. [Google Scholar] [CrossRef] [PubMed]
  41. Wise, M.G.; Siragusa, G.R. Quantitative detection of Clostridium perfringens in the broiler fowl gastrointestinal tract by real-time PCR. Appl. Environ. Microbiol. 2005, 71, 3911–3916. [Google Scholar] [CrossRef] [PubMed]
  42. Malinen, E.; Kassinen, A.; Rinttilä, T.; Palva, A. Comparison of real-time PCR with SYBR Green I or 5′-nuclease assays and dot-blot hybridization with rDNA-targeted oligonucleotide probes in quantification of selected faecal bacteria. Microbiology 2003, 149, 269–277. [Google Scholar] [CrossRef]
  43. Rinttilä, T.; Kassinen, A.; Malinen, E.; Krogius, L.; Palva, A. Development of an extensive set of 16S rDNA-targeted primers for quantification of pathogenic and indigenous bacteria in faecal samples by real-time PCR. J. Appl. Microbiol. 2004, 97, 1166–1177. [Google Scholar] [CrossRef]
  44. Bach, H.-J.; Tomanova, J.; Schloter, M.; Munch, J. Enumeration of total bacteria and bacteria with genes for proteolytic activity in pure cultures and in environmental samples by quantitative PCR mediated amplification. J. Microbiol. Methods 2002, 49, 235–245. [Google Scholar] [CrossRef]
  45. Reysenbach, A.; Pace, N.; Robb, F.; Place, A. Archaea: A laboratory manual—Thermophiles. Cold Spring Harb. Protoc 1995, 16, 101–107. [Google Scholar]
  46. Baker, G.; Smith, J.J.; Cowan, D.A. Review and re-analysis of domain-specific 16S primers. J. Microbiol. Methods 2003, 55, 541–555. [Google Scholar] [CrossRef] [Green Version]
  47. Gagnon, C.A.; Del Castillo, J.R.; Music, N.; Fontaine, G.; Harel, J.; Tremblay, D. Development and use of a multiplex real-time quantitative polymerase chain reaction assay for detection and differentiation of Porcine circovirus-2 genotypes 2a and 2b in an epidemiological survey. J. Vet. Diagn. Investig. 2008, 20, 545–558. [Google Scholar] [CrossRef]
  48. Joly, P.; Falconnet, P.-A.; André, J.; Weill, N.; Reyrolle, M.; Vandenesch, F.; Maurin, M.; Etienne, J.; Jarraud, S. Quantitative real-time Legionella PCR for environmental water samples: Data interpretation. Appl. Environ. Microbiol. 2006, 72, 2801–2808. [Google Scholar] [CrossRef] [PubMed]
  49. Hamilton, K.; Ahmed, W.; Palmer, A.; Sidhu, J.; Hodgers, L.; Toze, S.; Haas, C. Public health implications of Acanthamoeba and multiple potential opportunistic pathogens in roof-harvested rainwater tanks. Environ. Res. 2016, 150, 320–327. [Google Scholar] [CrossRef] [PubMed]
  50. Friedman, S.D.; Cooper, E.M.; Calci, K.R.; Genthner, F.J. Design and assessment of a real time reverse transcription-PCR method to genotype single-stranded RNA male-specific coliphages (Family Leviviridae). J. Virol. Methods 2011, 173, 196–202. [Google Scholar] [CrossRef] [PubMed]
  51. Verreault, D.; Létourneau, V.; Gendron, L.; Massé, D.; Gagnon, C.A.; Duchaine, C. Airborne porcine circovirus in Canadian swine confinement buildings. Vet. Microbiol. 2010, 141, 224–230. [Google Scholar] [CrossRef] [PubMed]
  52. Comeau, A.M.; Li, W.K.; Tremblay, J.-É.; Carmack, E.C.; Lovejoy, C. Arctic Ocean microbial community structure before and after the 2007 record sea ice minimum. PLoS ONE 2011, 6, 1–12. [Google Scholar] [CrossRef] [PubMed]
  53. Schloss, P.D.; Westcott, S.L.; Ryabin, T.; Hall, J.R.; Hartmann, M.; Hollister, E.B.; Lesniewski, R.A.; Oakley, B.B.; Parks, D.H.; Robinson, C.J. Introducing mothur: Open-source, platform-independent, community-supported software for describing and comparing microbial communities. Appl. Environ. Microbiol. 2009, 75, 7537–7541. [Google Scholar] [CrossRef] [PubMed]
  54. Edgar, R.C.; Haas, B.J.; Clemente, J.C.; Quince, C.; Knight, R. UCHIME improves sensitivity and speed of chimera detection. Bioinformatics 2011, 27, 2194–2200. [Google Scholar] [CrossRef] [Green Version]
  55. Lévesque, A.; Girard, M.; Létourneau, V.; Pilote, J.; Duchaine, C.; Godbout, S.; Lemay, S.P. Achieving a Greater Reduction of Airborne Emissions from Swine Buildings by the Combination of Different Technologies. In Proceedings of the 2017 ASABE Annual International Meeting, Spokane, WA, USA, 16–19 July 2017; pp. 1–7. [Google Scholar]
  56. Amezcua, R.; Friendship, R.M.; Dewey, C.E.; Gyles, C.; Fairbrother, J.M. Presentation of postweaning Escherichia coli diarrhea in southern Ontario, prevalence of hemolytic E. coli serogroups involved, and their antimicrobial resistance patterns. Can. J. Vet. Res. 2002, 66, 73–78. [Google Scholar]
  57. DAF. Piglet Scours—General Information. Available online: https://www.daf.qld.gov.au/business-priorities/agriculture/animals/pigs/health-diseases/diseases/piglet-scours (accessed on 2 April 2019).
  58. Cornick, N.A.; VuKhac, H. Indirect transmission of Escherichia coli O157: H7 occurs readily among swine but not among sheep. Appl. Environ. Microbiol. 2008, 74, 2488–2491. [Google Scholar] [CrossRef]
  59. Gibbs, S.G.; Green, C.F.; Tarwater, P.M.; Mota, L.C.; Mena, K.D.; Scarpino, P.V. Isolation of antibiotic-resistant bacteria from the air plume downwind of a swine confined or concentrated animal feeding operation. Environ. Health Perspect. 2006, 114, 1032–1037. [Google Scholar] [CrossRef]
Figure 1. Percent reduction efficiencies of ATU against all detectable studied microorganisms. The graphs represent ATU reduction efficiencies for archaea, F+ RNA coliphages (group I), bacteria cultured on tryptic soy agar (TSA), Escherichia coli, Enterococcus, and total bacteria by qPCR. Red arrows refer to reduction efficiencies calculated using the limit of quantification for downwind or upwind data.
Atmosphere 10 00525 g001
Figure 2. Dendrogram of samples. V## identifies the visit, A or B identifies the unit for upwind, downwind, and nutritive solution samples.
Atmosphere 10 00525 g002
Figure 3. Relative abundances of phyla in samples. Pie chart percentages are averages of all samples in (A) non-treated air (upwind), (B) nutritive solution, and (C) treated air (downwind).
Atmosphere 10 00525 g003
Table 1. qPCR protocols for targeted microorganisms.
MicroorganismsPrimers and Probes (Final Concentration)Sequence (5′–3′)ThermoprotocolReferences
ArchaeaA751F (500 nM)CCG ACG GTG AGR GRY GAA1) 95 °C for 5 min
2) 95 °C for 10 s
3) 55.5 °C for 20 s
4) 72 °C for 30 s
Repeat 2)–4) 35 times
5) 72 °C for 10 min
6) 50–95 °C (0.5 °C increase per 2 s)
[44,45]
A976R (500 nM)YCC GGC GTT GAM TCC AAT T
BacteriaEUBF (625 nM)GGT AGT CYA YGC MST AAA CG1) 94 °C for 3 min
2) 95 °C for 20 s
3) 62 °C for 60 s
Repeat 2)–3) 40 times
[43]
EUBR (625 nM)GAC ARCC ATG CAS CAC CTG
EUB probe (62.5 nM)FAM-TKCGCGTTGCDTCGAATTAAWCCAC-TAMRA
Clostridium perfringensCPerf165F (250 nM)CGC ATA ACG TTG AAA GAT GG1) 95 °C for 3 min
2) 95 °C for 15 s
3) 57 °C for 30 s
4) 72 °C for 30 s
Repeat 2)–4) 40 times
5) 72 °C for 10 min
6) 50–95 °C (0.5 °C increase per 2 s)
[40]
CPerf269R (250 nM)CCT TGG TAG GCC GTT ACC C
EnterococcusEnt1 (250 nM)CCC TTA TTG TTA GTT GCC ATC ATT[42]
Ent2 (250 nM)ACT CGT TGT ACT TCC CAT TGT
Escherichia coliEC1 (300 nM)GTT AAT ACC TTT GCT CAT TGA1) 95 °C for 3 min
2) 95 °C for 15 s
3) 55 °C for 30 s
4) 72 °C for 30 s
Repeat 2)–4) 40 times
5) 72 °C for 10 min
6) 50–95 °C (0.5 °C increase per 2s)
[41]
EC2 (300 nM)ACC AGG GTA TCT AAT CCT GTT
Legionella longbeachaeLLongF (500 nM)AGA TGG GAT GTC TGG TGC TC1) 95 °C for 3 min
2) 95 °C for 15 s
3) 60 °C for 1 min
Repeat 2)–3) 40 times
[48]
LlongR (500 nM)ACC TGG TTT TGC ACC AGT TC
LlongProbe (50 nM)56-FAM/ACA AAG CAA/ZEN AAG GTG ACG CT/3IABkFQ
Legionella pneumophilaLpneuF (500 nM)GCA TTG GTG CCG ATT TGG1) 95 °C for 5 min
2) 95 °C for 15 s
3) 57 °C for 10 s
Repeat 2)–3) 45 times
[47]
LpneuR (500 nM)GYT TTG CCA TCA AAT CTT TCT GAA
LpneuProbe (50 nM)56-FAM/CCA CTC ATA/ZEN/ GCG TCT TGC ATG CCT TTA/3IABkFQ
ColiphagesColip-F (250 nM)ATCCATTTTGGTAACGCCG1) 95 °C for 3 min
2) 94 °C for 15 s
3) 60 °C for 30 s
Repeat 2)–3) 40 times
[49]
Colip-R (250 nM)TGCAATCTCACTGGGACATAT
Colip-Probe (50 nM)TAGGCATCTACGGGGACGA
Porcine CircovirusCirco-Gen-F (400 nM)GGC CAC CTG GGT GTG GTA AA1) 95 °C for 3 min
2) 95 °C for 30 s
3) 60 °C for 60 s
4) 72 °C for 60 s
Repeat 2)–4) 45 times
[46]
Circo-Gen-R (400 nM)CCC ACC ACT TGT TTC TAG GTG GTT
Circo-Gen-Probe (120 nM)56-FAM/TTT GCA GAC CCG GAA ACC ACA TAC TGG A/3BHQ
Table 2. Table of recorded air treatment unit (ATU) environmental conditions during sampling. This table includes the approximate air flow (cubic feet per minute) within the ATU and the sampling rate selected based on isokinetic calculations. Relative humidity was only measured before the ATU and was assumed to be near 100% at the exit.
Visit.UnitAir Flow (CFM)EBRT (s)Sampling Rate (L/min)Relative Humidity (%)Temperature Before (°C) Temperature After (°C)
V1
(26/5/2017)
A15408.415064.020.019.0
B109011.915063.020.020.0
V2
(21/6/2017)
A13509.610063.522.220.5
B116011.210064.523.122.6
V3
(5/7/2017)
A14009.315045.025.521.0
B117011.110051.026.723.5
V4
(17/7/2017)
A13509.615063.126.223.4
B124010.510068.927.425.5
V5
(3/8/2017)
A13909.315064.524.722.2
B13709.515067.125.223.7
V6
(14/8/2017)
A13509.615061.724.621.1
B123010.510066.223.422.2
V7
(30/8/2017)
A33753.830048.926.221.0
B30904.225051.525.521.4
V8
(13/9/2017)
A33253.930050.527.221.7
B30804.225054.724.621.9
V9
(28/9/2017)
A33003.930054.722.519.5
B30504.225057.821.519.0
V10
(17/10/2017)
A113011.510056.020.417.0
B49026.415059.019.215.0
V11
(3/11/2017)
A110011.810058.021.720.0
B54024.020059.321.422.0
V12
(18/12/2017)
A25550.810080.311.616.7
B77016.825079.915.617.5
V13
(25/1/2018)
A38533.715088.813.817.6
B46028.220094.413.316.7
V14
(14/2/2018)
A29044.710087.514.216.8
B87014.930092.515.117.0
V15
(7/3/2018)
A57522.515082.015.217.3
B126310.315083.516.917.5
V16
(23/3/2018)
A45528.515081.515.817.2
B14209.115071.019.218.1
V17
(13/4/2018)
A28545.510083.016.819.0
B16907.715055.819.617.5
Table 3. Percent reduction efficiencies for analyses by grouping. Median values reported with interquartile range (IQR) in brackets. Negative values indicate an increase in treated air concentration. Flow rate (CFM = cubic feet per minute) is the median of values recorded during the time of sampling for each visit.
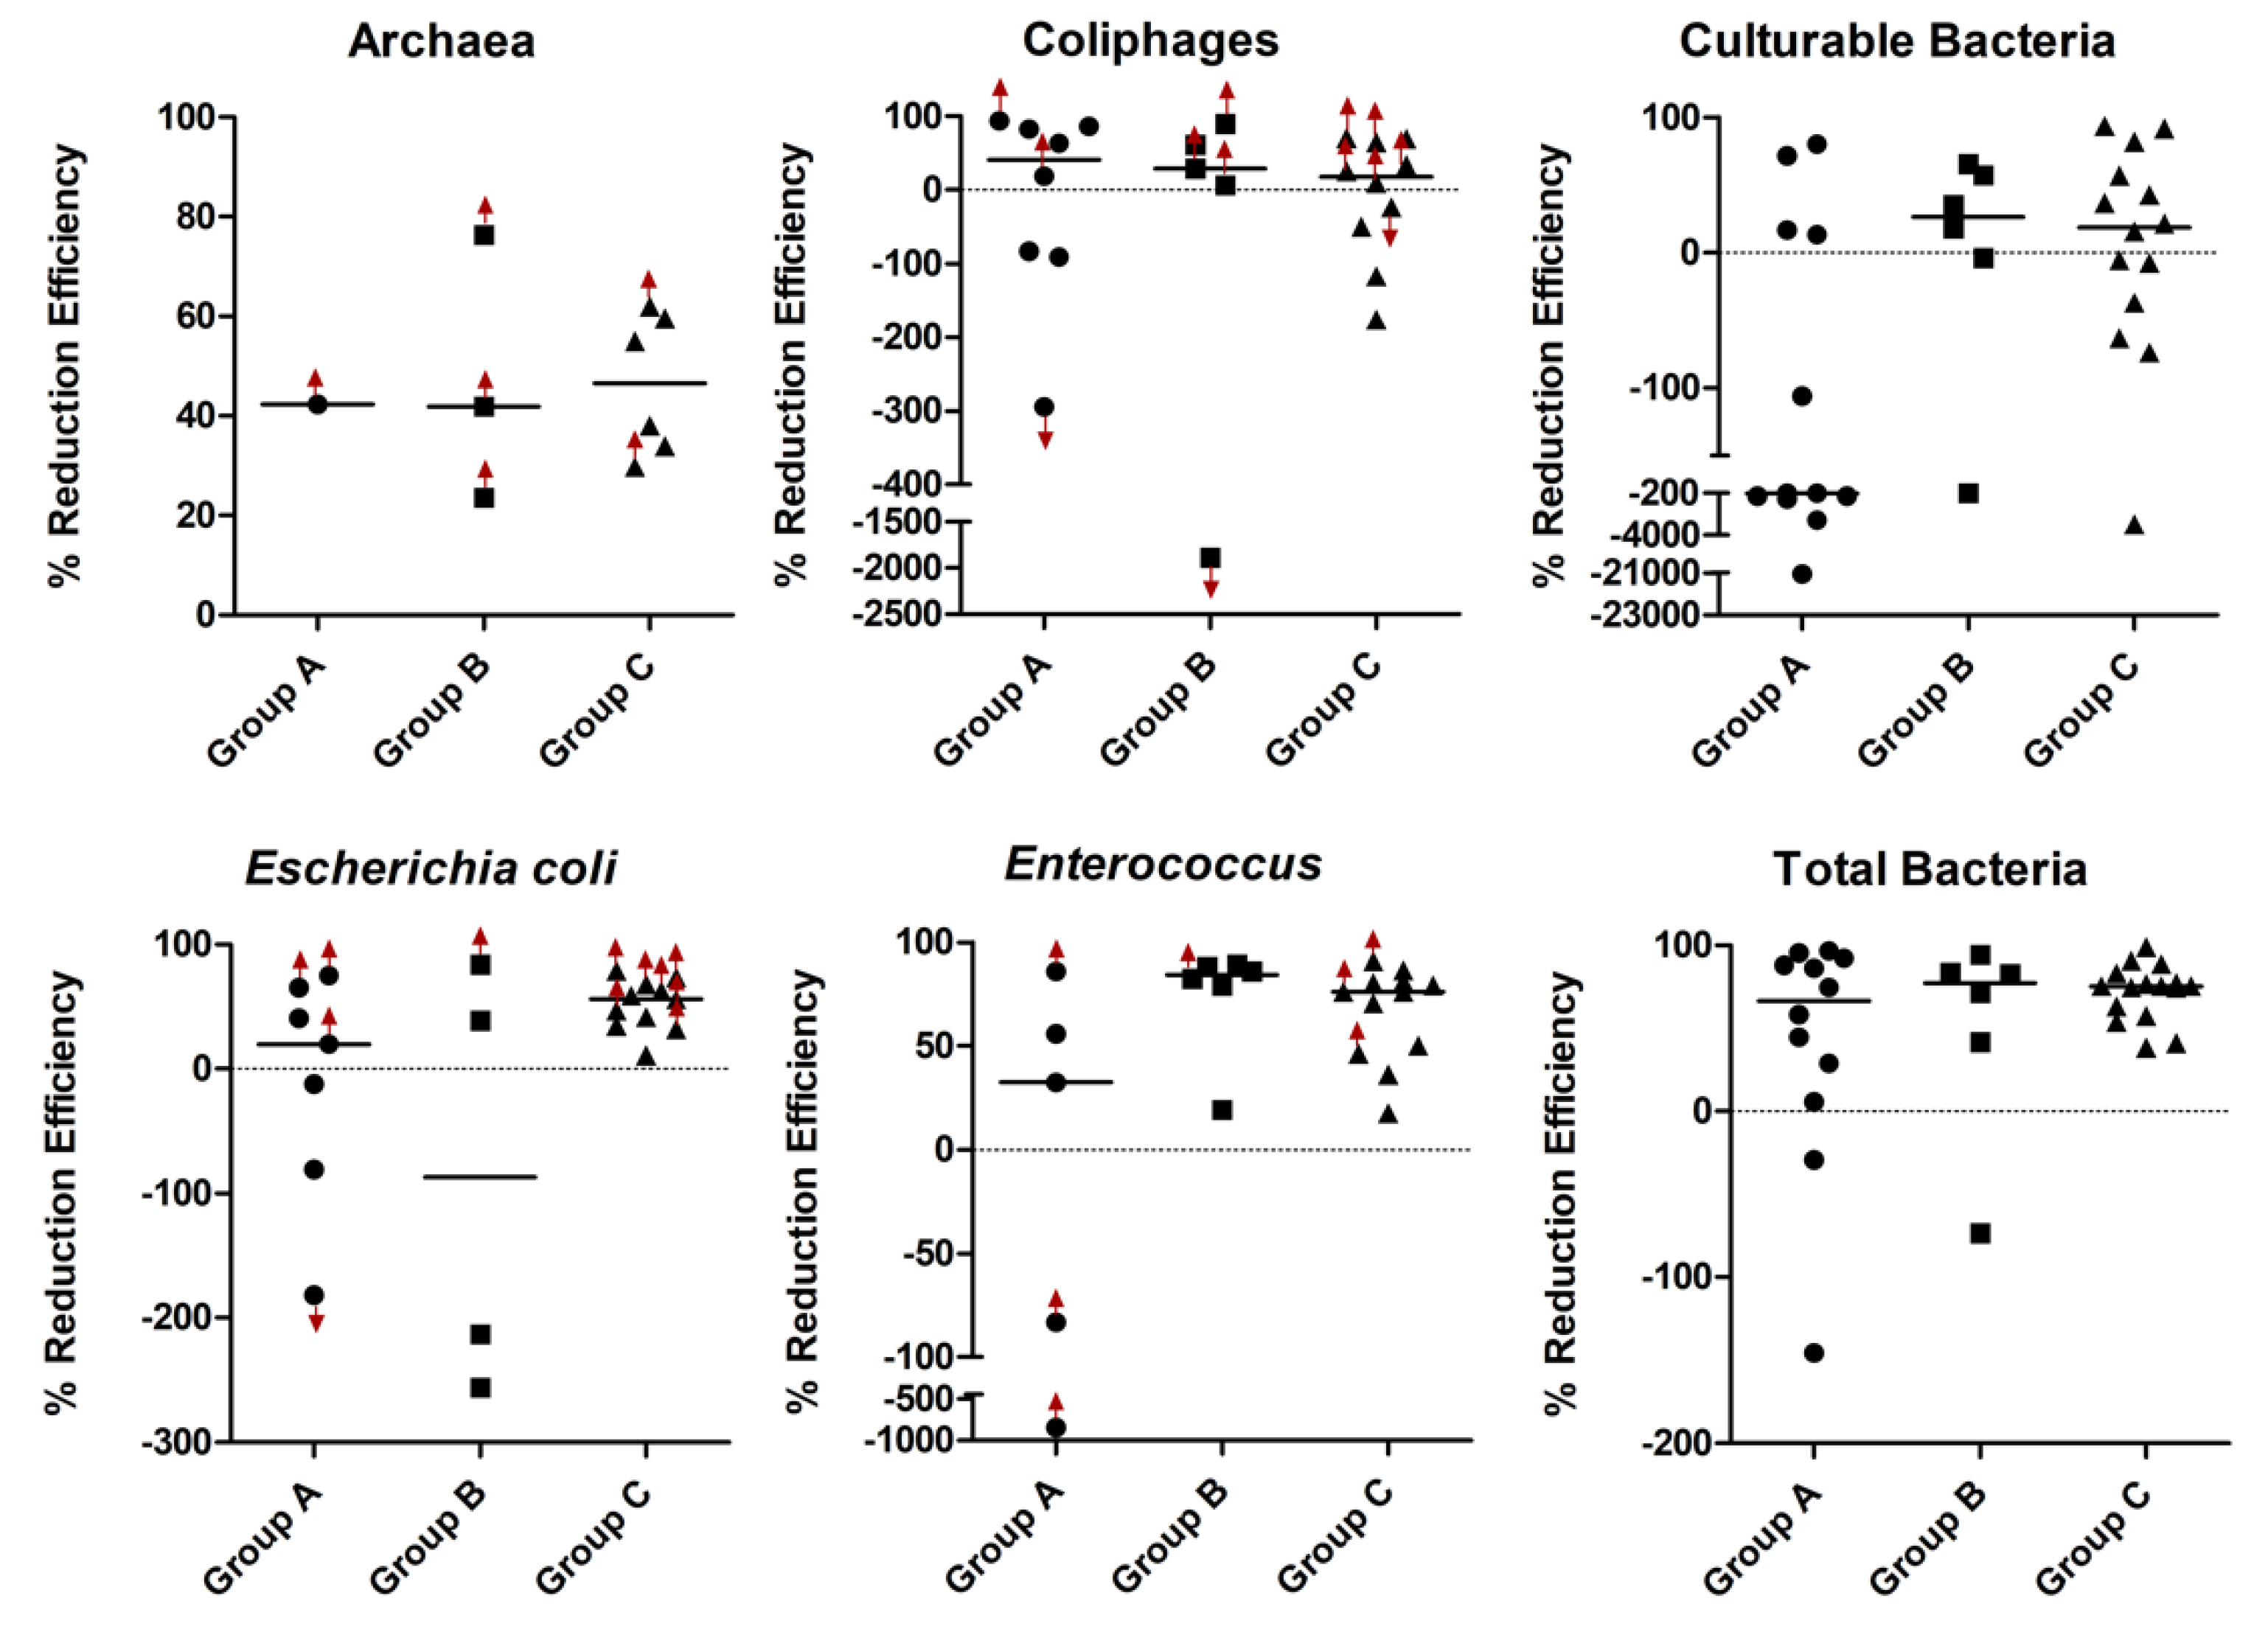
Percent Reduction Efficiency (%)
GroupAirFlow Rate (CFM)Total BacteriaCulturableEnterococcusE. coliArchaeaColiphages
A135066 (66)−218 (559)32 (139)20 (99)42 (0)40.8 (168.2)
B319577 (34)26 (50)84 (8)−87 (274)42 (26)28.8 (54.5)
C557.575 (17)29 (96)76 (31)56 (27)47 (23)17.6 (100.4)

