Article

Spatio-Temporal Variations of Multiple Primary Air Pollutants Emissions in Beijing of China, 2006–2015

1
National Engineering Research Center of Urban Environmental Pollution Control, Beijing Municipal Research Institute of Environmental Protection, Beijing 100037, China
2
State Key Joint Laboratory of Environmental Simulation & Pollution Control, School of Environment, Beijing Normal University, Beijing 100875, China
3
College of Resource Environment and Tourism, Capital Normal University, Beijing 100048, China
4
Department of Air Pollution Control, Beijing Municipal Institute of Labor Protection, Beijing 100054, China
5
School of Environment, Tsinghua University, Beijing 100084, China
6
Center for Atmospheric Environmental Studies, Beijing Normal University, Beijing 100875, China
*
Authors to whom correspondence should be addressed.
Atmosphere 2019, 10(9), 494; https://doi.org/10.3390/atmos10090494
Submission received: 31 July 2019 / Revised: 20 August 2019 / Accepted: 24 August 2019 / Published: 26 August 2019
(This article belongs to the Section Air Quality)

Abstract

:
Air pollution in Beijing, China has attracted continuous worldwide public attention along with the rapid urbanization of the city. By implementing a set of air pollution mitigation measures, the air quality of Beijing has been gradually improved in recent years. In this study, the intrinsic factors leading to air quality improvement in Beijing are studied via a quantitative evaluation of the temporal and spatial changes in emissions of primary air pollutants over the past ten years. Based on detailed activity levels of each economic sector and a localized database containing source and pollutant specific emission factors, an integrated emissions inventory of primary air pollutants discharged from various sources between 2006 and 2015 is established. With the implementation of phased air pollution mitigation measures, and the Clean Air Action Plan, the original coal-dominated energy structure in Beijing has undergone tremendous changes, resulting in the substantial reduction of multiple air pollutants. The total of emissions of six major atmospheric pollutants (PM10, PM2.5, SO2, NOX, VOCs and NH3) in Beijing decreased by 35% in 2015 compared to 2006—this noticeable decrease was well consistent with the declining trend of ambient concentration of criterion air pollutants (SO2, PM10, PM2.5 and NO2) and air quality improvement, thus showing a good correlation between the emission of air pollutants and the outcome of air quality. SO2 emission declined the most, at about 71.7%, which was related to the vigorous promotion of combustion source control, such as the shutdown of coal-fired facilities and domestic stoves and transition to clean energy, like natural gas or electricity. Emissions of PM decreased considerably (by 48%) due to energy structure optimization, industrial structure adjustments, and end-of-pipe PM source control. In general, NOX, NH3, and VOCs decreased relatively slightly, by 25%, 14%, and 2%, respectively, and accordingly, they represented the limiting factors for improving air quality and the key points of air pollution mitigation in Beijing for the future.

1. Introduction

Owing to the rapid growth of the regional economy and population, a substantial amount of energy has been consumed in Beijing. The transportation and housing needs associated with population expansion have led to a large number of motor vehicles and consistently enormous construction areas in Beijing [1,2,3]. These activities consume considerable amounts of fossil fuels, dominated by high-polluting coal, resulting in relatively massive air pollutant emissions into the atmosphere. The unfavorable terrain and meteorological conditions also further render the air pollution problem in Beijing more prominent, which has drawn extensive concerns from the government and general public [4,5,6]. According to the experience and implication of air pollution control in the United States and European countries, the implementation of coordinated control of multiple pollutants and multiple pollution sources is an effective way to reduce the ambient concentration of particulate matter and ozone and improve air quality [7,8,9].
Faced with relatively immense pressure to mitigate air pollution, the Beijing government has actively undertaken a set of phased air pollution control actions. Since 1998, Beijing has continuously issued 16 phases of air pollution mitigation measures and the Clean Air Action Plan (2013–2017), as well as a set of specific measures, including adjusting and improving the coal-dominated energy structure, comprehensive motor vehicle pollution control, industrial restructuring, and strengthening education and awareness on ecological protection and public environments [10,11]. Thus, the emission of main air pollutants has been declining annually, which has resulted in the improvement of air quality [12]. Nevertheless, the annual average concentration of PM2.5 was still as high as 58 µg/m3 in 2017, which was much higher than the national standard attainment value of 35 µg/m3 (GB3095-2012). The air pollution control measures have resulted in a series of energy and industrial restructurings and notable changes in the types and emission characteristics of different pollution sources. However, systematic research and analyses on the changes and temporal and spatial variation characteristics of air pollutant emissions in Beijing are currently lacking. In addition, most of the existing researches have failed to summarize the experiences of air pollution control in Beijing and identify feasible pathways for continuously improving the air quality in the future. Recently, works on emission inventories have been specifically dedicated to sub-categories source, such as power plants, catering industry, mobile sources, biomass burning, road fugitive dust and landfills [13]. For the purpose of summarizing the experiences and generate insights for future air pollution control, this study establishes and updates an integrated emission inventory covering 10 major pollution source categories in Beijing, including dozens of air pollution sub-sources.
To determine the causes and key factors contributing to the improvement of air quality, this study quantitatively evaluated the variations in air pollutant emissions in Beijing. A comprehensive emission inventory of multiple air pollutants during the period for Beijing (2006–2015) is systematically established. It takes consideration of emissions from 10 types of main source categories and nine kinds of main air pollutants, including sulfur oxide (SO2), nitrogen oxides (NOX), PM10, PM2.5, carbon monoxide (CO), volatile organic compounds (VOCs), ammonia (NH3), black carbon (BC) and organic carbon (OC). The temporal and spatial variation characteristics of air pollutants of Beijing are explored. The contributions of each type of pollution source to the total emissions and its changes in different periods are quantified. Finally, air pollutant emission reduction targets and comprehensive air pollution prevention and control measures are proposed.

2. Methods and Materials

2.1. Classification of Air Pollution Sources and Calculation Methods

The emissions of PM10 and PM2.5, its chemical components (BC and OC) and gaseous pollutants (SO2, NOX, CO, NH3 and VOCs) from different anthropogenic air pollution sources in Beijing were estimated via a combined bottom-up and top-down method. Emission sources were firstly classified into ten main categories [14,15,16], including fossil fuel combustion sources (FCS), industrial process sources (IPS), mobile sources (MS), solvent-use sources (SUS), agricultural sources (AS), fugitive dust sources (FDS), biomass combustion sources (BCS), oil and gas storage, transportation and sales (OGSTS), waste disposal sources (WDS) and other sources (OS). These main categories were further divided into subcategories based on the associated technology type, facility, and fuel types. Noticeably, the emissions from several miscellaneous sources such as crematories and mixing plants are separately considered into other sources, which have been rarely included in the former studies. The list of specific abbreviations and notations can be seen in separate Supplementary Information (SI) Table S1, detailed pollution source categories are summarized in the separate Supplementary Information (SI) Table S2.
The calculation methods for the emission of various air pollutants and different source categories are introduced as follows. The emissions from source categories of FCS, IPS, SUS, BCS, OGSTS, WDS, AS and OS are calculated by Equation (1).
E = A × E F × ( 1 η )
where E stands for the emissions of each air pollutant; A is activity level of each pollution source; EF stands for the pollutant’s emission factor; and η represents removal efficiency by control measures.
As for mobile sources, the emissions of on-road vehicles, and other MS are estimated by using Equations (2)–(4), respectively.
E k = i j V P i × X i , j × V K T i × E F i , j , k
where i stands for vehicle type; j stands for the control technology; k is pollutant type; E stands for pollutants emitted from vehicle; VKT represents annual mileage; VP represents the number of motor vehicles; Xi,j stands for the ratio of equipped with control measure j among for vehicle type i.
Airplane : E p = ( L T O × E F p )
Others : E p = ( W p × E F p )
while p is the pollutant type; W is fuel consumption; LTO represents the number of airplane landing and take-off and EF is the pollutant emission coefficient. Beijing’s largest airport, Capital International Airport, is about 25 kilometers from the city center.
As for road fugitive dust, the emissions are calculated using Equation (5).
W R i = E R i × L R × N R × ( 1 n r 365 ) × 10 6
where WRi represents total emissions of PMi (PM10 or PM2.5), t/a; ERi is the average PMi emission coefficient, g/(km·vehicle); LR is the road length, km; NR is the average number of vehicles on this road within a certain time period, /a; and nr is the number of dust-free days.

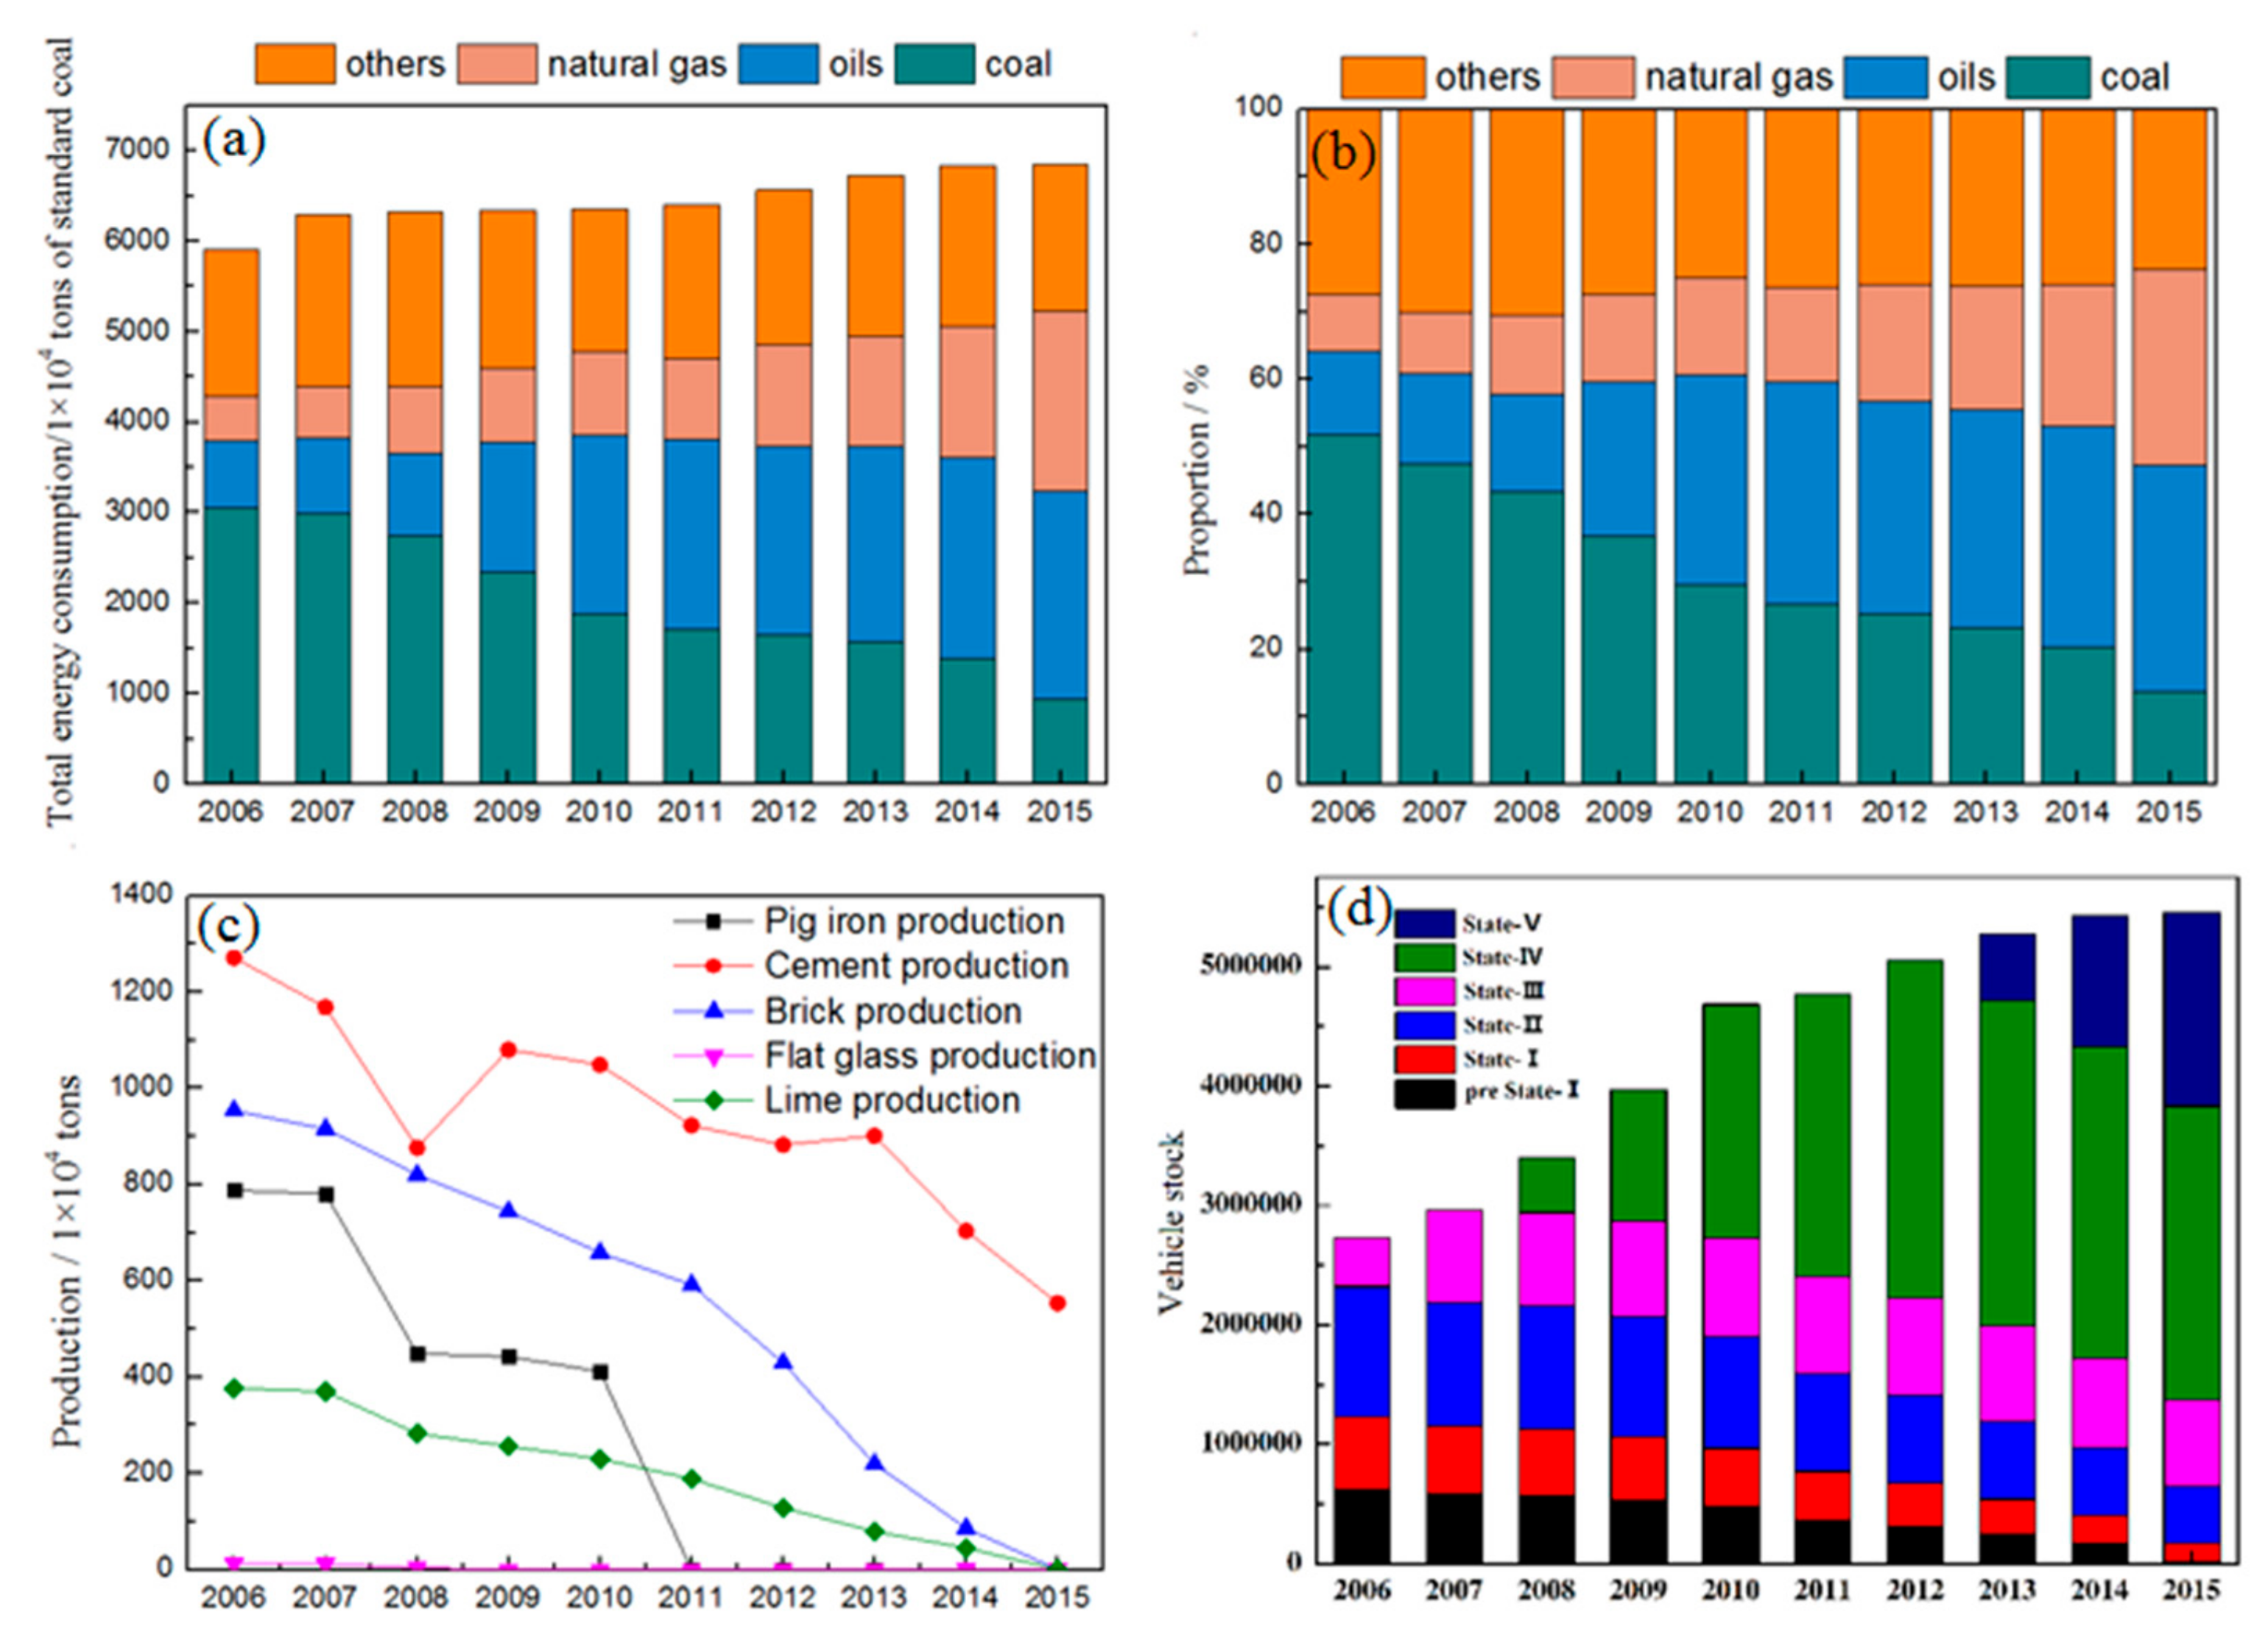
2.2. Activity Levels

Activity data are obtained from multiple sources, including environmental statistics, pollution source investigations, statistical yearbook (energy, industry and traffic, etc.). Because of the occasionally inconsistency of spatial and temporal scales in the compilation of emission inventories [17], therefore, different calibration procedures are used to eradicate the variation and verify data quality. The activity level data for each type of pollution source are summarized in the Table S2.
Beijing covers 16,410.54 km2 and is inhabited by approximately 21.7 million residents. As for the climate aspect, Beijing belongs to a sub-humid, warm temperate zone geographically, the average annual air temperature is about 12.3 °C, and the annual precipitation is about 529.4 mm [18]. Accompanied by the rapid growth in population and economic development, power generation in Beijing has continuously increased from 2.15 × 10⁹ kWh in 2006 to 4.21 × 10⁹ kWh in 2015 [19,20]. The vast majority of coal in Beijing has been used in power plants and industrial sectors, accounting for 84% of all raw coal consumption in 2006. Compared to the 22.6 million tons in 2006, the amount of coal used in power plants and industrial sectors has been greatly reduced to 8.0 million tons in 2015 along with the tremendous changes in the energy structure and industrial structure. Regarding heat generation and supply, contrary to coal-fired boilers, gas boilers have increased annually, and the annual consumption of natural gas is approximately 7.3 billion m3 [20]. The annual variations of total energy consumption and energy proportion are summarized in Figure 1a,b. In this study, the overall energy consumption of several sectors such as electric power and heat supply was calibrated based on the comprehensive energy balance sheet released by the Beijing municipal bureau of statistics, and the multi-sources statistical activity level data for the same emission source were checked for consistency. The fuel consumption data for the residential living sector originated from the bureau of statistics.
Great changes have occurred in the industrial structure of Beijing. After 2010, iron and steel smelting industries in Beijing were totally shut down, and the brick, lime, gypsum and flat glass industries nearly ceased production. The output of cement in Beijing dropped from 12.7 million tons in 2006 to 5.5 million tons in 2015 [18,19]. The variation in major industrial production is shown in Figure 1c. The activity levels of IPS and SUS, which included product outputs, production processes and various levels of control technology, were obtained primarily through surveys of associated sectors and field investigations of some specific enterprises. These data and the statistical data were cross-checked for consistency.
The total number of motor vehicles in Beijing has rapidly grown from 2.7 million units in 2006 to 5.5 million units in 2015, representing a two-fold increase in a decade [21]. Nevertheless, the annual growth rate of motor vehicles has slowed during the period, and the exhaust emission standards became more stringent, that is, they were updated from State II to State VI based on the phasing out of old in-use vehicles with high emission levels. Combined, these factors have resulted in a decrease in the proportion of vehicles complying with emission standard before State VI, accounting for only 27% of the total vehicles by the end of 2015. The variation in vehicle stock is summarized in Figure 1d. The activity levels of MS mainly included the numbers of motor vehicles and various types of non-road transportation in each fuel type class, each power type class and each emission standard class, and these were primarily obtained from the survey data acquired by statistics of transportation and relevant sectors.

2.3. Emission Factors (EFs)

EFs were established by employing a technology-based method, considering fuel type, combustion or industrial process and the installed air pollution control devices (APCDs). For some large point sources, the dynamic technology-based EFs were estimated using Equation (6).
E F l , i = θ 1 M l ( 1 f l , t W ) α l , j R ( 1 P j , l , k , t η j , l , k )
where l represents the emission source; t represents the calculated year; j stands for the combustion or production process; k is the pattern of APCDs combination; θ is the transition factor; M represents content in the fuel or raw materials; f represents consumption of fuels; W represents removal efficiency for pollutants; α stands for application ratio; R is release ratio; and η represents removal efficiency of APCDs integration.
For MS, the international vehicle emission (IVE) model was used to determine annual EFs. We took in the correction coefficient for driving types and meteorological factors based on the EFs to embody the practice emission rates in the IVE model. EFs used in this study are described in the supplementary information Table S3–S9.

2.4. Spatial Allocation

A geographic information system (GIS) was applied to develop a comprehensive emission inventory with of 3 km × 3 km spatial resolution, therefore allowing to obtain the spatial distribution characteristics of major atmospheric pollutants of Beijing. With regard to point sources including power boilers, heating boilers, cement factories, or other industrial factories, we allocated the emissions to the grid cell on the basis of their latitude and longitude coordinate. Emissions for the non-point source were spatially allocated in accordance with the population density distribution. Emissions from the residential combustion source were allocated in the light of population density in urban and rural areas. As for mobile sources, we used road atlases that contain road network and traffic flow information in accordance with types of vehicle and road as spatial alternative for allocating the mobile source emissions [22].

2.5. Uncertainty Analysis

Due to uncertainties in activity levels obtained from corresponding statistics data and the average EFs evaluated specific measurements or literature reports, quantitatively estimating the potential uncertainties for emission inventories is essential [23,24]. Monte Carlo simulation analysis, which relies on repeated, random sampling to obtain results, was carried out to quantify emissions uncertainties from each pollution source. Overall, 10,000 trials were executed to calculate the bounds of emissions based on a 95% confidence interval. The software Crystal Ball (Oracle, Redwood Shores, U.S.A) was used for carrying out the method and uncertainty analysis. Input parameters for activity levels and EFs of each pollution source are defined by experts and authors’ judgment, or referred to previous literature [25,26,27].

3. Results and Discussion

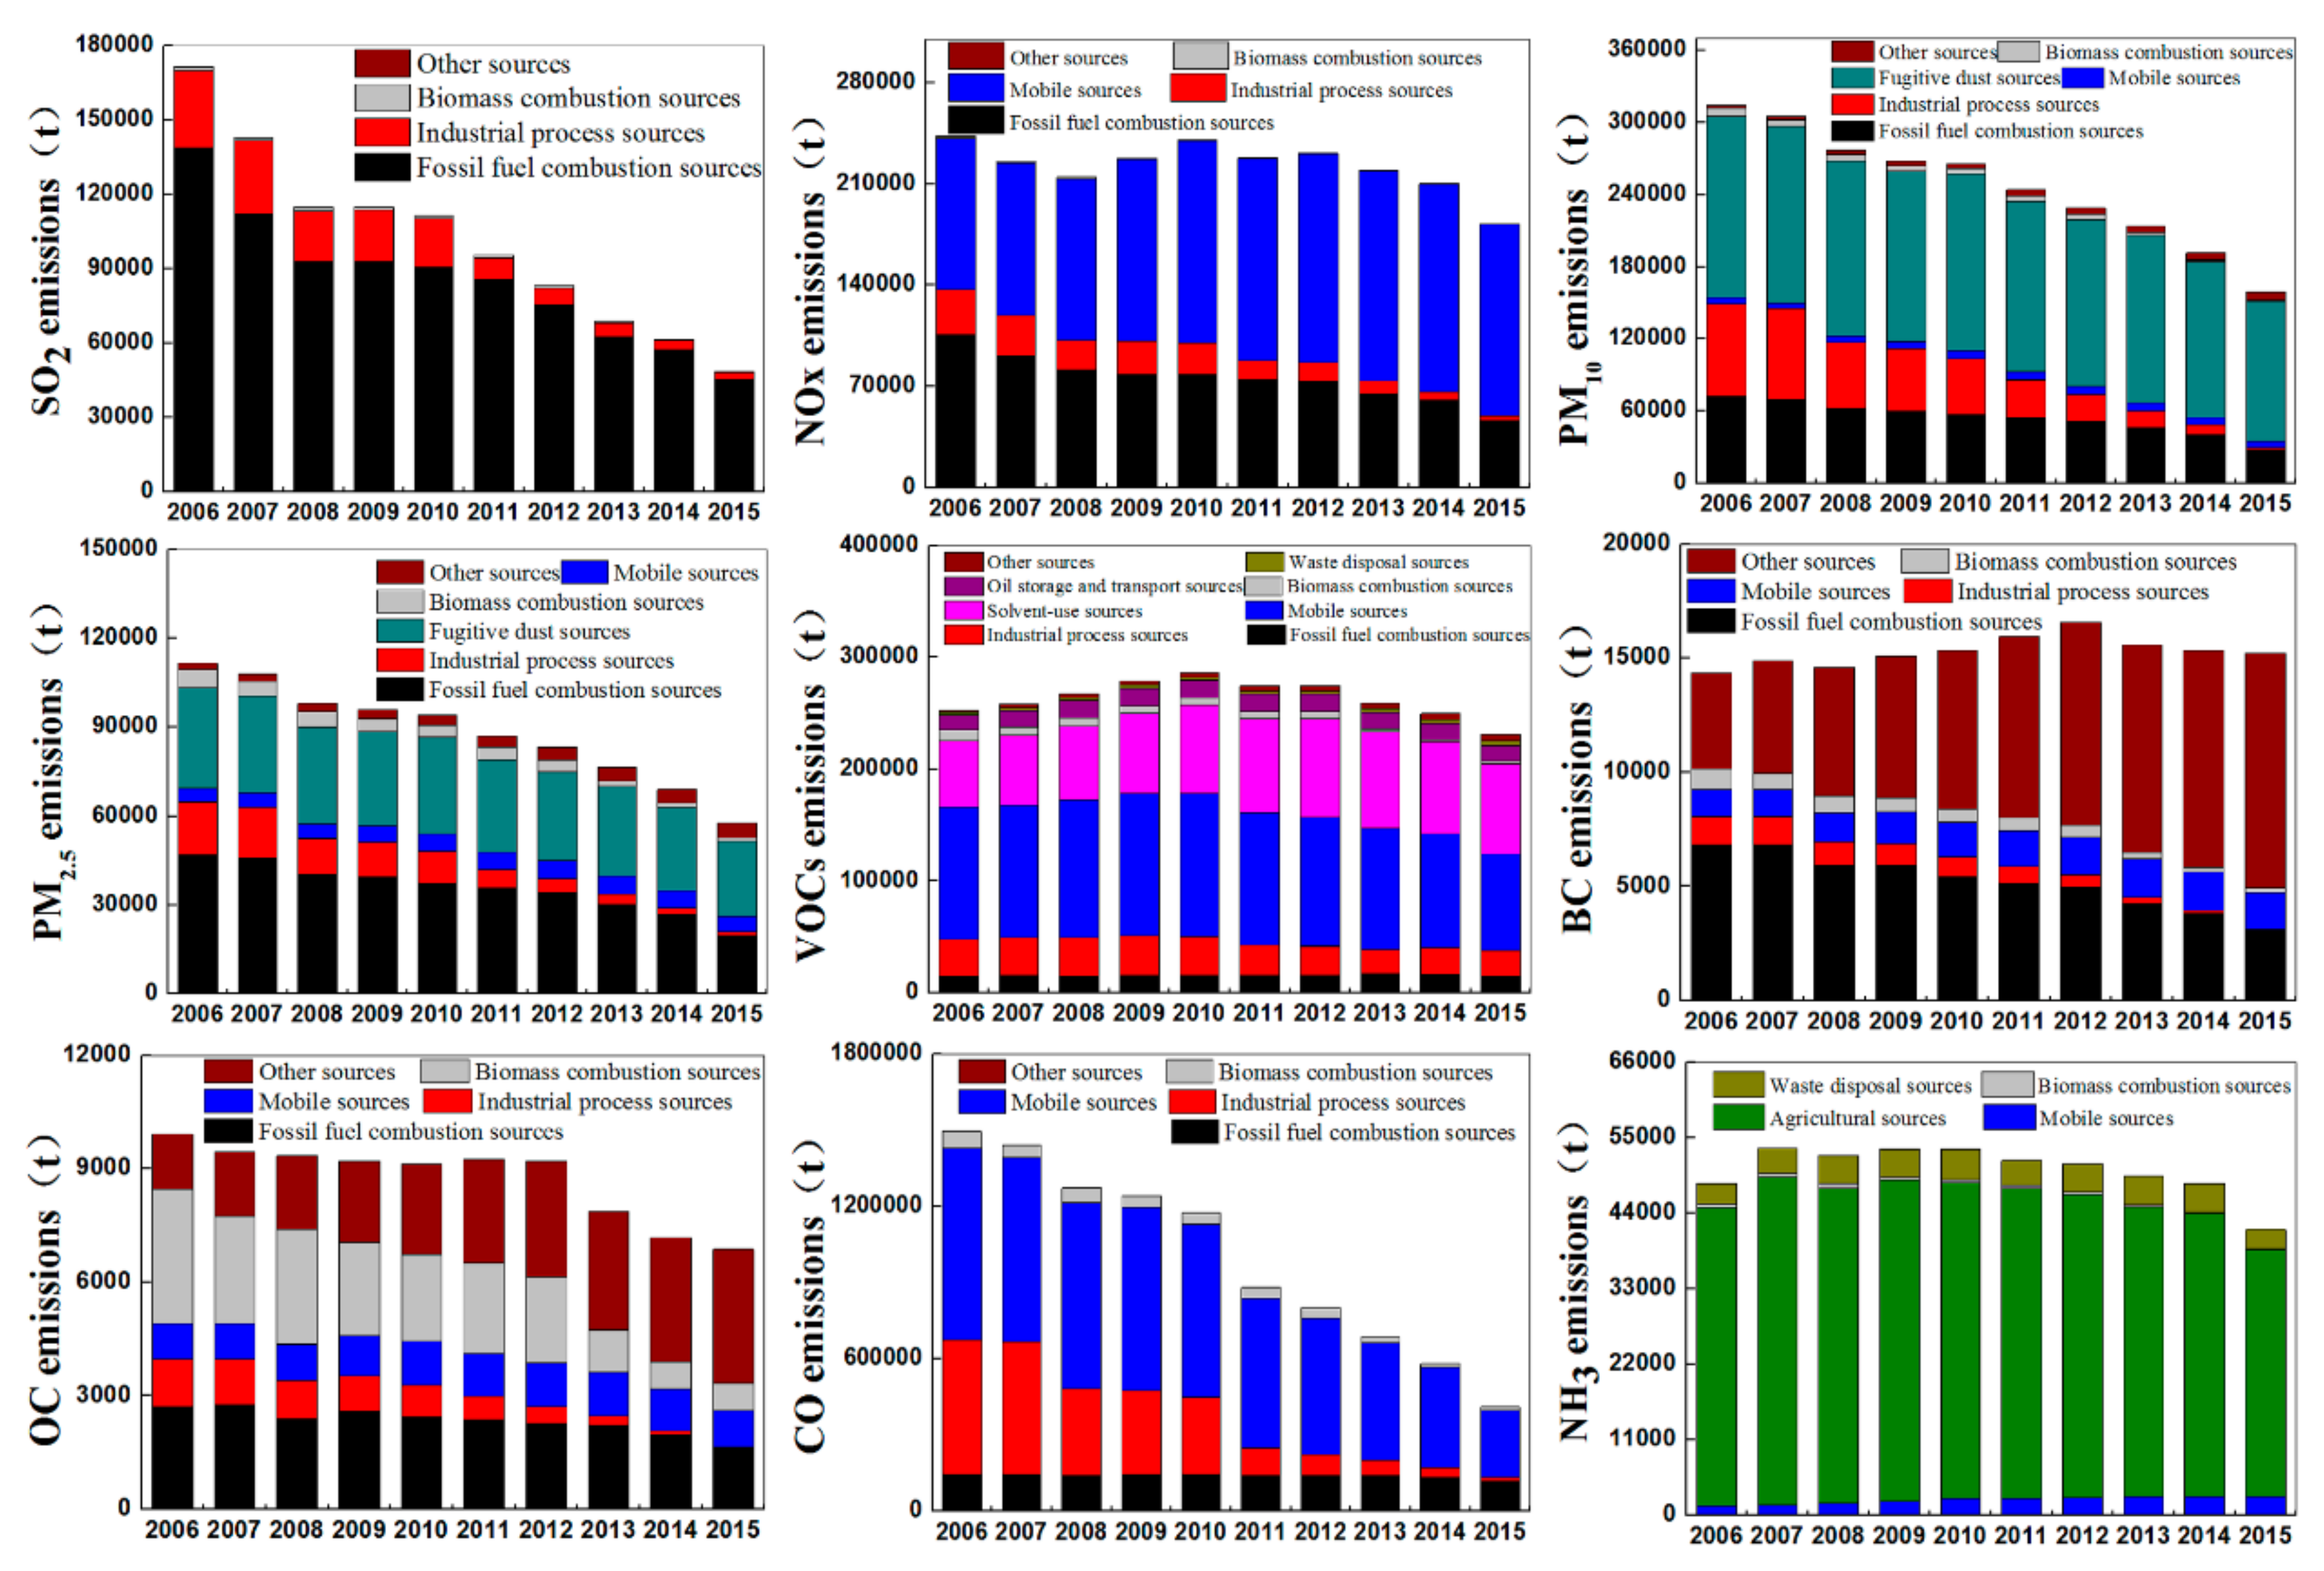
3.1. Temporal Trends of Multiple Air Pollutants Emissions in Beijing

Figure 2 shows the historical emission trends of multiple air pollutants in Beijing from 2006 to 2015. Obvious decline was observed in the emissions of main air pollutants in Beijing. The sum of emissions of six major atmospheric pollutants (PM10, PM2.5, SO2, NOX, VOCs and NH3) in Beijing decreased by 35% in 2015 compared with that in 2006, which was consistent with the trend of air quality variation.
Due to strong controls on coal-fired sources, SO2 emissions fell by a maximum of 71.7%. Beijing has implemented a policy of transformation of coal to natural gas or electricity began with 2005 and decreased approximately 10 million tons coal consumption in 2015. During this period, efficient terminal processing technologies were constantly refurbished and stringent emission standards were implemented [11]. NOX emissions declined to a small extent due to various factors, which was mainly because pollutant emission reductions achieved by the control of coal combustion were partially offset by the increase in pollutant emissions resulting from the rapid increase in natural gas consumption and the number of motor vehicles. PM10 and PM2.5 emissions also decreased to a relatively large extent, which was also mainly attributed to the transition from conventional fossil fuels to clean fuels in industrial coal-fired boilers.
The emission of VOCs first increased and then decreased—the emission of VOCs in 2015 was 2% lower than that in 2006. The absolute amount of VOCs emitted by solvent use increased, the source and end-tail emissions of VOCs had been controlled under more and more enhanced emission standards constraints and product standards constraints in recent years, however, the activity level, such as population and building area, was still increasing considerably, which led to the increasing proportion of emission contribution.
NH3 emissions appeared relatively stable, the main sources of NH3 emissions were livestock and poultry breeding and the application of fertilizer for promoting crop growing in agriculture sector. The most significant change was the increase of NH3 emissions from mobile source, with the share growing from 2.9% in 2006 to 6.6% in 2015. Thus, the issue of NH3 emissions from mobile sources should receive additional attention, especially considering its important contribution for secondary inorganic aerosol (SIA) formation during heavy haze pollution processes in North China [28,29,30].
With the implementation of phased air pollution mitigation measures and the Clean Air Action Plan, the energy structure in Beijing has undergone tremendous changes. The proportion of clean energy has risen, coal consumption has been greatly reduced, and the industrial structure has been adjusted and optimized. Therefore, the decrease in the total amount of air pollutant emissions in Beijing from 2006 to 2015 constitutes the root cause of the improvement in the air quality, energy structure optimization, and industrial restructuring. In the future, the direction of emissions reduction should focus on key and difficult issues, such as the management of heavy-duty diesel vehicles, the reduction of solvent use, and the control of fugitive dust.

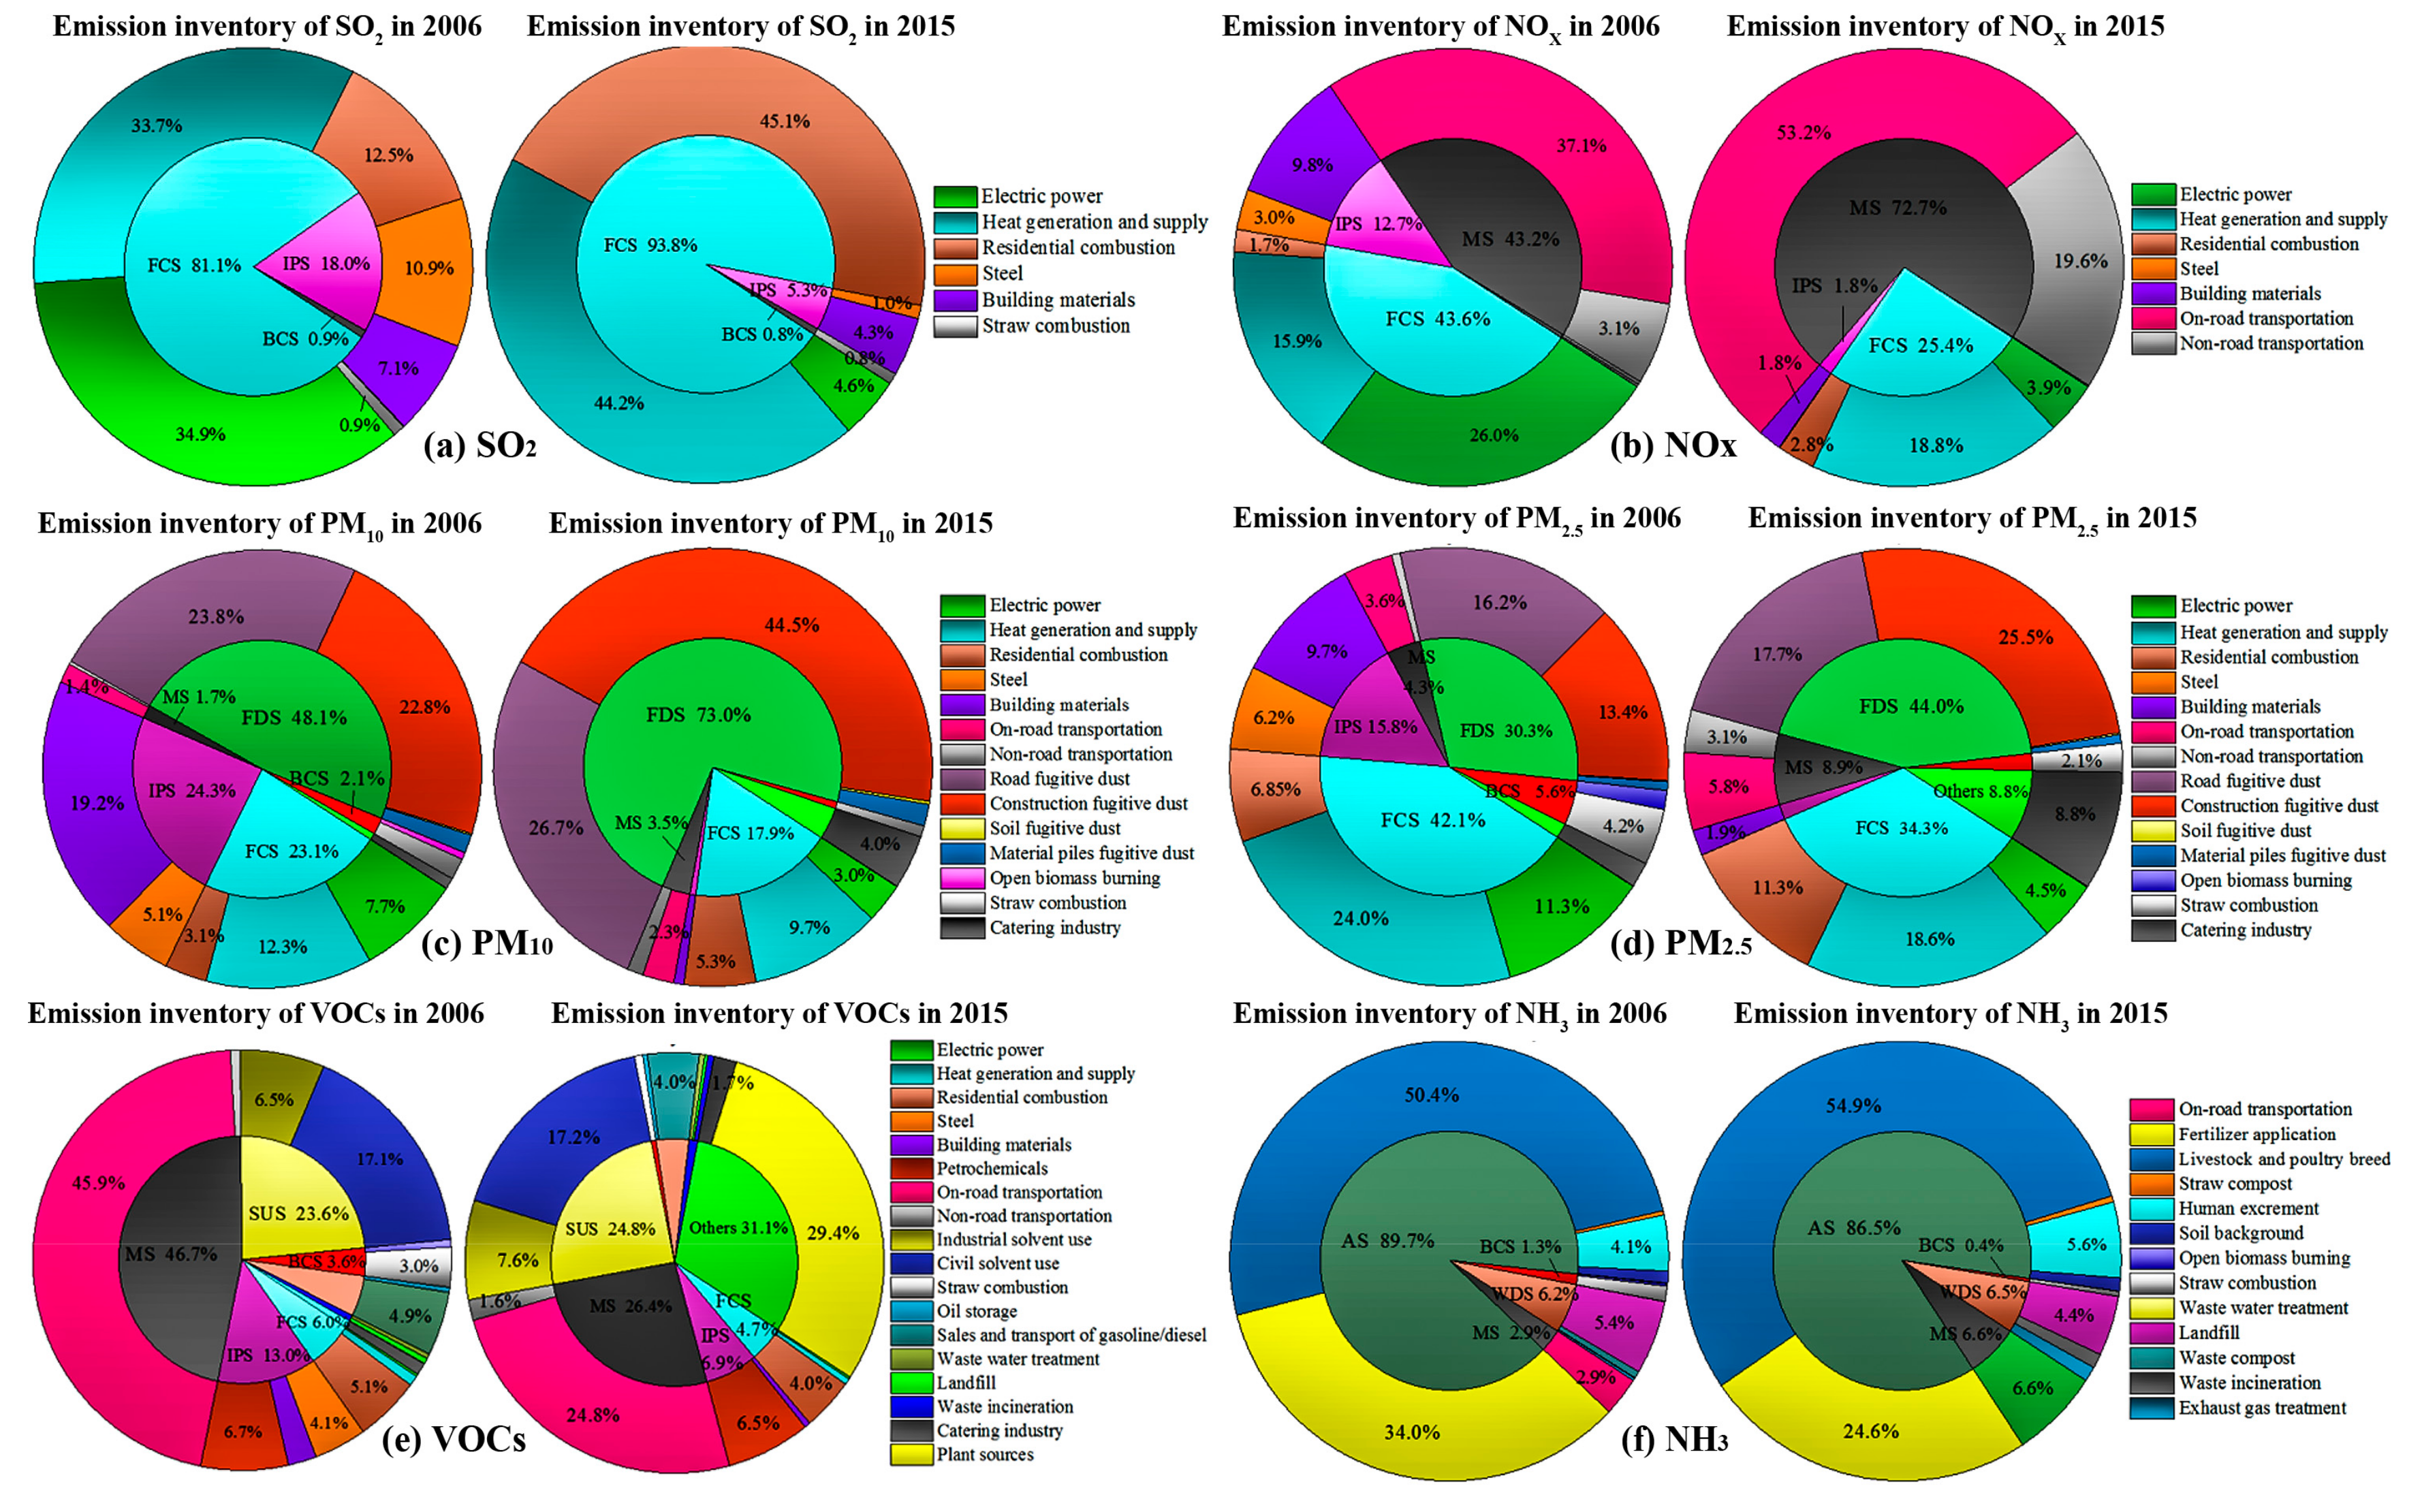
3.2. Contribution of Different Pollution Sources

Over the past ten years, while emissions of main air pollutants in Beijing has decreased, the structure of atmospheric pollution sources in Beijing have also found great changes. Through the implementation of phased air pollution mitigation measures and the Clean Air Action Plan in Beijing, pollution from coal-fired sources and industrial processes was mitigated [14]. Though the emissions from fugitive dust and mobile sources were decreasing, the contribution ratio for the emission of particulate matter and gaseous pollutants increased, since the magnitude of reduction in the industrial sector is much higher.
Along with the obvious energy restructuring in Beijing, relatively significant changes were observed in the proportions of SO2 emissions from subcategories of pollution sources. As can be observed in Figure 3a, the contribution of SO2 emissions from the electric power industry was 34.9% in 2006 and continuously decreased with the implementing de-SO2 control policies in the following years (declining to 4.6% in 2015). Meanwhile, the proportion of SO2 emissions from residential combustion increased from 12.5% in 2006 to 45.1% in 2015. Air pollutants generated from residential coal combustion were normally still discharged directly without any end control measures [31]. Furthermore, the reduction in civil-use coal consumption was very limited. The proportion of NOX emissions from fossil fuel combustion decreased from 43.6% in 2006 to 25.4% in 2015, as can be found in Figure 3b. In contrast, the contribution of NOX emissions from mobile sources increased from 43.2% in 2006 to 72.7% in 2015, thus becoming the predominant sources of NOX emissions.
PM10 emissions from combustion and industrial processes decreased and the proportion of fugitive dust emissions increased (Figure 3c). This finding suggests that controlling particulate emission of point sources in industrial enterprises was relatively effective and de-dusting was widely performed. In contrast, various types of fugitive dust from fugitive area sources (e.g., road fugitive dust and construction fugitive dust) were relatively scattered and difficult to control and monitoring. The trend of changes in the proportion of PM2.5 emissions (Figure 3d) is similar to that of PM10, one obvious difference was that mobile source contributed a certain proportion of total PM2.5 emissions (from 4.3% in 2006 to 8.9% in 2015).
The total VOCs emissions has been reduced, mainly originated from motor vehicle emission reduction, the proportion of VOCs emissions from motor vehicles decreased from 45.9% in 2006 to 35.1% in 2015 (Figure 3e). Contribution from solvent use had been increased, from 23.6% in 2006 to 35.1% in 2015. An increase in the VOCs emissions was observed from the civil solvents use because of the activity level (e.g., population and construction area) has been kept increasing. To mitigate VOCs pollution, the management and control of VOCs emissions from solvent use must be strengthened. The proportion of NH3 emissions from agriculture source decreased to a small extent (Figure 3f), which was mainly related to the decrease in farmland area and the control of the scale of livestock and poultry breeding in Beijing. The increase in the proportion of NH3 emissions from mobile source (from 2.9% in 2006 to 6.6% in 2015) was the most significant change in NH3 emissions. With the change of pollution source structure, the improvement of air quality for Beijing in the future depends on the control of emissions from fugitive dust and mobile sources.

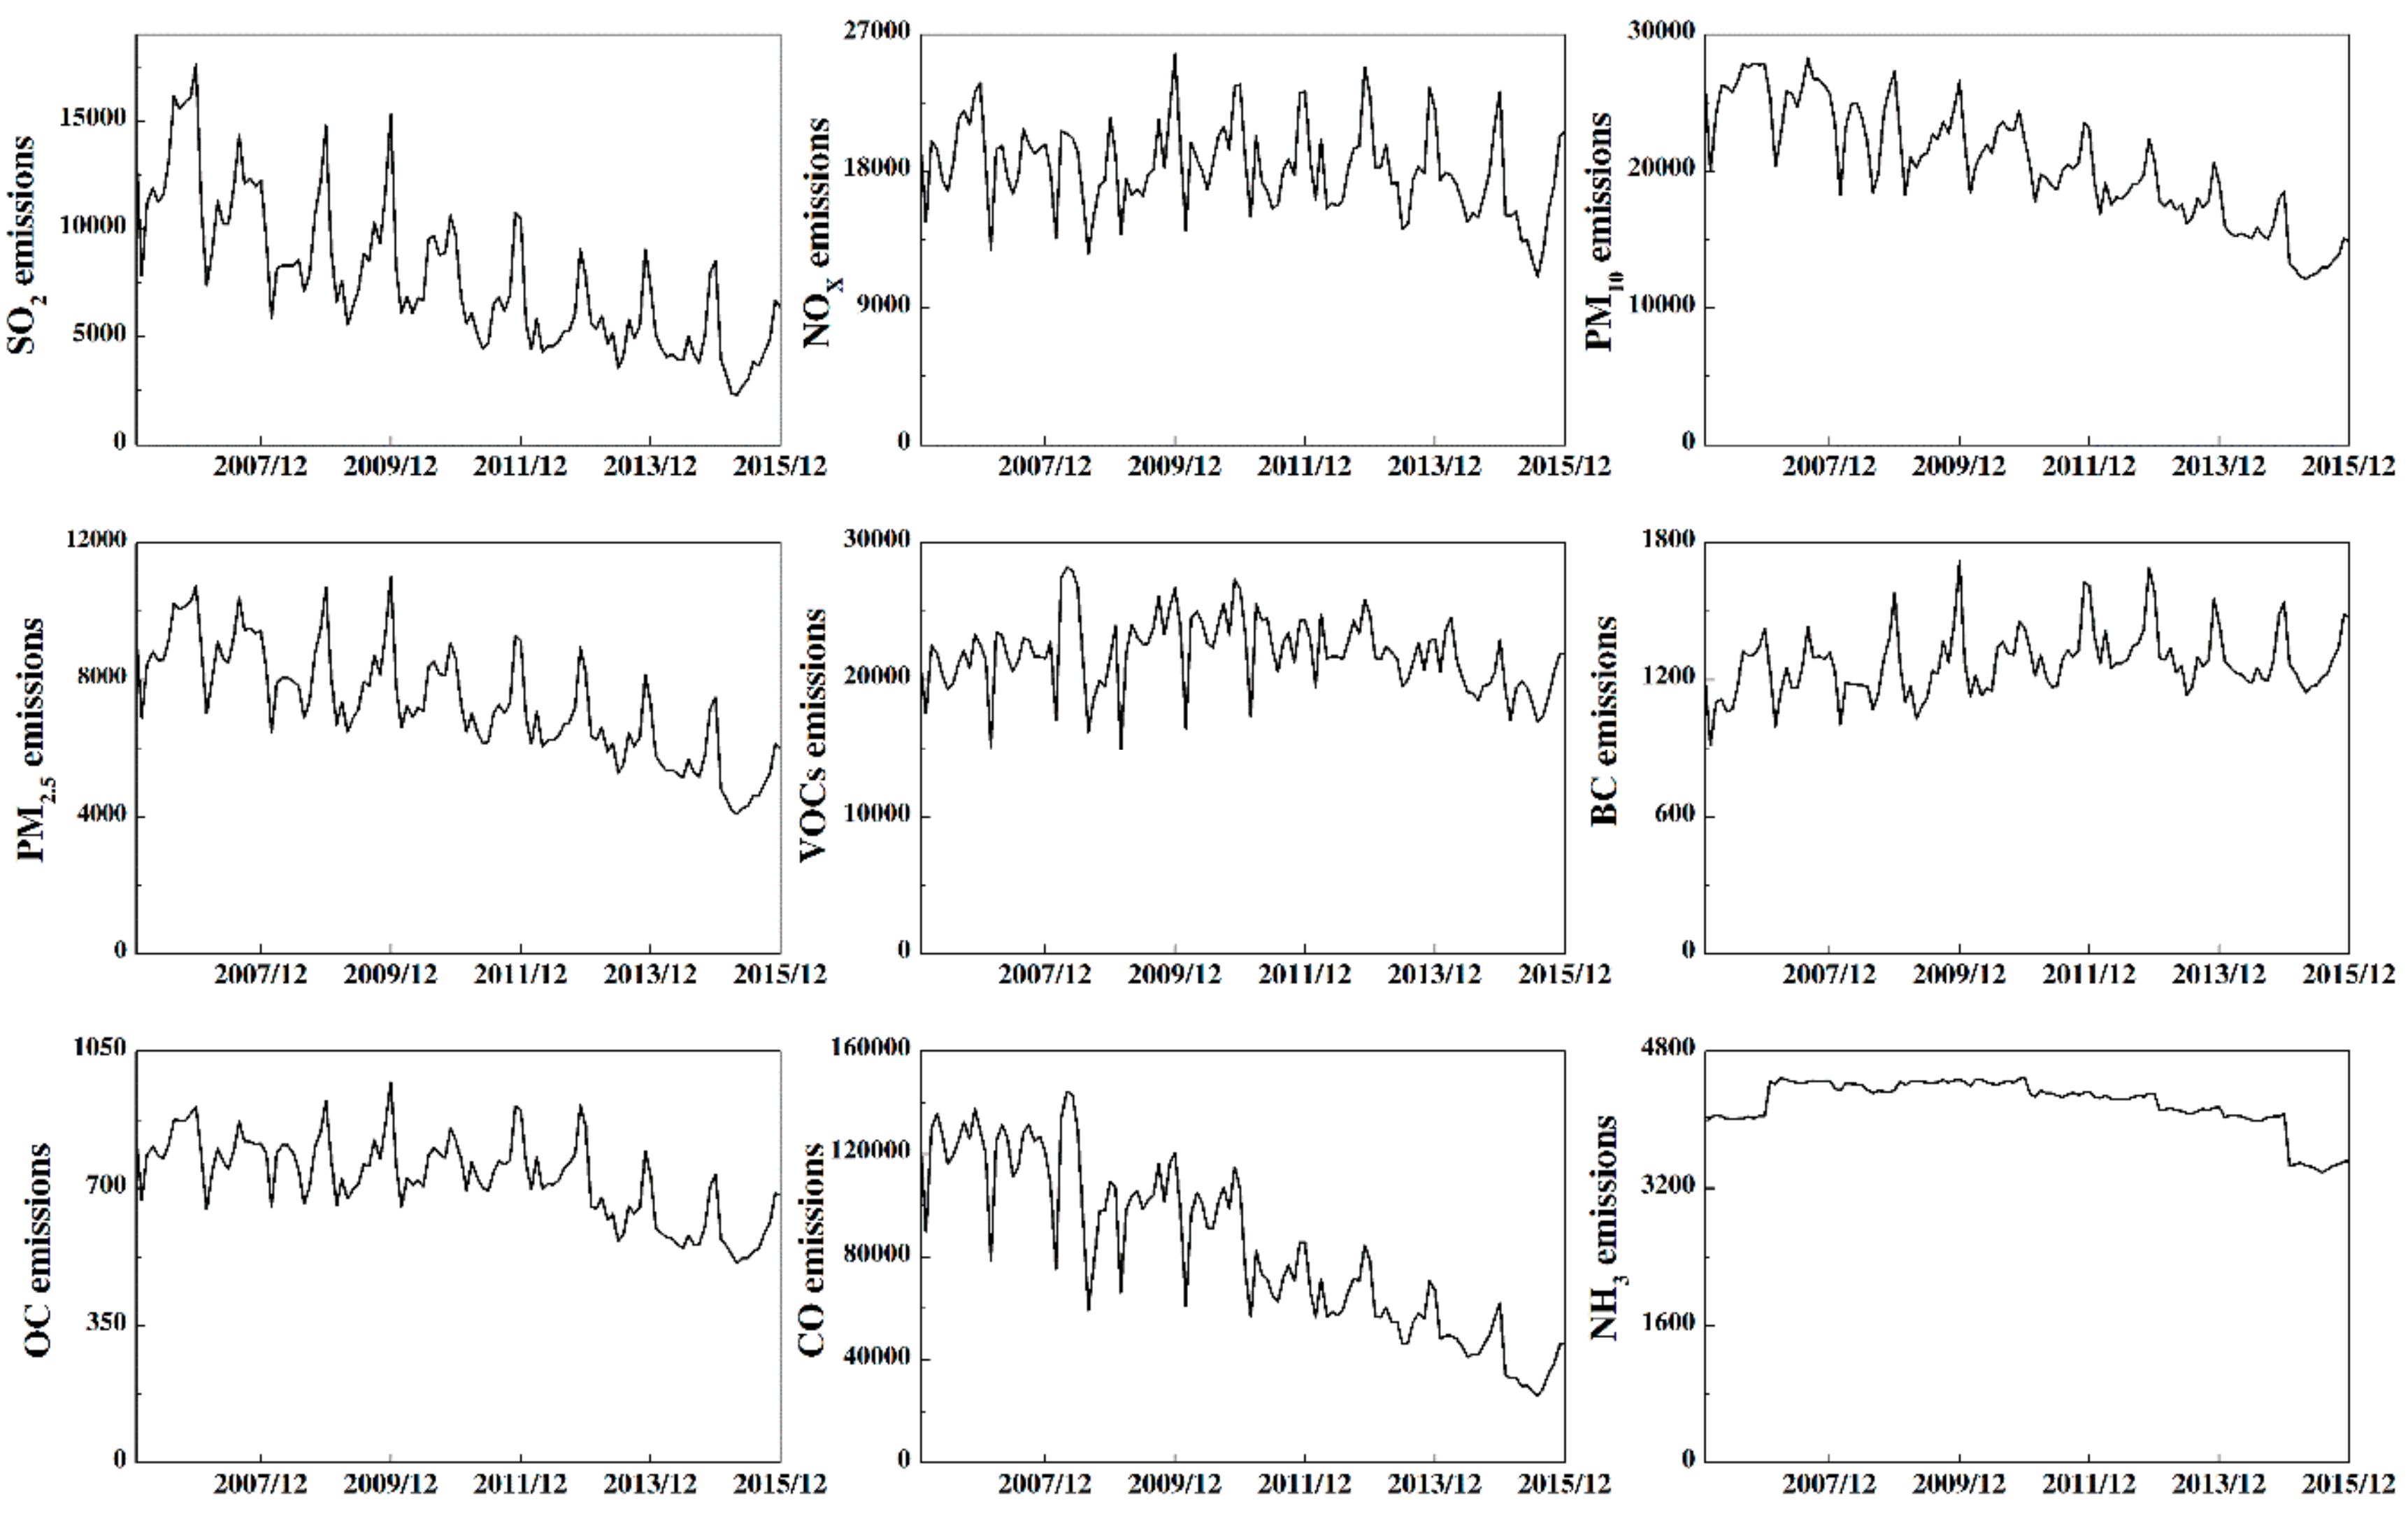
3.3. Monthly Variation Profiles and Characteristics

According to the emission characteristics of each pollution source as well as the monthly changes in activity levels (e.g., monthly fossil fuel power production, monthly industrial boiler output and monthly industrial product output), the monthly variation profiles of main air pollutants emissions between January 2006 and December 2015 are plotted in Figure 4.
A noticeable periodic variation trend can be observed for the emissions of primary air pollutants, including SO2, PM10, PM2.5 and CO. Moreover, the monthly NOX, VOCs, BC and OC emissions have undergone relatively obvious changes but did not decrease significantly on a periodic basis, suggesting that the emissions of these pollutants were relatively difficult to control. From a seasonal distribution perspective, pollutant emissions were significantly higher during the heating season than the non-heating season because of increased heating demand in winter. Pollutant emissions peaked between November and January of the following year along with increased fuel consumption for heating.
The emissions of SO2, CO, PM10 and PM2.5 demonstrated an obvious downward tendency due to the change in coal combustion but presented obvious seasonal variations based on the heating period. NOX, VOCs, BC and OC were less affected by industry and coal combustion, and the seasonal variations were not as obvious as compared with the other pollutants.

3.4. Spatial Distribution Characteristics

Based on the geographical location characteristics of various types of pollution sources, the spatial distribution of the emissions was used to produce a 3 km × 3 km grid of pollutants for the years 2006 and 2015. As demonstrated in Figure 5a,b the common spatial distribution characteristics of these two years indicated that emissions of the main air pollutants were mainly concentrated in southeastern Beijing and presented high values in the south and low values in the north. The emissions intensity was also significantly higher in the urban downtown and functional development areas than in the suburban counties, which was mainly related to the population activity distribution. The spatial distribution characteristics of pollutant emissions between 2006 and 2015 differed obviously due to a decrease in the spatial emission intensity over this 10-year period for most air pollutants. Highly polluted industries, such as the metallurgical industry (e.g., iron and steel casting) and the building material industry (e.g., cement, brick and tile, lime, gypsum and glass), were either shut down or subjected to capacity cuts.
From the perspective of the spatial distribution of the air pollutants, the air pollutant emissions are concentrated in the southeastern part of Beijing. The emission intensity of urban core and functional development areas is much higher than that of suburban areas, which is closely related to the regional population activity. The difference is that the spatial emission intensity of most atmospheric pollutants in Beijing have been reduced substantially during the ten years from 2006 to 2015. The regulation of the energy structure has resulted disappearance of large areas of CO and SO2 pollution, and the scope of pollution has continuously narrowed. However, due to the influences of fugitive dust, the extent of particulates is still relatively large. The extent of NOX emissions exhibits obvious linear pollution characteristics, and they are closely correlated with road networks and highly concentrated over the urban expressways, outgoing highways and loop connecting lines. The intensity and extent of NH3 emissions do not change significantly in space. The spatial distribution of air pollutants in the past decade illustrate that the emission intensity of air pollutants associated with industrial point sources in Beijing has declined, but more visible, linear and area pollution characteristics were present. In the future, pollutants emissions reduction requires more refined environmental management and law enforcement supervision.

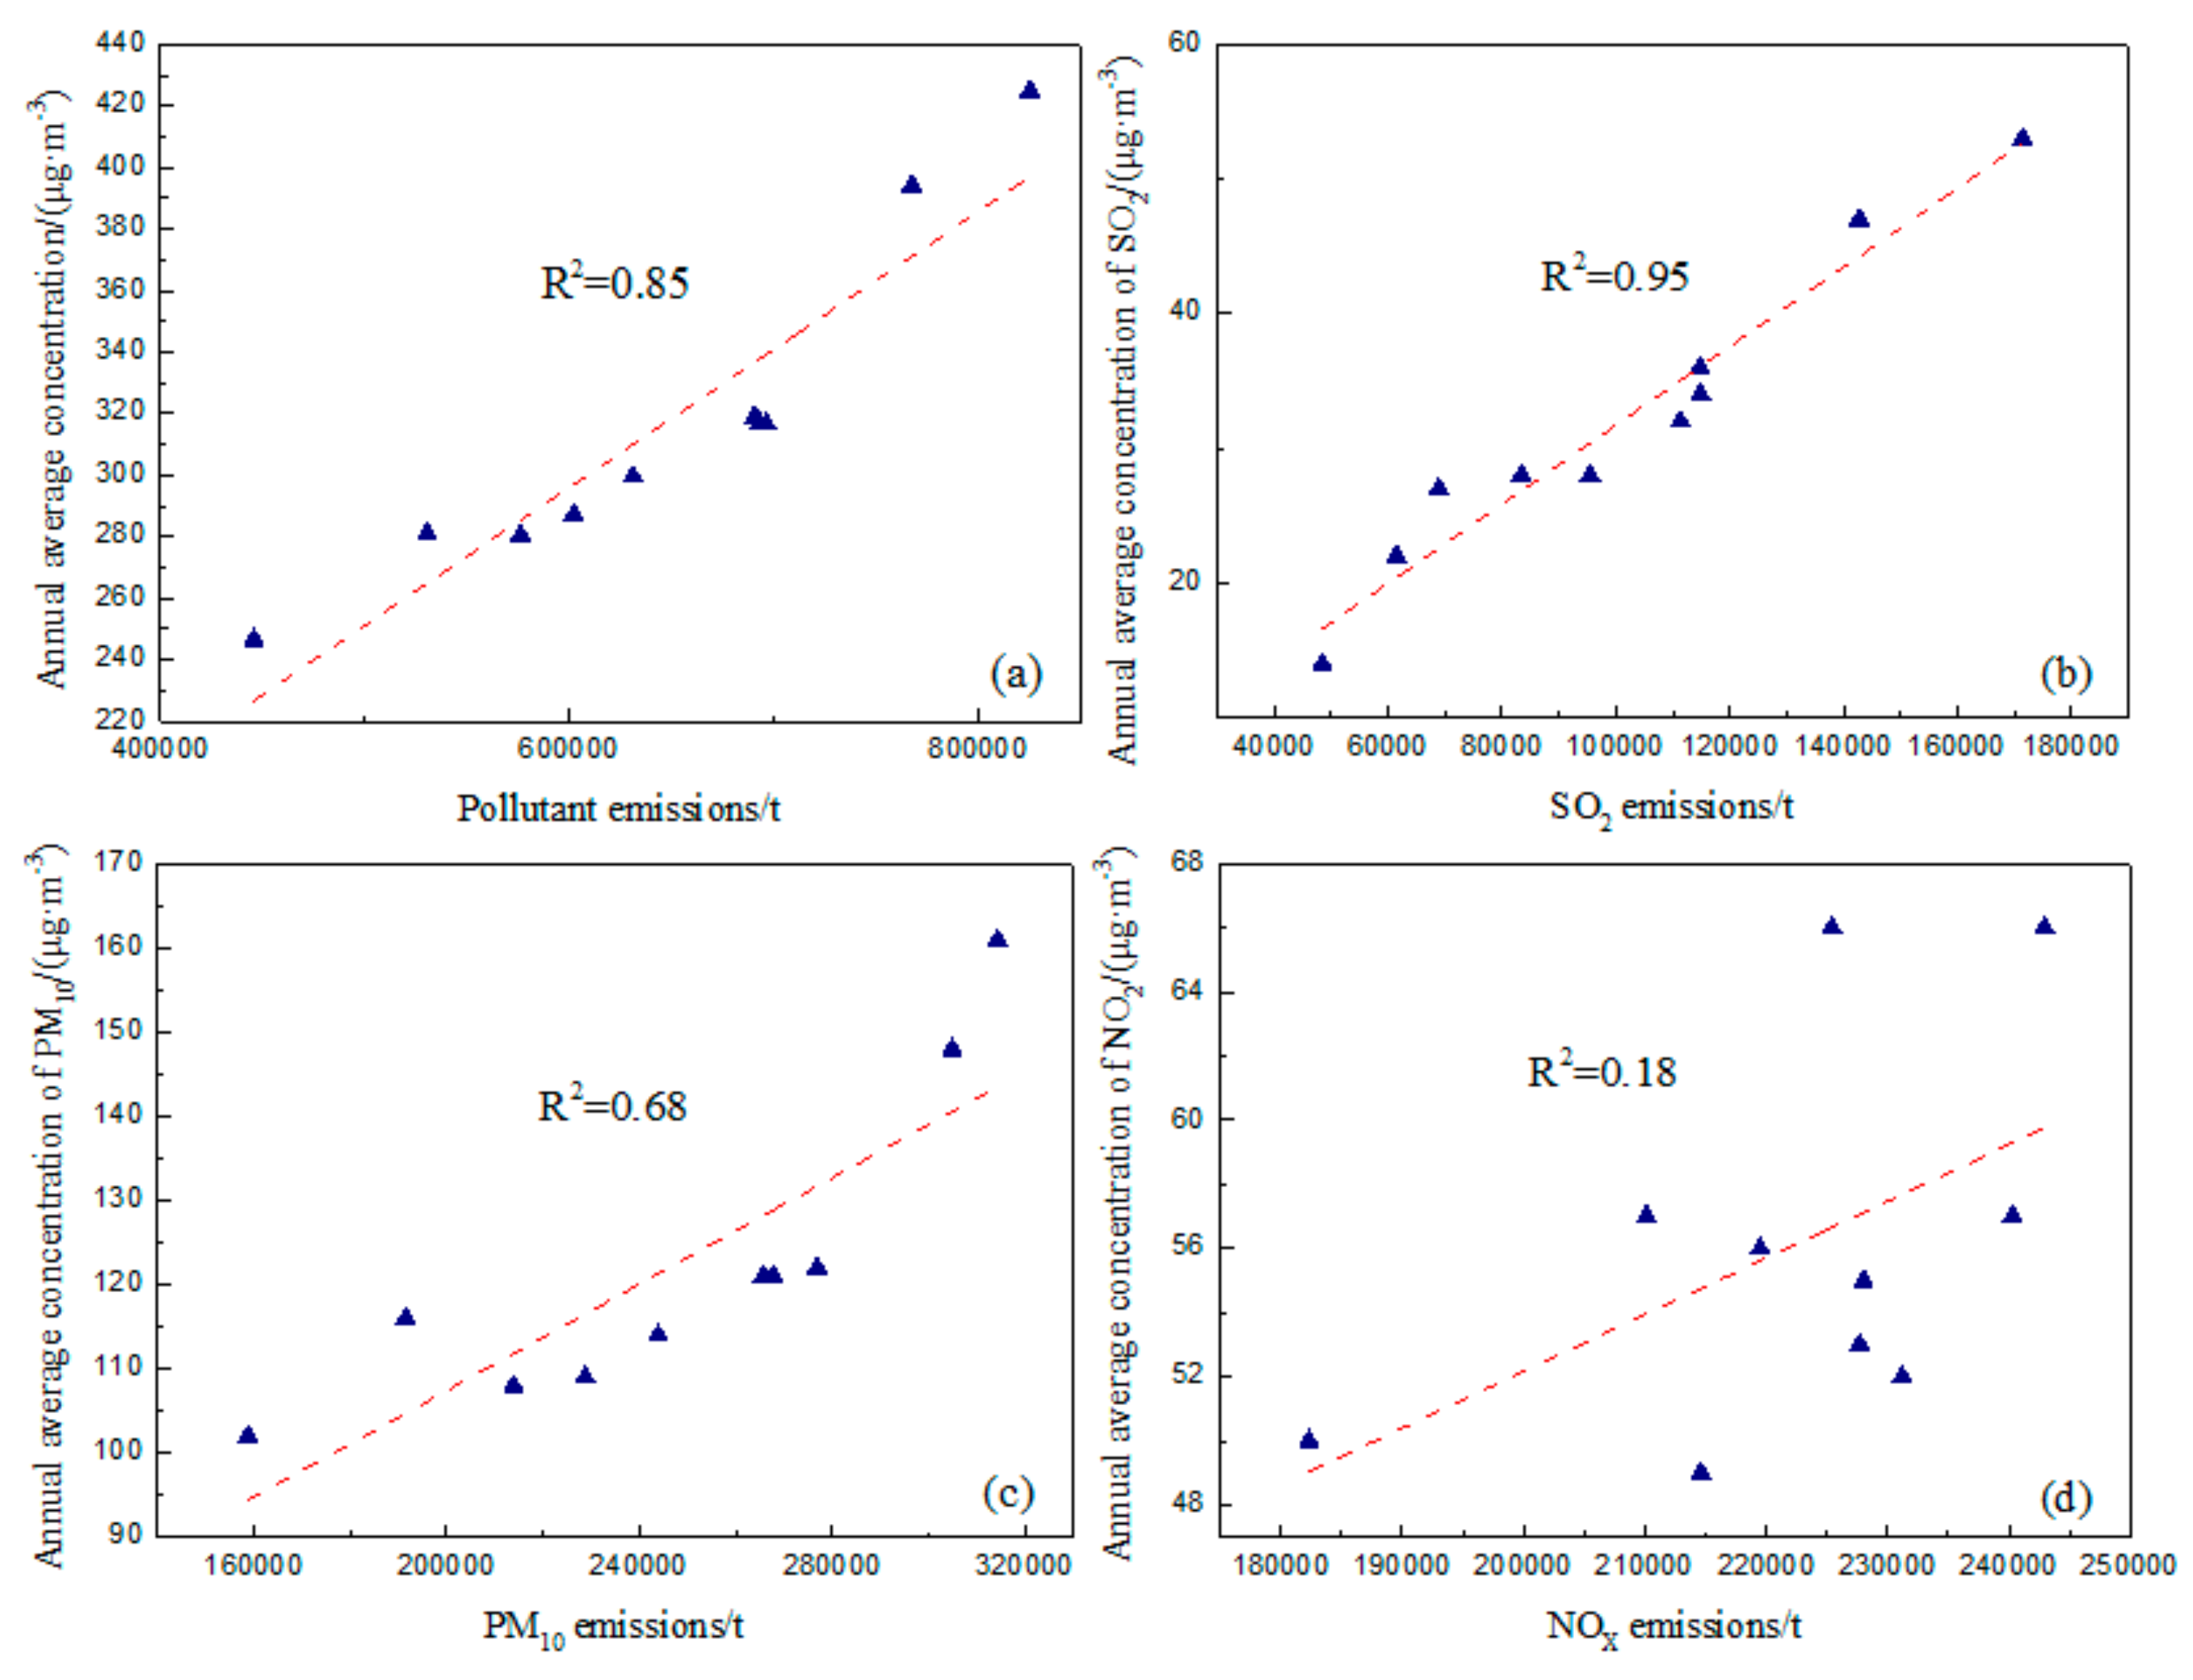
3.5. Correlation Analysis Between Pollutant Emissions and Annual Average Pollutant Concentration

To initially explore the accuracy of the emission inventory and to evaluate the effect of pollutant emissions on air quality improvement, correlation analysis between Beijing air pollutant emissions and ambient air quality concentrations (data from 11 national monitoring stations issued by the Beijing Municipal Environmental Protection Monitoring Center, which have been conducted strict quality audit and calibration with the background monitoring site) from 2006 to 2015 was discussed. Figure 6a shows the correlation between the sum of the emissions of four major air pollutants (SO2, NOX, PM10, PM2.5) and the sum of the ambient air concentrations of the four pollutants. It could be seen that the change of air pollutant emissions from 2006 to 2015 had a good correlation with the change of air quality concentration, and the R2 (coefficient of determination) value was 0.85, which also indicated that the reduction of pollutant emissions was the root cause of air quality improvement. Figure 6b shows the correlation between SO2 emission changes and SO2 concentration changes in ambient air, R2 was reaching 0.94. The decrease in SO2 emissions was very effective in reducing the ambient concentration of pollutants. There was also a good correlation between changes in particulate matter emissions and ambient air pollution concentrations (Figure 6c). Part of the NOX (including NO and NO2, etc.) emitted into the air was converted into PM2.5 and O3, and only a part of NOX was recognized as NO2 concentration. Furthermore, it was also reflected in PM2.5 and O3 ambient concentrations. Therefore the correlation between NOX emissions and ambient air NO2 concentration was low, R2 is only 0.18. Correlation analysis indicated that the reduction of atmospheric pollutant emissions and the decrease of ambient air concentration showed a good correlation, which represents the important internal reason for the improvement of air quality, and also reflected the accuracy of the historical emissions inventory accounting.

3.6. Uncertainty Analysis for Emission Inventory

By simulating the uncertainty propagation of the activity levels and EFs in the whole calculation process using a Monte Carlo simulation method, the uncertainties of air pollutant emissions from various pollution sources in 2015 were analyzed and listed in Table 1.
As can be observed in Table 1, the uncertainty scopes for SO2, NOX, PM10, PM2.5, VOCs, CO, BC, OC and NH3 emissions, i.e., primary air pollutants included in the 2015 Beijing emission inventory, are estimated at −20%~29%, −41%~44%, −39%~54%, −42%~57%, −67%~78%, −22%~32%, −21%~30%, −33%~39% and −27%~36%, respectively. FCS presented the least uncertainty of emissions, which was related to the detailed energy consumption and detailed emission factors of electric and industrial boilers under this category. The uncertainty of industrial process source emissions was also relatively low, which was mainly because these enterprises were mostly based on point source accounting, and the activity level data was more detailed. MS were accounted for based on the quantity of possession, and they lacked localized emission factors, resulting in a large difference between the emissions and actual situation, which led to greater uncertainty. Due to the lack of direct statistical data of biomass combustion emissions, the uncertainty of biomass emissions was relatively high. The uncertainty of solid waste treatment sources was relatively low, which was mainly due to the detailed classification of emission sources.

4. Conclusions

To explore the internal factors of air quality changes and to analyze the effects of emission variations characteristics of different source categories on the air quality of Beijing, this study combines characteristics of air pollution sources in Beijing and constructs a system for the preparation of comprehensive emission inventories. Temporal changes and spatial distribution characteristics of the atmospheric pollution sources in Beijing are identified, the contribution from each pollution source to total emissions in the different period is quantified, and variations in the air pollution emissions and their impacts on the air quality over Beijing are discussed.
From the perspective of the long-term sequence of air pollution emissions, a decrease in the total emissions of air pollutants in Beijing over the ten-year period from 2006 to 2015 was the fundamental reason of the improvement in air quality. The sum of emissions of six major atmospheric pollutants of 2015 in Beijing decreased by an average of 35% compared with that of 2006, which was well consistent with the trend of air quality change, thus showing a good correlation. With the implementation of phased air pollution mitigation measures and the Clean Air Action Plan, the energy structure in Beijing has undergone tremendous changes. Energy structure optimization and industrial restructuring were key to decreasing the emissions of primary air pollutants, and accordingly improving air quality.
The sustained improvement of air quality in Beijing still faces great challenges. In the future, Beijing should comprehensively use legal, economic, technical, and administrative means to focus on key and difficult issues, such as heavy-duty diesel vehicles, fugitive dust in urban construction and management, and the treatment of volatile organic compounds in order to further promote the reduction of primary air pollutants emissions. Learning from the practices and experience of Beijing, other megacities and regions should focus on pollution reduction by optimizing their respective energy and industrial structures to improve the air quality.

Supplementary Materials

The following are available online at https://www.mdpi.com/2073-4433/10/9/494/s1, Table S1. The list of abbreviations and notations; Table S2: Classification and activity level of air pollutant emission sources in Beijing; Table S3 Atmospheric pollutant emission factors of fossil fuel combustion sources; Table S4 Atmospheric pollutant emission factors of industrial process sources; Table S5 VOCs emission factors of solvent-use sources; Table S6 Emission factors of biomass combustion sources; Table S7 Emission factors of oil and gas storage, transportation and sales; Table S8 Emission factors of waste disposal sources; Table S9 Emission factors of catering industry.

Author Contributions

Conceptualization, Y.X. and H.T.; methodology, A.S., Z.Z. and X.W.; formal analysis, Y.X., S.Z. and K.W.; investigation, K.L. and K.X.; data curation, Y.X. and S.Z.; writing—original draft preparation, Y.X.; writing—review and editing, H.T. and A.S.

Funding

This work was supported by the National Natural Science Foundation of China (21806012, 21777008); the National Key Research and Development Program of China (2016YFC0201501, 2016YFC0201106, 2018YFC0213202); the Science Foundation of Beijing Municipal Research Institute of Environmental Protection (2019B02).

Conflicts of Interest

The authors declare no conflict of interest.

References

  1. Matter, J.M.; Stute, M.; Snaebjornsdottir, S.O.; Oelkers, E.H.; Gislason, S.R.; Aradottir, E.S.; Sigfusson, B.; Gunnarsson, I.; Sigurdardottir, H.; Gunnlaugsson, E.; et al. Rapid carbon mineralization for permanent disposal of anthropogenic carbon dioxide emissions. Science 2016, 352, 1312–1314. [Google Scholar] [CrossRef] [Green Version]
  2. Pan, Y.P.; Tian, S.L.; Liu, D.W.; Fang, Y.T.; Zhu, X.Y.; Zhang, Q.; Zheng, B.; Michalski, G.; Wang, Y.S. Fossil Fuel Combustion-Related Emissions Dominate Atmospheric Ammonia Sources during Severe Haze Episodes: Evidence from N-15-Stable Isotope in Size-Resolved Aerosol Ammonium. Environ. Sci. Technol. 2016, 50, 8049–8056. [Google Scholar] [CrossRef]
  3. Lin, C.A.; Chen, Y.C.; Liu, C.Y.; Chen, W.T.; Seinfeld, J.H.; Chou, C.K. Satellite-Derived Correlation of SO2, NO2, and Aerosol Optical Depth with Meteorological Conditions over East Asia from 2005 to 2015. Remote Sens. 2019, 11, 1738. [Google Scholar] [CrossRef]
  4. Huang, R.J.; Zhang, Y.L.; Bozzetti, C.; Ho, K.F.; Cao, J.J.; Han, Y.M.; Daellenbach, K.R.; Slowik, J.G.; Platt, S.M.; Canonaco, F.; et al. High secondary aerosol contribution to particulate pollution during haze events in China. Nature 2014, 514, 218–222. [Google Scholar] [CrossRef] [Green Version]
  5. Xue, Y.F.; Zhou, Z.; Nie, T.; Wang, K.; Nie, L.; Pan, T.; Wu, X.Q.; Tian, H.Z.; Zhong, L.H.; Li, J.; et al. Trends of multiple air pollutants emissions from residential coal combustion in Beijing and its implication on improving air quality for control measures. Atmos. Environ. 2016, 142, 303–312. [Google Scholar] [CrossRef]
  6. Zou, Y.F.; Wang, Y.H.; Zhang, Y.Z.; Koo, J.H. Arctic sea ice, Eurasia snow, and extreme winter haze in China. Sci. Adv. 2017, 3, e1602751. [Google Scholar] [CrossRef]
  7. Guerreiro, C.B.B.; Foltescu, V.; Leeuw, F.D. Air quality status and trends in Europe. Atmos. Environ. 2014, 98, 376–384. [Google Scholar] [CrossRef] [Green Version]
  8. Kuklinska, K.; Wolska, L.; Namiesnik, J. Air quality policy in the U.S. and the EU—A review. Atmos. Pollut. Res. 2015, 6, 129–137. [Google Scholar] [CrossRef]
  9. Sullivan, T.J.; Driscoll, C.T.; Beier, C.M.; Burtraw, D.; Fernandez, I.J.; Galloway, G.N.; Gay, D.A.; Goodale, C.L.; Likens, G.E.; Lovett, G.M.; et al. Air pollution success stories in the United States: The value of long-term observations. Environ. Sci. Policy 2018, 84, 69–73. [Google Scholar] [CrossRef]
  10. Gao, J.M.; Xu, X.H.; Ying, Z.K.; Jiang, L.; Zhong, M.H.; Wang, A.X.; Chen, L.C.; Lu, B.; Sun, Q.H. Post-Effect of Air Quality Improvement on Biomarkers for Systemic Inflammation and Microparticles in Asthma Patients After the 2008 Beijing Olympic Games: a Pilot Study. Inflammation 2017, 40, 1214–1224. [Google Scholar] [CrossRef]
  11. Zeng, X.T.; Tong, Y.F.; Cui, L.; Kong, X.M.; Sheng, Y.N.; Chen, L.; Li, Y.P. Population-production-pollution nexus based air pollution management model for alleviating the atmospheric crisis in Beijing, China. J. Environ. Manag. 2017, 197, 507–521. [Google Scholar] [CrossRef]
  12. Wang, G.; Cheng, S.Y.; Wei, W.; Yang, X.M.; Wang, X.Q.; Jia, J.; Lang, J.L.; Lv, Z. Characteristics and emission-reduction measures evaluation of PM2.5 during the two major events: APEC and Parade. Sci. Total Environ. 2017, 595, 81–92. [Google Scholar] [CrossRef]
  13. Wang, J.; Xi, F.; Zhu, L.; Bing, L.; Alsaedi, A.; Hayat, T.; Ahmad, B.; Guan, D. The spatiotemporal features of Greenhouse Gases Emissions from Biomass Burning in China from 2000–2012. J. Clean. Prod. 2018, 181, S0959652618302348. [Google Scholar] [CrossRef]
  14. Cheng, J.; Su, J.P.; Cui, T.; Li, X.; Dong, X.; Sun, F.; Yang, Y.Y.; Tong, D.; Zheng, Y.X.; Li, Y.S.; et al. Dominant role of emission reduction in PM2.5 air quality improvement in Beijing during 2013–2017: A model-based decomposition analysis. Atmos. Chem. Phys. 2019, 19, 6125–6146. [Google Scholar] [CrossRef]
  15. He, K.B. Technical Manual for the Preparation of Urban Air Pollutants Emission Inventory; China Environmental Science Press: Beijing, China, 2019. [Google Scholar]
  16. Zheng, B.; Zhang, Q.; Tong, D.; Chen, C.C.; Hong, C.P.; Li, M.; Geng, G.N.; Lei, Y.; Huo, H.; He, K.B. Resolution dependence of uncertainties in gridded emission inventories: A case study in Hebei, China. Atmos. Chem. Phys. 2017, 17, 921–933. [Google Scholar] [CrossRef]
  17. Qi, J.; Zheng, B.; Li, M.; Yu, F.; Chen, C.C.; Liu, F.; Zhou, X.F.; Yuan, J.; Zhang, Q.; He, K.B. A high-resolution air pollutants emission inventory in 2013 for the Beijing-Tianjin-Hebei region, China. Atmos. Environ. 2017, 170, 156–168. [Google Scholar] [CrossRef]
  18. Tian, Y.L.; Jiang, Y.; Liu, Q.; Xu, D.X.; Zhao, S.D.; He, L.H.; Liu, H.J.; Xu, H. Temporal and spatial trends in air quality in Beijing. Landsc. Urban Plan. 2019, 185, 35–43. [Google Scholar] [CrossRef]
  19. BMBS (Beijing Municipal Bureau of Statistics). Beijing Statistical Yearbook. 2007. Available online: http://tjj.beijing.gov.cn/nj/main/2007/index.htm (accessed on 1 November 2018).
  20. BMBS (Beijing Municipal Bureau of Statistics). Beijing Statistical Yearbook. 2016. Available online: http://tjj.beijing.gov.cn/nj/main/2016-tjnj/zk/indexch.htm (accessed on 1 November 2018).
  21. Jing, B.Y.; Wu, L.; Mao, H.J.; Gong, S.N.; He, J.J.; Zou, C.; Song, G.H.; Li, X.Y.; Wu, Z. Development of a vehicle emission inventory with high temporal–spatial resolution based on NRT traffic data and its impact on air pollution in Beijing—Part 1: Development and evaluation of vehicle emission inventory. Atmos. Chem. Phys. 2016, 16, 3161–3170. [Google Scholar] [CrossRef]
  22. Yang, W.; Yu, C.Y.; Yuan, W.; Wu, X.Y.; Zhang, W.; Wang, X.J. High-resolution vehicle emission inventory and emission control policy scenario analysis, a case in the Beijing-Tianjin-Hebei (BTH) region, China. J. Clean. Prod. 2018, 203, 530–539. [Google Scholar] [CrossRef]
  23. Liu, H.J.; Wu, B.B.; Liu, S.H.; Shao, P.Y.; Liu, X.Y.; Zhu, C.Y.; Wang, Y.; Wu, Y.M.; Xue, Y.F.; Gao, J.J.; et al. A regional high-resolution emission inventory of primary air pollutants in 2012 for Beijing and the surrounding five provinces of North China. Atmos. Environ. 2018, 181, 20–33. [Google Scholar] [CrossRef]
  24. Zhao, B.; Wang, S.X.; Liu, H.; Xu, J.Y.; Fu, K.; Klimont, Z.; Hao, J.M.; He, K.B.; Cofala, J.; Amann, M. NOx emissions in China: historical trends and future perspectives. Atmos. Chem. Phys. 2013, 13, 16047–16112. [Google Scholar] [CrossRef]
  25. Qiu, P.P.; Tian, H.Z.; Zhu, C.Y.; Liu, K.; Gao, J.J.; Zhou, J.R. An elaborate high resolution emission inventory of primary air pollutants for the Central Plain Urban Agglomeration of China. Atmos. Environ. 2014, 86, 93–101. [Google Scholar] [CrossRef]
  26. Tian, H.Z.; Zhu, C.Y.; Gao, J.J.; Cheng, K.; Hao, J.M.; Wang, K.; Hua, S.B.; Wang, Y.; Zhou, J.R. Quantitative assessment of atmospheric emissions of toxic heavy metals from anthropogenic sources in China: historical trend, spatial distribution, uncertainties, and control policies. Atmos. Chem. Phys. 2015, 15, 10127–10147. [Google Scholar] [CrossRef] [Green Version]
  27. Zhu, C.Y.; Tian, H.Z.; Hao, Y.; Gao, J.J.; Hao, J.M.; Wang, Y.; Hua, S.B.; Wang, K.; Liu, H.J. A high-resolution emission inventory of anthropogenic trace elements in Beijing-Tianjin-Hebei (BTH) region of China. Atmos. Environ. 2018, 191, 452–462. [Google Scholar] [CrossRef]
  28. UN (United Nation) Environment. A Review of 20 Years’ Air Pollution Control in Beijing. 2019. Available online: http://sthjj.beijing.gov.cn/bjhrb/ztzl/bj20ndqwrzllcyzw/index.html (accessed on 15 April 2019).
  29. Wang, Y.H.; Wang, Y.S.; Wang, L.L.; Petäjä, T.; Zha, Q.Z.; Gong, C.S.; Li, S.X.; Pan, Y.P.; Hu, B.; Xin, J.Y.; et al. Increased inorganic aerosol fraction contributes to air pollution and haze in China. Atmos. Chem. Phys. 2019, 19, 5881–5888. [Google Scholar] [CrossRef] [Green Version]
  30. Xu, Z.Y.; Liu, M.X.; Zhang, M.S.; Song, Y.; Wang, S.X.; Zhang, L.; Xu, T.T.; Wang, T.T.; Yan, C.Q.; Zhou, T.; et al. High efficiency of livestock ammonia emission controls in alleviating particulate nitrate during a severe winter haze episode in northern China. Atmos. Chem. Phys. 2019, 19, 5605–5613. [Google Scholar] [CrossRef]
  31. Zhao, B.; Zheng, H.T.; Wang, S.X.; Smith, K.R.; Lu, X.; Aunan, K.; Gu, Y.; Wang, Y.; Ding, D.; Xing, J.; et al. Change in household fuels dominates the decrease in PM2.5 exposure and premature mortality in China in 2005–2015. Proc. Natl. Acad. Sci. USA 2018, 115, 12401–12406. [Google Scholar] [CrossRef]
Figure 1. Annual variations of activity levels of primary pollution source from 2006 to 2015, Beijing.
Atmosphere 10 00494 g001
Figure 2. Historical trends of primary air pollutant emissions in Beijing, 2006–2015.
Atmosphere 10 00494 g002
Figure 3. Comparison of the proportions of pollutant emissions from different source categories between 2006 and 2015.
Atmosphere 10 00494 g003
Figure 4. Monthly emissions variations of air pollutant in Beijing between 2006 and 2015.
Atmosphere 10 00494 g004
Figure 5. Geographical distribution of primary air pollutants in 2006 and 2015, Beijing.
Atmosphere 10 00494 g005
Figure 6. The correlation between pollutant emissions and annual average pollutant concentrations.
Atmosphere 10 00494 g006
Table 1. Uncertainty of emissions from each air pollution source of Beijing, 2015.
Emission SourceUncertainty Range (%)
SO2NOXPM10PM2.5VOCsBCOCCONH3
FCS(−21%,30%)(−45%,46%)(−31%,41%)(−34%,46%)(−61%,64%)(−22%,29%)(−21%,28%)(−32%,40%)
IPS(−25%,36%)(−55%,52%)(−38%,54%)(−40%,55%)(−75%,73%)(−27%,35%)(−26%,35%)(−40%,45%)
MS (−62%,74%)(−38%,66%)(−46%,70%)(−73%,98%)(−39%,60%)(−36%,57%)(−56%,70%)(−50%,71%)
SUC (−69%,76%)
AS (−58%,83%)
FDS (−75%,84%)(−72%,86%)
BCS(−55%,79%)(−64%,69%)(−43%,64%)(−48%,69%)(−84%,94%)(−35%,50%)(−33%,48%)(−51%,62%)(−61%,77%)
OSS (−62%,71%)
WDS (−26%,48%) (−20%,29%)
OS(−31%,44%)(−50%,51%)(−34%,48%)(−37%,52%)(−67%,70%)(−25%,35%)(−24%,34%)(−37%,44%)(−50%,59%)
Total(−20%,29%)(−41%,44%)(−39%,54%)(−42%,57%)(−67%,78%)(−22%,32%)(−21%,30%)(−33%,39%)(−27%,36%)

