Abstract
A long-lived supercell developed in Northwest Bulgaria on 15 May 2018 and inflicted widespread damage along its track. The first part of this article presents a detailed overview of the observed storm evolution. Doppler radar observations reveal that the storm acquired typical supercellular signatures and maintained reflectivity values in excess of 63 dBZ for more than 4 h. The thunderstorm was also analyzed through lightning observations that highlighted important characteristics of the overall supercell dynamics. In its second part, the study investigates the predictability of the severe weather outbreak. In the medium forecast ranges, the global European Centre for Medium-Range Weather Forecasts (ECMWF) ensemble indicated the presence of favorable conditions for the development of deep moist convection 4 days prior to the event. A set of three convection-allowing ensemble simulations also demonstrated that the practical predictability of the supercell was approximately 12 h, which is considerably higher than some previously reported estimates. Nevertheless, the skill of the convective forecasts appears to be limited by the presence of typical model errors, such as the timing of convection initiation and the development of spurious convective activity. The relevance of these errors to the optimal ensemble size and to the design of future convection-allowing numerical weather prediction (NWP) systems is further discussed.
1. Introduction
Severe thunderstorms exert significant socio-economic impacts in Europe [,,]. Better understanding of the processes which lead to severe convective storms, as well as their regional characteristics, is of primary importance. The development of the European Severe Weather Database (ESWD) [] allowed for important research on the climatology of severe convective storms on a pan-European scale [] and on the environmental conditions for severe thunderstorms in Europe [].
Organization of convection is an important indication of its potential severity. The supercell, characterized by the presence of a rotating updraft or mesocyclone [], is perhaps the best known example of organized convection, and it is often associated with major outbreaks of severe convective weather. Numerical simulations [,,] have shown that supercell storms can be distinguished from ordinary thunderstorms by specific dynamical processes involved in their development. Mesocyclones in supercells form as a result of the interaction of convective updrafts with the sheared ambient environment [,]. In particular, strong vertical wind shear can lead to the development of nonhydrostatic pressure gradients which contribute to the generation of strong updrafts [].
Supercells are associated with specific radar features and lightning characteristics that can be useful in nowcasting applications. The bounded weak echo region (BWER) signature, for instance, appears at mid-levels above the edge of the low-level reflectivity gradient and indicates the presence of a strong quasi-steady updraft with a lifetime of several hours [,]. The V-notch is another specific radar signature resulting from the divergent flow around the storm’s updraft, which has been related to the occurrence of a wide range of severe weather events, including large hail, strong winds and tornadoes []. The characteristics of lightning activity in supercells have also been the subject of many studies. Several investigations have shown that lightning in supercell storms has unique characteristics. In particular, it has been noted that severe storms are characterized by higher total flash rates when compared with ordinary non-severe storms. The more intense the storm is, the more lightning it is capable of producing [,]. Williams [] explained this link with the intensification of the storm’s updrafts. Furthermore, MacGorman et al. [] found that there is a strong correlation between intra-cloud (IC) flash rate and cyclonic shear at 1.5 km altitude. The explanation of this result is based on the elevated charge region hypothesis. According to this hypothesis, the strong updrafts existing in the supercell’s mesocyclone lift the near-surface negative charge region closer to the main positive charge region in the highest parts of the storm, causing the IC flashes to become more prevalent. When the updraft weakens, cloud-to-ground (CG) flash rates tend to increase, since the lower negative charge region descends back to the ground. Deierling and Petersen [] have also showed that stronger updrafts lead to a larger production of graupel and ice crystals in the mixed phase region of the cloud. With more graupel and ice crystals available, there is greater opportunity for collisions, allowing for charge separation to occur via the non-inductive charging mechanism []. Furthermore, a lightning jump precedes severe weather at the ground according to a number of studies [,]. For instance, Kane [] found that tornadoes and large hail occurred about 10–15 min after the peak of the 5-min CG lightning rate. Williams et al. [] also showed that peak flash rate precedes severe weather at the ground by 5–20 min. However, Lang et al. [] and Soula et al. [] reported that CG lightning frequency decreases when hail forms in the cloud.
Following Doswell et al. [], deep, moist convection is associated with (1) the presence of conditional instability in the environment, (2) sufficient boundary-layer moisture and (3) some lifting mechanism. The first two ingredients, instability and moisture, are usually expressed through the convective available potential energy (CAPE). Convection is initiated when air parcels are brought to their level of free convection (LFC) by some lifting mechanism (e.g., frontal boundaries, sea-breeze fronts, drylines, orography) and retain their positive buoyancy values over a considerable depth of the atmosphere []. Vertical wind shear has been found to play a significant role in organizing convective storms and supercell development [,]. The magnitude of the difference of the winds between the surface and 6 km above the ground has been traditionally used as a description of the tropospheric wind shear [,]. Up to this end, multiple composite parameters have been developed that contain both CAPE and shear [,]. One of them is the combination of CAPE and the 0–6 km shear, which has been shown to be a good indicator of favorable environment conditions for the development of high-impact convection [,]. The success of this composite parameter owes to the fact that significant severe thunderstorms (featuring hail with a diameter of at least 5 cm, wind gusts of at least 120 km h−1 or a tornado of at least F2 intensity) require the juxtaposition of high CAPE and wind shear values. Global NWP models, such as the Integrated Forecasting System (IFS) of the European Centre for Medium-Range Weather Forecasts (ECMWF), are often used as guidance for determining whether the environmental conditions are favorable for the development of convection. Nevertheless, the relatively coarse resolution of global NWP models means that convective motions still need to be parameterized, which prevents them from accurately simulating the life cycle of convection and its interaction with the larger scales [].
Recent advances in computational technology have led to the development and operational use of high-resolution (<4 km) convection-allowing models (CAMs) that are driven with initial and lateral boundary conditions from global NWP models. One of the main advantages of these modelling systems is their ability to explicitly resolve convection, making them highly valuable for short-range forecasting purposes. Recently, there have been considerable efforts to utilize convective-scale NWP models for nowcasting applications in lieu of ad-hoc forecasting techniques []. It has been found that CAM-based models deliver better guidance in terms of forecasting warm season convection in comparison to their global NWP counterparts [,,,,,,]. In particular, the better resolution of small-scale flows in CAM models allows them to have a more realistic depiction of the mode, structure and evolution of the simulated convective systems [].
Although CAMs provide a realistic depiction of the overall convective evolution, their forecast skill can undergo marked decrease over short forecast lead times []. Loss of predictability in high-resolution models is often linked to their inability to determine the exact location and timing of small-scale features in the forecast. In order to avoid the “double penalty problem” arising from the application of traditional verification metrics, there have been considerable efforts to create object-based neighborhood verification methods suitable for various convective and mesoscale phenomena (e.g., [,,,,]). Furthermore, operational NWP centers have also moved towards ensemble-based CAM systems to better represent the rapidly growing model errors at the convective scales [,]. Probabilistic products from these high-resolution ensemble systems have been shown to deliver valuable forecast guidance [,]. Granted, the large computational requirements of convective-scale NWP models mean that operational centers can only afford to run up to 10 or 20 ensemble members [,]. Despite the fact that such small ensemble sizes make the forecasts prone to sampling errors, several studies have concluded that larger ensemble sizes do not yield statistically significant increases in the forecast skill (e.g., []). Nevertheless, it has been recognized that the determination of an “optimal” ensemble size is heavily dependent upon the underlying atmospheric predictability []. Findings from recent studies seem to also suggest that increases in the ensemble size are more important than increases in the model resolution [,].
There are two primary objectives in this paper. The first one is to document the most prominent observational features of the 15 May 2018 supercell case, which produced unique signatures in both radar and lightning data. Such supercell events are of particular interest to the Bulgarian meteorological agencies because of the relatively recent use of remote sensing observations in an operational environment. Analysis of single case studies, such as the one presented in this paper, is an important first step towards building a comprehensive thunderstorm climatology in the southeastern parts of Europe. The high impact of the presented supercell event means that it is crucial to evaluate the limits of its practical predictability. Therefore, the second goal of this paper is to assess the forecast skill of this severe outbreak in both the medium and short forecast ranges. This is achieved through the use of a global NWP model and CAM-based ensemble simulations initialized from the global forecasts. To the authors’ best knowledge, this study represents one of the first attempt to run a large (51 member) and high-resolution (1 km) real-time CAM ensemble for the purpose of studying the predictability of supercellular convection. The availability of a CAM system with a large ensemble membership also allows us to explore the sensitivity of the forecasts to the ensemble size, which is a critical consideration for the design of future NWP systems.
The rest of this paper is organized as follows: The data and methods used in this study are described in Section 2. The first part of Section 3 presents an observational analysis of the 15 May 2018 supercell case, while the second part focuses on its predictability in the medium and short forecast ranges. Finally, Section 4 summaries the key findings of this study and provides a critical discussion of their implications in the context of future CAM-based ensemble systems.
2. Data and Methods
2.1. Observations
Data from an S-band Doppler radar of the Hail Suppression Agency (HSA) in the village of Bardarski Geran, located in the Vratsa district (Northwest Bulgaria), were used to examine the horizontal and vertical structure of the supercell. The configuration of the Bardarski Geran radar follows closely the work of Dimitrova et al. [] and Bocheva et al. [] and is described as follows. Volumetric data were generated by automatically scanning at 14 different elevation angles, which varied irregularly between 0.2° and 85°. The full volume scan had a maximum range of 300 km and was completed in 4 min. All radar products shown throughout the paper were generated with the aid of the Interactive Radar Information System (IRIS) of Vaisala. Archived temperature data, based on the Global Forecast Model (GFS; https://ready.arl.noaa.gov/READYcmet.php), were also utilized to diagnose the height of the chosen equivalent radar reflectivity factors.
Radar analysis was complemented by lightning data from the European lightning detection network LINET []. Total (intra-cloud, IC, and cloud-to-ground, CG) flash rate (TFR), peak current (PC) and multiplicity (the total number of strokes registered at a maximum distance of 3 km of and within 1 s of the first stroke in a flash) were analyzed. Note that the discrimination between CG and IC lightning in LINET relies on times of arrival (TOA) analysis [,]. The flash rate was calculated as the number of flashes per 4 min (FR4min-1 hereafter) in accordance with the period of the radar volume scan.
In addition to the remote sensing data, verification of the forecasts was also based on damage reports from the National Institute of Meteorology and Hydrology (NIMH), the Hail Suppression Agency (HSA), the European Severe Weather Database (ESWD; []) and the media []. The hail damage reports, in particular, were used to verify the location of the convective storms simulated in the CAM ensemble.
2.2. Numerical Weather Prediction Data
Forecast data from the ECMWF IFS were used to look at the predictability of the event in the medium range (beyond 72 h), as well as for providing initial and boundary conditions for the ensemble-based CAM simulations.
To assess the predictability of the event in the medium range, the ECMWF’s Extreme Forecast Index (EFI) was used. The EFI is a measure of the difference between ensemble forecast and model climate (M-climate) cumulative distribution functions (CDFs) []. The index takes values from −1 to +1. The closer the EFI values are to −1 or +1, the more abnormal the ensemble forecast is. On the basis of ingredient-based methodology, CAPE and CAPE-shear EFI products have been implemented to forecast severe convective storms []. In particular, the composite CAPE-shear parameter is defined as
where CAPE is the standard diagnostic output from the IFS (https://www.ecmwf.int/node/18714) and is the vector wind difference between 925 hPa and 500 hPa pressure levels. CAPE-shear index targets organized convection capable of producing major severe storm outbreaks and is given in units of specific energy (m2 s−2). Since 8 March 2016, CAPE-shear has been an operational output parameter from the IFS. CAPE-shear EFI has high values (approaching +1) in the areas of large CAPE and deep-layer wind shear. These are the areas where highly organized deep, moist convection is likely to occur. It also accounts for forecast uncertainty by comparing the full CDFs of the ensemble forecast and M-climate.
ECMWF has also developed lightning parametrization for the IFS model []. It calculates the total (CG and IC) flash density by taking into account the CAPE, the convective cloud base and the amount of cloud condensate, graupel and snow. In addition, a tuning coefficient is used, currently set to 37.5, to match the annual global mean flash density rate obtained by combining satellite lightning imager observations from the optical transient detector (OTD) (1995–2000) and the lightning imaging sensor (LIS) (1998–2010) []. From the ECMWF ensemble, probability forecasts of lightning density above given intensity thresholds are produced to highlight areas of deep, moist convection associated with cloud electrification and generation of both IC and CG lightning flashes.
The ensemble-based CAM forecasts presented in this study were generated using version 3.7.1 of the Weather Research and Forecasting-Advanced Research core model (WRF-ARW) []. Using initial and boundary conditions from ECMWF, three sets of 51-member ensemble simulations were produced with the following initialization times: 14 May 00 UTC, 14 May 12 UTC and 15 May 00 UTC. The forecasts were run in a two-way nested configuration with three model domains—d01, d02 and d03 (Figure 1), all of which contained 50 vertical levels and whose horizontal grid spacing was 9km, 3km and 1km, respectively. The location of the innermost d03 domain was chosen to contain the full path of the observed supercell.
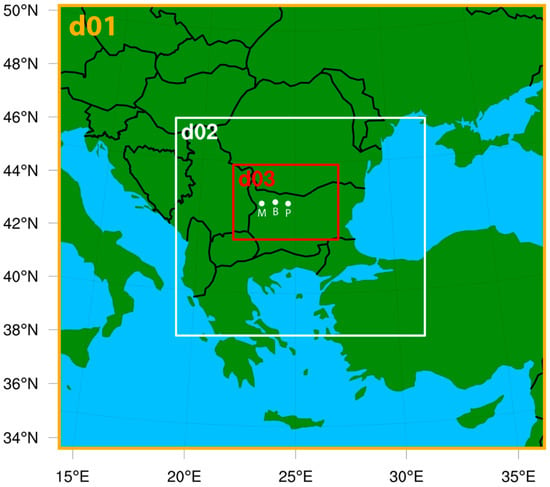
Figure 1.
Position of the 9-km (d01), 3-km (d02) and 1-km (d03) Weather Research and Forecasting (WRF) model domains. The locations of the cities of Montana (M) and Pleven (P) and the town of Byala Slatina (B) have been marked with white dots as reference points.
The model parameterization schemes used for the numerical simulations are outlined in Table 1. The selection of model physics is based on previous studies of supercell simulations. For instance, the choice of the National Severe Storms Laboratory (NSSL) 2-moment microphysics scheme [] is driven by its ability to correctly reproduce polarimetric signatures within supercell storms []. Similarly, the Yonsei University (YSU) Planetary Boundary Layer (PBL) scheme [] is a first-order closure nonlocal scheme that can successfully simulate deep vertical mixing in daytime buoyancy-driven planetary boundary layers (PBLs) [].

Table 1.
Weather Research and Forecasting-Advanced Research (WRF-ARW) model physics.
The forecast skill from the ensemble-based CAM simulations was primarily assessed with respect to the highest-resolution d03 domain, which provided the most realistic depiction of the supercell evolution. Other than model-simulated radar reflectivity, the output from this highest resolution ensemble was also assessed through the updraft helicity (UH), defined as
where and are the vertical components of the three-dimensional vorticity and velocity vectors, respectively, while z0 and z1 define the atmospheric depth over which UH is computed. UH measures the potential of storm updrafts to rotate and is especially suitable for convection-allowing models where the vertical velocity w is explicitly resolved. Analogous to previous studies (e.g., []), the location of the model-simulated supercell was identified through ensemble maximum fields of hourly-maximum 2–5 km UH. To account for the high spatial variability of CAM-simulated supercells and provide a fair verification against the available observations, neighborhood ensemble probabilities (NEPs) [] of hourly-maximum 2–5 km UH were also calculated (NEP UH hereafter). In this study, NEP UH at a given analysis grid point was taken to be the fraction of neighboring (8 km radius) grid points collected from all ensemble members whose UH value exceeded 100 m2 s−2. The selected UH threshold is consistent with previous CAM studies (e.g., []) and was subjectively tuned to only target the strongly rotating storms within the CAM ensemble.
3. Results
3.1. Description of the Event
A severe weather outbreak affected Bulgaria in the afternoon hours on 15 May 2018, featuring well-organized convection over the northwestern parts of the country. The outbreak started with the development of an isolated thunderstorm on the northern foothills of Stara Planina mountain, near the town of Montana (the location of Montana is shown in Figure 1). Originally, the cell moved towards the northeast, but its propagation direction gradually attained an easterly component as the storm evolved into a powerful supercell. The supercell maintained its structure for more than 5 h and produced multiple convective hazards along its 230-km path, including large hail, strong wind gusts, heavy rain and intense lightning activity. The storm caused substantial damage; it broke electric poles, uprooted many trees, damaged cars, roofs and facades of buildings and caused local flash floods. The city of Pleven in the Danube Plain was one of the worst affected places along the track of the storm. The synoptic station in Pleven, maintained by NIMH, reported severe wind gusts reaching 29 m s−1, large hail up to 5 cm in diameter and heavy rain amounting to 17.8 mm in 20 min. In the village of Grivitsa, located just 6 km east of Pleven, strong winds destroyed more than 50 roofs [], forcing the municipalities of Pleven and nearby Byala Slatina to declare a state of emergency.
The synoptic set-up for the 15 May 2018 case study is shown in Figure 2 and indicates the presence of an upper-level cut-off low over Central Europe, leading to widespread precipitation and unseasonably low temperatures over this part of the continent. Throughout the day, a short-wave trough located in the southern parts of the cut-off low in the Mediterranean basin quickly ejected northeast and provided the impetus for a surface-based cold front in the western parts of the Balkan Peninsula to advance eastwards. Coincident with the rapid height falls, an upper-level jet with peak winds in excess of 100 m s−1 (Figure 2b) spread over the region and increased the 925–500 hPa wind shear to 20–25 m s−1. Combined with moderate surface-based instability (most unstable CAPE values of around 1000 J kg−1) and large-scale forcing at the exit region of the upper-level jet, the environmental conditions over the northwestern parts of Bulgaria were favorable for the development of severe convection.
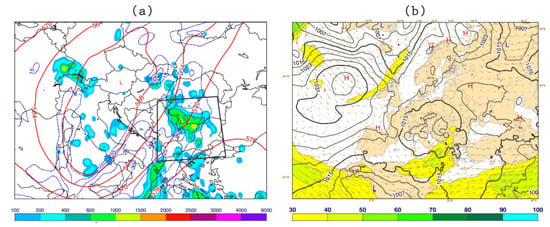
Figure 2.
European Centre for Medium-Range Weather (ECMWF) analyses valid at 12 UTC on 15 May 2018 for (a) geopotential at 500 hPa (red lines, in dam), convective available potential energy (CAPE) (shaded, in J kg−1) and 925–500 hPa wind shear (dashed blue lines, in m s−1); (b) mean sea-level pressure (MSLP) (black lines, in hPa) and wind at 200 hPa (arrows). Wind speed above 30 m s−1 is shaded. The black rectangle in panel (a) is centered over the area of interest.
3.2. Observed Evolution of the Supercell
Based on radar and lightning data, the lifecycle of the supercell could be divided into three main stages: non-severe (10:51–11:28 UTC), first severe (11:28–12:38 UTC) and second severe (12:38–15:48 UTC). Each of these stages is characterized with specific radar features and lightning behavior.
3.2.1. Radar Analysis
At 10:51 UTC, ahead of a cold front passing over the western part of Bulgaria, a convective cell began to form near the town of Montana (Figure 3a). Maximum radar reflectivity of 33 dBZ was registered at 5.7 km above sea level (ASL), with the core of the newly developed storm located in the −5 °C to −10 °C isotherm layer. At this stage, the cumulus cloud consisted of small hail embryos and water drops []. In the next 4 min, a period of rapid ascent and hydrometeor growth followed, and was coincident with an increase in the maximum reflectivity factor to 43 dBZ. Several studies have shown that convective cells for which the maximum reflectivity factor exceeds 40 dBZ in the −5 °C to −10 °C layer are also associated with the production of hail [,].
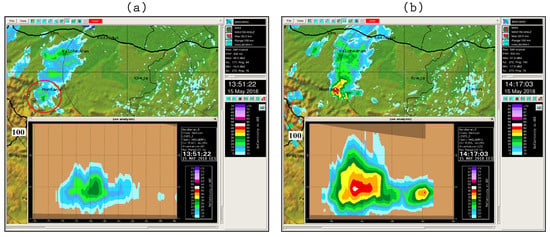
Figure 3.
Initial evolution of the supercell at (a) 10:51 UTC (the cell on the map is shown by a red circle) and (b) 11:17 UTC when a daughter cell developed on the eastern side of the main cell. Note that the times in the two figures are local (UTC + 3 h).
During its initial non-severe stage (between 10:51 and 11:28 UTC), the newly formed convection was characterized by a multicellular structure and followed the direction of the mean south-southwesterly steering flow. At 11:17 UTC, a new daughter cell formed on the eastern side of the convective cluster and eventually merged with the mature cell at 11:24 UTC (Figure 3b). The latter was followed by a rapid increase of radar reflectivity to 64.5 dBZ, detected at 6 km ASL height. These high reflectivity values were maintained for more than 4 h during the lifetime of the supercell.
The first severe stage of supercell development was characterized by presence of typical supercellular radar signatures, such as a weak echo region (WER) and bounded weak echo region (BWER), which were detected in several occasions (Figure 4). The presence of BWER correlated well with the times of maximum storm top height of over 17 km. Throughout the supercell’s lifecycle, the WER and BWER signatures were observed multiple times with varying degrees of longevity, which seems to be related to the pulsating character of the main updraft during the storm’s intensification period [].
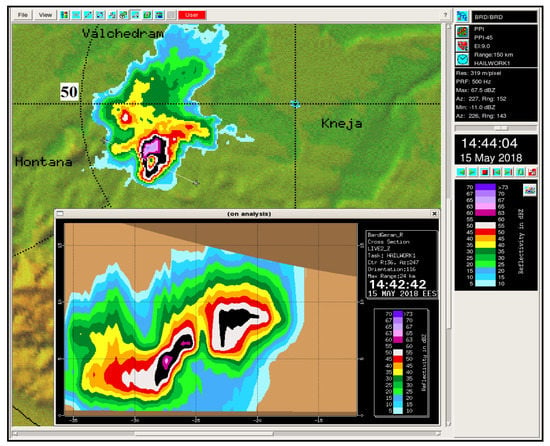
Figure 4.
A plan position indicator (PPI) reflectivity image (9° elevation angle) and a vertical cross section through the bounded weak echo region (BWER) region of the supercell at 11:44 UTC.
During this first severe stage, the supercell continued to strengthen and a hook echo became apparent on the plan position indicator (PPI) from 12:03 UTC (Figure 5a). The appearance of this radar signature signified rotation within the storm’s updraft (due to the presence of a mesocyclone), confirmed by the Doppler velocity analyses in the 3.5–5 km ASL height range (Figure 5b). The southern side of the hail core had velocities towards the radar, while the northern side—away from the radar—indicating the counterclockwise rotation of the updraft. The winds circling the mesocyclone were strong enough to wrap precipitation around the updraft area of the storm and form a hook-like radar echo (Figure 5a).
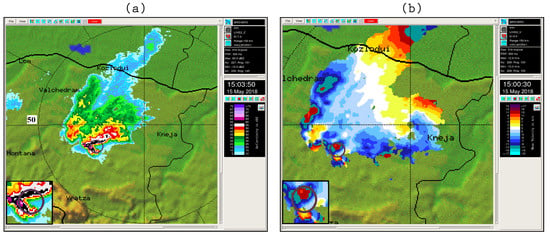
Figure 5.
PPI radar images of the supercell at 13:00 UTC showing (a) a hook-like reflectivity signature resulting from the mesocyclonic circulation at a 7° elevation angle and (b) Doppler velocities within the supercell at a 9° elevation angle. The mesocyclonic rotation is highlighted with a black circle and further zoomed into through the inlet at the bottom left-hand side of the panels.
At the beginning of the second severe stage of supercell development (11:38–11:45 UTC), new daughter cells began to form on the south and southwestern side of the main cell (not shown). The formation of these cells was most likely caused by the interaction between the strengthening cold pool and the vertical shear in the ambient environment []. During its movement towards the radar, the supercell continued to intensify, as evidenced by the appearance of a V-notch signature at 12:34 UTC. The V-notch signature was most noticeable between 13:56 UTC and 14:10 UTC as the storm was approaching the town of Pleven (black arrow in Figure 6).
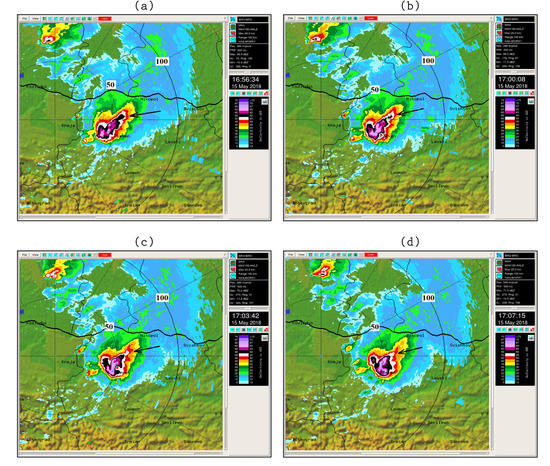
Figure 6.
Radar reflectivity images showing the presence of a V-notch signature (black arrow) in the supercell at (a) 13:56 UTC, (b) 14:00 UTC, (c) 14:03 UTC and (d) 14:07 UTC.
The presence of a V-notch coincided with radar reflectivity of 5 dBZ registered above 17 km ASL and overshooting tops on the visible satellite channels (not shown). In addition, the radar reflectivity factor increased to 68.5 dBZ at 1 km ASL. These high values of the maximum radar reflectivity coincided with large hail (above 2 cm in diameter) reports in the local media. The supercell maintained high reflectivity values whilst moving at a ~60° angle to the right of the mean winds until it began to dissipate near the town of Levski at about 15:30 UTC.
3.2.2. Lightning Activity
The development of the supercell was characterized by a substantial increase in total (IC and CG) flash rates (TFR; Figure 7)—a direct result of the updraft’s intensification [,]. The first lightning discharge registered in the thunderstorm was IC and occurred at 10:58 UTC when the reflectivity reached 45 dBZ at 5.7 km above sea level (approximately at the level of the −15 °C isotherm). During the initial, non-severe stage of the thunderstorm (10:51–11:28 UTC), the TFR was significantly lower in comparison with the severe stages (Figure 7). However, the TFR increased during that time, following several jumps (a TFR jump is defined as a sudden increase in the TFR values, which are at least two times their original values) until 11:28 UTC, when a BWER became visible on the radar. These jumps in the flash rate coincided with an abrupt increase in the heights of the 15 dBZ and 45 dBZ values by 5.4 km and 2.6 km, respectively (Figure 7). The aforementioned heights were both above the −40 °C isotherm after 11:20 UTC when an overshooting top was observed (not shown). The vertical profile of radar reflectivity indicated that the storm had a strong updraft. Carey and Rutledge [] have suggested that the strong updraft in a supercell produces a large number of graupel particles and, in turn, increases the lightning flash rate via the non-inductive mechanisms of thunderstorm electrification []. The last TFR jump was registered at 11:36 UTC, about 30 min before the occurrence of large hail. TFR reached its maximum values (651–744 FR4 min−1) between 12:20 UTC and 12:28 UTC, shortly after the supercell reached its maximum vertical development, with H15dBZ > 16 km, H45dBZ > 12 km and H60dBZ > 9 km (Figure 7). Immediately after this, the TFR dropped sharply over a time period of 16 min. This marked decrease in the total flash rate overlapped with several reports of damaging wind and very large hail. The decrease of TFR also coincided with a lowering in the height of the 60 dBZ reflectivity factor below 0 °C and the formation of a V-notch radar signature. Overall, the TFR values and the 60 dBZ height followed a similar trend between 11:28 UTC and 14:24 UTC.
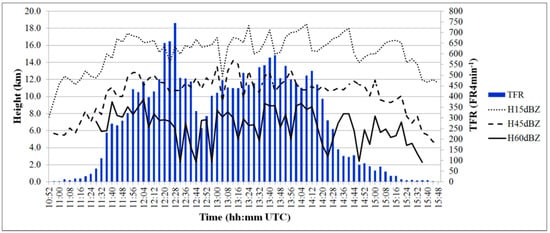
Figure 7.
Number of total flashes per 4 min and above sea level (ASL) heights for the 15 dBZ, 45 dBZ and 60 dBZ reflectivity values as a function of time during the evolution of the supercell.
During the non-severe and first severe stages of the storm, the IC-to-CG flash rate ratio (IC_FR/CG_FR) exhibited an increasing trend (Figure 8) and signified the increasing severity of the storm [,,]. The IC flash rates dominated over CG flash rates in the period 12:16–12:48 UTC in agreement with the elevated charge region hypothesis [,,,]. Following the weakening of the updraft, the negative charge region descended back to its original position and decreased the IC_FR/CG_FR ratio (Figure 8).
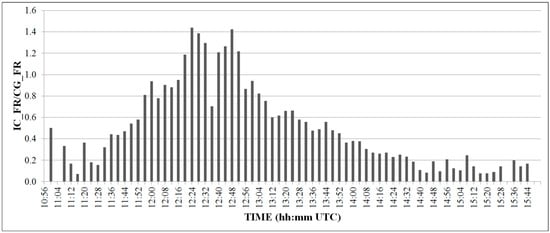
Figure 8.
Evolution of the IC-to-CG flash rate (IC_FR/CG_FR) ratio throughout the supercell’s lifecycle.
At the beginning of the second severe stage of the supercell, the TFR exhibited a gradual increase, reaching 593 FR4 min−1 at 13:44 UTC. Despite the fact that the storm maintained high values of maximum reflectivity (>60 dBZ) after 14:16 UTC, both the TFR as well as the heights of of 15 dBZ and 45 dBZ reflectivity started to decrease. Furthermore, the IC_FR/CG_FR ratio remained smaller than 1 during the later stages of supercell development, consistent with the decrease in the height of both reflectivity values and the associated weakening of the supercell’s updraft.
It is worth noting that while the negative polarity of the CG flashes dominated during the evolution of the supercell, the number of positive CG flashes remained high and accounted for about 40% of all CG flashes (Figure 9a). The 4-min averaged absolute peak current associated with the negative (PC_CGneg) and positive (PC_CGpos) strokes during the lifetime of the supercell was 5.5 kA and 5.6 kA, respectively (Figure 9b). The maximum values of PC_CGneg and PC_CGpos were 56.5kA and 108.7 kA, respectively. Additional analyses revealed that 94% of all detected strokes in the storm had absolute values of peak current less than 10 kA, except from the beginning (before first registration of 55 dBZ and 60 dBZ) and the end of the supercell’s existence. The mean values of multiplicity were 1.28 and 1.12 for negative and positive CG flashes, respectively. Overall, the high number of positive CG flashes, the low 4-min averaged absolute peak currents and low multiplicity are all in agreement with the results for severe thunderstorms obtained in other studies (e.g., [,,,,]).
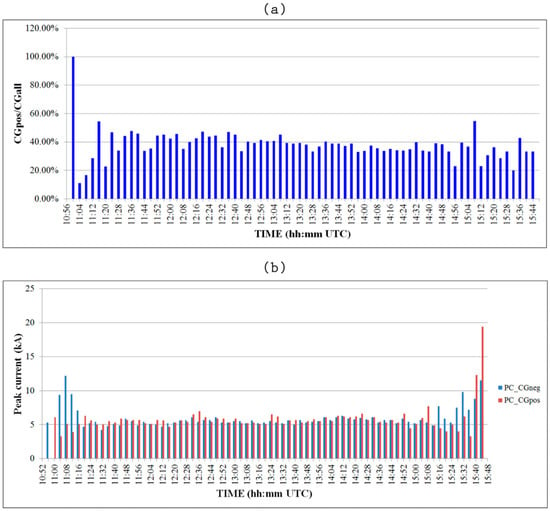
Figure 9.
Temporal trends in (a) the ratio of positive to all CG lightning strikes (CGpos/CGall) and (b) the 4-min averaged peak current associated with negative (PC_CGneg) and positive (PC_CGpos) lightning strikes.
3.3. Forecasts from the Global ECMWF Ensemble
In the medium range, the ECMWF ensemble was used to assess whether all the ingredients for severe convection were in place. Positive CAPE-shear EFI values were present over the Balkan Peninsula, even 7 days before the severe weather outbreak (not shown), evidenced by the shift of the forecast CDF to the right of the M-climate (Figure 10f). However, the similarity between the forecast and climate CDFs is indicative of the still high uncertainty at these forecast lead times.
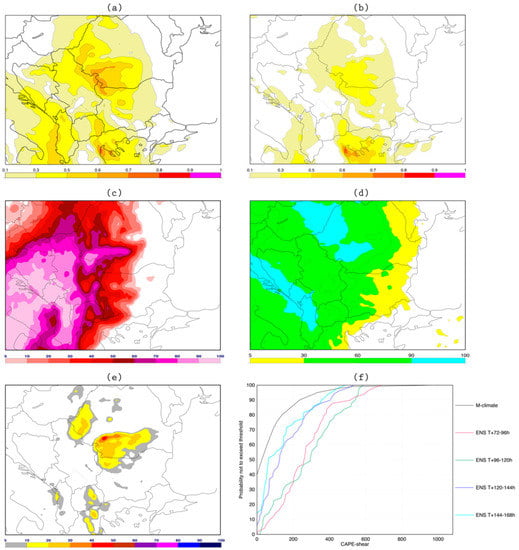
Figure 10.
ECMWF medium-range forecast (T + 72–96 h) of (a) CAPE-shear Extreme Forecast Index (EFI), (b) CAPE EFI, (c) probability of the 925–500 hPa wind shear exceeding 20 m s−1, (d) probability of precipitation (PoP), (e) probability of lightning density above 0.5 flashes per 100 km−2 h−1 and (f) CAPE-shear (in units of m2 s−2) cumulative distribution functions (CDFs) for Pleven. The M-climate is shown in black, while the forecasts at different ranges are presented with various colors indicated in the legend.
The separation of the forecast and M-climate CDFs gradually increased in the consecutive forecasts (Figure 10d), with CAPE-shear EFI values in Northwest Bulgaria exceeding 0.6 units 3–5 days prior to the severe weather outbreak (Figure 10a). Note that the corresponding CAPE EFI index (Figure 10b) and the probability of deep-layer shear (925–500 hPa; Figure 10c) exceeding 20 m s−1 were relatively low and high, suggesting that deep-layer wind shear had a considerable contribution to the high CAPE-shear values. The high likelihood for the development of deep moist convection was also highlighted in two other operational ECMWF products—the probability of precipitation (PoP) being equal or greater than 1 mm in 24 h (Figure 10d) and the probability of lightning (Figure 10e). For the 72–96 h forecast period, these probabilities reached 60% and 20–30% in the northwestern parts of Bulgaria, respectively.
The ensemble mean ECMWF forecast fields were also used to diagnose the storm motion according to the Bunkers et al. [] method. Calculations performed in proximity to the town of Pleven showed that supercells are expected to move in an easterly direction and with a speed of ~8 m s−1, which agrees favorably with the radar observation in Section 3.2.1.
3.4. Explicit Convective Forecasts from the WRF Ensemble
3.4.1. Predictability
To examine the predictability of the supercell case in the CAM ensemble, WRF forecasts from three different analysis times were initialized to form the following experiments: WRF.14may00utc, WRF.14may12utc and WRF.15may00utc. First, we investigated the ability of the ensemble forecasts to capture the initiation of the supercell at 11:00 UTC. According to Figure 11, only WRF.14may12utc and WRF.15may00utc indicate the development of severe convection in Northwest Bulgaria. Nevertheless, the skill of the WRF.14may12utc forecast is considerably worse because of (i) the spurious convection in Central North Bulgaria and East Serbia, (ii) the lower NEP UH probabilities in Northwest Bulgaria and (iii) their northeastern shift relative to the observed supercell in Figure 11d. The spatial dislocation of the predicted convection in WRF.14may12utc was caused by earlier convection initiation in this experiment. Evidence for this can be found in Figure 12, which shows that the location of maximum NEP UH in WRF.14may12utc at 10:00 UTC is nearly identical to that in WRF.15may00utc at 11:00 UTC, albeit the lower probability values in the earlier forecasts.
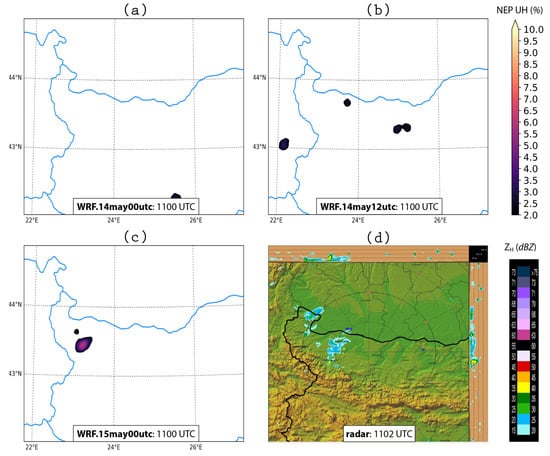
Figure 11.
Supercell initialization in the WRF ensemble forecasts. Panels (a)–(c) display neighborhood ensemble probabilities (NEP) of hourly-maximum 2–5 km updraft helicity (UH) exceeding 100 m2 s−2 for WRF.14may00utc, WRF.14may12utc and WRF.15may00utc at 11:00 UTC, respectively, while panel (d) shows the composite reflectivity at 11:02 UTC. Country borders are contoured in light blue for the WRF forecasts and black for the composite radar image.
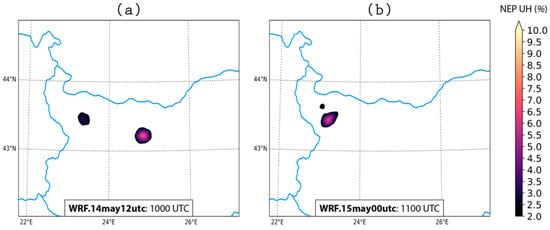
Figure 12.
Comparing the NEP values of hourly-maximum 2–5 km UH exceeding 100 m2 s−2 associated with (a) WRF.14may12utc and (b) WRF.15may00utc for two different forecast times (10:00 UTC and 11:00 UTC, respectively).
While both WRF.14may12utc and WRF.15may00utc provided useful probabilistic guidance for the initiation of the observed supercell, only WRF.15may00utc succeeded at maintaining the initial NEP UH values during the subsequent intensification of the supercell at 13:00 UTC (Figure 13). The other two experiments simulated NEP UH values that were less than 2% in the location of the observed supercell and also forecasted the initiation of spurious convection in the central parts of the model domain. Towards the peak of the observed supercell at 14:15 UTC (Figure 14), WRF.15may00utc also underwent a rapid drop in its forecast skill.
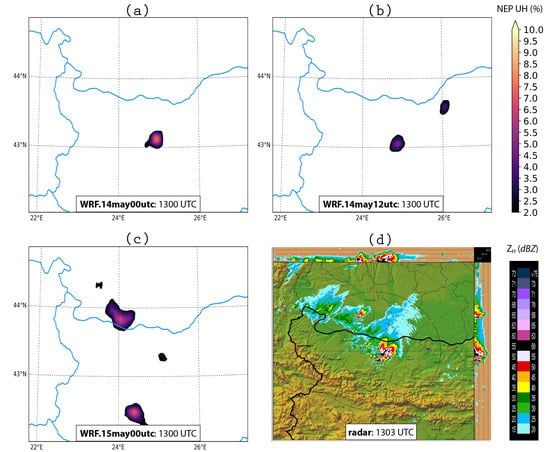
Figure 13.
Forecasts of supercell strengthening from (a) WRF.14may00utc, (b) WRF.14may12utc and (c) WRF.15may00utc at 13:00 UTC compared against (d) composite reflectivity observations at 13:03 UTC. Interpretation of the figures remains the same as in Figure 11.
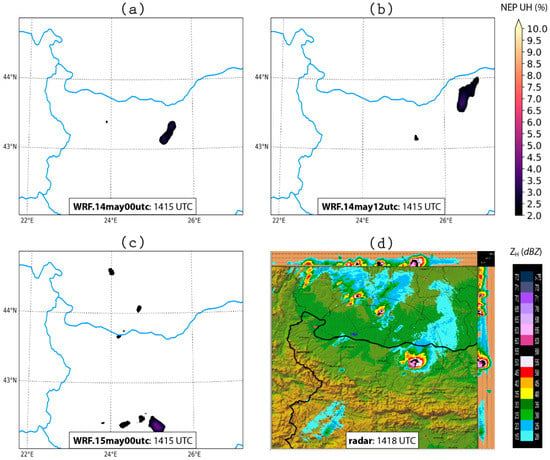
Figure 14.
Forecasts of peak supercell intensity from (a) WRF.14may00utc, (b) WRF.14may12utc and (c) WRF.15may00utc at 14:15 UTC compared against (d) composite reflectivity observations at 14:18 UTC. Interpretation of the figures remains the same as in Figure 11.
A summary of the forecast performance throughout the 10:00 UTC to 14:30 UTC time period is presented in Figure 15, which shows where members of the CAM ensemble produce hourly-maximum 2–5 km UH values in excess of 180 m2 s−2 (UH180 hereafter). The choice of this value was motivated by the study of Naylor et al. [] who found the aforementioned threshold to be optimal for the detection of supercells in 1-km model simulations. The UH swaths were verified against hail reports from the NIMH (blue triangles) and ESWD (green), which served as a proxy for the track of the observed storm. Although supercells appeared to be simulated in all three forecasts, it is clear that the WRF.15may00utc experiment produced the best forecast because of the high frequency of UH180 points in proximity to the hail reports. By contrast, the majority of the supercells in WRF.14may00utc and WRF.14may12utc formed to the east of the observed supercell. In fact, a careful examination of the three panels in Figure 15 reveals a bimodal distribution in the location of simulated convection initiation (CI). Initializing the WRF ensemble every 12 h with updated initial and lateral boundary conditions from the global ECMWF ensemble seemed to efficiently correct the location error present in the earlier forecasts. Note that the westward shift in the location of simulated CI also took place in the control WRF forecast, which is marked by the maroon scatter dots in Figure 15.
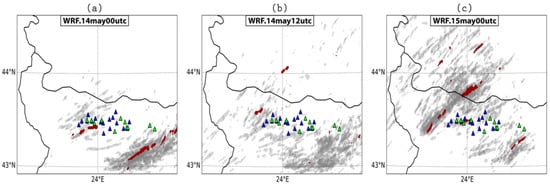
Figure 15.
Forecast performance overview for (a) WRF.14may00utc, (b) WRF.14may12utc and (c) WRF.15may00utc. The gray (maroon) scatter dots show locations where the 50 ensemble members (the control forecast) contained hourly-maximum 2–5 km UH values in excess of 180 m2 s−2 for the time period between 10:00 UTC and 14:30 UTC. The forecasted UH swaths were compared to hail reports from National Institute of Meteorology and Hydrology (NIMH) (blue) and European Severe Weather Database (ESWD) (green) on 15 May 2018.
3.4.2. Ensemble Clustering
Despite the fact that the ensemble simulations from WRF.15may00utc were considerably better than the other two experiments, the high NEP UH values forecasted during the formation of the observed supercell (Figure 11c) still indicate a bias towards early convection initiation (CI). CI is a crucial aspect in the operational forecasting of severe convection and a wide range of past studies have concluded that predicting the exact timing of CI in CAMs is still very challenging [,,]. In this section, the WRF.15may00utc forecasts are used to discuss the ability of a CAM-based ensemble with a large membership to capture the inherent CI uncertainty. The behavior of individual ensemble members around the time of CI is analyzed through the ensemble maximum of 2–5 km UH (UH_ensMax hereafter).
The evolution of the UH_ensMax fields in Figure 16 reveals the presence of two distinct groups (clusters) of ensemble members—CI in the first one took place at 10:00 UTC (~1 h earlier than the time of observed CI; marked by the green ellipses in Figure 16), while pronounced increases of UH_ensMax in the second one (marked by the blue ellipses in Figure 16) did not appear before 11:30 UTC. Despite the relatively small number of ensemble members that correctly forecasted the delay in CI, the behavior of the second ensemble cluster agrees more favorably with the available observations. More specifically, the analysis in Section 3.2 indicates that the formation of the observed mesocyclone also took place around 11:30 UTC, coincident with the appearance of a well-defined hook echo radar signature (Figure 5a) and a couplet in the Doppler velocity field (Figure 5b). One of the members in the second cluster (#30) provided a particularly good forecast of the overall supercell evolution. In particular, Figure 17 and Figure 18 show that this member successfully simulated the eastward propagation of the supercell, as well as the additional convective activity located northwest of it (Figure 17b,f). Nevertheless, the spurious convection that developed in the model domain and the accompanying storm-scale interactions (Figure 17d) had an adverse impact on the predicted supercell trajectory in the later forecast hours.
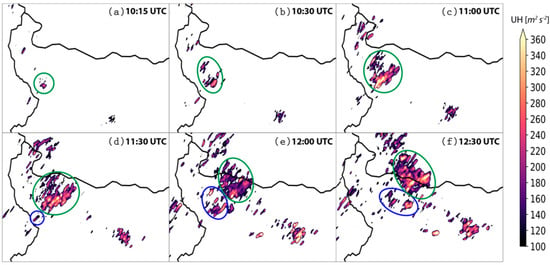
Figure 16.
Clustering of the WRF ensemble forecasts with respect to the time of convection initiation (clusters denoted by green and blue ellipses). Color shading displays the ensemble maximum of hourly maximum 2–5 km UH at (a) 10:15 UTC, (b) 10:30 UTC, (c) 11:00 UTC, (d) 11:30 UTC, (e) 12:00 UTC and (f) 12:30 UTC.
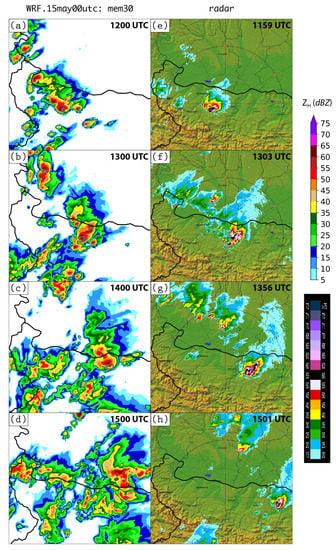
Figure 17.
Simulated reflectivity in member 30 from WRF.15may00utc at (a) 12:00 UTC, (b) 13:00 UTC, (c) 14:00 UTC and (d) 15:00 UTC compared against reflectivity data from the Bardarski Geran radar at (e) 11:59 UTC, (f) 13:03 UTC, (g) 13:56 UTC and (h) 15:01 UTC. The UH=180 m2 s−2 value in the WRF simulations is contoured in gray.
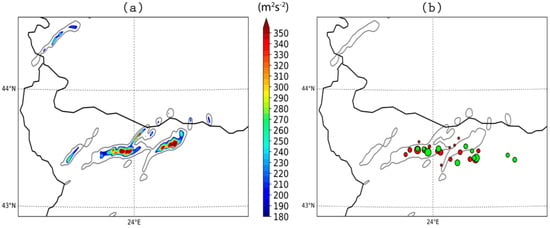
Figure 18.
(a) Swaths of hourly-maximum 2–5 km UH (color shading) simulated in member 30 from WRF.15may00utc during the 10:00–14:30 UTC time period. The UH = 75 m2 s−2 contour is also overlaid in gray to better highlight the origin of the simulated supercells. (b) Comparison of the forecasted UH swaths against hail reports from NIMH/Hail Suppression Agency (HSA) (red dots) and ESWD (green dots). The size of the dots is proportional to the size of the reported hail, with the smallest/largest dots corresponding to hail diameters of 0.5 and 7 cm, respectively. Note that the UH = 75 m2 s−2 contour has been smoothed using a Gaussian filter with a standard deviation of 1.5 km.
3.4.3. Model Errors in CAM-Based Ensembles
While previous work has concluded that future high-resolution NWP systems should invest in larger ensembles [,], the implementation of a 51-member ensemble with a 1 km horizontal grid spacing is still not computationally feasible. Aside from the technical challenges, the performance of CAM-based ensembles is further impeded by the detrimental impact of model errors, which can be especially large at small scales. In this subsection, we use the 15 May 2018 supercell case study to comment critically on these two issues.
To study the impact of ensemble size on the skill of the predicted supercells, we followed the methodology of Clark et al. [] in which 100 unique combinations are used in order to generate ensemble subsets of 10, 20, 30 and 40 members. To measure how changes in the ensemble size affect the quality of the forecasts, we examined differences in the NEP UH fields calculated from the full 51-member ensemble and the four other ensemble subsets in the WRF.15may00utc experiment. The verification time for the ensemble sensitivity tests was chosen to be 13:00 UTC, as this coincides with the period when the observed supercell underwent rapid intensification. The results presented in Figure 19 refer to the worst performing ensemble subset, which was defined to be the ensemble subset that exhibited the largest standard deviation (std) in the entire model domain. The purpose behind choosing the most suboptimal ensemble subset was to examine the maximum damage that can be caused by a CAM ensemble with a small membership. It is evident from the left panels of Figure 19 that all ensemble subsets predicted high NEP UH values along the Bulgarian–Romanian border. However, smaller CAM ensembles were characterized by higher amounts of sampling noise, with standard deviations going from 0.61% for the 10-member ensemble to 0.16% for the 40-member ensemble. As a consequence, NEP UH values in the small ensemble subsets preferentially increased or decreased in certain parts of the model domain and created bimodal NEP UH distributions (e.g., Figure 19g,i). In the case of the smallest 10-member ensemble subset, the sampling noise also increased the probability of spurious convection over central Stara Planina (Figure 19i), creating uncertainty as to where the most severe convection is expected to develop.
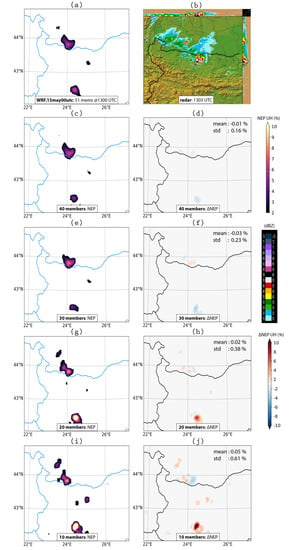
Figure 19.
Sensitivity of the CAM forecasts to the ensemble size at 13:00 UTC. Panels (a) and (b) refer to the NEP UH field from the full 51-member ensemble and the corresponding radar observations. The remaining figures on the left display NEP fields from the worst performing ensemble subset with (c) 40, (e) 30, (g) 20 and (i) 10 members, while the remaining figures on the right - differences in the NEP UH fields between the full 51-member ensemble and the worst performing ensemble subset with (d) 40, (f) 30, (h) 20 and (j) 10 members. Note that the mean and standard deviation of these difference fields are displayed in the upper right corner of the plots.
While Figure 19 suggests that the use of a larger ensemble size may seem unwarranted for simulating the supercell in our case study, it is important to recall the results from Section 3.4.2 which showed the existence of a small ensemble subset wherein the time of convection initiation was predicted better compared to the rest of the ensemble members. In fact, one of the ensemble members was able to simulate a supercell which behaved very similarly to the observed one. A simple calculation shows that the probability of randomly sampling member 30 in a subset of 10 ensemble members amounts to only 17.7%. Likewise, it is very likely that such a small ensemble system omits the cluster of well-performing ensemble members mentioned above. Analysis of the WRF simulations so far suggests that there were at least two main sources of model errors that contribute to the low skill of the convective forecasts: (i) the earlier timing of CI and (ii) the presence of spurious convection whose interaction with the simulated supercell led to errors in the resulting supercell trajectory. Importantly, model errors such as the ones mentioned above can adversely impact the probabilistic guidance provided by a CAM ensemble. This is conceptually illustrated by the idealized example in Figure 20, which considers deviations from the propagation of the observed supercell. The heavy black line in Figure 20 shows the true (generated by an infinitely large ensemble) forecast probability density function (PDF) of supercell trajectories expressed in terms of the angle deviation from the mean wind. A close examination of the simulated UH swaths in Figure 15c suggests that the majority of the supercells simulated in WRF.15may00utc moved at a ~15° angle to the right of the 30° 0–6 km mean wind (thin solid black line). This is to be contrasted with the behavior of the observed supercell which, according to the hail reports in Figure 15c, propagated at a 60° angle to the right of the steering flow (heavy red line). Since values in this portion of the PDF are highly unlikely, a set of 10 ensemble members (thin dashed black lines) may not be sufficient to sample the true supercell trajectory. As a result, the presence of model errors like the one depicted in this idealized example makes it necessary to use a large CAM ensemble to ensure that the verifying observations fall within the uncertainty of the ensemble forecast.
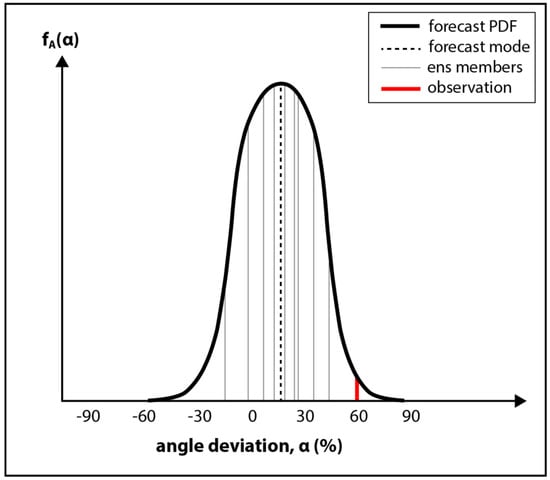
Figure 20.
Schematic illustration of the impact that model errors have on the quality of a CAM ensemble with a small membership. The heavy solid black line represents the forecast probability density function (PDF) fA(α) of the supercell’s angle deviation from the mean wind, the dashed black line—the mode of the forecast PDF, the thin solid gray lines—10 randomly drawn ensemble forecast members and the heavy red line—the observed deviation of the supercell from the mean wind. Note that the idealized example presented in this diagram is based on results from the WRF.15may00utc experiment, as well as the hail reports from NIMH/ESWD.
4. Conclusions
An isolated and long-track supercell developed on 15 May 2018 in the northwestern parts of Bulgaria and was associated with substantial damage along its path, including strong wind gusts and extremely large hail. Using a synthesis of observations and numerical simulations, this paper discusses the evolution of the storm as well as its predictability in the medium and short forecast ranges.
The observational characteristics of the supercell were revealed mostly through remotely-sensed observations. Doppler radar data from the village of Bardarski Geran showed that during its 5 h evolution, the storm acquired distinct supercellular features, such as a hook echo, a bounded weak echo region (BWER) and a V-notch. The fact that a V-notch signature was registered for the first time since Doppler radars became operational in the Hail Supression Agency convey the extreme nature of the thunderstorm. Its high intensity is also reflected in the fact that the supercell maintained very high reflectivity values (>63 dBZ) for more than 4 h and was associated with CG flash rates in excess of 125 min−1 during the peak of its evolution. Our observational analysis also indicated that the IC/CG ratio remained high for about 1 h before the registration of a V-notch signature in the radar reflectivity field. Similar to previous studies, the average peak current of the positive and negative CG strikes was found to be rather low, reaching only −5.58 kA and 5.67 kA, respectively. Furthermore, temporal trends in the total flash rates and the IC/CG ratio were found to be commensurate with past observations of supercells [,,,,,,].
The second part of this paper examined the predictability of the 15 May 2018 severe weather outbreak. In the medium forecast ranges, various probabilistic products from the global ECMWF ensemble confirmed the presence of favorable conditions for the development of deep moist convection 4 days prior to the severe weather outbreak. In the short forecast ranges, the predictability of the event was examined by running a set of ensemble-based WRF simulations initialized at three different times. It was shown that an adequate prediction of the storm’s initiation and short-term evolution can be achieved 12 h prior to the event, and that the overall supercell’s predictability is limited by two major sources of model errors:
- the timing of convection initiation (CI);
- the large amounts of spurious convection in proximity to the simulated supercell.
The numerical results presented herein clearly demonstrate the value of a CAM ensemble with a large membership. More specifically, a sensitivity analysis showed that ensemble subsets with 10 and 20 members are quite susceptible to sampling errors and can preferentially shift the location of the maximum NEP UH values. It was also found that the use of a large CAM ensemble is crucial in the presence of model errors. For example, subjective clustering of the full 51-member CAM ensemble revealed a small ensemble subset in which the time of convection initiation was very close to the observed one. One of the ensemble members in this ensemble subset simulated a supercell whose propagation in the first 1–2 h was consistent with hail reports from NIMH and ESWD. Nevertheless, the interaction of the simulated supercell with spurious convection resulted in its leftward deviation and subsequent dissipation. The adverse impact of the aforementioned model errors was additionally illustrated through an idealized example, which considered deviations in the trajectory of the explicitly resolved supercell. It was shown that such deviations require larger ensemble sizes to represent the unlikely portion of the model state in which the observations fall.
5. Outlook
The geographical location of Bulgaria and its complex terrain make it one of the countries in Europe with relatively high frequency of severe thunderstorms []. Nevertheless, the reduced vertical wind shear in the warm season as a result of the northward retreating polar jet stream means that convective activity over the country is typically unorganized and short-lived. Although not as common, the development of deep moist convection may coincide with the presence of active large-scale atmospheric dynamics, which create favorable conditions for the development of long-lived supercells. The severe weather outbreak from 15 May 2018 represents one such example; the extensive damage created by the supercell on this day means that understanding and prediction of such events needs to be improved in the future. The first step towards meeting this goal is developing a comprehensive thunderstorm climatology. One example of such climatology over Central Europe can be found in Wapler and James [], who concluded that the characteristics of thunderstorms depend heavily on the prevailing synoptic regime. The increasing use of remote sensing observations on the territory of Bulgaria creates unique opportunities to conduct a similar assessment and quantify the frequency of high-impact supercell events. Building a long-term convective assessment is also instrumental to understand how global warming will affect thunderstorm activity in the next couple of decades. This is especially important in the light of recent studies (e.g., []), which point out that small changes in the environment conditions over Southern Europe can produce large changes in the number and intensity of the observed supercells.
The numerical experiments presented herein demonstrate the ability of CAM systems to simulate isolated supercells, which is consistent with the findings of Pilguj et al. []. This forecasting capability is important, as isolated supercells tend to be long-lived and spawn tornadoes in 80% of cases []. A notable similarity between our simulations and those reported in Pilguj et al. [] is the ability of the high-resolution WRF forecasts to predict the observed supercell approximately 12 h prior to its formation, which is an order of magnitude larger than previous estimates (e.g., [,]). Aksoy et al. [] argues that the predictability of convective flows is dependent on the underlying convective mode, which is in turn dictated by the characteristics of the mesoscale flow. The numerical simulations presented here and in Pilguj et al. both feature interactions between a small-scale lifting mechanism (orographic obstacle in our case and a moisture boundary in []) with the large-scale synoptic flow. The latter has been found to increase the predictability of the mesoscale flow [] and, consequently, to improve the accuracy of the explicitly-resolved convection. In the absence of large-scale forcing, storm evolution is primarily driven by small-scale variations in the pre-convective environment. The poor spatiotemporal resolution of current observation networks implies that numerical models often struggle to resolve the enhanced horizontal inhomogeneity of the environment and, hence, degrade the quality of the convective forecasts [].
The findings presented herein also confirm that CAM-based ensemble systems are a valuable tool for predicting severe convection. This is especially true in the presence of large model errors, where a large number of ensemble members may be required to capture the event of interest []. The discussion in Section 3.4.3 made it clear that model errors could have a detrimental impact on the skill of the ensemble forecasts. Given that they arise because of imperfect representation of subgrid-scale model processes, future research efforts should be directed at designing better and more robust parameterization schemes. Gaining a physical insight into the origin of model errors is an effective way to meet this goal and can be achieved by conducting numerical experiments on idealized case studies similar to the isolated supercell event analyzed in this paper. Admittedly, one of the outstanding challenges behind such an approach is the fact that forecast errors exhibit pronounced day-to-day variability []. Bocheva et al. [], for instance, found that the initiation of the three supercells in their 8 July 2014 case study was delayed, which comes in stark contrast to our results. The presence of such discrepancies means that any newly introduced physics formulations should be tested against a wide range of retrospective case studies. The development of improved physical parameterization schemes also opens up opportunities for designing new multi-physics CAM ensemble systems, which have been found useful in maintaining adequate levels of ensemble spread in the short forecast ranges (e.g., [,]).
Apart from reducing the detrimental impact of model errors, the prediction of severe convection over Bulgaria could also benefit from making a better use of the dense observation network in the country. As pointed in Section 3.4.2, one of the main problems of the supercell simulations presented in this paper was the presence of spurious convection in close proximity to the simulated supercell. Past work has shown that the problem of excessive convective development can be alleviated by employing effective data assimilation strategies. In their second set of simulations, for example, Pilguj et al. [] show that the assimilation of conventional surface and rawinsonde observations suppresses the additional convective storms found in their control simulation. The introduction of novel data assimilation techniques, such as the ensemble Kalman filter (EnKF), have also allowed for the assimilation of remotely sensed measurements [,,]. The ability of radar reflectivity observations to identify ‘no-precipitation regions’ makes them extremely valuable for the elimination of spurious convection in the model’s initial conditions [,,]. Recent studies have also demonstrated the ability of alternative data sources, such as crowd-sourced measurements and observations from automated meteorological stations, to improve forecast skill [,]; the growing popularity of these observations in the territory of Bulgaria serves as an additional impetus to explore their value in future work.
Author Contributions
Conceptualization, H.G.C., I.T. and T.D.; methodology, H.G.C., I.T., S.G. and T.D.; formal analysis, H.G.C., I.T., S.G., T.D. and L.B.; investigation, H.G.C., I.T., S.G., T.D. and L.B.; resources, H.G.C., I.T., S.G., T.D., L.B. and X.W.; writing—original draft preparation, H.G.C., I.T., S.G., T.D. and L.B.; writing—review and editing, H.G.C., I.T., S.G., T.D., L.B. and X.W.; visualization, H.G.C., I.T., S.G. and T.D.; supervision, X.W.
Funding
This research received no external funding.
Acknowledgments
The authors are grateful to the Hail Suppression Agency in Bulgaria and LINET for providing reliable remote sensing observations as well as the three anonymous reviewers for their constructive feedback on the early version of this manuscript. The computing for this project was performed at the OU Supercomputing Center for Education & Research (OSCER) at the University of Oklahoma (OU). The first and the sixth author are partially supported by NA16OAR4320115.
Conflicts of Interest
The authors declare no conflict of interest.
References
- Groenemeijer, P.; Kühne, T.; Groenemeijer, P.; Kühne, T. A Climatology of Tornadoes in Europe: Results from the European Severe Weather Database. Mon. Wea. Rev. 2014, 142, 4775–4790. [Google Scholar] [CrossRef]
- Antonescu, B.; Schultz, D.M.; Holzer, A.; Groenemeijer, P.; Antonescu, B.; Schultz, D.M.; Holzer, A.; Groenemeijer, P. Tornadoes in Europe: An Underestimated Threat. Bull. Am. Meteorol. Soc. 2017, 98, 713–728. [Google Scholar] [CrossRef]
- Antonescu, B.; Cărbunaru, F.; Antonescu, B.; Cărbunaru, F. Lightning-Related Fatalities in Romania from 1999 to 2015. Weather. Clim. Soc. 2018, 10, 241–252. [Google Scholar] [CrossRef]
- Dotzek, N.; Groenemeijer, P.; Feuerstein, B.; Holzer, A.M. Overview of ESSL’s severe convective storms research using the European Severe Weather Database ESWD. Atmos. Res. 2009, 93, 575–586. [Google Scholar] [CrossRef]
- Taszarek, M.; Allen, J.; Púčik, T.; Groenemeijer, P.; Czernecki, B.; Kolendowicz, L.; Lagouvardos, K.; Kotroni, V.; Schulz, W.; Taszarek, M.; et al. A Climatology of Thunderstorms across Europe from a Synthesis of Multiple Data Sources. J. Clim. 2019, 32, 1813–1837. [Google Scholar] [CrossRef]
- Púčik, T.; Groenemeijer, P.; Rýva, D.; Kolář, M.; Púčik, T.; Groenemeijer, P.; Rýva, D.; Kolář, M. Proximity Soundings of Severe and Nonsevere Thunderstorms in Central Europe. Mon. Wea. Rev. 2015, 143, 4805–4821. [Google Scholar] [CrossRef]
- Browning, K.A. The Structure and Mechanisms of Hailstorms. In Hail: A Review of Hail Science and Hail Suppression; American Meteorological Society: Boston, MA, 1977; pp. 1–47. [Google Scholar]
- Weisman, M.L.; Klemp, J.B. The Dependence of Numerically Simulated Convective Storms on Vertical Wind Shear and Buoyancy. Mon. Wea. Rev. 1982, 110, 504–520. [Google Scholar] [CrossRef]
- Weisman, M.L.; Klemp, J.B.; Weisman, M.L.; Klemp, J.B. The Structure and Classification of Numerically Simulated Convective Stormsin Directionally Varying Wind Shears. Mon. Wea. Rev. 1984, 112, 2479–2498. [Google Scholar] [CrossRef]
- Davies-Jones, R. A review of supercell and tornado dynamics. In Atmospheric Research; Elsevier: Amsterdam, The Netherlands, 2015; Volume 158–159, pp. 274–291. [Google Scholar]
- Rotunno, R.; Klemp, J.B.; Rotunno, R.; Klemp, J.B. The Influence of the Shear-Induced Pressure Gradient on Thunderstorm Motion. Mon. Wea. Rev. 1982, 110, 136–151. [Google Scholar] [CrossRef]
- Brooks, H.E.; Doswell, C.A.; Cooper, J.; Brooks, H.E.; III, C.A.D.; Cooper, J. On the Environments of Tornadic and Nontornadic Mesocyclones. Wea. Forecasting 1994, 9, 606–618. [Google Scholar] [CrossRef]
- Lemon, L.R.; Doswell, C.A.; Lemon, L.R.; III, C.A.D. Severe Thunderstorm Evolution and Mesocyclone Structure as Related to Tornadogenesis. Mon. Wea. Rev. 1979, 107, 1184–1197. [Google Scholar] [CrossRef]
- Doswell, C.A.; Burgess, D.W. Tornadoes and toraadic storms: A review of conceptual models. Geophys. Monogr.-Am. Geophys. Union 1993, 79, 161–172. [Google Scholar]
- Maier, M.W.; Krider, E.P. A comparative study of cloud-to-ground lightning characteristics in Florida and Oklahoma thunderstorms. In Proceedings of the Twelfth Conference on Severe Local Storms, San Antonio, TX, USA, 11–15 January 1982; American Meteor Society: Geneseo, NY, USA, 1982; pp. 363–367. [Google Scholar]
- Turman, B.N.; Tettelbach, R.J.; Turman, B.N.; Tettelbach, R.J. Synoptic-Scale Satellite Lightning Observations in Conjunction with Tornadoes. Mon. Wea. Rev. 1980, 108, 1878–1882. [Google Scholar] [CrossRef][Green Version]
- Williams, E.R. Large-scale charge separation in thunderclouds. J. Geophys. Res. 1985, 90, 6013. [Google Scholar] [CrossRef]
- MacGorman, D.R.; Burgess, D.W.; Mazur, V.; Rust, W.D.; Taylor, W.L.; Johnson, B.C. Lightning Rates Relative to Tornadic Storm Evolution on 22 May 1981. J. Atmos. Sci. 1989, 46, 221–251. [Google Scholar] [CrossRef]
- Deierling, W.; Petersen, W.A. Total lightning activity as an indicator of updraft characteristics. J. Geophys. Res. 2008, 113, D16210. [Google Scholar] [CrossRef]
- Saunders, C.P.R.; Keith, W.D.; Mitzeva, R.P. The effect of liquid water on thunderstorm charging. J. Geophys. Res. 1991, 96, 11007. [Google Scholar] [CrossRef]
- Gatlin, P.N.; Goodman, S.J.; Gatlin, P.N.; Goodman, S.J. A Total Lightning Trending Algorithm to Identify Severe Thunderstorms. J. Atmos. Ocean. Technol. 2010, 27, 3–22. [Google Scholar] [CrossRef]
- Schultz, C.J.; Carey, L.D.; Schultz, E.V.; Blakeslee, R.J.; Schultz, C.J.; Carey, L.D.; Schultz, E.V.; Blakeslee, R.J. Kinematic and Microphysical Significance of Lightning Jumps versus Nonjump Increases in Total Flash Rate. Wea. Forecasting 2017, 32, 275–288. [Google Scholar] [CrossRef] [PubMed]
- Kane, R.J.; Kane, R.J. Correlating Lightning to Severe Local Storms in the Northeastern United States. Wea. Forecasting 1991, 6, 3–12. [Google Scholar] [CrossRef]
- Williams, E.; Boldi, B.; Matlin, A.; Weber, M.; Hodanish, S.; Sharp, D.; Goodman, S.; Raghavan, R.; Buechler, D. The behavior of total lightning activity in severe Florida thunderstorms. Atmos. Res. 1999, 51, 245–265. [Google Scholar] [CrossRef]
- Lang, T.J.; Rutledge, S.A.; Dye, J.E.; Venticinque, M.; Laroche, P.; Defer, E.; Lang, T.J.; Rutledge, S.A.; Dye, J.E.; Venticinque, M.; et al. Anomalously Low Negative Cloud-to-Ground Lightning Flash Rates in Intense Convective Storms Observed during STERAO-A. Mon. Wea. Rev. 2000, 128, 160–173. [Google Scholar] [CrossRef]
- Soula, S.; Seity, Y.; Feral, L.; Sauvageot, H. Cloud-to-ground lightning activity in hail-bearing storms. J. Geophys. Res. 2004, 109, D02101. [Google Scholar] [CrossRef]
- Doswell, C.A.; Brooks, H.E.; Maddox, R.A.; III, C.A.D.; Brooks, H.E.; Maddox, R.A. Flash Flood Forecasting: An Ingredients-Based Methodology. Wea. Forecasting 1996, 11, 560–581. [Google Scholar] [CrossRef]
- Markowski, P.; Hannon, C.; Rasmussen, E. Observations of Convection Initiation “Failure” from the 12 June 2002 IHOP Deployment. Mon. Wea. Rev. 2006, 134, 375–405. [Google Scholar] [CrossRef]
- Thompson, R.L.; Edwards, R.; Hart, J.A.; Elmore, K.L.; Markowski, P.; Thompson, R.L.; Edwards, R.; Hart, J.A.; Elmore, K.L.; Markowski, P. Close Proximity Soundings within Supercell Environments Obtained from the Rapid Update Cycle. Wea. Forecasting 2003, 18, 1243–1261. [Google Scholar] [CrossRef]
- Doswell, C.A.; Evans, J.S. Proximity sounding analysis for derechos and supercells: an assessment of similarities and differences. Atmos. Res. 2003, 67–68, 117–133. [Google Scholar] [CrossRef]
- Rasmussen, E.N.; Blanchard, D.O. A Baseline Climatology of Sounding-Derived Supercell andTornado Forecast Parameters. Wea. Forecasting 1998, 13, 1148–1164. [Google Scholar] [CrossRef]
- Brooks, H.E.; Lee, J.W.; Craven, J.P. The spatial distribution of severe thunderstorm and tornado environments from global reanalysis data. Atmos. Res. 2003, 67–68, 73–94. [Google Scholar] [CrossRef]
- Thompson, R.L.; Smith, B.T.; Grams, J.S.; Dean, A.R.; Broyles, C.; Thompson, R.L.; Smith, B.T.; Grams, J.S.; Dean, A.R.; Broyles, C. Convective Modes for Significant Severe Thunderstorms in the Contiguous United States. Part II: Supercell and QLCS Tornado Environments. Wea. Forecasting 2012, 27, 1136–1154. [Google Scholar] [CrossRef]
- Taszarek, M.; Brooks, H.E.; Czernecki, B.; Taszarek, M.; Brooks, H.E.; Czernecki, B. Sounding-Derived Parameters Associated with Convective Hazards in Europe. Mon. Wea. Rev. 2017, 145, 1511–1528. [Google Scholar] [CrossRef]
- Baldauf, M.; Seifert, A.; Förstner, J.; Majewski, D.; Raschendorfer, M.; Reinhardt, T. Operational Convective-Scale Numerical Weather Prediction with the COSMO Model: Description and Sensitivities. Mon. Wea. Rev. 2011, 139, 3887–3905. [Google Scholar] [CrossRef]
- Sun, J.; Xue, M.; Wilson, J.W.; Zawadzki, I.; Ballard, S.P.; Onvlee-Hooimeyer, J.; Joe, P.; Barker, D.M.; Li, P.W.; Golding, B.; et al. Use of NWP for Nowcasting Convective Precipitation: Recent Progress and Challenges. Bull. Am. Meteorol. Soc. 2014, 95, 409–426. [Google Scholar] [CrossRef]
- Done, J.; Davis, C.A.; Weisman, M. The next generation of NWP: Explicit forecasts of convection using the weather research and forecasting (WRF) model. Atmos. Sci. Lett. 2004, 5, 110–117. [Google Scholar] [CrossRef]
- Kain, J.S.; Weiss, S.J.; Levit, J.J.; Baldwin, M.E.; Bright, D.R. Examination of Convection-Allowing Configurations of the WRF Model for the Prediction of Severe Convective Weather: The SPC/NSSL Spring Program 2004. Wea. Forecasting 2006, 21, 167–181. [Google Scholar] [CrossRef][Green Version]
- Weisman, M.L.; Davis, C.; Wang, W.; Manning, K.W.; Klemp, J.B. Experiences with 0–36-h Explicit Convective Forecasts with the WRF-ARW Model. Wea. Forecasting 2008, 23, 407–437. [Google Scholar] [CrossRef]
- Clark, A.J.; Gallus, W.A.; Xue, M.; Kong, F. A Comparison of Precipitation Forecast Skill between Small Convection-Allowing and Large Convection-Parameterizing Ensembles. Wea. Forecasting 2009, 24, 1121–1140. [Google Scholar] [CrossRef]
- Johnson, A.; Wang, X.; Kong, F.; Xue, M. Object-Based Evaluation of the Impact of Horizontal Grid Spacing on Convection-Allowing Forecasts. Mon. Wea. Rev. 2013, 141, 3413–3425. [Google Scholar] [CrossRef]
- Gallo, B.T.; Clark, A.J.; Dembek, S.R. Forecasting Tornadoes Using Convection-Permitting Ensembles. Wea. Forecasting 2016, 31, 273–295. [Google Scholar] [CrossRef]
- Johnson, A.; Wang, X. Multicase Assessment of the Impacts of Horizontal and Vertical Grid Spacing, and Turbulence Closure Model, on Subkilometer-Scale Simulations of Atmospheric Bores during PECAN. Mon. Wea. Rev. 2019, 147, 1533–1555. [Google Scholar] [CrossRef]
- Flack, D.L.A.; Gray, S.L.; Plant, R.S.; Lean, H.W.; Craig, G.C. Convective-Scale Perturbation Growth across the Spectrum of Convective Regimes. Mon. Wea. Rev. 2018, 146, 387–405. [Google Scholar] [CrossRef]
- Davis, C.; Brown, B.; Bullock, R. Object-Based Verification of Precipitation Forecasts. Part I: Methodology and Application to Mesoscale Rain Areas. Mon. Wea. Rev. 2006, 134, 1772–1784. [Google Scholar] [CrossRef]
- Johnson, A.; Wang, X.; Kong, F.; Xue, M. Hierarchical Cluster Analysis of a Convection-Allowing Ensemble during the Hazardous Weather Testbed 2009 Spring Experiment. Part I: Development of the Object-Oriented Cluster Analysis Method for Precipitation Fields. Mon. Wea. Rev. 2011, 139, 3673–3693. [Google Scholar] [CrossRef][Green Version]
- Johnson, A.; Wang, X. Object-Based Evaluation of a Storm-Scale Ensemble during the 2009 NOAA Hazardous Weather Testbed Spring Experiment. Mon. Wea. Rev. 2013, 141, 1079–1098. [Google Scholar] [CrossRef]
- Mittermaier, M.; Roberts, N.; Thompson, S.A. A long-term assessment of precipitation forecast skill using the Fractions Skill Score. Meteorol. Appl. 2013, 20, 176–186. [Google Scholar] [CrossRef]
- Chipilski, H.G.; Wang, X.; Parsons, D.B. Object-Based Algorithm for the Identification and Tracking of Convective Outflow Boundaries in Numerical Models. Mon. Wea. Rev. 2018, 146, 4179–4200. [Google Scholar] [CrossRef]
- Yano, J.I.I.; Ziemiański, M.Z.; Cullen, M.; Termonia, P.; Onvlee, J.; Bengtsson, L.; Carrassi, A.; Davy, R.; Deluca, A.; Gray, S.L.; et al. Scientific challenges of convective-scale numerical weather prediction. Bull. Am. Meteorol. Soc. 2018, 99, 699–710. [Google Scholar] [CrossRef]
- Gebhardt, C.; Theis, S.; Krahe, P.; Renner, V. Experimental Ensemble Forecasts of Precipitation Based on a Convection-Resolving Model. Atmos. Sci. Lett. 2008, 9, 67–72. [Google Scholar] [CrossRef]
- Schwartz, C.S.; Kain, J.S.; Weiss, S.J.; Xue, M.; Bright, D.R.; Kong, F.; Thomas, K.W.; Levit, J.J.; Coniglio, M.C.; Wandishin, M.S. Toward Improved Convection-Allowing Ensembles: Model Physics Sensitivities and Optimizing Probabilistic Guidance with Small Ensemble Membership. Wea. Forecasting 2010, 25, 263–280. [Google Scholar] [CrossRef]
- Gallo, B.T.; Iyer, E.; Xue, M.; Stratman, D.; Clark, A.J.; Kain, J.S.; Coniglio, M.; Knopfmeier, K.; Correia, J.; Karstens, C.D.; et al. Breaking new ground in severe weather prediction: The 2015 NOAA/hazardous weather testbed spring forecasting experiment. Wea. Forecasting 2017, 32, 1541–1568. [Google Scholar] [CrossRef]
- Clark, A.J.; Jirak, I.L.; Dembek, S.R.; Creagager, G.J.; Kong, F.; Thomas, K.W.; Knopfmeier, K.H.; Gallo, B.T.; Melicick, C.J.; Xue, M.; et al. The community leveraged unified ensemble (CLUE) in the 2016 NOAA/hazardous weather testbed spring forecasting experiment. Bull. Am. Meteorol. Soc. 2018, 99, 1433–1448. [Google Scholar] [CrossRef]
- Schwartz, C.S.; Romine, G.S.; Smith, K.R.; Weisman, M.L. Characterizing and Optimizing Precipitation Forecasts from a Convection-Permitting Ensemble Initialized by a Mesoscale Ensemble Kalman Filter. Wea. Forecasting 2014, 29, 1295–1318. [Google Scholar] [CrossRef]
- Clark, A.J.; Kain, J.S.; Stensrud, D.J.; Xue, M.; Kong, F.; Coniglio, M.C.; Thomas, K.W.; Wang, Y.; Brewster, K.; Gao, J.; et al. Probabilistic Precipitation Forecast Skill as a Function of Ensemble Size and Spatial Scale in a Convection-Allowing Ensemble. Mon. Wea. Rev. 2011, 139, 1410–1418. [Google Scholar] [CrossRef]
- Loken, E.D.; Clark, A.J.; Xue, M.; Kong, F. Comparison of Next-Day Probabilistic Severe Weather Forecasts from Coarse- and Fine-Resolution CAMs and a Convection-Allowing Ensemble. Wea. Forecasting 2017, 32, 1403–1421. [Google Scholar] [CrossRef]
- Raynaud, L.; Bouttier, F. The impact of horizontal resolution and ensemble size for convective-scale probabilistic forecasts. Q. J. R. Meteorol. Soc. 2017, 143, 3037–3047. [Google Scholar] [CrossRef]
- Dimitrova, T.; Mitzeva, R.; Betz, H.D.; Zhelev, H.; Diebel, S. Lightning behavior during the lifetime of severe hail-producing thunderstorms. Idojaras 2013, 117, 295–314. [Google Scholar]
- Bocheva, L.; Dimitrova, T.; Penchev, R.; Gospodinov, I.; Simeonov, P. Severe convective supercell outbreak over western Bulgaria on July 8, 2014. Időjárás 2018, 122, 177–202. [Google Scholar] [CrossRef]
- Betz, H.-D.; Schmidt, K.; Oettinger, W.P. LINET—An International VLF/LF Lightning Detection Network in Europe. In Lightning: Principles, Instruments and Applications; Betz, H.D., Schumann, U., Laroche, P., Eds.; Springer: Dordrecht, The Netherlands, 2008. [Google Scholar]
- Betz, H.-D.; Schmidt, K.; Oettinger, P.; Wirz, M. Lightning detection with 3-D discrimination of intracloud and cloud-to-ground discharges. Geophys. Res. Lett. 2004, 31. [Google Scholar] [CrossRef]
- Betz, H.D.; Schmidt, K.; Laroche, P.; Blanchet, P.; Oettinger, W.P.; Defer, E.; Dziewit, Z.; Konarski, J. LINET—An international lightning detection network in Europe. Atmos. Res. 2009, 91, 564–573. [Google Scholar] [CrossRef]
- Monthly Hydrometeorological Buletin. May 2018. Available online: http://www.meteo.bg/meteo7/sites/storm.cfd.meteo.bg.meteo7/files/Bulletin.pdf (accessed on 30 June 2018). (In Bulgarian).
- Lalaurette, F. Early detection of abnormal weather conditions using a probabilistic extreme forecast index. Q. J. R. Meteorol. Soc. 2003, 129, 3037–3057. [Google Scholar] [CrossRef]
- Tsonevsky, I.; Doswell, C.A.; Brooks, H.E. Early warnings of severe convection using the ECMWF extreme forecast index. Wea. Forecasting 2018, 33. [Google Scholar] [CrossRef]
- Lopez, P.; Lopez, P. A Lightning Parameterization for the ECMWF Integrated Forecasting System. Mon. Wea. Rev. 2016, 144, 3057–3075. [Google Scholar] [CrossRef]
- Cecil, D.J.; Buechler, D.E.; Blakeslee, R.J. Gridded lightning climatology from TRMM-LIS and OTD: Dataset description. Atmos. Res. 2014, 135–136, 404–414. [Google Scholar] [CrossRef]
- Skamarock, W.C.; Klemp, J.B.; Dudhia, J.; Gill, D.O.; Barker, D.M.; Duda, M.G.; Huang, X.-Y.; Wang, W.; Powers, J.G. A Description of the Advanced Research WRF Version 3; National Center for Atmospheric Research: Boulder, CO, USA, 2008. [Google Scholar]
- Mansell, E.R. On Sedimentation and Advection in Multimoment Bulk Microphysics. J. Atmos. Sci. 2010, 67, 3084–3094. [Google Scholar] [CrossRef]
- Johnson, M.; Jung, Y.; Dawson, D.T.; Xue, M. Comparison of Simulated Polarimetric Signatures in Idealized Supercell Storms Using Two-Moment Bulk Microphysics Schemes in WRF. Mon. Wea. Rev. 2016, 144, 971–996. [Google Scholar] [CrossRef]
- Hong, S.-Y.; Noh, Y. A New Vertical Diffusion Package with an Explicit Treatment of Entrainment Processes. Mon. Wea. Rev. 2006, 134, 2318–2341. [Google Scholar] [CrossRef]
- Cohen, A.E.; Cavallo, S.M.; Coniglio, M.C.; Brooks, H.E. A Review of Planetary Boundary Layer Parameterization Schemes and Their Sensitivity in Simulating Southeastern U.S. Cold Season Severe Weather Environments. Wea. Forecasting 2015, 30, 591–612. [Google Scholar] [CrossRef]
- Jiménez, P.A.; Dudhia, J.; González-Rouco, J.F.; Navarro, J.; Montávez, J.P.; García-Bustamante, E.; Jiménez, P.A.; Dudhia, J.; González-Rouco, J.F.; Navarro, J.; et al. A Revised Scheme for the WRF Surface Layer Formulation. Mon. Wea. Rev. 2012, 140, 898–918. [Google Scholar] [CrossRef]
- Tewari, M.; Chen, F.; Wang, W.; Dudhia, J.; Lemone, A.; Mitchell, E.; Ek, M.; Gayno, G.; Wegiel, W.; Cuenca, R. Implementation and verification of the unified Noah land-surface model in the WRF model. In Proceedings of the 20th Conference on Weather Analysis and Forecasting/16th Conference on Numerical Weather Prediction, American Meteorological Society, Seattle, WA, USA, 10–15 January 2004. [Google Scholar]
- Mlawer, E.J.; Taubman, S.J.; Brown, P.D.; Iacono, M.J.; Clough, S.A. Radiative Transfer for Inhomogeneous Atmospheres: RRTM, a Validated Correlated-k Model for the Longwave. J. Geophys. Res. Atmos. 1997, 102, 16663–16682. [Google Scholar] [CrossRef]
- Iacono, M.J.; Delamere, J.S.; Mlawer, E.J.; Shephard, M.W.; Clough, S.A.; Collins, W.D. Radiative Forcing by Long-Lived Greenhouse Gases: Calculations with the AER Radiative Transfer Models. J. Geophys. Res. Atmos. 2008, 113, 2–9. [Google Scholar] [CrossRef]
- Sobash, R.A.; Kain, J.S.; Bright, D.R.; Dean, A.R.; Coniglio, M.C.; Weiss, S.J. Probabilistic Forecast Guidance for Severe Thunderstorms Based on the Identification of Extreme Phenomena in Convection-Allowing Model Forecasts. Wea. Forecasting 2011, 26, 714–728. [Google Scholar] [CrossRef]
- Clark, A.J.; Kain, J.S.; Marsh, P.T.; Correia, J.; Xue, M.; Kong, F. Forecasting Tornado Pathlengths Using a Three-Dimensional Object Identification Algorithm Applied to Convection-Allowing Forecasts. Wea. Forecasting 2012, 27, 1090–1113. [Google Scholar] [CrossRef]
- Cheng, L.; Rogers, D. Hailfalls and Hailstorm Feeder Clouds—An Alberta Case Study. J. Atmos. Sci. 1988, 45, 3533–3544. [Google Scholar] [CrossRef]
- Rosenfeld, D.; Woodley, W.L.; Krauss, T.W.; Makitov, V.; Rosenfeld, D.; Woodley, W.L.; Krauss, T.W.; Makitov, V. Aircraft Microphysical Documentation from Cloud Base to Anvils of Hailstorm Feeder Clouds in Argentina. J. Appl. Meteorol. Climatol. 2006, 45, 1261–1281. [Google Scholar] [CrossRef]
- Foote, G.B.; Krauss, T.W.; Makitov, V. Hail metrics using conventional radar. In Proceedings of the 16th Conference on Planned and Inadvertent Weather Modification, San Diego, CA, USA, 10–13 January 2005; pp. 1–6. [Google Scholar]
- Peyraud, L.; Peyraud, L. Analysis of the 18 July 2005 Tornadic Supercell over the Lake Geneva Region. Wea. Forecasting 2013, 28, 1524–1551. [Google Scholar] [CrossRef][Green Version]
- Rotunno, R.; Klemp, J.B.; Weisman, M.L. A Theory for Strong, Long-Lived Squall Lines. J. Atmos. Sci. 1988, 45, 463–485. [Google Scholar] [CrossRef]
- Williams, E.R. The Electrification of Severe Storms. In Severe Convective Storms; American Meteorological Society: Boston, MA, USA, 2001; pp. 527–561. [Google Scholar]
- Carey, L.D.; Rutledge, S.A. A multiparameter radar case study of the microphysical and kinematic evolution of a lightning producing storm. Meteorol. Atmos. Phys. 1996, 59, 33–64. [Google Scholar] [CrossRef]
- Carey, L.D.; Rutledge, S.A. Electrical and multiparameter radar observations of a severe hailstorm. J. Geophys. Res. Atmos. 1998, 103, 13979–14000. [Google Scholar] [CrossRef]
- Lang, T.J.; Rutledge, S.A.; Lang, T.J.; Rutledge, S.A. Relationships between Convective Storm Kinematics, Precipitation, and Lightning. Mon. Wea. Rev. 2002, 130, 2492–2506. [Google Scholar] [CrossRef]
- Montanyà, J.; Soula, S.; Pineda, N. A study of the total lightning activity in two hailstorms. J. Geophys. Res. Atmos. 2007, 112, 1–12. [Google Scholar] [CrossRef]
- Carey, L.D.; Rutledge, S.A.; Petersen, W.A.; Carey, L.D.; Rutledge, S.A.; Petersen, W.A. The Relationship between Severe Storm Reports and Cloud-to-Ground Lightning Polarity in the Contiguous United States from 1989 to 1998. Mon. Wea. Rev. 2003, 131, 1211–1228. [Google Scholar] [CrossRef]
- Lang, T.J.; Miller, L.J.; Weisman, M.; Rutledge, S.A.; Barker, L.J.; Bringi, V.N.; Chandrasekar, V.; Detwiler, A.; Doesken, N.; Helsdon, J.; et al. The Severe Thunderstorm Electrification and Precipitation Study. Bull. Am. Meteorol. Soc. 2004, 85, 1107–1126. [Google Scholar] [CrossRef]
- Macgorman, D.R.; Burgess, D.W.; MacGorman, D.R.; Burgess, D.W. Positive Cloud-to-Ground Lightning in Tornadic Storms and Hailstorms. Mon. Wea. Rev. 1994, 122, 1671–1697. [Google Scholar] [CrossRef]
- Bunkers, M.J.; Klimowski, B.A.; Zeitler, J.W.; Thompson, R.L.; Weisman, M.L. Predicting Supercell Motion Using a New Hodograph Technique. Wea. Forecasting 2002, 15, 61–79. [Google Scholar] [CrossRef]
- Naylor, J.; Gilmore, M.S.; Thompson, R.L.; Edwards, R.; Wilhelmson, R.B. Comparison of Objective Supercell Identification Techniques Using an Idealized Cloud Model. Mon. Wea. Rev. 2012, 140, 2090–2102. [Google Scholar] [CrossRef]
- Gasperoni, N.A.; Wang, X.; Brewster, K.A.; Carr, F.H. Assessing Impacts of the High-Frequency Assimilation of Surface Observations for the Forecast of Convection Initiation on 3 April 2014 within the Dallas–Fort Worth Test Bed. Mon. Wea. Rev. 2018, 146, 3845–3872. [Google Scholar] [CrossRef]
- Degelia, S.; Wang, X.; Stensrud, D.J.; Johnson, A. Understanding the Impact of Radar and In Situ Observations on the Prediction of a Nocturnal Convection Initiation Event on 25 June 2013 Using an Ensemble-Based Multiscale Data Assimilation System. Mon. Wea. Rev. 2018, 146, 1837–1859. [Google Scholar] [CrossRef]
- Wapler, K.; James, P. Thunderstorm Occurence and Characteristics in Central Europe under Different Synoptic Conditions. Atmos. Res. 2015, 158–159, 231–244. [Google Scholar] [CrossRef]
- Miglietta, M.M.; Mazon, J.; Motola, V.; Pasini, A. Effect of a positive Sea Surface Temperature anomaly on a Mediterranean tornadic supercell. Sci. Rep. 2017, 7, 1–8. [Google Scholar] [CrossRef]
- Pilguj, N.; Taszarek, M.; Pajurek, Ł.; Kryza, M. High-resolution simulation of an isolated tornadic supercell in Poland on 20 June 2016. Atmos. Res. 2019, 218, 145–159. [Google Scholar] [CrossRef]
- Bunkers, M.J.; Hjelmfelt, M.R.; Smith, P.L. An Observational Examination of Long-Lived Supercells. Part I: Characteristics, Evolution, and Demise. Wea. Forecasting 2006, 21, 673–688. [Google Scholar] [CrossRef]
- Aksoy, A.; Dowell, D.C.; Snyder, C. A Multicase Comparative Assessment of the Ensemble Kalman Filter for Assimilation of Radar Observations. Part II: Short-Range Ensemble Forecasts. Mon. Wea. Rev. 2010, 138, 1273–1292. [Google Scholar] [CrossRef]
- Cintineo, R.M.; Stensrud, D.J. On the Predictability of Supercell Thunderstorm Evolution. J. Atmos. Sci. 2013, 70, 1993–2011. [Google Scholar] [CrossRef]
- Anthes, R.A.; Kuo, Y.H.; Baumhefner, D.P.; Errico, R.M.; Bettge, T.W. Predictability of Mesoscale Atmospheric Motions. Adv. Geophys. 1985, 28, 159–202. [Google Scholar]
- Stensrud, D.J.; Gao, J. Importance of Horizontally Inhomogeneous Environmental Initial Conditions to Ensemble Storm-Scale Radar Data Assimilation and Very Short-Range Forecasts. Mon. Wea. Rev. 2010, 138, 1250–1272. [Google Scholar] [CrossRef]
- Miglietta, M.M.; Manzato, A.; Rotunno, R. Characteristics and predictability of a supercell during HyMeX SOP1. Q. J. R. Meteorol. Soc. 2016, 142, 2839–2853. [Google Scholar] [CrossRef]
- Flora, M.L.; Potvin, C.K.; Wicker, L.J. Practical Predictability of Supercells: Exploring Ensemble Forecast Sensitivity to Initial Condition Spread. Mon. Wea. Rev. 2018, 146, 2361–2379. [Google Scholar] [CrossRef]
- Stensrud, D.J.; Bao, J.-W.; Warner, T.T. Using Initial Condition and Model Physics Perturbations in Short-Range Ensemble Simulations of Mesoscale Convective Systems. Mon. Wea. Rev. 2000, 128, 2077–2107. [Google Scholar] [CrossRef]
- Aksoy, A.; Dowell, D.C.; Snyder, C. A multicase comparative assessment of the ensemble Kalman filter for assimilation of radar observations. Part I: Storm-scale analyses. Mon. Wea. Rev. 2009, 137, 1805–1824. [Google Scholar] [CrossRef]
- Mansell, E.R. EnKF analysis and forecast predictability of a tornadic supercell storm. In Proceedings of the 24th Conference on Severe Local Storms, Savannah, GA, USA, 27–31 October 2008; American Meteor Society: Savannah, GA, USA, 2008; p. 5. [Google Scholar]
- Yussouf, N.; Mansell, E.R.; Wicker, L.J.; Wheatley, D.M.; Stensrud, D.J. The Ensemble Kalman Filter Analyses and Forecasts of the 8 May 2003 Oklahoma City Tornadic Supercell Storm Using Single- and Double-Moment Microphysics Schemes. Mon. Wea. Rev. 2013, 141, 3388–3412. [Google Scholar] [CrossRef]
- Wang, Y.; Wang, X. Direct Assimilation of Radar Reflectivity without Tangent Linear and Adjoint of the Nonlinear Observation Operator in the GSI-Based EnVar System: Methodology and Experiment with the 8 May 2003 Oklahoma City Tornadic Supercell. Mon. Wea. Rev. 2017, 145, 1447–1471. [Google Scholar] [CrossRef]
- Duda, J.D.; Wang, X.; Wang, Y.; Carley, J.R. Comparing the Assimilation of Radar Reflectivity Using the Direct GSI-Based Ensemble–Variational (EnVar) and Indirect Cloud Analysis Methods in Convection-Allowing Forecasts over the Continental United States. Mon. Wea. Rev. 2019, 147, 1655–1678. [Google Scholar] [CrossRef]
- Mass, C.F.; Madaus, L.E. Surface Pressure Observations from Smartphones: A Potential Revolution for High-Resolution Weather Prediction? Bull. Am. Meteorol. Soc. 2014, 95, 1343–1349. [Google Scholar] [CrossRef][Green Version]
© 2019 by the authors. Licensee MDPI, Basel, Switzerland. This article is an open access article distributed under the terms and conditions of the Creative Commons Attribution (CC BY) license (http://creativecommons.org/licenses/by/4.0/).