Article

The Effects of Spring and Winter Blocking on PM10 Concentration in Korea

Department of Climate and Energy Systems Engineering, Ewha Womans University, Seoul 03760, Korea
*
Author to whom correspondence should be addressed.
Atmosphere 2019, 10(7), 410; https://doi.org/10.3390/atmos10070410
Submission received: 12 June 2019 / Revised: 16 July 2019 / Accepted: 16 July 2019 / Published: 18 July 2019
(This article belongs to the Section Air Quality)

Abstract

:
Atmospheric blocking is known to be related to locally developed abnormal climate of the Korean Peninsula, such as heat and cold waves. However, little attention has been devoted to the effects of blocking on the fine dust concentration over Korea. In this study, we analyze the connection between the monthly frequency of blocking occurrence and high particulate matter smaller than 10 μm in diameter (PM10) concentration events in Korea. Our analyses are limited to winter (DJF) and spring (MAM) when both the blocking and high PM10 events tend to take place most frequently. During winter, significant and positive correlations are found in the North Pacific, while significantly negative values are seen over Ural-Siberia. A high PM10 concentration tends to be accompanied by negative (positive) pressure anomalies over Siberia (North Pacific). However, while examining atmospheric fields associated with the high PM10 events, we find that the high PM10 events show two different types of atmospheric fields depending on the strength of wind speed over Korea. When the local wind speed over Korea is weaker than normal, the connection with the North Pacific blocking is strengthened, whereas, the connection with the Ural-Siberia blocking is enhanced when the wind speed is stronger than normal. However, to increase the occurrence of the high PM10 events, both types feature a strong meridional pressure gradient caused by a high pressure system forming over Siberia. This is accompanied by a strong upper tropospheric zonal wind from China and Mongolia to Korea.

1. Introduction

From 1 to 7 March 2019, cities on the Korean Peninsula experienced fine dust warnings as the hourly-average concentration of the particulate matter of 2.5 µm or less (PM2.5) was predicted to exceed 150 μg m−3 for more than two hours. The concentration at the national level was also very high, exceeding 76 μg m−3. For example, in Seoul, an average concentration of 137 μg m−3 was recorded on 3 March, which indicated bad air quality and was six times higher than the WHO’s recommended daily concentration of 25 μg m−3 for that region. However, this was not the first catastrophe of that kind, since high-concentration fine dust events occur frequently in winter and spring over the Korean Peninsula. These events receive a great deal of attention and are relevant for the management and prediction of air quality.
Fine dust, such as PM10, includes the primary product generated by incineration, fire, and emissions from cars or industrial facilities. Since the 1980s, there has been strong efforts to improve the air quality in Korean cities. For example, coal and oil have been replaced with LNG (liquefied natural gas) gas to reduce sulfur dioxide emissions, and there have been inspections by the government of places that generate scattering dust [1]. However, Korea is affected not only by local pollution, but also by transports of pollutants from surrounding areas. The major sources of foreign fine dust are inland deserts and a dense manufacturing industry, which relies on coal-fired power generation [2,3,4]. Moreover, the synoptic atmospheric condition plays an important role in PM10 concentrations [5]. Chen et al. [6] analyzed that the atmospheric circulation over China is involved in multiday fine dust pollution in Seoul. For instance, fine dust accumulated by the lower tropospheric high pressure can cause dust pollution in Seoul for several days, while an anomalous low pressure system formed in the Okhotsk Sea and East Sea, blocks the movement of upstream high pressure. Park et al. [7] confirmed that the fine dust concentration on the Shandong Peninsula together with a westerly wind have a positive correlation with fine dust concentration in Korea.
In this study, we investigate whether the PM10 concentration is influenced by a large-scale persistent atmospheric flow, i.e., atmospheric blocking. Blocking can be defined in various ways. For example, detections can be based on a negative potential vorticity anomaly [8], a positive 500 hPa geopotential height anomaly [9], and a reversal of the north-south 500 hPa geopotential height gradient [10]. In all cases, it refers to a quasi-stationary persistent high pressure system that is accompanied with a transition from a zonal to a more meridional flow pattern [11]. Climatology of blocking depends on the identification method (e.g., [12]). In general, blockings tend to occur more frequently in spring and winter than in the other seasons, especially when detected in the 500 hPa geopotential height field (Figure 7 of [12]). Preferable location corresponds to the climatological storm tracks in the Northern Hemisphere over the North Pacific, North Atlantic, and Ural Mountains. The duration of a blocking is approximately five to 10 days [13,14]. Large-scale low-frequency atmospheric variability, such as the North Atlantic oscillation, Pacific-North American teleconnection pattern, and El Niño-Southern oscillation, is also known to influence the frequency of blocking occurrence [15]. Blocking phenomena affect the origin and neighboring regions, and sometimes remote areas. For instance, blocking is associated with weakened zonal wind, as well as cloudless and dry conditions for about a week [16]. An example of an intense and long-lived blocking event is the one associated with the Russian heat wave in the summer of 2010 which had a duration of around two months [17].
A number of studies have shown the impact of blocking on Korea. However, studies have mostly focused on cold waves [18,19], while the research on the effects of blocking on fine dust concentration in Korea is lacking. Korea is an area where blocking occurs less frequently, whereas, for instance, areas like the North Pacific experience blocking conditions more often. However, blockings in remote regions can change circulation over Korea. For instance, when a Siberian high pressure system in the Urals (50–90° E) moves to the Kamchatka Peninsula and develops into a blocking, a high pressure system evolves to the west of the Korean Peninsula, while a low is centered in the east. This strong zonal pressure gradient causes anomalous cold advection from the north into Korea [18,19]. Similarly, the summer Ohotsk blocking has a distinct negative correlation with summer temperatures in Korea [20]. In 2016, blocking formed in Kamchatka that contributed to the Korean heat wave by obstructing the upstream system from moving to the east [21].
Under blocking conditions, weather systems near Korea last for a long time at the same locations which can affect the transport of dust or air congestion in Korea, changing the conditions for high concentrations of fine dust. There is a case study on blocking and fine dust concentration over Korea. In April 2012, the transport path of fine dust was shifted to the northeast due to a persistent high pressure system formed in eastern South Korea, leading to cleaner air than usual [22]. Blocking also alters the jet stream, which is known to favor fine dust transport over long distances [23]. Lee et al. [24] analyzed that if El Nino occurs when Arctic Oscillation is negative, the west wind develops due to inland low pressure and ocean high pressure, increasing the amount of dust transport. In addition, a high pressure system developing north of the desert reduces dust storms. If blocking dominates the large scale atmospheric circulation related to the generation or transportation of fine dust, the concentration of fine dust in Korea may change.
The objectives of this study is to investigate the relationship between blocking occurrence and PM10 concentration in Korea. After revealing the relationship, we will examine how a blocking system modulates the atmospheric conditions that are known to influence the PM10 concentration. Our analysis is limited to PM10, while PM2.5 is not examined due to its limited data availability. Moreover, PM10 measurement data were used without distinguishing between yellow dust and fine dust, since this distinction does not have an added value on the spatial scales investigated in this study; stagnation and transportation will operate in a similar manner to both yellow and fine dust.
In Section 2, we introduce the data and methods used to define high PM10 events and atmospheric blocking. In Section 3, we examine the correlation between high PM10 events and blocking systems, and weather variables that affect fine dust in general. In addition, we analyze and describe how blocking exactly affects high PM10 events. In Section 4, we summarize the results of the study.

2. Data and Methods

2.1. Data

To select the days when the Korea PM10 concentration is nationally high, daily PM10 data was used. We used station data provided by the Korea Meteorological Administration (KMA, https://data.kma.go.kr/) of daily PM10 to select days with high PM10 concentration in Korea. The dataset includes daily PM10 concentration averaged between 00 and 23 local time from 32 locations distributed over South Korea (see Figure 1). We investigated the time period from 1 January 2004 to 31 December 2016. As a limited number of stations provided data in 2003, we excluded this year from our analysis. Only data from observatories with more than 80% of the observed dates between 2004 and 2016 were used to calculate the high PM10 index.
The reanalysis dataset from the European Centre for Medium-Range Weather Forecasts (ERA-Interim, [25]) was used with 2.5° × 2.5° horizontal resolution. It included horizontal fields of geopotential height, temperature, and wind at specific pressure levels. The horizontal wind speed (WS) was calculated using Equation (1) while U denotes the zonal wind and V the meridional wind:
WS = U 2 + V 2
The anomaly is obtained by removing the 2004 to 2016 climatology from the wind speed at each point. When the wind speed is averaged throughout Korea or Korea blocking is defined, the region was set at 30–40° N and 120–135° E.
This study focuses on the 500 hPa geopotential height and 200 hPa and 850 hPa wind speeds. We selected the 500 hPa geopotential height field to investigate atmospheric blocking and the large-scale circulation pattern in general. In addition, this variable was used for the blocking detection routine. The 200 hPa wind speed is related to long-distance PM10 transport. Lastly, the transboundary layers were observed through 850 hPa wind speeds [5,6].
To check significance for correlation coefficients, the statistical significance is examined at each grid point using Equation (2):
t = r × N r 2 1 r 2
where, Nr is the sample size, r is the Pearson correlation coefficient, and t is the p-value. It is assumed that the variables used to obtain the correlation coefficient are normally distributed and a two-sided test was performed on t returned.

2.2. Definition of High PM10 Concentration Events

We defined high PM10 concentration events using the percentage of the stations satisfying the conditions to detect a day when PM10 concentration in Korea changes nationally. Using 14 stations that provided observations for over 80% of the days between 2004 and 2016, it was defined that high PM10 concentration events occurred in Korea when there were more than 75% of stations that recorded as “bad” based on the World Meteorological Organization standard (over 50 μg m−3). On the days that some stations have missing values, the percentages between the remaining stations are calculated. The concentration criteria (i.e., over 50 μg m−3) were used to ensure sufficient sample size. As the primary focus of this study is to reveal the impact of blocking, synoptic or even greater spatial scales were of relevance here. Moreover, the duration of the total data was just over a decade. Nonetheless, the overall results were largely insensitive even if the concentration criteria was changed to 80 μg m−3 and 100 μg m−3, or the station percentage was changed to 100%.

2.3. Definition of Blocking Events

A blocking index is calculated following Dunn-Sigouin et al. [26] using the 500 hPa geopotential height during 1979–2016 (not shown). Their index employs a hybrid formula that combines the methods of Tibaldi–Molteni (TM) [10] and Dole and Gordon [9]. That is, atmospheric blockings are detected based on both the strength of 500 hPa geopotential height anomalies and the reversal of 500 hPa geopotential height meridional gradient. To be specific, the first step is to calculate the 500 hPa geopotential height anomaly by removing the running annual mean and the mean seasonal cycle. At each point, the anomaly amplitude should be positive and greater than the 1.5 standard deviation of each month. The spatial scale of cohering points should be greater than 2.5 × 10⁶ km2 as blocking is a large scale event. If the events have an overlap greater than 50% within 2 days, they are considered to be the same event. The reversal of the meridional gradient of absolute geopotential height should be detected for at least one day and one point. Finally, the event must last for at least five days, meeting the conditions above. An event that satisfies all of these conditions is defined as blocking.
Figure 3 from Dunn-Sigouin et al. [26] illustrates the seasonal blocking frequency (%) detected by the hybrid index. The blocking frequency was calculated at each point by dividing the number of days that blocking was detected by the number of days for the study period. The hybrid index, similar to the TM, detects active blocking occurrence during winter and spring and shows the highest frequency in the central Pacific and southeast Greenland. Pacific blocking, which is close to the Korea, and Ural (50–80° E, 50–70° N) blocking, which has been confirmed to have an impact on Korea, is 15% and 8%, respectively, showing high frequencies. In the case of Korea blocking, the number of blockings is very low, with 24 cases (129 days) occurring from 1979 to 2016 and 10 cases (54 days) from 2004 to 2016, with 50% of them occurring in the spring.
The TM and the hybrid indices are commonly used in blocking studies. While the TM index detects blocking for a limited longitudinal band, the hybrid index considers a wider area, including the mid-latitudes and effectively filtering out low-latitude fluctuations. Therefore, the hybrid index is used in this study to identify blocking that affects the Korean Peninsula.

3. Results

3.1. PM10 Concentration over Korea

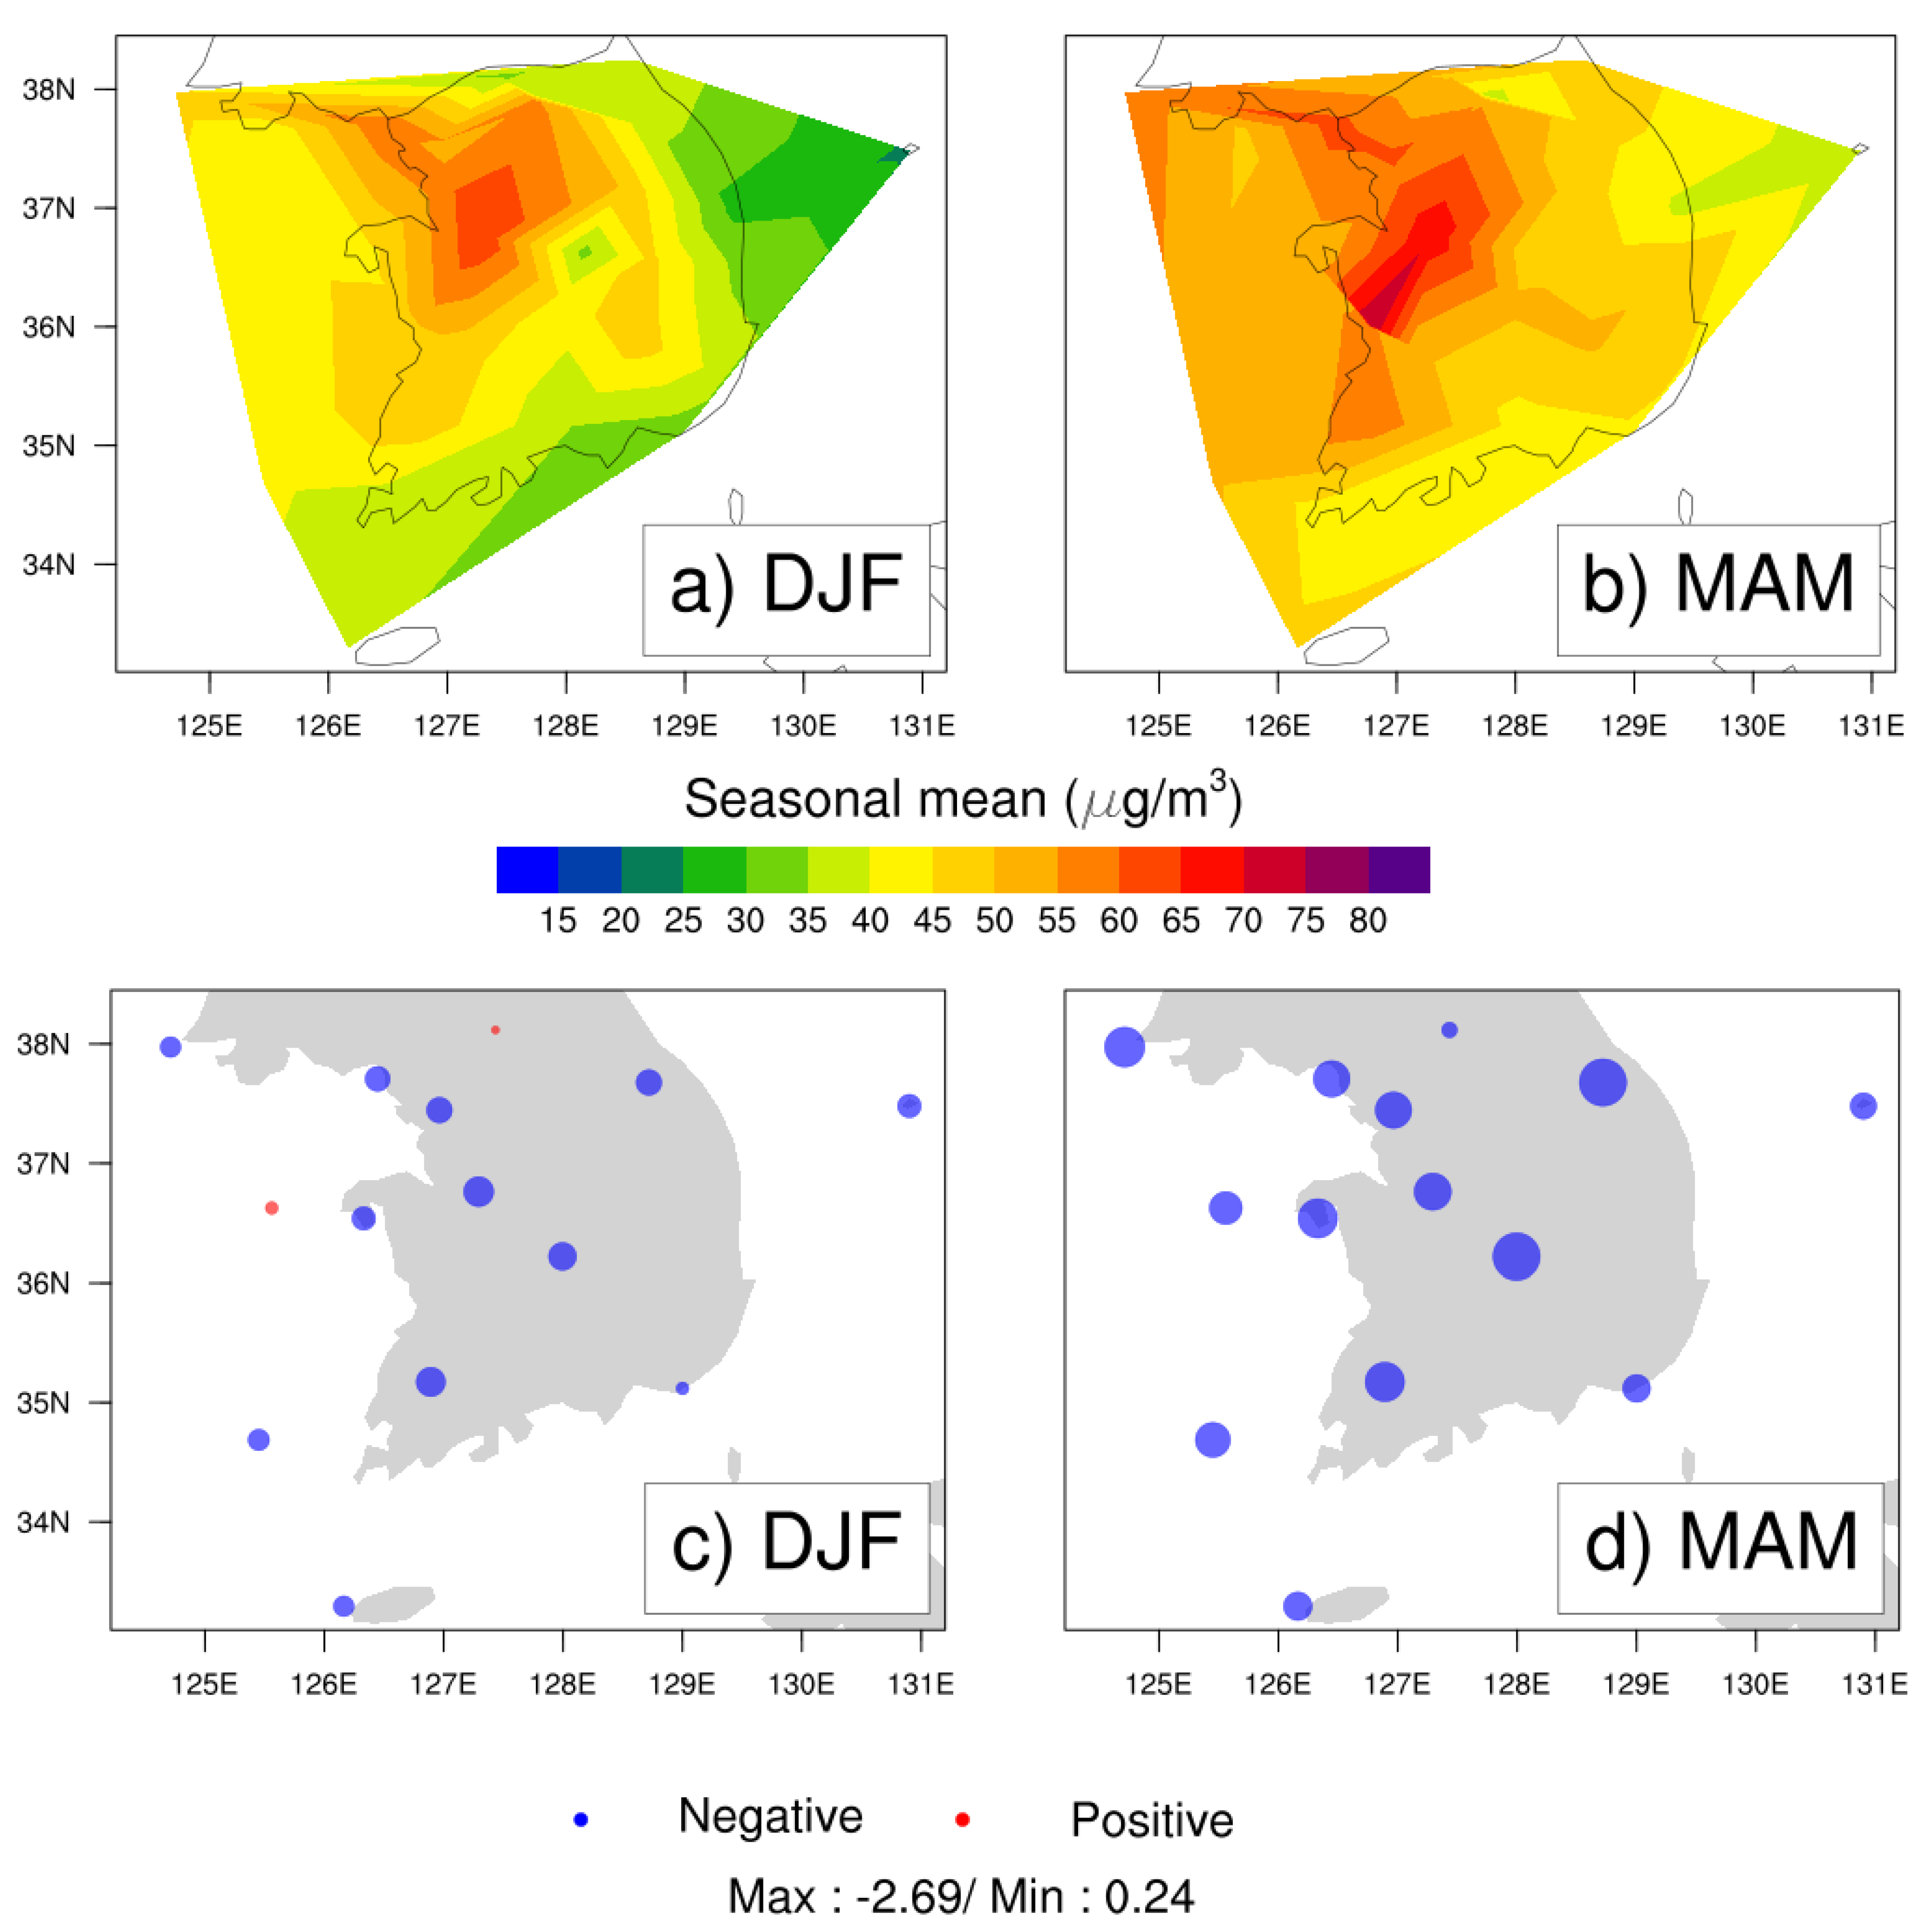
Figure 1 shows the seasonal mean concentration for all stations and the seasonal regression coefficient for the targeted stations. The regression coefficients were obtained from the monthly mean concentration within a given season. From 2004 to 2016, PM10 concentrations are on the decline, but the average concentration in the metropolis (37.5° N, 127° E) and Chungcheong (36.5° N, 126.5° E) is higher than 50 μg m−3 in both spring and winter, presumably due to urbanization and industrialization (Figure 1a,b). The southern and eastern regions of Korea maintain lower concentrations as compared with the west, but in spring (Figure 1b), the national average is higher than 40 μg m−3 or higher except for Ulleung-do (37.5° N, 131° E). In addition, the number of forest fires that can affect local PM10 concentrations reaches 300 events per year in spring and winter (Statistics of Forest Fire by Korean Statistical Information Service; http://kosis.kr/eng). Moreover, Gong et al. [27] found that PM10 emissions increase during times of high energy use. An abnormally high concentration in a few areas causes the national average to rise. To prevent sampling local events, the high PM10 concentration events, defined in Section 2, will be used in our analyses. Even if the concentration is high in some areas, such as the Seoul and Chungcheong, observatories in other areas must also meet the criteria, so it can be detected whether the concentration has increased nationwide.
An index using a percentage of stations that meet the criteria in Section 2 is used to exclude the local effects. Blocking does not only affect a certain area because it is a large-scale phenomenon. On days with bad air quality across the whole country, the impact of blocking can be clearly identified only when the local air pollution is initially excluded. However, if the high PM10 event date is selected based on the national average of concentration, it is likely that local pollution will be recorded as a national pollution. 
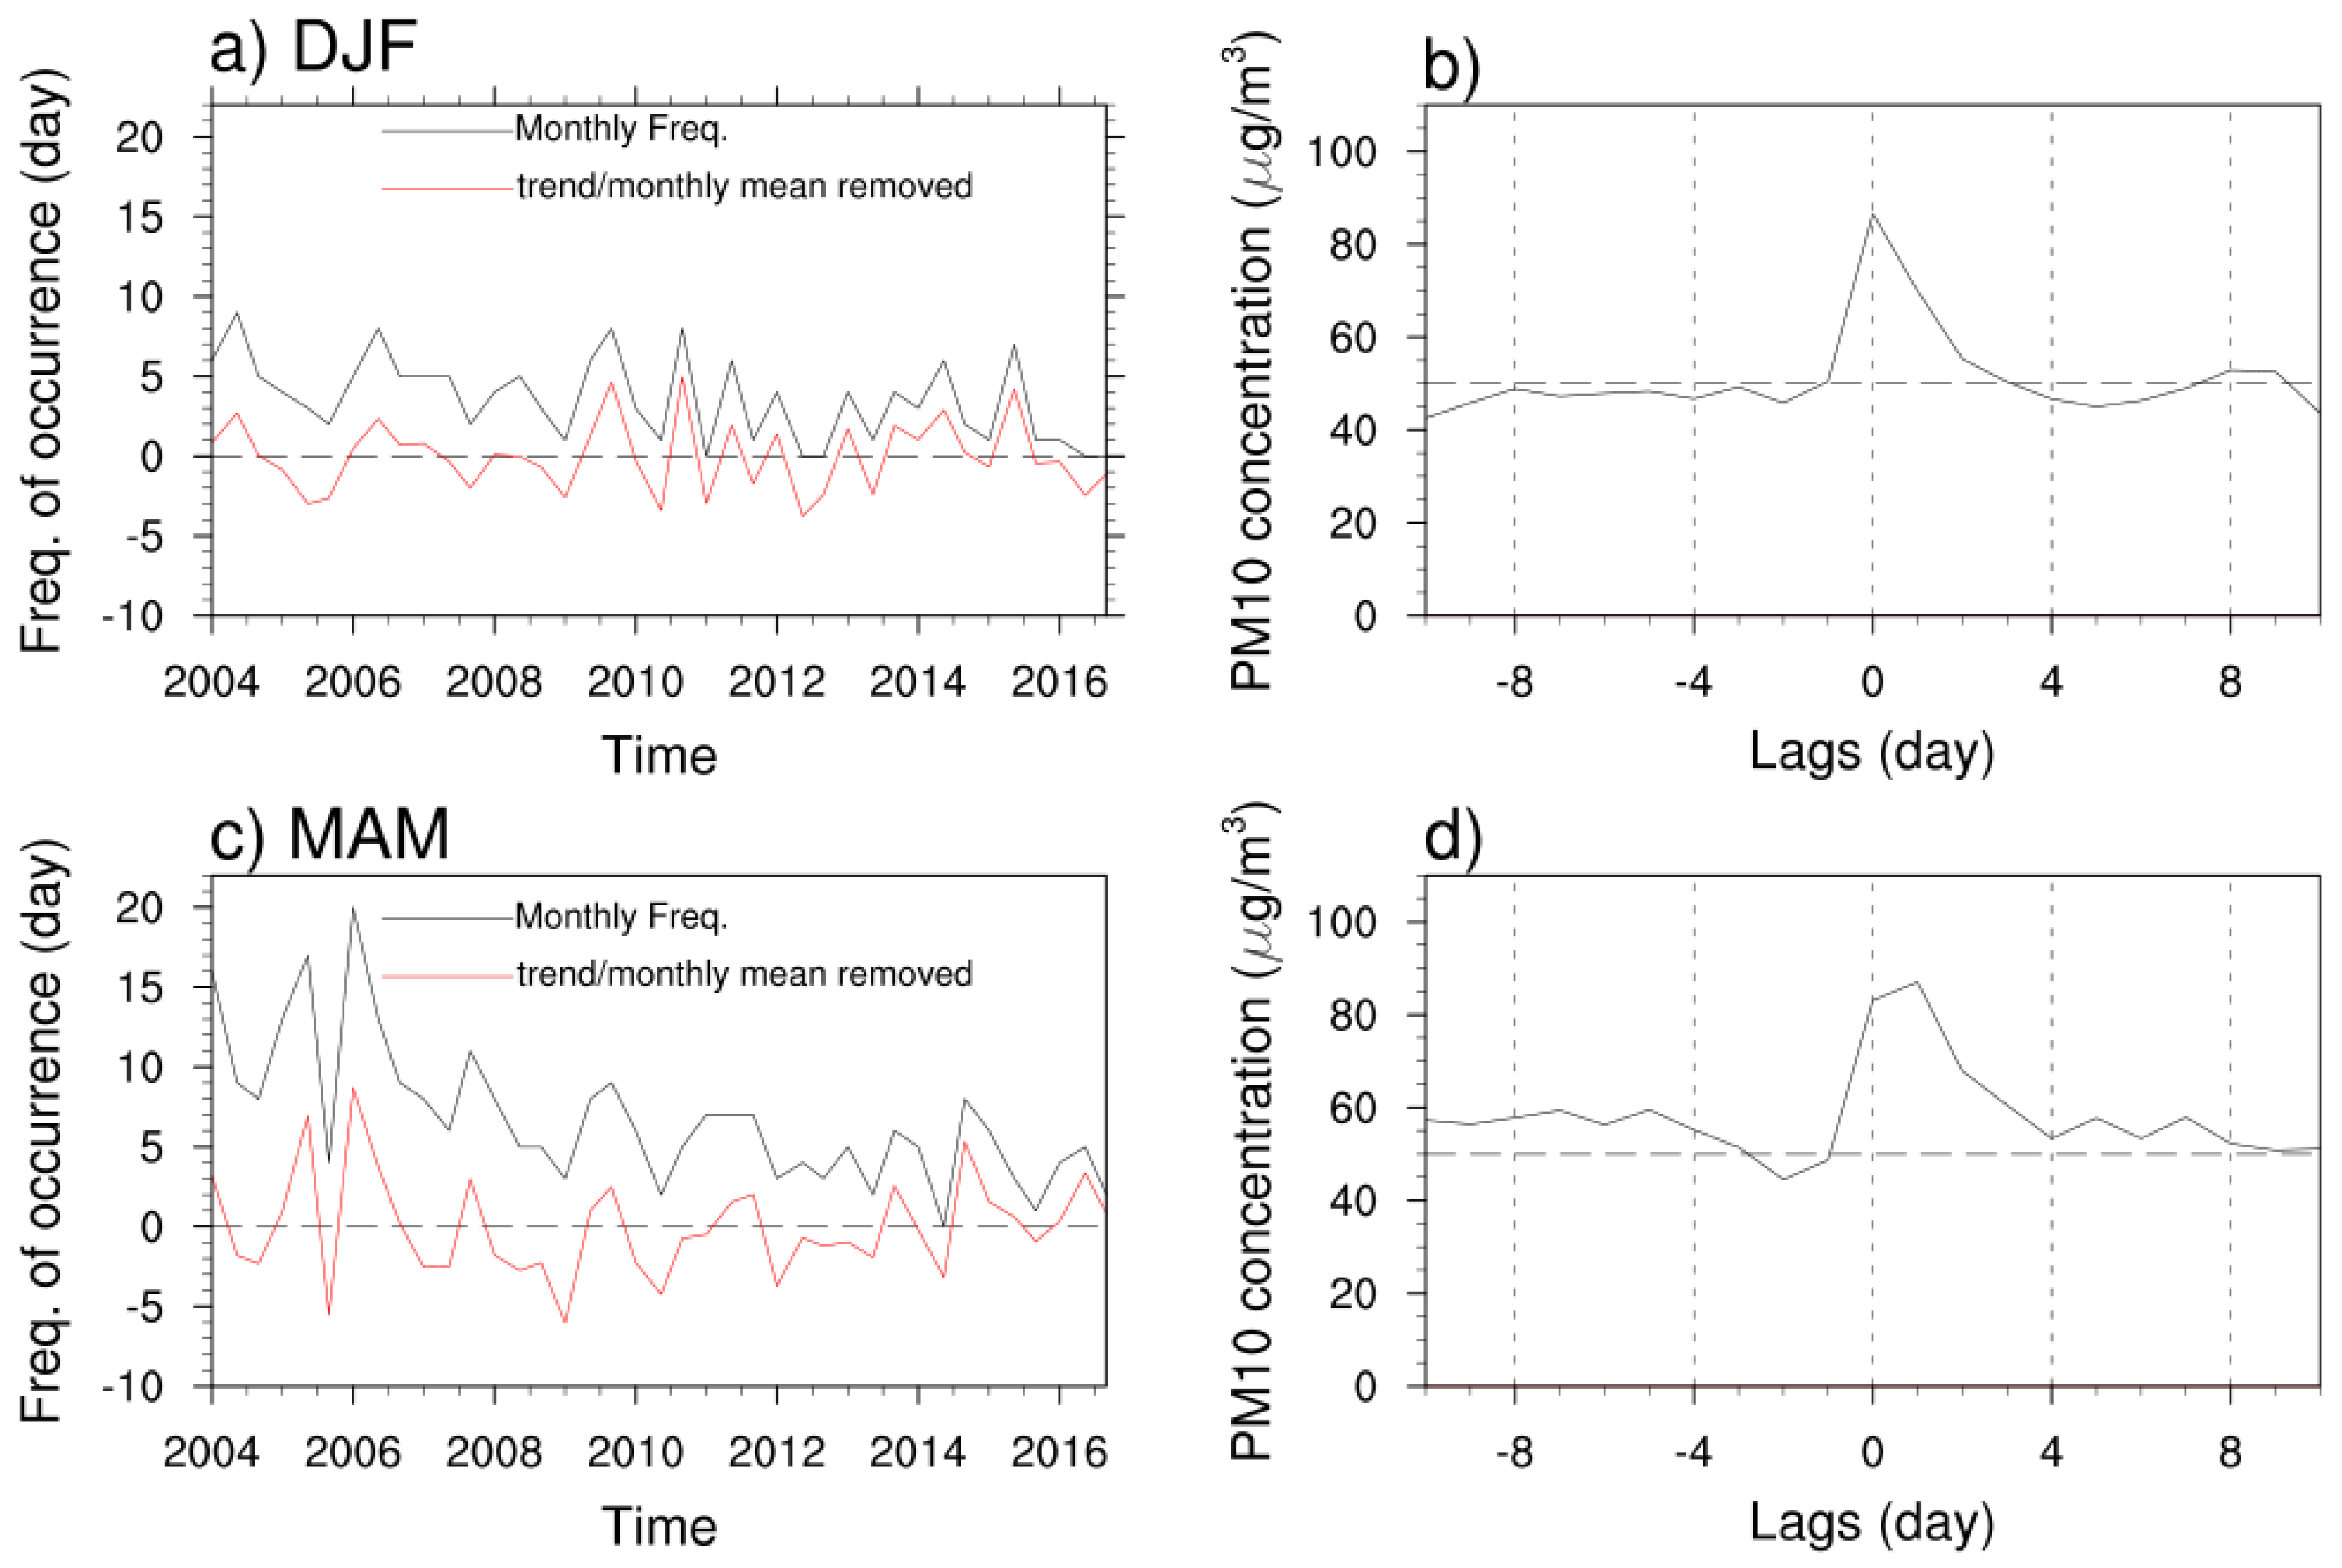
Figure 2 shows the characteristics of the high PM10 concentration events. The black line in Figure 2a shows the monthly frequency of the high PM10 event, indicating how many days with high PM10 concentration are detected during a month. The red line shows the monthly frequency of the high PM10 event with the monthly mean and the linear trend removed. Events occur more frequently in spring than in winter, and were especially more frequent from 2004 to 2008 (Figure 2a,c). However, in spring, the negative trend is steeper than that in winter, which is consistent with the greater regression coefficients of spring in Figure 1d. Figure 2b,d illustrate the mean concentration changes about the targeted station for the onset date of the high PM10 event. At the onset day of the event, the concentration increases by about 40 μg m−3 and then recovers. Spring has a longer event duration than winter.

3.2. PM10 and Blocking

We examine whether blockings are associated with the PM10 concentrations in Korea. 
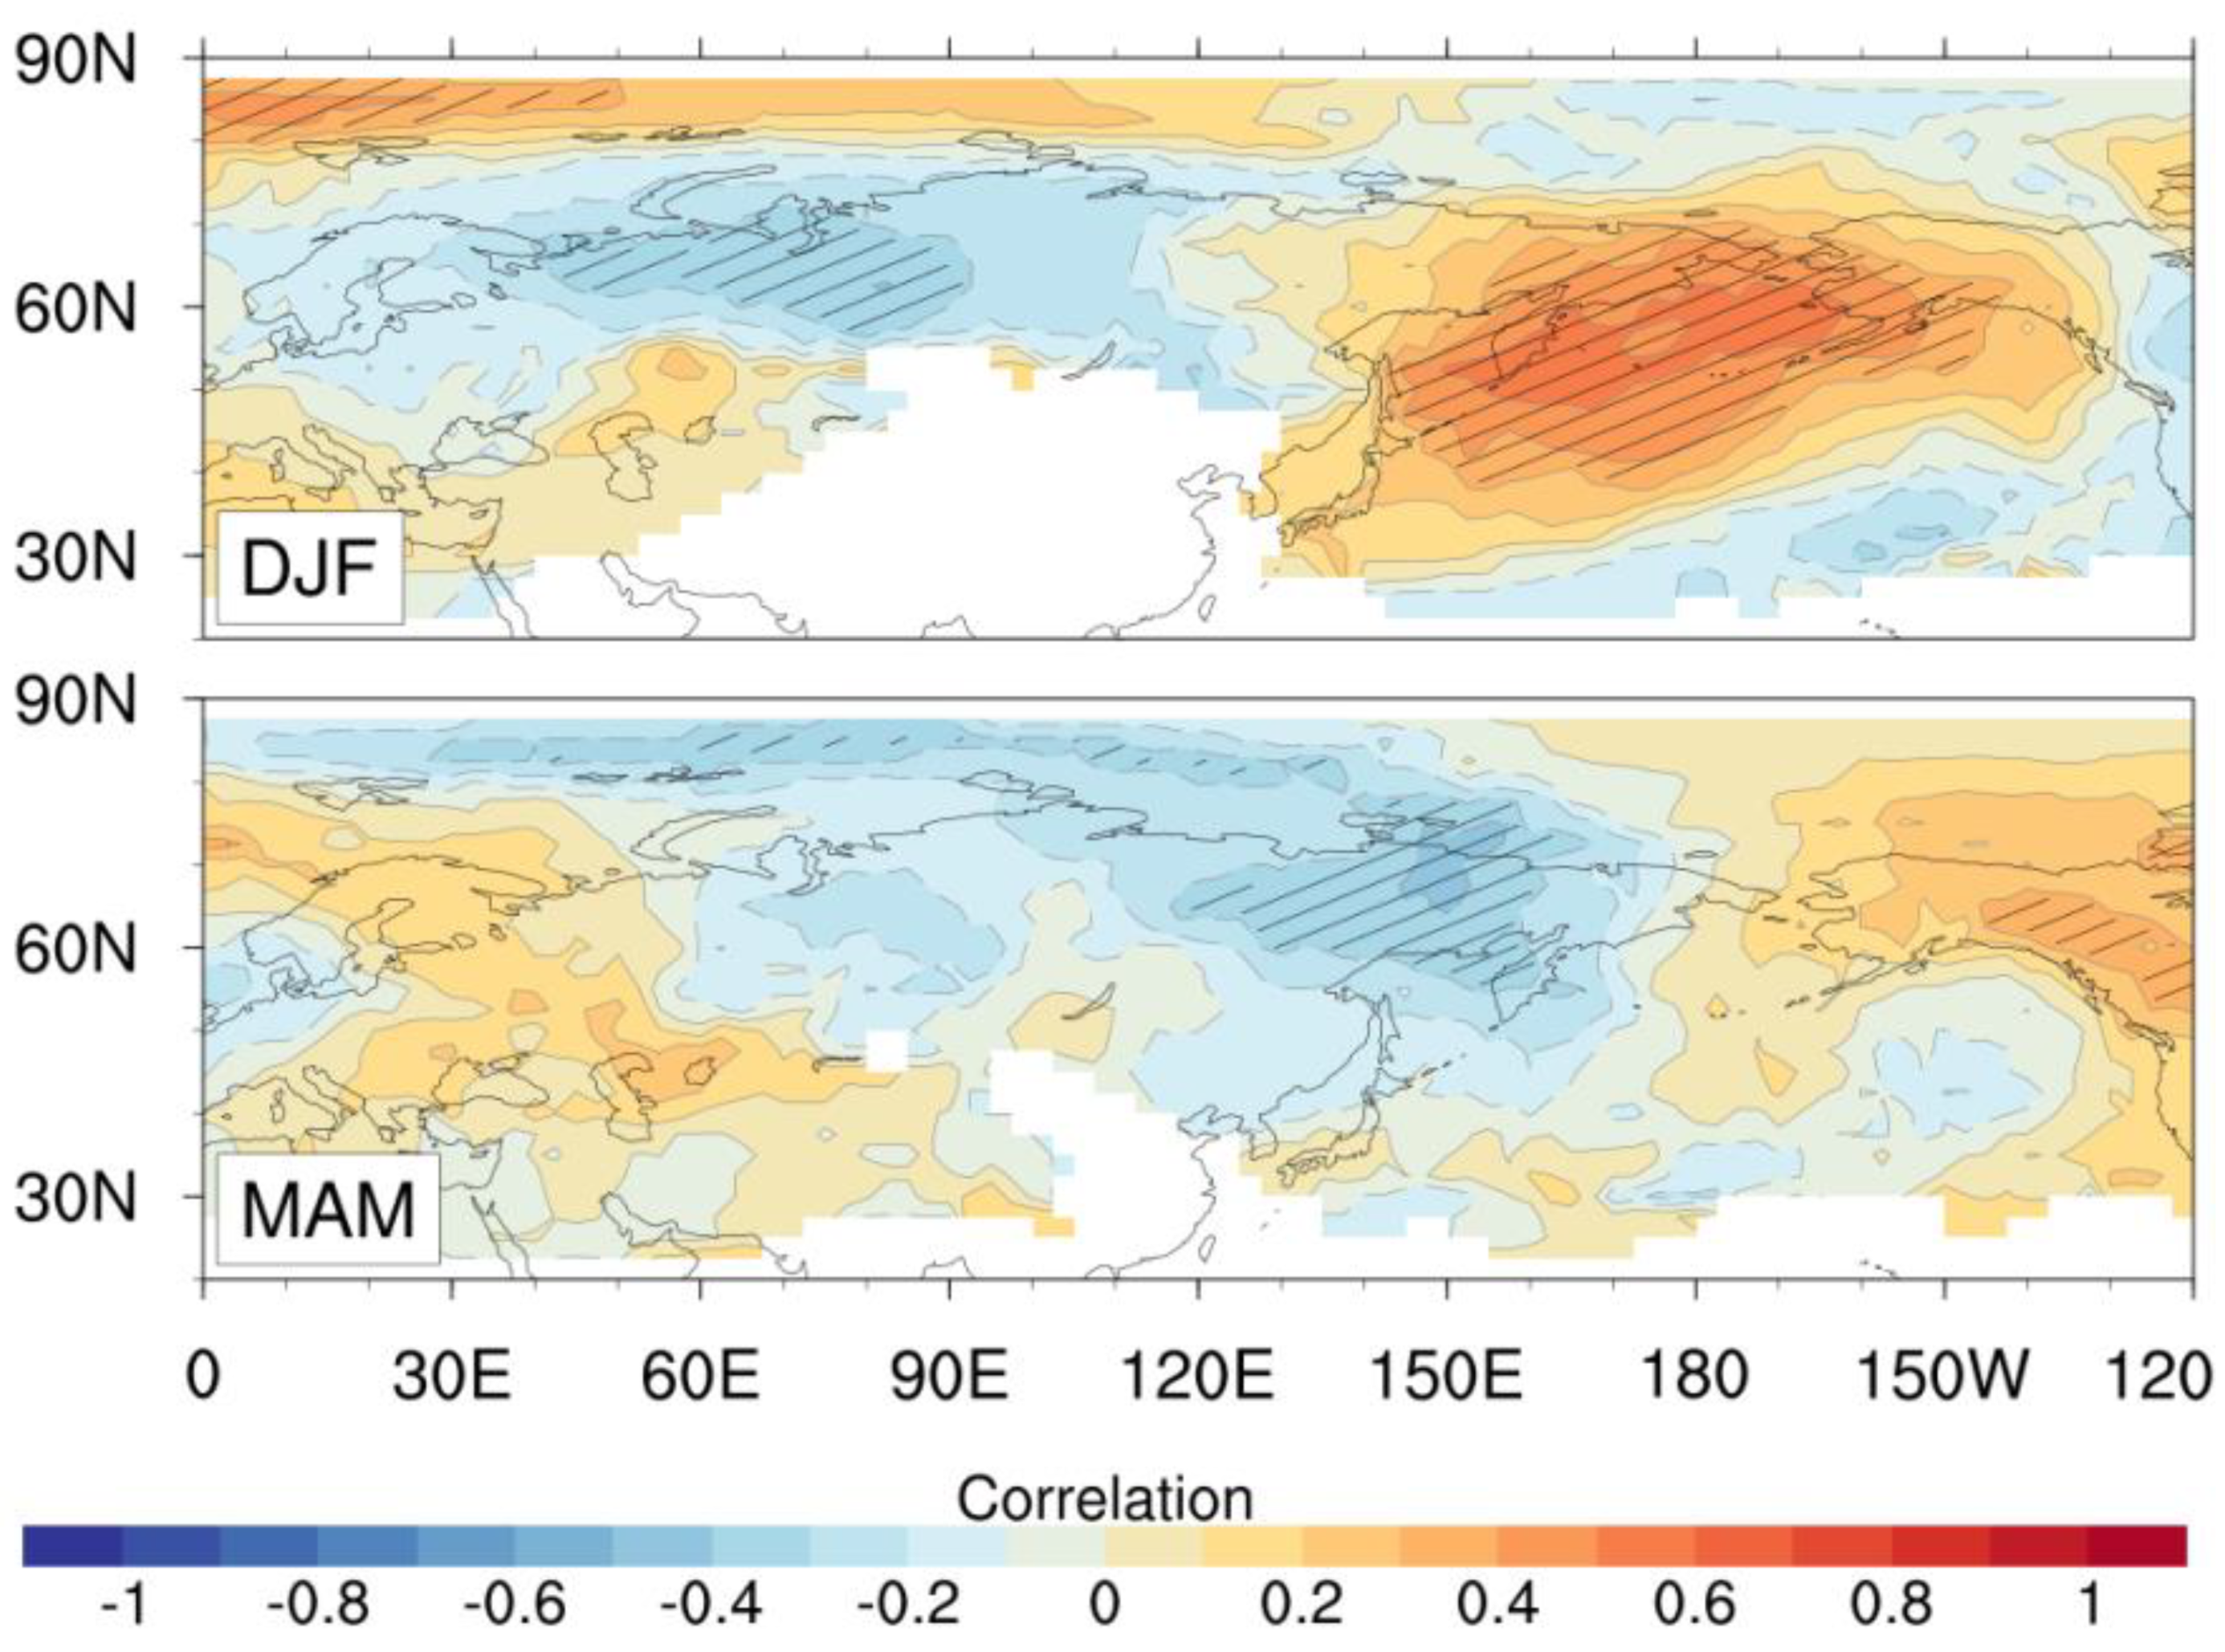
Figure 3 displays a seasonal Pearson correlation map between the monthly blocking frequency and the frequency of the monthly occurrence of high PM10 concentration events in Korea. The monthly blocking frequency is calculated by counting how many days of blocking were detected each month at each grid point. The white area with no value on the map is an area where no blocking occurred during the study period. The linear trend and monthly mean are removed from both the monthly blocking frequency and monthly frequency of high PM10 events. When the same test is carried out without removing the linear trends and monthly mean, the values are shown to be approximately 0.1 lower in the North Pacific, but the differences in other areas are small.
In winter, positive and significant correlations between the North Pacific blocking and the nationwide fine dust pollution in South Korea are found (Figure 3, top panel). There are positive correlations values of 0.3 to 0.6 in the North Pacific, including the Korean Peninsula. In addition, there are negative correlations of −0.2 to −0.4 in northern Eurasia (50–80° N, 30–120° E). Blocking in the eastern part of the Ural region (60–90° E), which is known to affect cold waves in Korea, shows high negative values. Correlations between the Ural region, the central Pacific, and the Korean Peninsula exceed the 95% confidence level, showing high reliability. These results suggest that in winter, there were frequent high PM10 events in the months when there were frequent blockings in the Pacific Ocean, while in the months when there were frequent blockings in Ural, there were fewer high PM10 events in Korea.
In spring, negative correlations are apparent near the Kamchatka Peninsula (70° N, 150° E). However, the values are smaller than those in winter. The difference between the correlation patterns for winter and spring suggests that the impact and/or importance of blocking on the high PM10 events may vary by seasons. To address this, we next examine atmospheric fields associated with the high PM10 events.
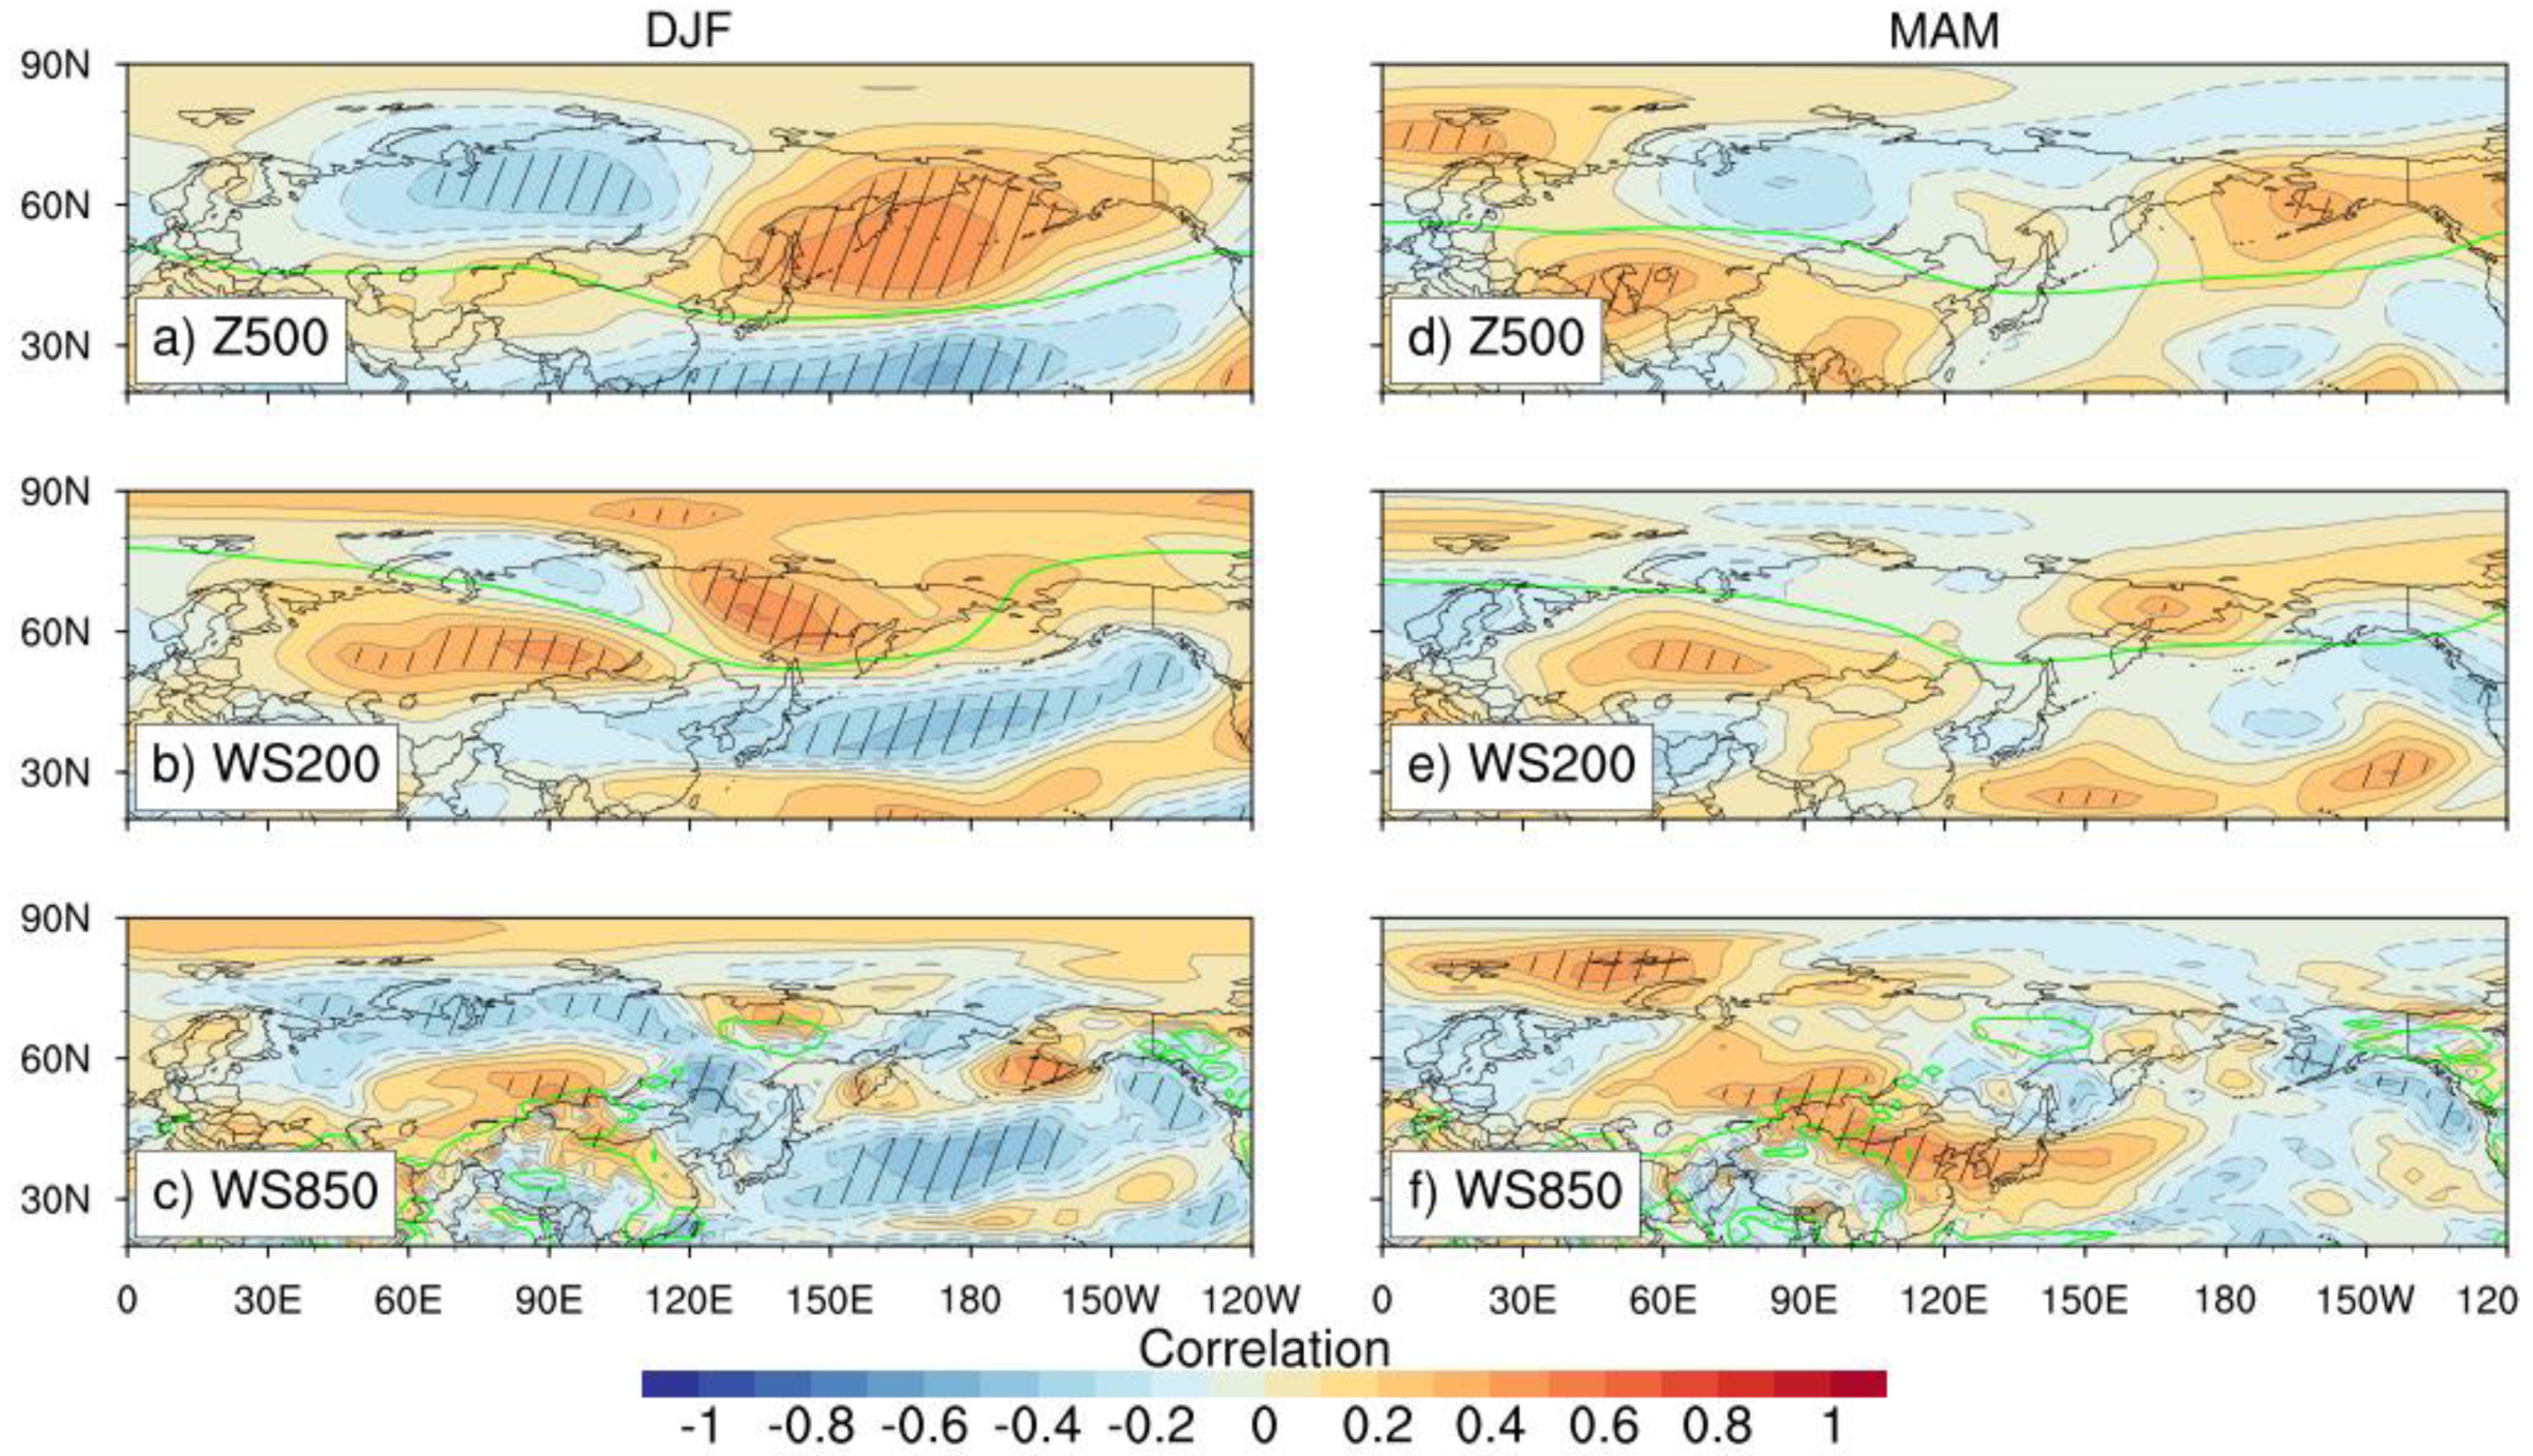
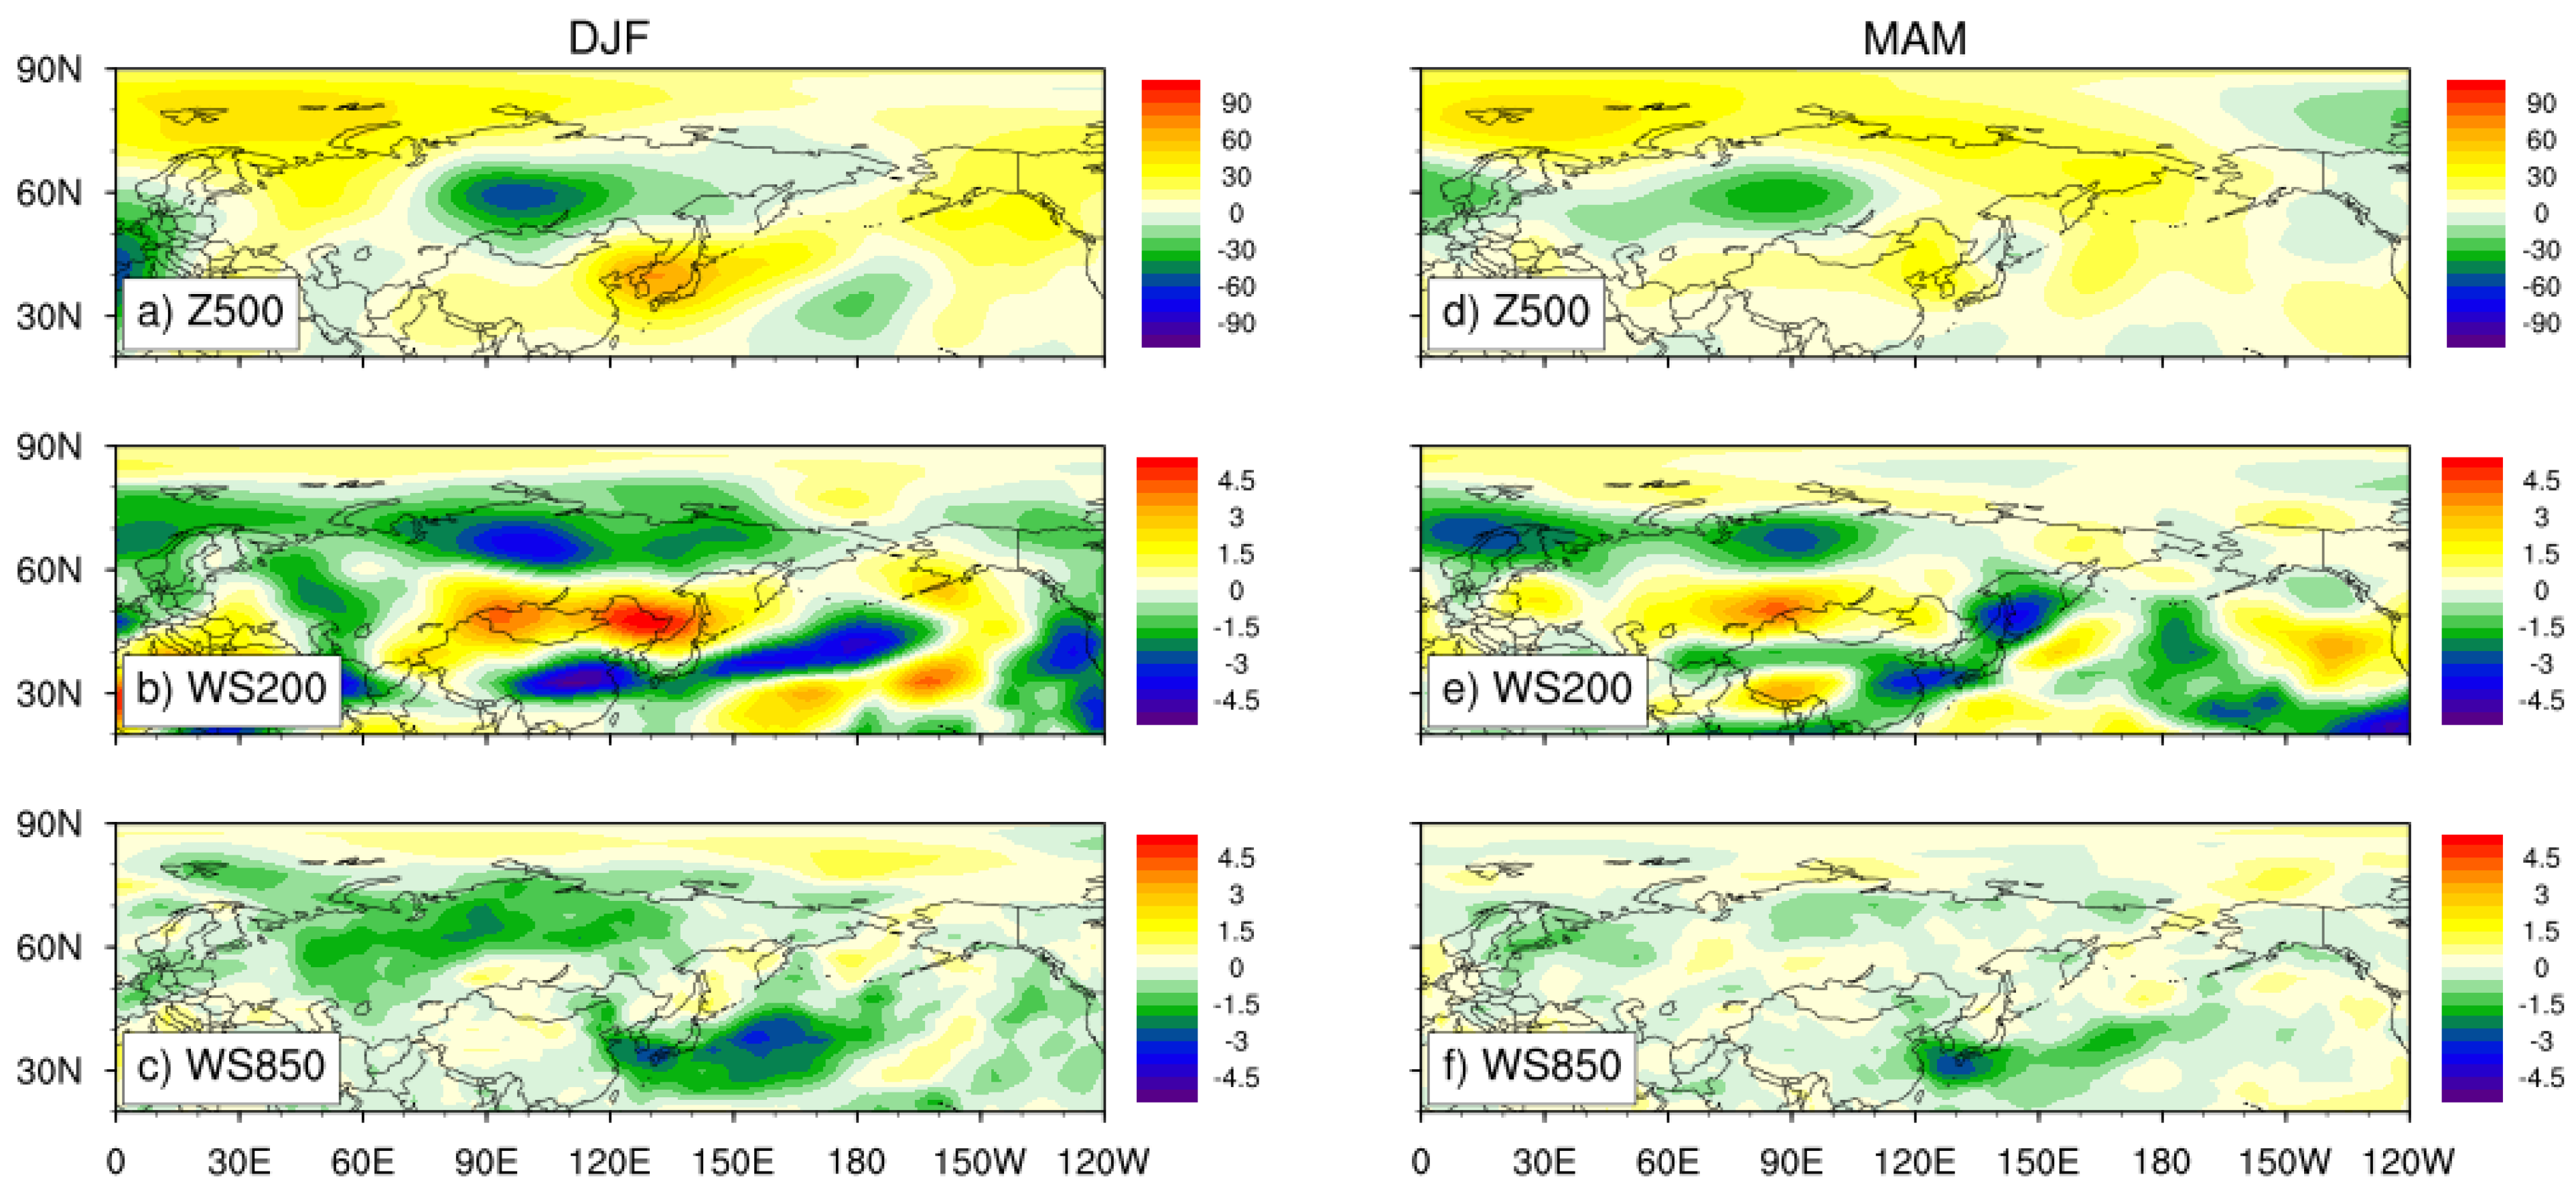
In Figure 4, to investigate the atmospheric circulation pattern when the high concentration event occurred, the correlation between the monthly anomalies in the 500 hPa geopotential height, 850 hPa wind speed, and in the 200 hPa wind speed and the monthly frequencies of the high PM10 events were identified. The seasonal cycle and the linear trend were eliminated from both the event frequency and the atmospheric variable anomaly. But the results are almost the same when the was test carried out without the removal of the seasonal cycle and trend.
Winter features are consistent with the preceding research by Lee et al. [5] and Lee et al. [24], whereas for spring, despite the same high PM10 event, the agreement with the previous studies is poor. For instance, the 500 hPa geopotential height anomaly has a high correlation of 0.2 to 0.5 from 60° E–150° W, including the Korean Peninsula (Figure 4a). There is also a strong negative correlation of −0.2 to −0.5 in Siberia (50–80° N, 30–120° E). On the other hand, in spring (Figure 4d), negative correlations of −0.3 to −0.4 are observed along the Far East Asia coast and in Siberia, and positive correlations with similar amounts of intensity in western China (20–50° N, 30–100° E). Except for the northern and central regions of China (30–45° N, 90–110° E), the 850 hPa wind speed is dominated by negative correlations throughout Eurasia and the Pacific region (Figure 4c). In spring, however, the midlatitudes show a positive correlation from the interior of Eurasia to the western Pacific, especially in the Chinese coastal region having a very high correlation of 0.5 to 0.6 (Figure 4f). The 200 hPa wind speed anomaly has negative correlations both in spring and winter in Pacific and Korea, while the inland areas, including northwest of Mongolia (40–50° N, 90–120° E), have positive correlations. In winter, China (at 40° N), the Korean Peninsula, and the Pacific Ocean are characterized by a negative correlation of −0.2 to −0.4 (Figure 4b). However, in spring, the northern part of the Korean Peninsula and the Pacific Ocean are associated with a weak and negative correlation of −0.1 to −0.2, and the entire Eurasian continent and south of Korea has a positive correlation of 0.2 to 0.4 (Figure 4e).
In Korea, when high PM10 events occur, the atmospheric fields, in winter, showing high pressure, and upper and lower wind speeds are weak, consistent with Figure 3 of Lee et al. [5]. Such weather systems form an environment favoring transport of PM10 from outside or accumulation of PM10 in the country. In addition, the low pressure system in Siberia increases the frequency of dust storms in the desert. Moreover, the west wind is strengthened by the low pressure system over Siberia and the high pressure system in the Pacific Ocean, which transports desert dust to the Far East Asia [24]. Enhanced 200 hPa wind speeds near the northwest of Mongolia are shown in Figure 4.
An analysis by Lee et al. [5] reported that high concentration events take place through the accumulation of contaminants and congestion when domestic wind speed weakens. However, the impact of domestic wind speed on PM10 in spring and winter shown in Figure 4 is the opposite. In winter, strong wind speed causes high PM10 events, while in spring, weak wind speed leads to a similar effect. Considering these differences, the effects of blocking were investigated in more detail showning that the blocking effect on high PM10 events is stronger for a weak average wind speed in Korea.
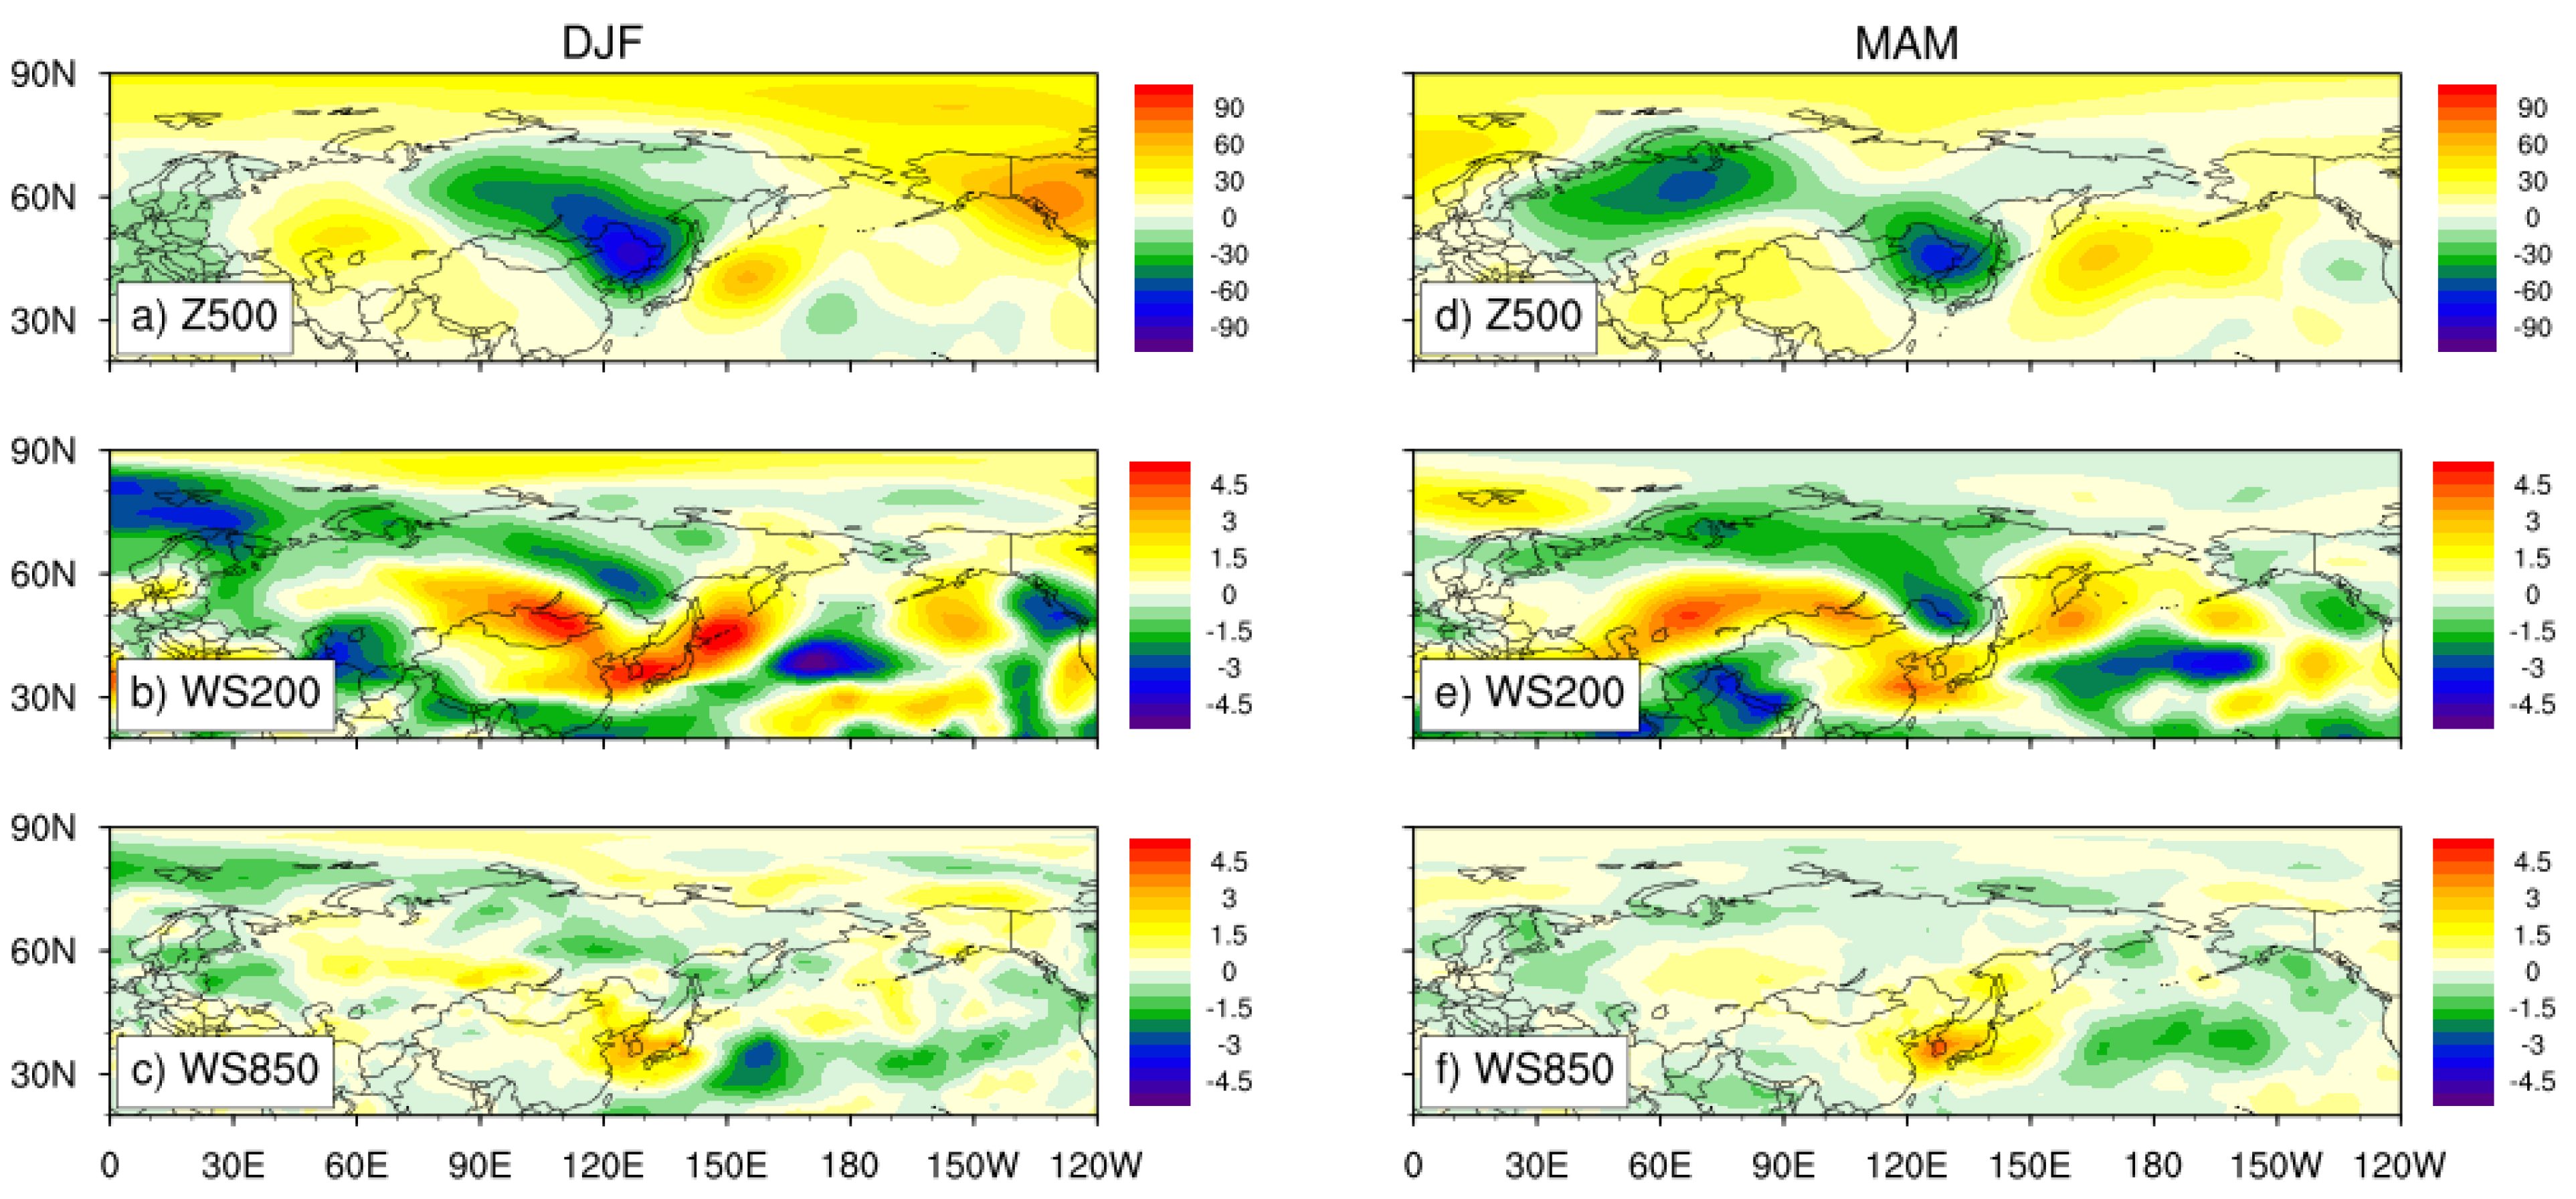
In order to investigate the differences between strong wind speed events and weak wind speed events in association with high PM10 events, Figure 5 and Figure 6 illustrate 500 hPa geopotential height, 850 hPa and 200 hPa wind speed daily anomalies for both event types. The two event types were defined by classifying high PM10 events into groups with negative (−WS850 events; Figure 5) or positive (+WS850 events; Figure 6) average 850 hPa wind anomalies over Korea.
Both types of events have the opposite characteristics except for low pressure in Siberia and strong upper wind speeds in Mongolia. During the –WS850 event, independent of the season, a high pressure system is located over Korea (Figure 5), while the height anomalies during winter are stronger than those of spring. The 200 hPa wind speed anomaly is positive in the west and north of the Korean Peninsula, including the Taklamakan desert (40–45° N, 80–100° E) and Mongolia. However, over the Korean Peninsula, a negative anomaly is shown. In contrast, Korea is under the influence of a strong low pressure system located around north of the Korean Peninsula during the +WS850 event, while higher wind speeds at 200 hPa and 850 hPa pressure levels can be seen throughout the inner Mongolia and China (Figure 6). Upper wind speeds show positive values in desert areas, northern China, and the Far East Asia region, including South Korea. These characteristics are also shown in Figure 4. In other words, the features shown in Figure 4 do not appear only in certain seasons, but in both seasons. Therefore, one can conclude that the high PM10 events can occur under the influence of both low and high pressure systems. The upper and lower wind speed can be both weak (−WS850 event, Figure 5b–f) or strong (+WS850 event, Figure 6b–f). With respect to the event duration, the −WS850 events are longer than the +WS850 events (Table 1) and the −WS850 events have an average duration of 2.26 days in winter and 2.46 days in spring, while they are respectively 1.48 and 2 days for the +WS850 events. The number of cases is similar. However, for spring, the overall average concentration for the +WS850 events is 20 μg m−3 higher than for the −WS850 events.
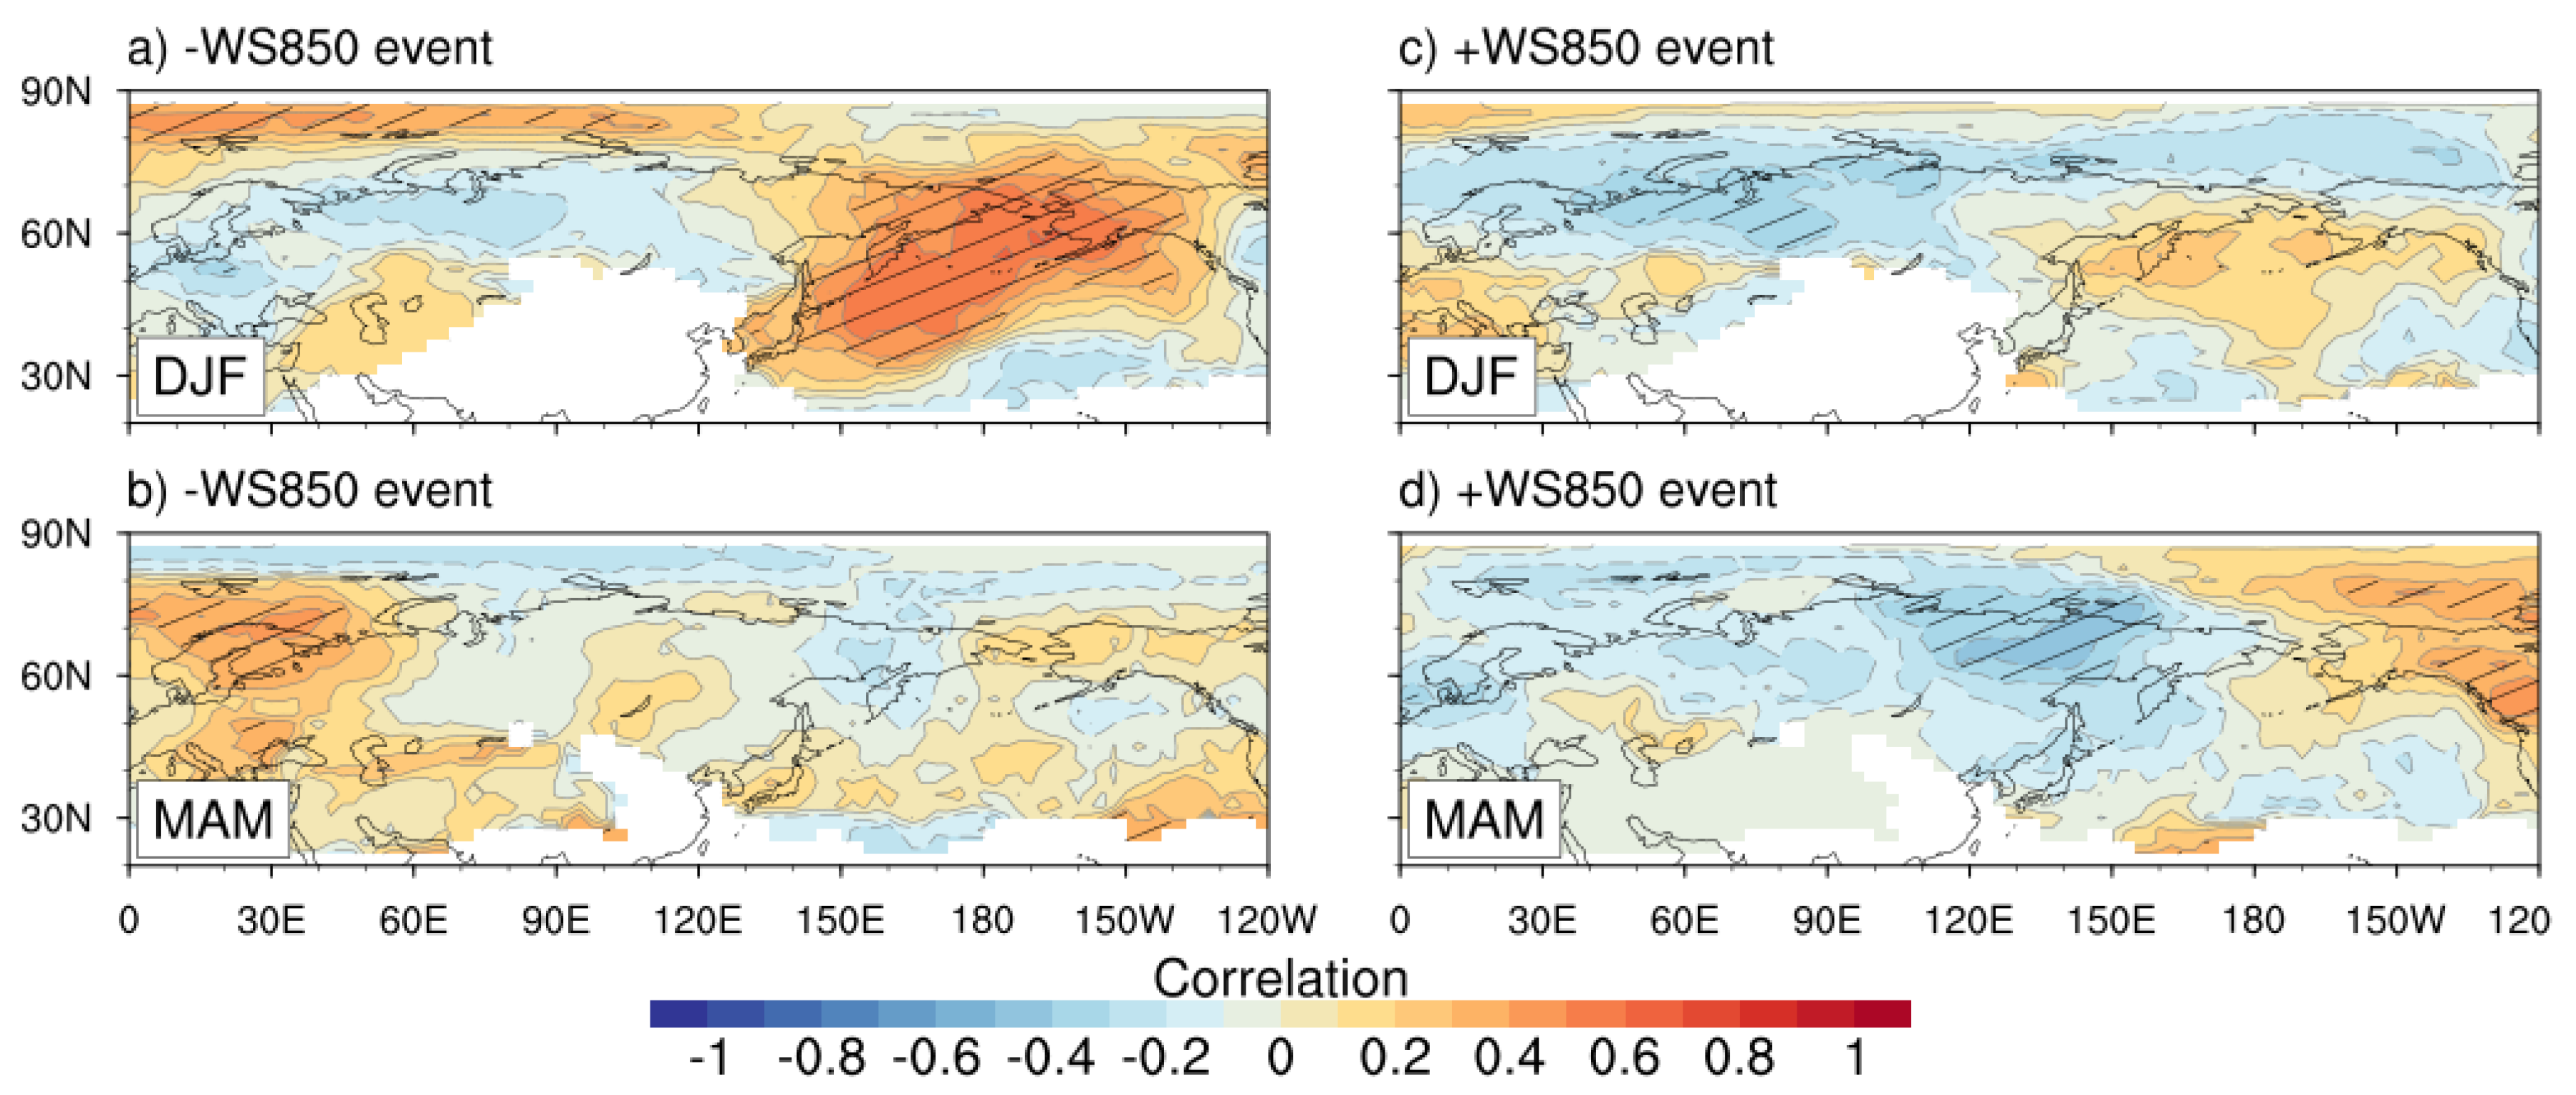
Figure 7 illustrates the correlation between the monthly frequency of +WS850 and –WS850 events and the monthly frequency of blocking. Compared to Figure 4, the −WS850 events show an increase in values along Far East Asia and the western North Pacific, especially in winter, with a correlation of more than 0.4 and a high confidence in the wide Pacific region. Ural blocking decreases its value by 0.1 (see Figure 7a) and loses its significance. Conversely, for the +WS850 events, shown in Figure 7c, the Ural region has the same value and significance as in Figure 3. In addition, Pacific blocking is associated with a positive correlation in a wide area, but with a reduction of 0.3 in correlation and with no significance. In spring, for the −WS850 events there is a correlation of 0.2 in the Far East Asia region, which is opposite to the correlation in Figure 3. However, the correlation and significance are still low. For the +WS850 events in spring, the pattern of correlation remains similar to that in Figure 3, and the values over the Kamchatka Peninsula have increased by about 0.1.

3.3. Atmospheric Conditions Associated with Blockings in Various Locations

We have demonstrated that the blocking frequency of occurrence is linked with the high PM10 event over Korea and that the atmospheric variables for the linkage involves the circulation fields. We now choose blockings over the North Pacific, Ural-Siberia, and Korea to examine its impact on the atmospheric conditions around Korea. For regions with a positive correlation greater than 0.4 and a negative correlation smaller than −0.3 in Figure 7, Pacific blocking is detected between 120° E and 180° W, Ural blocking between 80° E and 120° E, and Korea blocking near the Korean Peninsula.
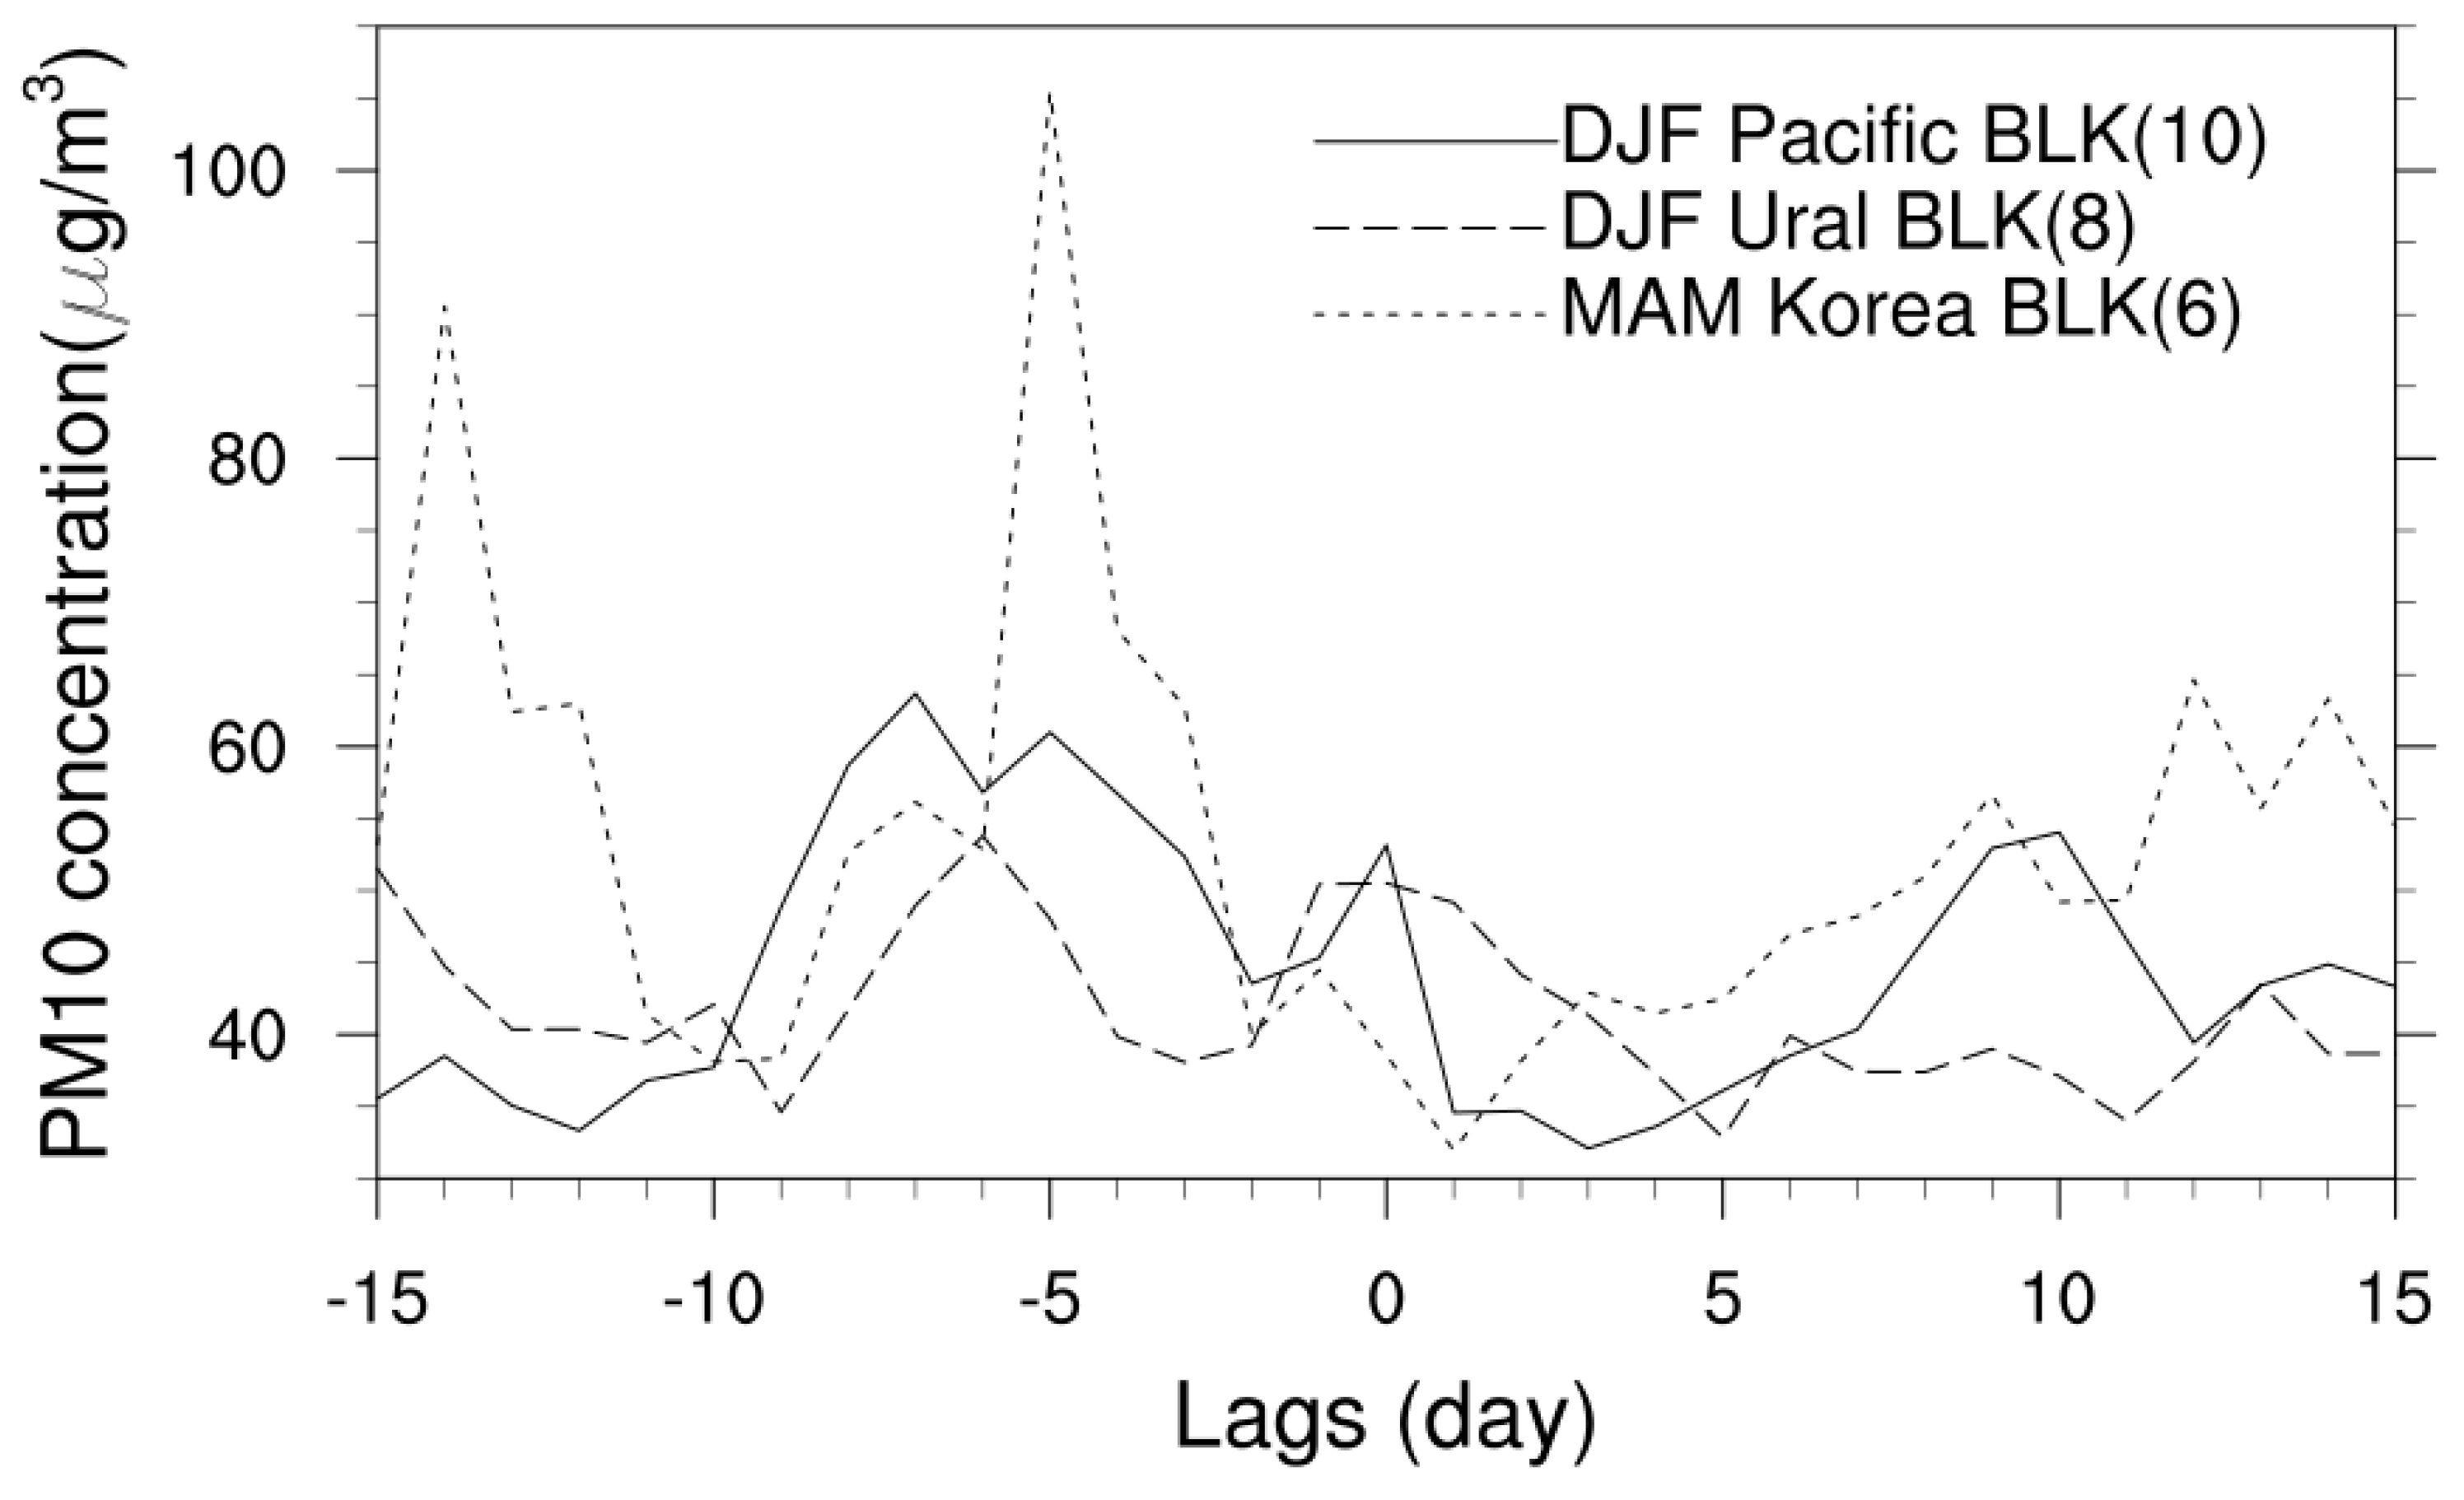
Figure 8 shows the average PM10 concentration of the targeted stations during the 15 days before and after the onset date. In our previous analysis (e.g., Figure 3), it is shown that blocking occurrence over the North Pacific increases the chances of high PM10 concentration over Korea, while blocking occurrence over Ural-Siberia decreases the concentration. When we narrow our analysis to daily evolutions associated with the blocking, we note that the blocking is one factor at synoptic or greater scales that determines the concentration of PM
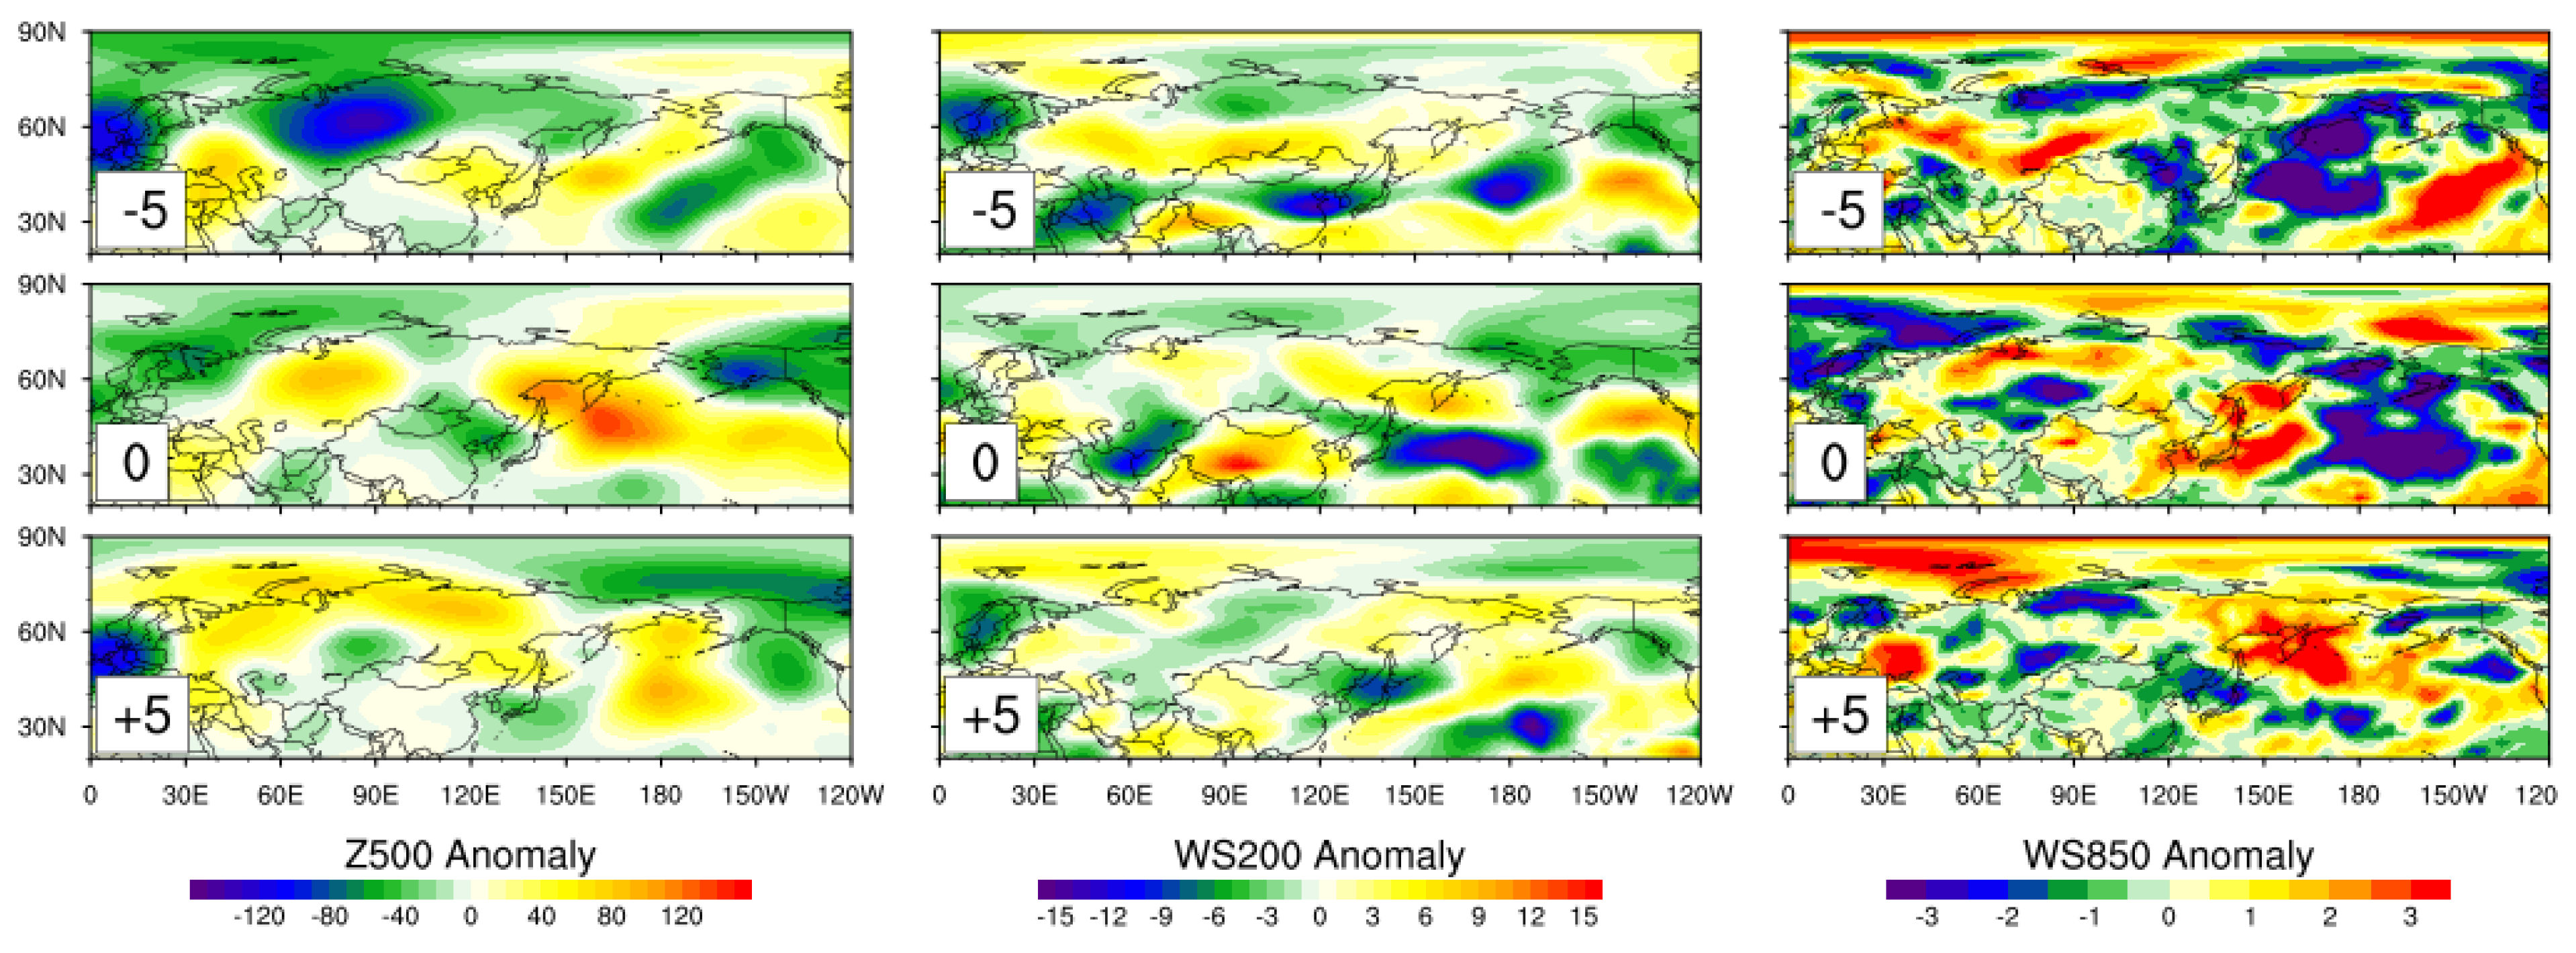
10. In the case of Pacific and Korea blocking, the concentration increases before and after blocking onset. However, the Ural-Siberia blocking shows low concentrations throughout the lags. Near the onset of the blockings, the concentration for Pacific and Korea blockings are also low, while the value shows a sign of bouncing back from about a lag of 10 days. To examine the meteorological conditions for the blockings, daily composites of 500 hPa geopotential height and 850 hPa and 200 hPa wind speeds are examined below from a lag of −5 days to +5 days for winter Pacific blocking, winter Ural blocking, and spring Korea blocking.
Before the onset of Pacific blocking (Figure 9), the pressure gradient is strengthened by having a low pressure anomaly form to the north of the desert. During this time, wind speed shows positive anomalies over northern Mongolia and China, which indicate increased chances of dust storms and long-range transport to Korea. These atmospheric fields are consistent with −WS850 events during winter (Figure 5a–c), explaining the high correlation in the North Pacific (Figure 7a). At the onset of the blocking event, a high pressure anomaly is likely to be located in Siberia, reducing chances of dust storms, as well as the wind speed over China. Over the Korean Peninsula, a positive wind speed anomaly can be seen, which suggests improved ventilation. On lag +5 days, the average PM10 concentration increases again. In addition, the wind speed anomaly over Korea shows negative values, as for that on lag −5 days. The height anomalies in the upstream region displays a positive sign over northern Mongolia and China, while a negative height anomaly is seen over Korea. We note that changes in PM10 concentration and the atmospheric fields associated with the Pacific blocking of spring resemble that of the Pacific blocking of winter (not shown).
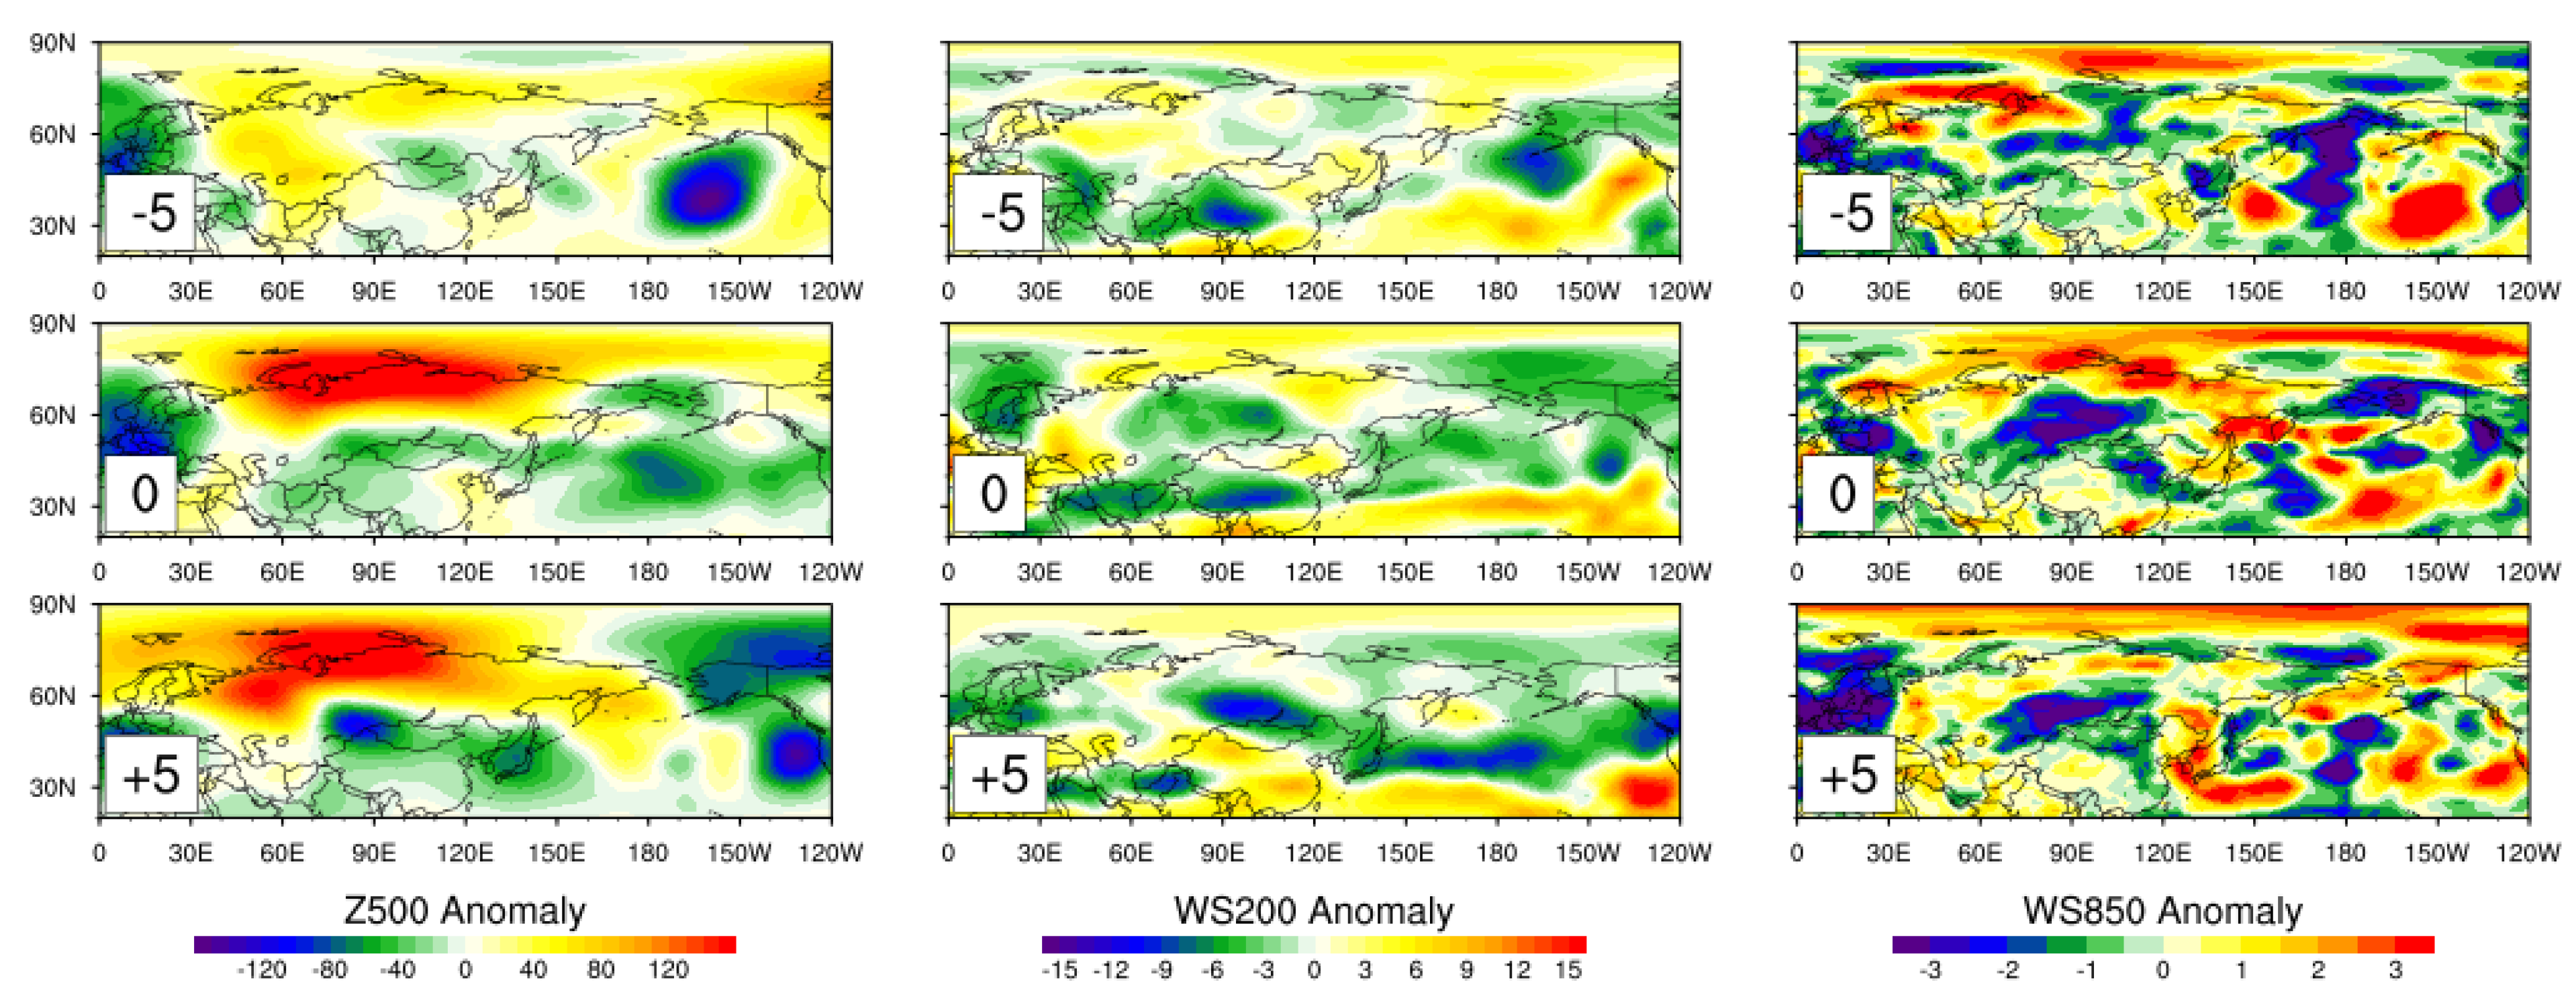
In contrast, for Ural Blocking during winter (Figure 10), we observe that a high (low) height anomaly forms in Ural and Siberia (Mongolia and China) during the onset. This anomaly field weakens the north-south gradient of total height field, thereby reducing the zonal wind speed at both upper and lower troposphere over northern Mongolia and China and chances of dust storms. This contributes to a decrease in chances of long-distance transportation of fine dust from outside. Interestingly, despite the low PM10 concentration throughout the lags, wind speed shows a negative anomaly over Korea. This is, however, consistent with the results in Figure 7 that the negative correlation between Ural-Siberia blocking and the high PM10 concentration event strengthens for the +WS850 events.
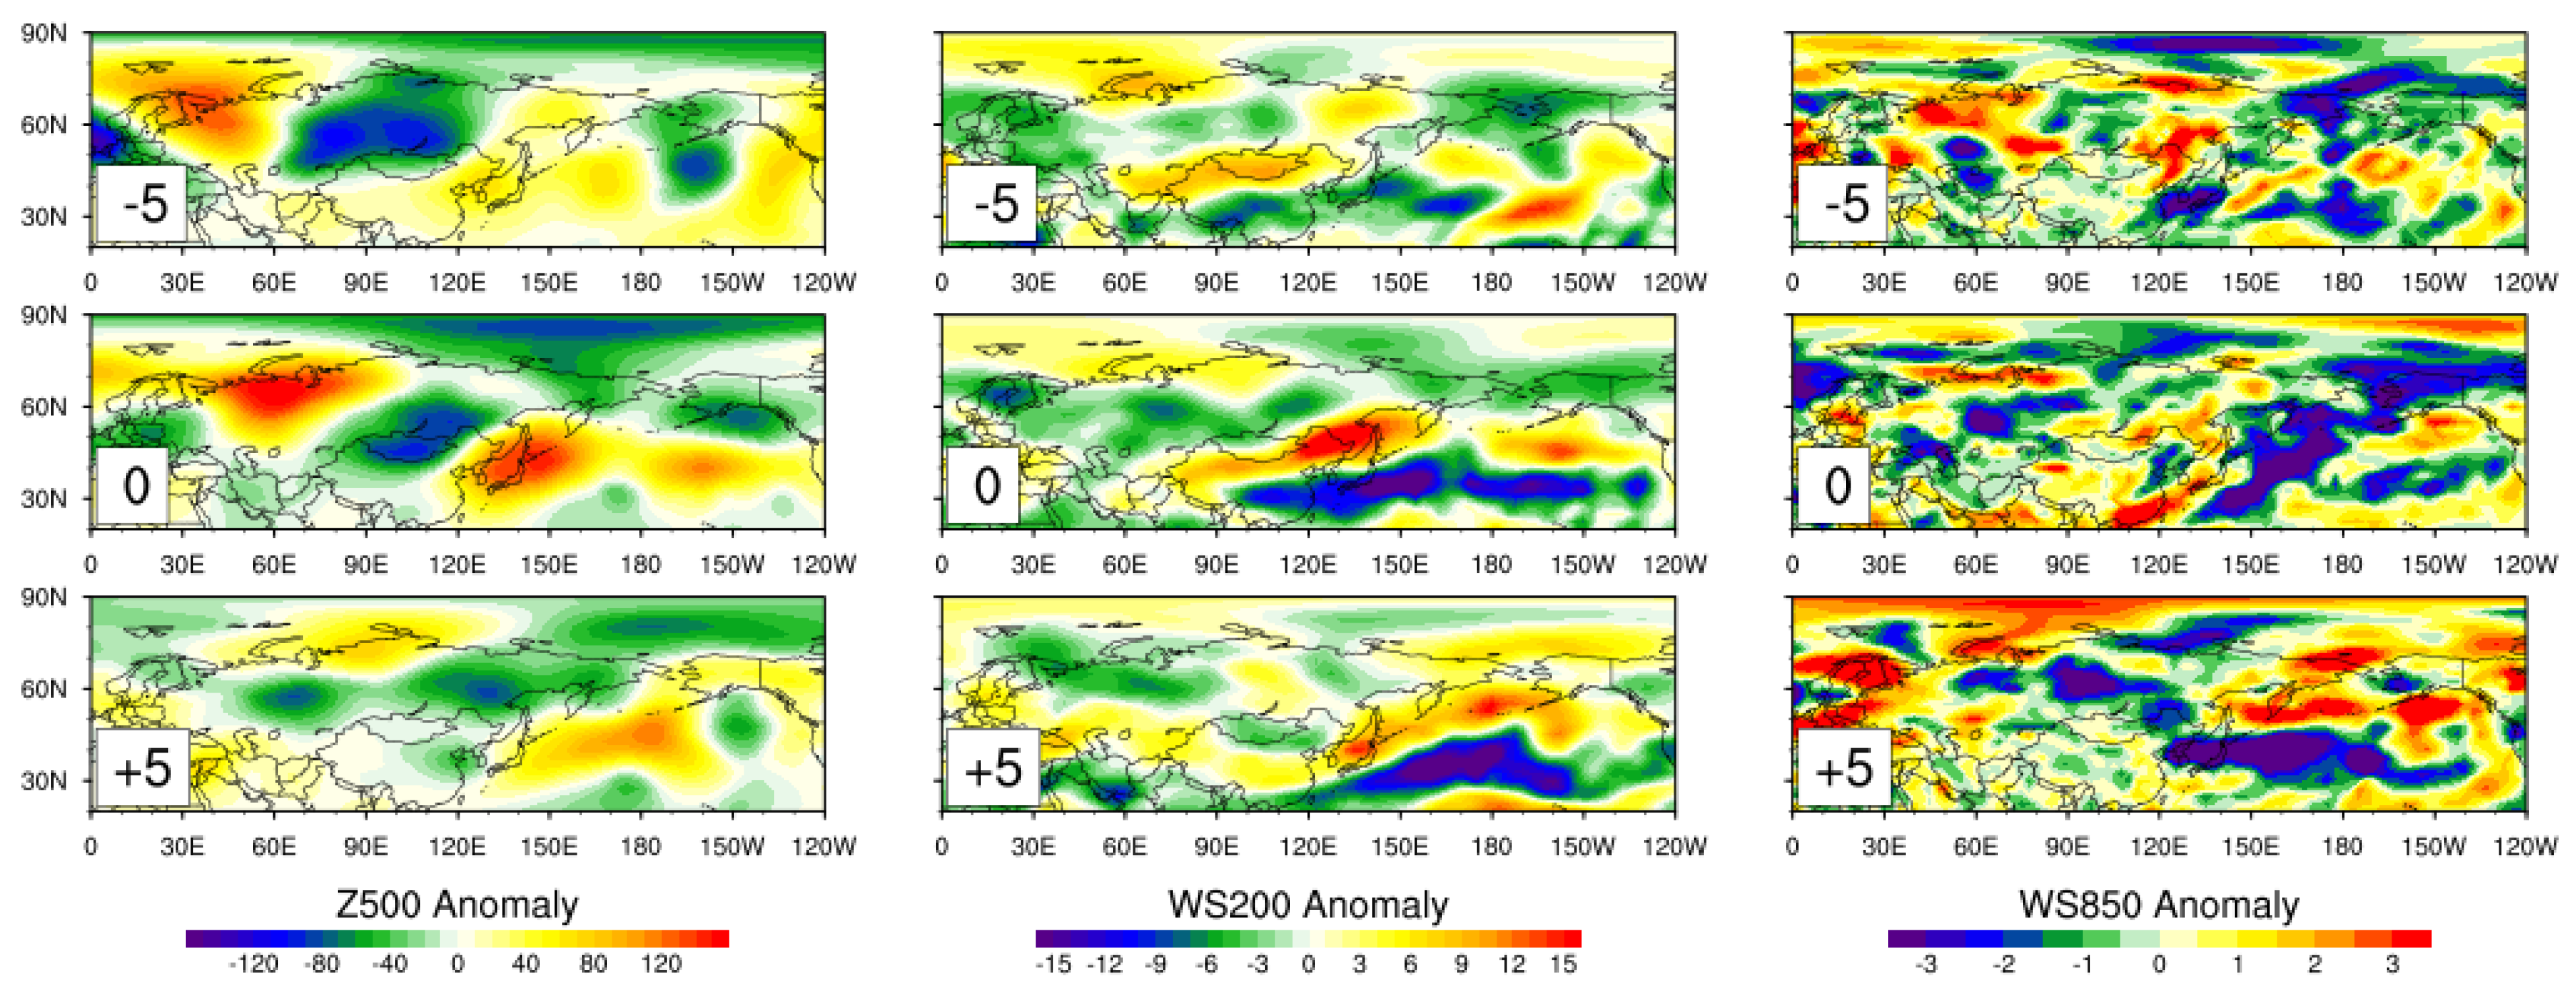
Lastly, in the case of Korea blocking (Figure 11), a wave train-type air pressure field is observed similar to that for Pacific blocking. The concentration increases, similar to Pacific blocking, due to the strong low pressure in Siberia before the onset. However, it is expected that the low pressure in Siberia is distributed over the desert during the Korea blockings, which does not form a strong pressure gradient, unlike the Pacific blockings, resulting in lower concentrations in Korea.

4. Summary and Discussion

Atmospheric blockings which are assoicated with the formation of a stationary high pressure system have been known to influence weather and climate over the Korean Peninsula. In our study, we examined the relationship between the monthly frequency of blocking occurrence and the occurrence of high PM10 events. Correlation analysis demonstrated that the high PM10 event occurrence in winter is significantly linked with the blockings over North Pacific and Ural-Siberia. A positive correlation of values up to about 0.6 can be seen with the blockings over the North Pacific, while a negative correlation of about −0.4 with the ones over the Ural-Siberia region. Both values exceeded the 95% confidence level, suggesting a possible physical link between the two. During spring, the pattern in the correlation map was different from that during winter; significant negative correlation values of about −0.4 are found near the Kamchatka Peninsula. This indicates that the impact and/or importance of blocking on the high PM10 events may vary by seasons.
By examining the correlation with atmospheric circulation fields, we showed that during winter, the high PM10 event is accompanied by a high anomaly over the North Pacific and a negative anomaly over the equatorial Pacific. These two height anomalies can explain the negative zonal wind anomalies extending from the Korean Peninsula to the subtropical Pacific, which reduce ventilation of the PM10 concentration to its surrounding area. The weakening of wind speed associated with the high PM10 event is consistent with previous studies. However, during spring, a large-scale circulation field associated with the high PM10 event was not evident.
Our results pointed out that the wind speed anomaly over Korea plays an important role in detecting the large-scale circulation pattern which is associated with the high PM10 events. The wintertime linkage between the blocking occurrence frequency over the North Pacific and the high PM10 event is strengthened when the local wind speed over Korea is weaker than normal. However, it becomes insignificant for the high PM10 events with stronger than normal wind speed over Korea. This result is different from previous studies (e.g., [5]) that have emphasized the role of weakened wind speed only for increased PM10 concentration, and perhaps points out the importance of local emission versus long-range transport varying by seasons.
Moreover, the temporal development of blockings over the North Pacific, Ural-Siberia, and Korea was examined. In the case of the North Pacific and Korea blockings, before the onset, a low pressure system forms over Siberia, which can increase the amount of dust transport to Korea by strengthening the north-south pressure gradient. During the blockings of the three regions, the PM10 concentration over Korea was decreased along with the weakened pressure gradient between the deserts and Siberia. In contrast, the Ural-Siberian blocking did not show the circulation anomalies that could increase the dust transport to Korea before the onset of the blocking.
Currently, operational centers try to extend the skill of fine dust forecast. As the skill of forcasting blocking advances with the improvement of understanding on blocking dynamics and modeling, our study has implications for better predicting fine dust concentration in Korea. For example, it is known that the baroclinic synoptic-scale waves can be used as a precursor of blockings (e.g., [28]). In addition, studies have shown that blockings can be predicted 10 days in advance regarding onset, decay, duration, and intensity [29,30].

Author Contributions

Conceptualization, S.-g.Y. and C.Y.; funding acquisition, C.Y.; methodology, S.-g.Y.; visualization, S.-g.Y.; writing–original draft, S.-g.Y.; writing–review and editing, C.Y.

Funding

This research was supported by the National Research Foundation of Korea through grants 2018R1A6A1A08025520 and NRF-2019R1C1C1003161.

Conflicts of Interest

The authors declare no conflict of interest.

References

  1. Kim, Y.P. Air Pollution in Seoul Caused by aerosols. J. Korean Soc. Atmos. Environ. 2006, 5, 535–553. [Google Scholar]
  2. Kim, Y.P. Air Quality in Northeast Asia with Emphasis on China. J. Korean Soc. Atmos. Environ. 1999, 15, 211–217. [Google Scholar]
  3. Yoon, Y.; Society, K.M. On the Yellow Sand Transported to the Korean Peninsula. Asia-Pac. J. Atmos. Sci. 1990, 26, 111–120. [Google Scholar]
  4. Lee, S.H.; Kang, B.W.; Yeon, I.J.; Choi, J.R.; Park, H.P.; Park, S.C.; Lee, H.S.; Cho, B.Y. Analysis of PM2.5Case Study Burden at Chungju City. J. Korean Soc. Atmos. Environ. 2012, 28, 595–605. [Google Scholar] [CrossRef]
  5. Lee, S.; Ho, C.H.; Choi, Y.S. High-PM10 concentration episodes in Seoul, Korea: Background sources and related meteorological conditions. Atmos. Environ. 2011, 45, 7240–7247. [Google Scholar] [CrossRef]
  6. Oh, H.R.; Ho, C.H.; Kim, J.; Chen, D.; Lee, S.; Choi, Y.S.; Chang, L.S.; Song, C.K. Long-range transport of air pollutants originating in China: A possible major cause of multi-day high-PM10 episodes during cold season in Seoul, Korea. Atmos. Environ. 2015, 109, 23–30. [Google Scholar] [CrossRef]
  7. Park, S.; Shin, H. Analysis of the Factors Influencing PM2.5 in Korea: Focusing on Seasonal Factors. J. Environ. Policy Adm. 2017, 25, 227–248. [Google Scholar] [CrossRef]
  8. Schwierz, C.; Croci-Maspoli, M.; Davies, H.C. Perspicacious indicators of atmospheric blocking. Geophys. Res. Lett. 2014, 31, L06125. [Google Scholar] [CrossRef]
  9. Dole, R.M.; Gordon, N.D. Persistent Anomalies of the Extratropical Northern Hemisphere Wintertime Circulation: Geographical Distribution and Regional Persistence Characteristics. Mon. Weather Rev. 1983, 111, 1567–1586. [Google Scholar] [CrossRef] [Green Version]
  10. Tibaldi, S.; Molteni, F. On the operational predictability of blocking. Tellus A Dyn. Meteorol. Oceanogr. 1990, 42, 343–365. [Google Scholar] [CrossRef] [Green Version]
  11. Rex, D.F. Blocking action in the middle troposphere and its effect upon regional climate: I. An aerological study of blocking action. Tellus 1950, 2, 196–211. [Google Scholar] [CrossRef]
  12. Barnes, E.A.; Slingo, J.; Woollings, T. A methodology for the comparison of blocking climatologies across indices, models and climate scenarios. Clim. Dyn. 2012, 38, 2467–2481. [Google Scholar] [CrossRef]
  13. Arakawa, H. Kinematics of Meandering and Blocking Action of the Westerlies. Pap. Meteorol. Geophys. 1952, 3, 12–18. [Google Scholar] [CrossRef]
  14. Egger, J. Dynamics of blocking highs. J. Atmos. Sci. 1978, 35, 1788–1801. [Google Scholar] [CrossRef]
  15. Barriopedro, D.; García-Herrera, R.; Trigo, R.M.; Trigo, R. Application of blocking diagnosis methods to General Circulation Models. Part I: A novel detection scheme. Clim. Dyn. 2010, 35, 1373–1391. [Google Scholar] [CrossRef]
  16. Treidl, R.; Birch, E.; Sajecki, P. Blocking action in the northern hemisphere: A Climatological study. Atmos. Ocean. 1981, 19, 1–23. [Google Scholar] [CrossRef] [Green Version]
  17. Dole, R.; Hoerling, M.; Perlwitz, J.; Eischeid, J.; Pegion, P.; Zhang, T.; Quan, X.W.; Xu, T.; Murray, D. Was there a basis for anticipating the 2010 Russian heat wave? Geophys. Res. Lett. 2011, 38, L06702. [Google Scholar] [CrossRef]
  18. Park, T.W.; Ho, C.H.; Deng, Y. A synoptic and dynamical characterization of wave-train and blocking cold surge over East Asia. Clim. Dyn. 2014, 43, 753–770. [Google Scholar] [CrossRef]
  19. Yoo, Y.E.; Son, S.W.; Kim, H.S.; Jeong, J.H. Synoptic Characteristics of Cold Days over South Korea and Their Relationship with Large-Scale Climate Variability. Atmosphere 2015, 25, 435–447. [Google Scholar] [CrossRef] [Green Version]
  20. Park, Y.J.; Ahn, J.B. Characteristics of atmospheric circulation over East Asia associated with summer blocking. J. Geophys. Res. Atmos. 2014, 119, 726–738. [Google Scholar] [CrossRef]
  21. Yeh, S.W.; Won, Y.J.; Hong, J.S.; Lee, K.J.; Kwon, M.; Seo, K.H.; Ham, Y.G. The Record-Breaking Heat Wave in 2016 over South Korea and Its Physical Mechanism. Mon. Weather Rev. 2018, 146, 1463–1474. [Google Scholar] [CrossRef]
  22. Lee, Y.G.; Ho, C.H.; Kim, J.H.; Kim, J. Quiescence of Asian dust events in South Korea and Japan during 2012 spring: Dust outbreaks and transports. Atmos. Environ. 2015, 114, 92–101. [Google Scholar] [CrossRef]
  23. Ho, C.H.; Kim, J.; Gong, D.Y.; Shao, Y.; Mao, R. Influence of Arctic Oscillation on dust activity over northeast Asia. Atmos. Environ. 2010, 45, 326–337. [Google Scholar]
  24. Lee, Y.G.; Kim, J.; Ho, C.H.; An, S.I.; Cho, H.K.; Mao, R.; Tian, B.; Wu, D.; Lee, J.N.; Kalashnikova, O. The effects of ENSO under negative AO phase on spring dust activity over northern China: An observational investigation. Int. J. Climatol. 2015, 35, 935–947. [Google Scholar] [CrossRef]
  25. Dee, D.P.; Uppala, S.M.; Simmons, A.J.; Berrisford, P.; Poli, P.; Kobayashi, S.; Andrae, U.; Balmaseda, M.A.; Balsamo, G.; Bauer, P.; et al. The ERA-Interim reanalysis: Configuration and performance of the data assimilation system. Q. J. R. Meteorol. Soc. 2011, 137, 553–597. [Google Scholar] [CrossRef]
  26. Dunn-Sigouin, E.; Son, S.W.; Lin, H. Evaluation of Northern Hemisphere Blocking Climatology in the Global Environment Multiscale Model. Mon. Weather Rev. 2012, 141, 707–727. [Google Scholar] [CrossRef]
  27. Gong, B.J.; Park, P.M.; Dong, J.I. PM10 Emission Estimation from LNG G/T Power Plants and Its Important Analysis on Air Quality in Incheon Area. J. Korean Soc. Atmos. Environ. 2015, 31, 461–471. [Google Scholar] [CrossRef] [Green Version]
  28. Jiang, Z.; Wang, D. A study on precursors to blocking anomalies in climatological flows by using conditional nonlinear optimal perturbations. Q. J. R. Meteorol. Soc. 2010, 136, 1170–1180. [Google Scholar] [CrossRef]
  29. Reynolds, D.D.; Lupo, A.R.; Jensen, A.D.; Market, P.S. The Predictability of Northern Hemispheric Blocking Using an Ensemble Mean Forecast System. Proceedings 2017, 1, 87. [Google Scholar] [CrossRef]
  30. Martínez-Alvarado, O.; Maddison, J.W.; Gray, S.L.; Williams, K.D. Atmospheric blocking and upper-level Rossby-wave forecast skill dependence on model configuration. Q. J. R. Meteorol. Soc. 2018, 144, 2165–2181. [Google Scholar] [CrossRef]
Figure 1. (a,b) Seasonal mean concentrations of daily particulate matter smaller than 10 μm in diameter (PM10) for all station, and (c,d) their linear trends measured at 14 stations from 2004 to 2016 for (a,c) DJF and (b,d) MAM are shown. The trend is estimated using the linear regression coefficient of monthly PM10 concentration, and has a unit of μg m−3 per month. The size of the dot is proportional to the absolute value of the regression coefficient, with the blue having a negative value and the red having a positive value.
Atmosphere 10 00410 g001
Figure 2. Timeseries of the monthly frequency of occurrence of high PM10 events over South Korea are shown for (a) DJF and (c) MAM. The black line is the monthly frequency, the red line is also the monthly frequency but with removed monthly mean and removed linear trend. (b,d) are lagged composites of daily PM10 concentration for the high PM10 event onset at DJF and MAM.
Atmosphere 10 00410 g002
Figure 3. The correlation between the monthly frequency of high PM10 events and the monthly frequency of blocking. The contour interval is 0.1. The white area indicates that there is no blocking during the study period. The hatched pattern denotes the statistical significance at a 95% confidence level.
Atmosphere 10 00410 g003
Figure 4. The correlations between the monthly frequency of high PM10 events over South Korea and (a,d) the 500 hPa geopotential height, (b,e) the 200 hPa wind speed, and (c,f) the 850 hPa wind speed for (ac) DJF and (df) MAM. The contour interval is 0.1. Solid contours are positive, dashed contours negative. Green contours mark the climatology for each season: (a,d) 5500 m for the 500 hPa geopotential height, (b,e) 15 m s−1 for the 200 hPa wind speed, and (c,f) 5 m s−1 for the 850 hPa wind speed are shown. The hatched areas show where values exceed the 95% confidence level.
Atmosphere 10 00410 g004
Figure 5. The composite map of (a,d) 500 hPa geopotential height, (b,e) 200 hPa wind speed, (c,f) 850 hPa wind speed daily anomaly for (ac) DJF and (df) MAM when the high PM10 event takes place with a negative anomaly of the daily 850 hPa wind speed at Korea.
Atmosphere 10 00410 g005
Figure 6. The composite map of (a,d) 500 hPa geopotential height, (b,e) 200 hPa wind speed, (c,f) 850 hPa wind speed daily anomaly for (ac) DJF and (df) MAM when the high PM10 event takes place with a positive anomaly of the daily 850 hPa wind speed at Korea.
Atmosphere 10 00410 g006
Figure 7. The correlation between the monthly blocking frequency and (a,b) the −WS850 event monthly frequency or (c,d) the +WS850 event monthly frequency for (a,c) DJF and (b,d) MAM, contour interval is 0.1. The hatched pattern denotes the statistical significant at the 95% confidence level.
Atmosphere 10 00410 g007
Figure 8. Timeseries of the daily PM10 concentration relative to the onset of (solid line) winter Pacific blocking, (dashed line) winter Ural blocking, (dotted line) spring Korea blocking. The number in parentheses is the number of cases.
Atmosphere 10 00410 g008
Figure 9. Lagged composites of (left) the 500 hPa geopotential height, (middle) 200 hPa wind speed, (right) 850 hPa wind speed anomaly for winter Pacific blocking at lag −5, 0, and +5 days.
Atmosphere 10 00410 g009
Figure 10. As for Figure 9, except for winter Ural blocking.
Atmosphere 10 00410 g010
Figure 11. As for Figure 9, except for spring Korea blocking.
Atmosphere 10 00410 g011
Table 1. The number of cases, total event days, and average concentration during −WS850 and +WS850 events in association with high PM10 events.
High PM10 EventsSeasonsNumber of CasesTotal Event DaysAverage Concentration (µg m−3)
−WS850 eventDJF418587.82
MAM5512886.62
+WS850 eventDJF325095.31
MAM65129107.1

