Article

Comparison Analysis of Total Precipitable Water of Satellite-Borne Microwave Radiometer Retrievals and Island Radiosondes

1
College of Meteorology and Oceanography, National University of Defense Technology, Nanjing 211101, China
2
Xichang Satellite Launch Center, Xichang 210007, China
*
Author to whom correspondence should be addressed.
Atmosphere 2019, 10(7), 390; https://doi.org/10.3390/atmos10070390
Submission received: 18 June 2019 / Revised: 6 July 2019 / Accepted: 8 July 2019 / Published: 12 July 2019

Abstract

:
Total precipitable water (TPW) of satellite-borne microwave radiometer retrievals is compared with the data that were collected from 49 island radiosonde stations for the period 2007–2015. Great consistency was found between TPW measurements made by radiosonde and eight satellite-borne microwave radiometers, including SSMI-F13, SSMI-F14, SSMIS-F16, SSMIS-F17, AMSR-E, AMSR-2, GMI, and WindSat. Mean values of the TPW differences for eight satellites ranged from −0.51 to 0.38mm, both root mean square errors and standard deviations were around 3mm, and all of the correlation coefficients between satellite TPW retrievals and radiosonde TPW for each satellite can reach 0.99. Subsequently, an analysis of the comparison results was conducted, which revealed three problems in the satellite TPW retrieval and two problems in radiosonde data. For TPW retrievals of satellite, when the values are above 60 mm, the precision of TPW retrieval significantly decreases with a distinct dry bias, which can reach 4 mm; additionally, abias related to wind speed and the uncertainty with the TPW retrieval in the presence of rain, which is stronger than 1mm/h, was found. The TPW measurements of radiosonde made by the type of IM-MK3 from India were quite unreliable, and almost all of the radiosonde data during the daytime were plagued by a dry bias.

1. Introduction

Water vapor plays an important role in atmospheric radiation, the hydrological cycle, and in understanding the global climate change [1]. Many studies analyzed the relationship between the variation of water vapor and the global climate change [2,3,4]. However, it is challenging for researchers to acquire water vapor measurements in a consistent and homogeneous manner because of the variation of measurement characteristic of different pieces of equipment [5].
There are three primary methods for total precipitable water (TPW) measurements: remote sensing based on ground [6,7,8,9,10,11,12,13,14], satellite remote sensing [5,15,16,17,18,19], and in situ [20,21]. Satellite remote sensing is an important tool for TPW measurements, and it can provide a much larger area of observation than in situ measurements. The global and large area TPW measurements by satellite can provide scientists and forecasters with vital information to understand and study global weather and climate change. In addition, information of water vapor is also included in all kinds of reanalysis data [22,23].
TPW measurements have been made by the satellite-borne microwave radiometer over the ocean for almost 25 years. It is necessary to acquire a series of satellite-borne microwave radiometer products and intercalibration among them for vapor data system establishment [24]. Intercalibration has been conducted at brightness temperature level among the oceanic products (Version 7) that were released by the remote sensing system (RSS) [25].
It is significant to intercompare independent data for error analysis and precision improvement [13]. Due to the high vertical resolution of radiosonde [5,21,26], the necessity of validation of satellite products using radiosonde data has been emphasized [17,22,27]. The comparison analysis of TPW measurements made by satellite-borne microwave radiometer and radiosonde has been found in various studies for a long time [21,27,28,29,30,31]. Most of the past efforts paid attention to a few instruments in a few months. RSS has already released TPW products of a number of instruments, such as SSM/I series, SSMI/S series, AMSR series, GMI, and WindSat, most of which have not been directly compared with radiosonde data. For this reason, it is crucial to make an overall comparison between the vapor products that were released by RSS and radiosonde data.
In our study, we compared the TPW products released by RSS from June 2007 to December 2015 with radiosonde data of nearly 150,000 soundings. All of the data are introduced in Section 2, and the methods of data matching and elevation correction are also described there. The results of comparison are presented in Section 3, and Section 4 presents the discussion. Finally, we present the conclusions in Section 5.

2. Data and Methods

2.1. Radiosonde TPW

All of the radiosonde profiles were adopted from the upper-air archive of the University of Wyoming [32]. The vertical resolution of these data is about several or a dozen hundred Pascal, which is adequate for TPW calculation. Most of the radiosondes were launched twice a day. However, radiosondes at some stations were launched four times a day, and even once a day or irregularly at a few stations. The website also publicizes the TPW values that were calculated by radiosonde profiles. The calculation of TPW using a radiosonde profile was also publicized as Formula (1) on the website of the University of Wyoming:
TPW = 1 ρ g 0 p s q ( p ) d p .
Here, ρ represents the density of liquid water, g represents the acceleration of gravity, p s represents the surface pressure, and q ( p ) represents the specific humidity at the pressure level p .
We calculated some TPW measurements while using Formula (1) and compared them with the publicized TPW values on the website. We found that the publicized TPW values were consistent with the results calculated by us using Formula (1). Therefore, the TPW value that was publicized on the website is directly used in comparison with the TPW product of RSS in this article.

2.2. TPW Retrieval of Satellites

The satellite-borne microwave radiometer retrievals of TPW that were used in this article were acquired from the ocean products (Version 7) released by RSS [25]. The retrieval algorithm is based on a physical radiative transfer model (RTM), and the vapor part of the algorithm is trained by atmospheric temperature and humidity data collected from island soundings [22]. RSS only releases the retrievals of TPW over ocean for the reason that it is hard to specify the radiation and scattering of microwave over land. The TPW data were strictly selected in order to avoid the impact that was caused by equipment anomalies, land, ice, and heavy rain [22]. The TPW products that were released by RSS from 2007 to 2015 were analyzed by taking the following pieces of equipment as examples: two sets of SSM/I (F13, F14), 2 sets of SSMI/S (F16, F17), 2 sets of AMSR (AMSR-E, AMSR-2), GMI and WindSat, and the operating period of each equipment is referred in Table 1.

2.3. Data Matching Methods

The radiosonde stations that were used in the article were selected from the 56 radiosonde stations, which were mentioned in AMSR Ocean Algorithm Theoretical Basis Document for the validation of AMSR water vapor products [22].We chose the appropriate stations for our analysis under the precondition that the radiosonde releasing time and the passing time of the satellite are closer than ±3 h, and time constraint refers to the methods of Bock et al. and Wang et al. [13,31].The procedures of quality control of radiosonde data used here are referred to as the methods of Alishouse et al. and Wentz et al. [17,27].
It is necessary to conduct the pretreatment of the satellite data in order to match the two types of data in space due to the influence of microwave radiation on land. The grid data nearest to radiosonde stations were chosen as the TPW measurement value in a number of studies over the past few decades [27,28,29], but Mears et al. proposed a new method of two-dimensional linear fitting to calculate the missing data over islands [24]. The two methods in their article were compared between AMSR-2 and radiosonde, and the mean differences were both 0.31 mm, but the standard deviations were 3.45 mm and 2.96 mm, respectively, acquired by adopting the two methods, and the gap of the standard deviations was nearly 0.5 mm (10% relative to the former). It is because the values of TPW retrieval selected by the nearest principle do not describe the vapor values over the radiosonde station well. The linear fitting method decreases the affection on the overall comparison result that was caused by the individual retrieval value and it diminishes the random error that was caused by temporal and spatial mismatch. Thus, the linear fitting method proposed by Mears et al. was adopted for the pretreatment of satellite data in this article.
Forty-nine radiosonde stations that totally satisfy the time-spatial matching and quality surveillance were acquired using the linear fitting method. Figure 1 shows the spatial distribution of each radiosonde station and the sounding type adopted by each station. The table of Supplemental Materials (Table S1) describes the detailed information of each station, such as IGRA (Integrated Global Radiosonde Archive) number, name, location, altitude, and radiosonde type.

2.4. Correction for Altitude Difference

Buehler et al. pointed out that vapor density in the atmosphere decreased as exponential function approximately along with the increase of altitude, and water vapor column of low altitude obviously affected the precision of the TPW measurement [30]. The TPW value that was calculated based on radiosonde profile reflects the water vapor column of the atmosphere above the radiosonde station, while satellite TPW retrieval represents the water vapor column above the sea level, so there is a measurement difference of altitude between them. The altitude correction on satellite retrieval TPW is hereby done with an empirical correction model that was proposed by Bock et al. in order to be convenient for comparison [29]:
Δ TPW = H 1000 × 40 % × TPW
Here, ΔTPW represents the TPW correction value, H represents the altitude of radiosonde station, and TPW represents the TPW value of satellite retrieval. The corrected satellite TPW is obtained by subtracting ΔTPW from satellite TPW retrieval.
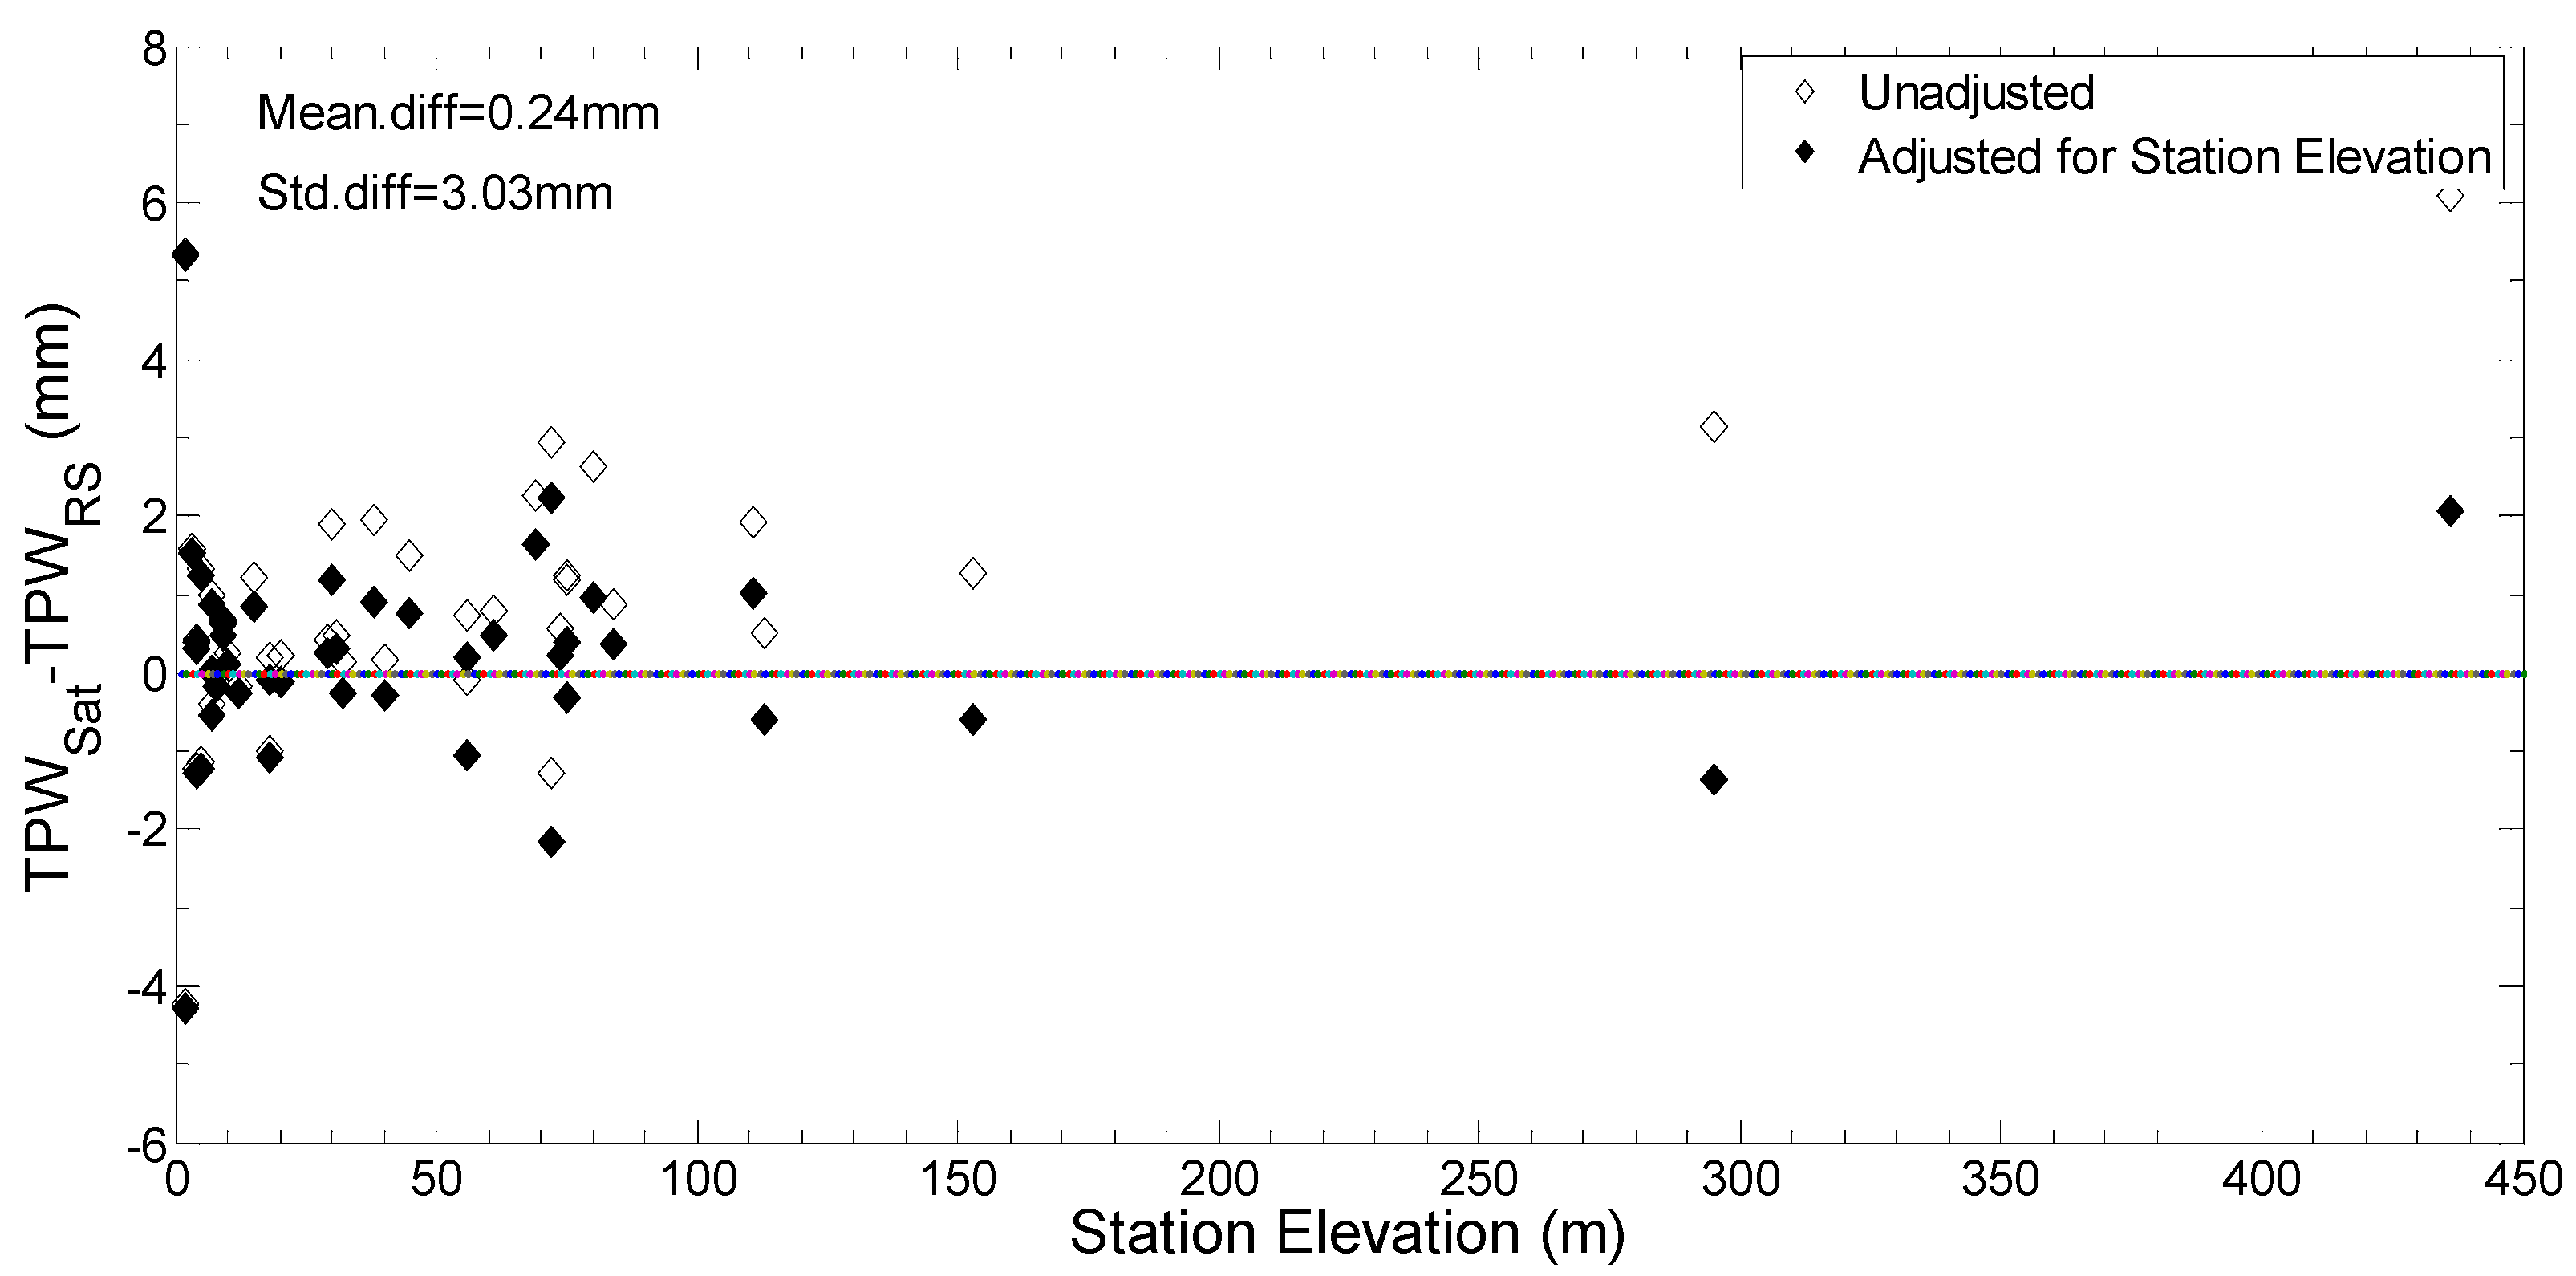
Figure 2 shows the mean differences change between AMSR-2 and radiosonde at each station before and after the altitude correction is conducted, in which the mean differences are obtained by satellite TPW retrievals minus TPW measurements of radiosonde (as the same as below). There is no significant change in mean differences after altitude correction for radiosonde stations with altitude less than 10 m, as we can see in Figure 2. However, the mean differences incur obvious changes with the increase of the altitude greater than 10 m. Nevertheless, the mean differences tend to be 0 after the altitude correction, which demonstrates the effectiveness of the altitude correction. This method also performs well for the other seven satellites (not shown here). Therefore, this method of correction was adopted for all satellite data, and the corrected data were used in our study presented below.

3. Results

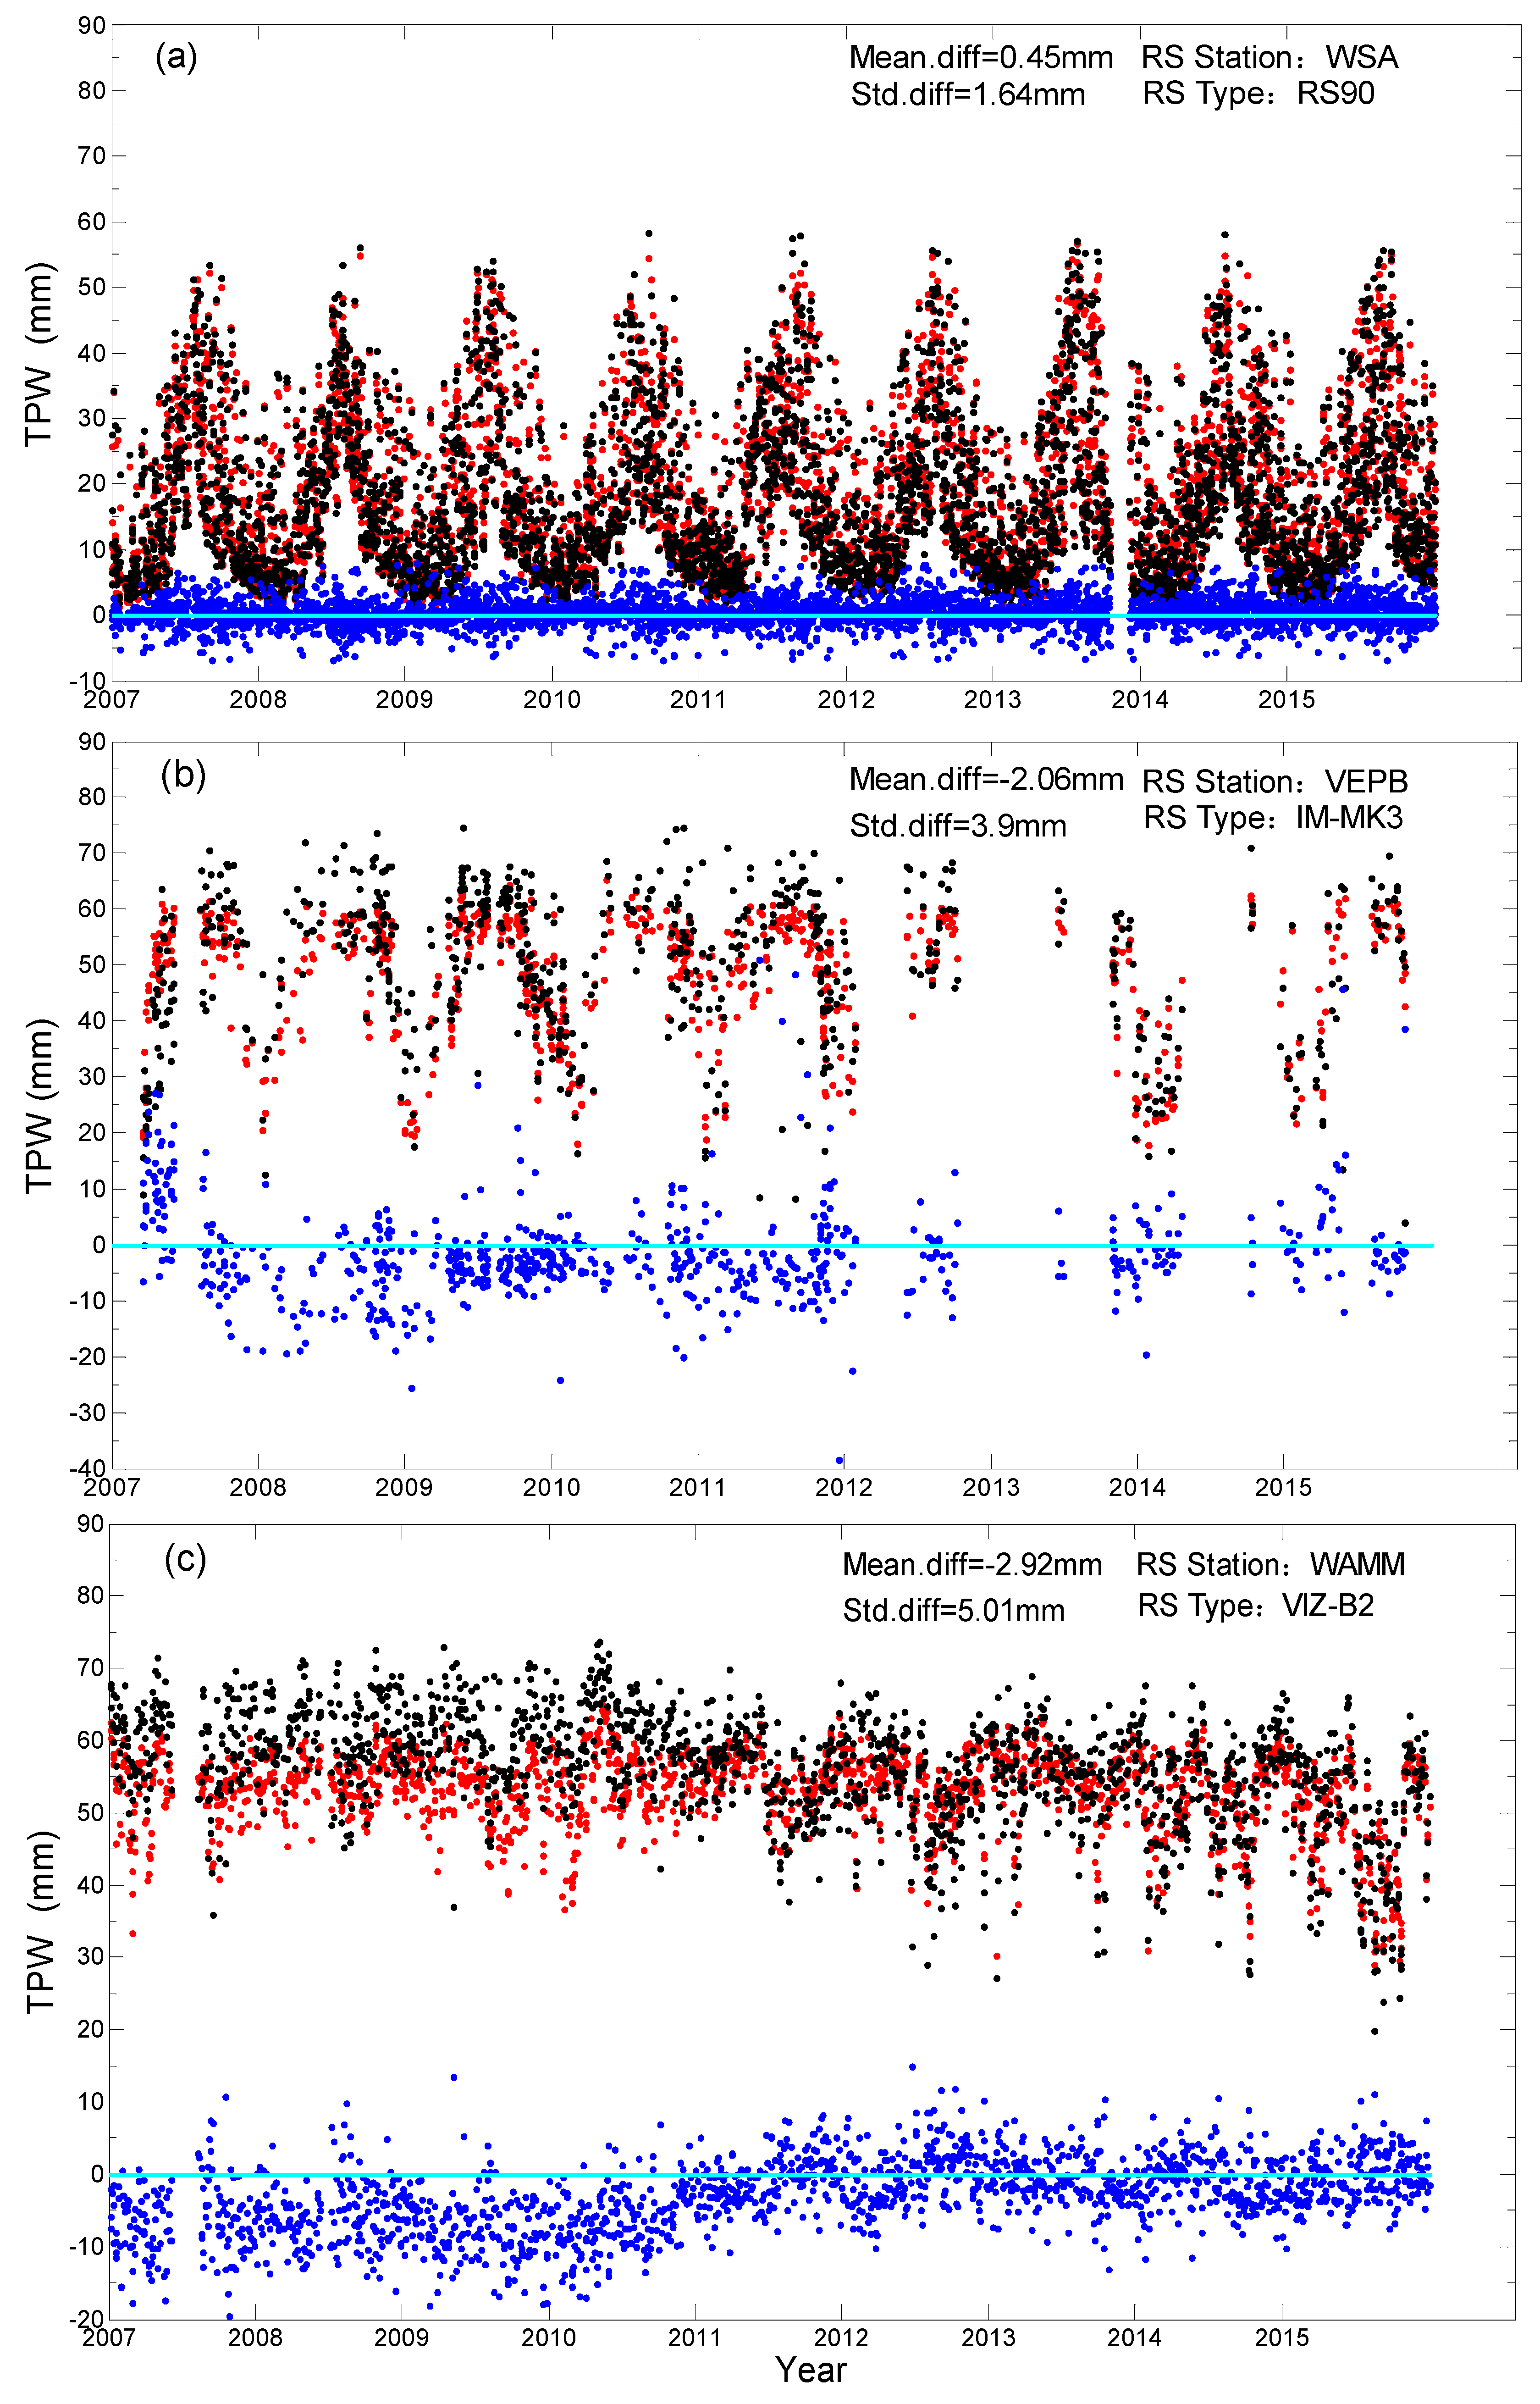
Here, we take the comparisons between WindSat and three radiosonde stations as examples to illustrate the results. Figure 3a shows the time series of WindSat TPW values, radiosonde TPW values, and their differences for the No.71600 station (Sable island). The No.71600 station (43.56°N, 299.99°E) uses the VAISALA RS90 type radiosonde, located in the East Coast of the United States, with an altitude of 4.0 m. The values of WindSat TPW retrievals and radiosonde TPW show great consistency, and both of them distinctly have a seasonal variation. The difference is evenly ranging from −5 to 5 mm. The release of radiosonde is almost simultaneous to the passing time of satellite, so the time distribution of the matching sample is relevantly consistent in the 9-year duration. The results for most stations are nearly the same.
Figure 3b shows the time series of WindSat TPW values, radiosonde TPW values, and their differences for the No.43333 station (Blair). The No.43333 station (11.4° N, 92.43° E) uses the IM-MK3 type radiosonde, located in the East Coast of India, with an altitude of 79 m. The TPW of WindSat retrieval and the TPW of radiosonde show great differences up to 40 mm. Because the sounding time of each day at this station is not uniform, the matching samples are quite rare. The standard deviation of differences at this station is 6 mm, which is much more than those of other stations, which also happens in the other two stations that adopt type IM-MK3.
Figure 3c shows the time series of the TPW of WindSat and radiosondes and their differences for the No.97014 station (Menado). Here is the information of the No.97014 station (3.95°N, 108.38°E), altitude 80 m, located in Indonesia sea area, radiosonde type VIZ-B. There is no obvious seasonal change for the TPW of WindSat and radiosonde. What interests us in Figure 3c is that the TPW values of radiosonde can be up to 70 mm, while most of the TPW values of WindSat can only reach 60 mm; it is indicated that either the TPW of WindSat or the TPW calculated by VIZ-B radiosonde profiles shows an obvious bias, and we discuss the reason in the next section. The differences appear to be distinctly continuous from the beginning of 2011. However, the No.91408 station named Palau (134.29°E, 7.20°N) in the same area shows no similar bias for the same period. Therefore, it is conjectured that it is due to the change of sounding equipment or data processing method at the station.
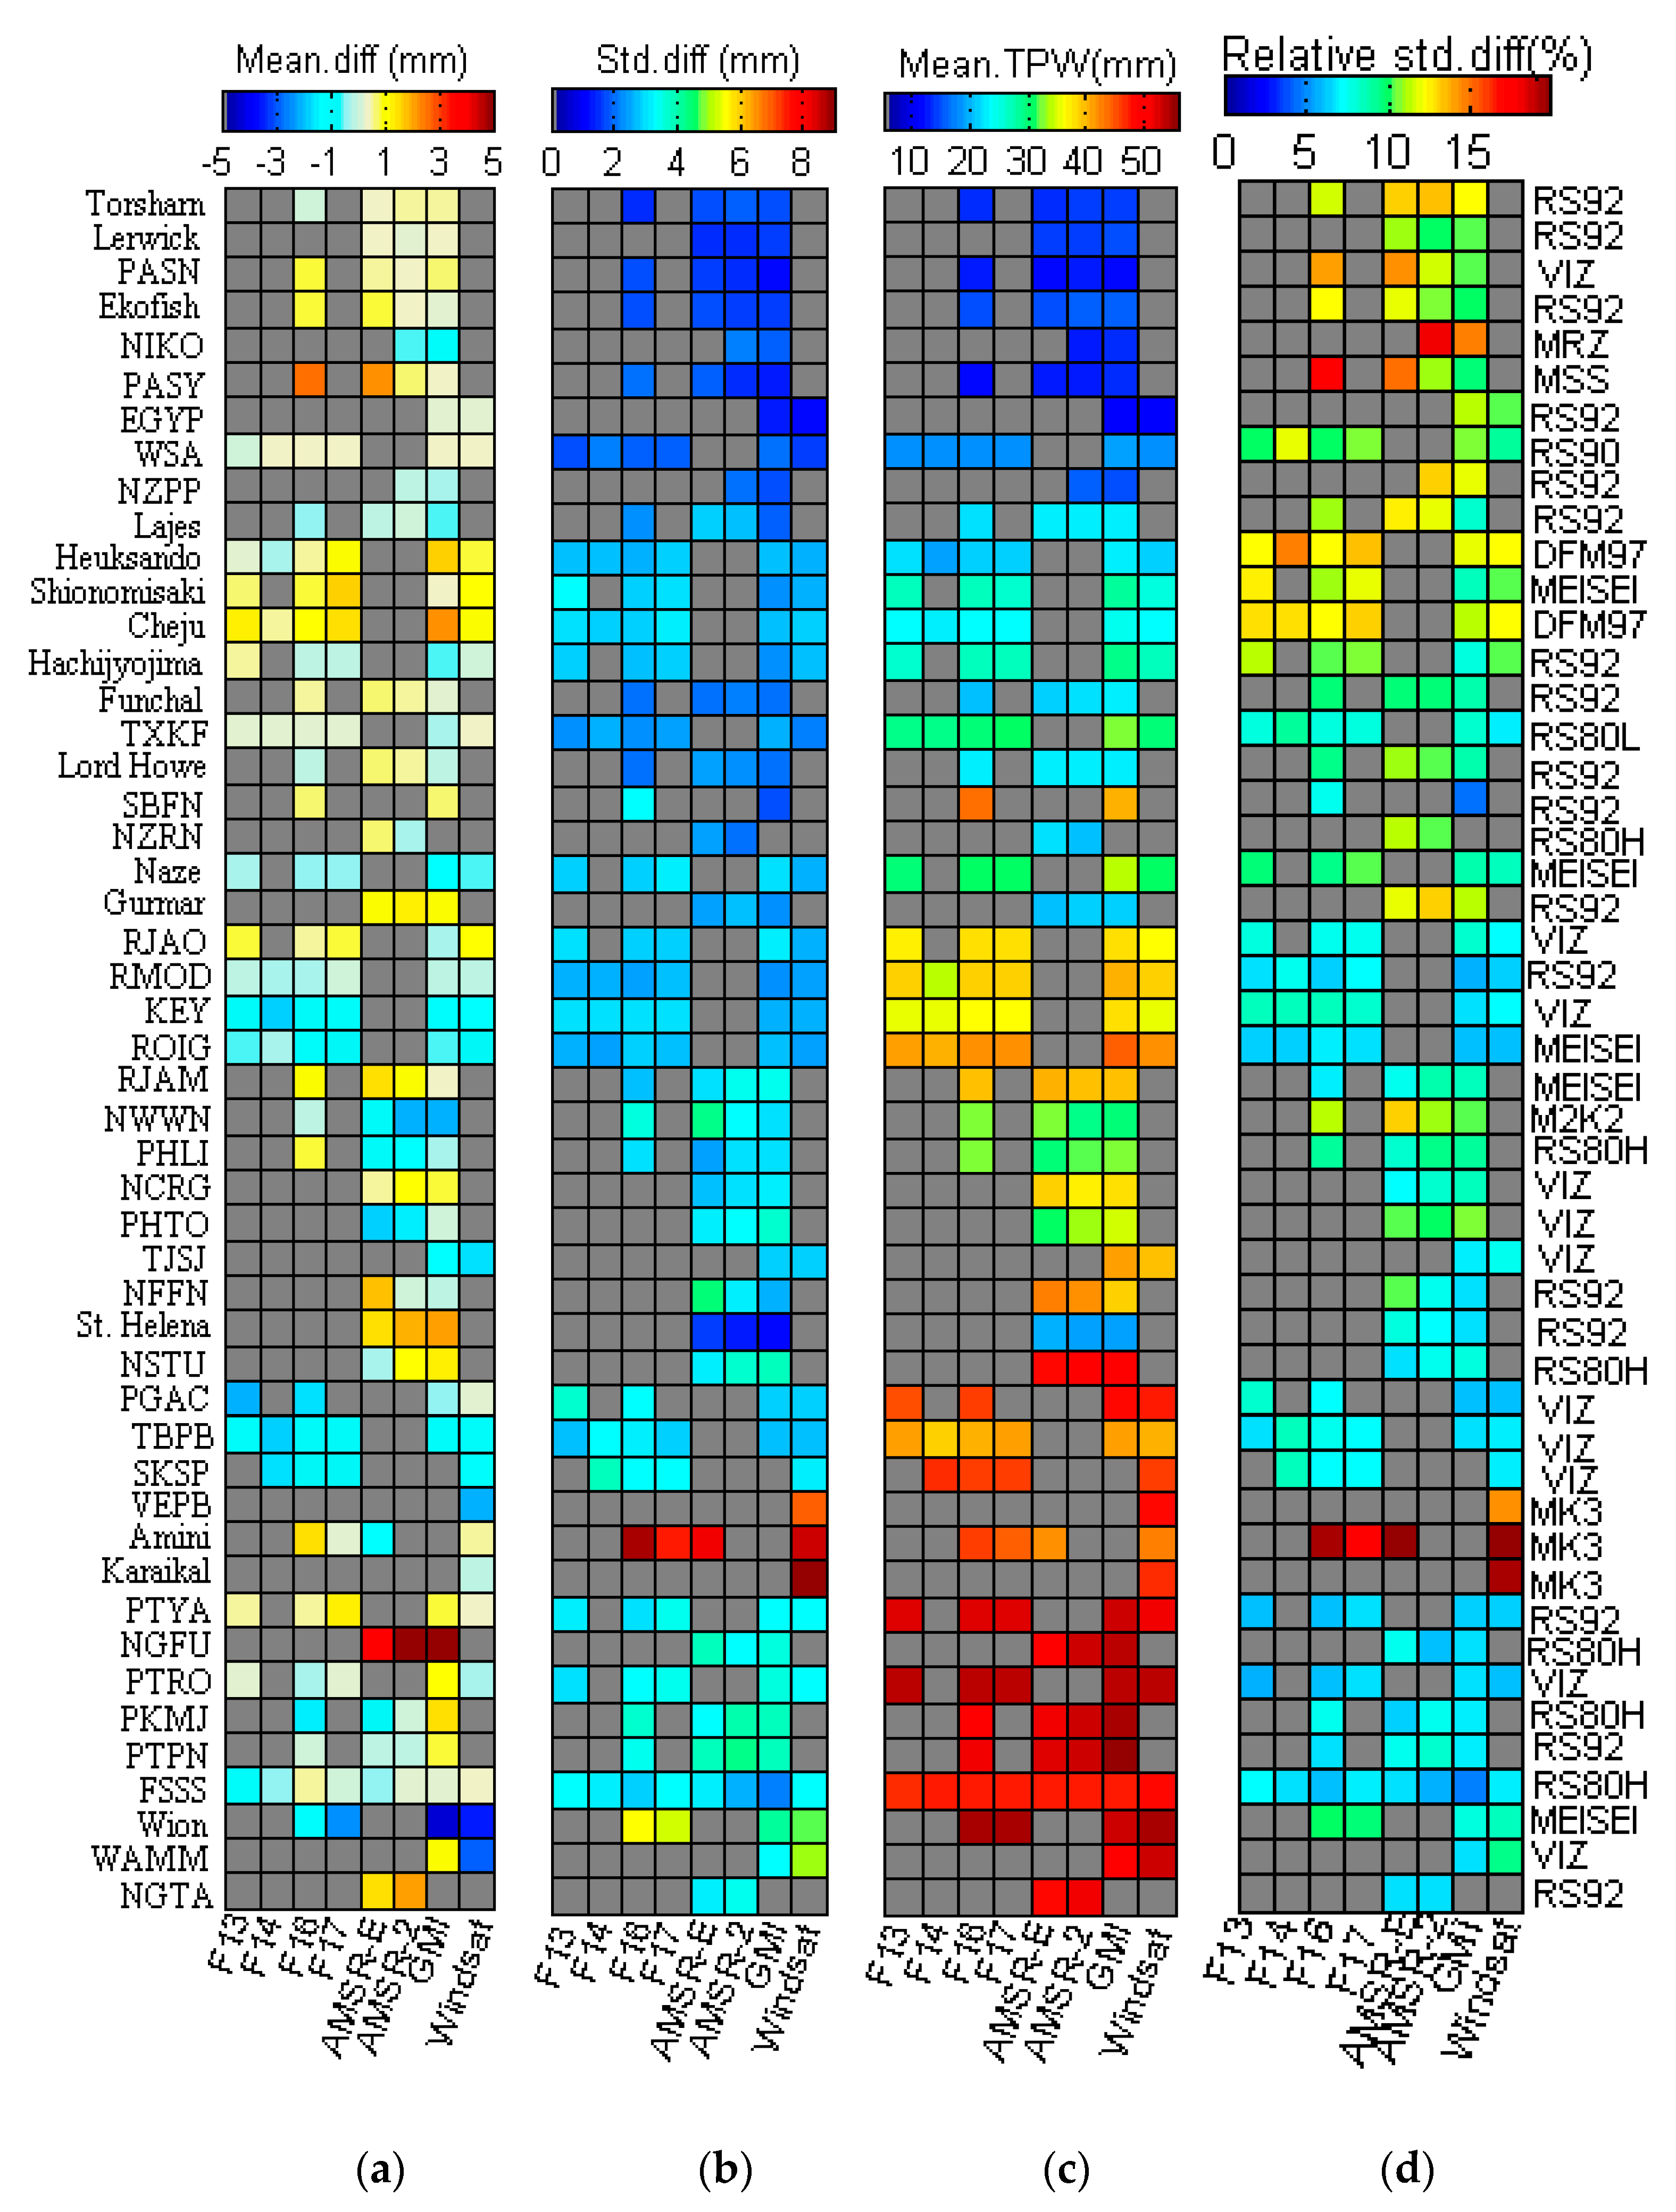
Statistics of comparison results of each satellite/radiosonde pair with more than 100 samples were conducted. Figure 4 shows the mean difference, standard deviation of differences, mean value of satellite measurements, and relative standard deviations of 192 satellite/radiosonde pairs, and relative standard deviations are defined as the standard deviations divided by mean values of satellite TPW measurements. In order to demonstrate the effects of latitude on the results of comparison, all the stations are rearranged according to the absolute value of latitude. As we can see in Figure 4a, most of the mean differences between satellite and radiosonde range from −1 to 1 mm. There is a significant feature in distribution with latitudes: Mean differences for stations at high latitudes are positive, while most of the mean differences are negative for middle latitude areas. The largest positive and negative values of mean differences both appeared in low latitude areas, such as Funafuti (179.13°E, 8.31°S), Ranai (108.23°E, 3.57°N), and Menado (124.55°E,1.32°N), which shows that the accuracy of satellite TPW retrieval is getting worse at tropical latitudes compared to middle and high latitudes. As for the overall standard deviation (Figure 4b), it increases evidently while latitude descends. Standard deviation of the differences at three stations using type IM-MK3 is up to 8mm, which is distinctly larger than those of any other stations. The standard deviation of the differences at station St. Helena is much smaller than those of other stations in the same latitude areas, for the reason that the mean value of satellite TPW is relevantly smaller (which we can see in Figure4c). As for the mean values of satellite TPW retrieval (Figure 4c), the values increase distinctly with the decrease of latitude. As for relative standard deviation (Figure 4d), nearly all the relative standard deviations are smaller than 12%, except those for the stations adopting type IM-MK3. The relative standard deviation of those stations in middle and low latitudes are mostly less than 10%, but the same statistics stay between 10% and 15% in high latitude areas. Overall, the mean difference, standard deviation, and relative standard deviation have latitudinal distributions. However, the statistics of different stations in the same latitude area have various differences. The change of the statistics may be related to radiosonde types and geophysical parameters at the location of each station, which are discussed in the next section.
The time series of TPW values and the differences of each satellite/radiosonde pair similar to Figure 3 are hereby analyzed. The results show that the differences fluctuation amplitude of No. 43311 (Amini), No. 43333 (Blair), and No. 43346 (Karaikal) station are the top three with relative standard deviation more than 15%, as IM-MK3 is adopted at these stations, which is consistent with the result from Wang and Zhang [26]. In addition, the differences of three stations including No. 47971(Chichijima, using type VIZ), No. 96147 (Ranai, using type MEISEI), and No. 91680 (Nadi airport, using type RS-92) show time inhomogeneities similar to those of Menado station.
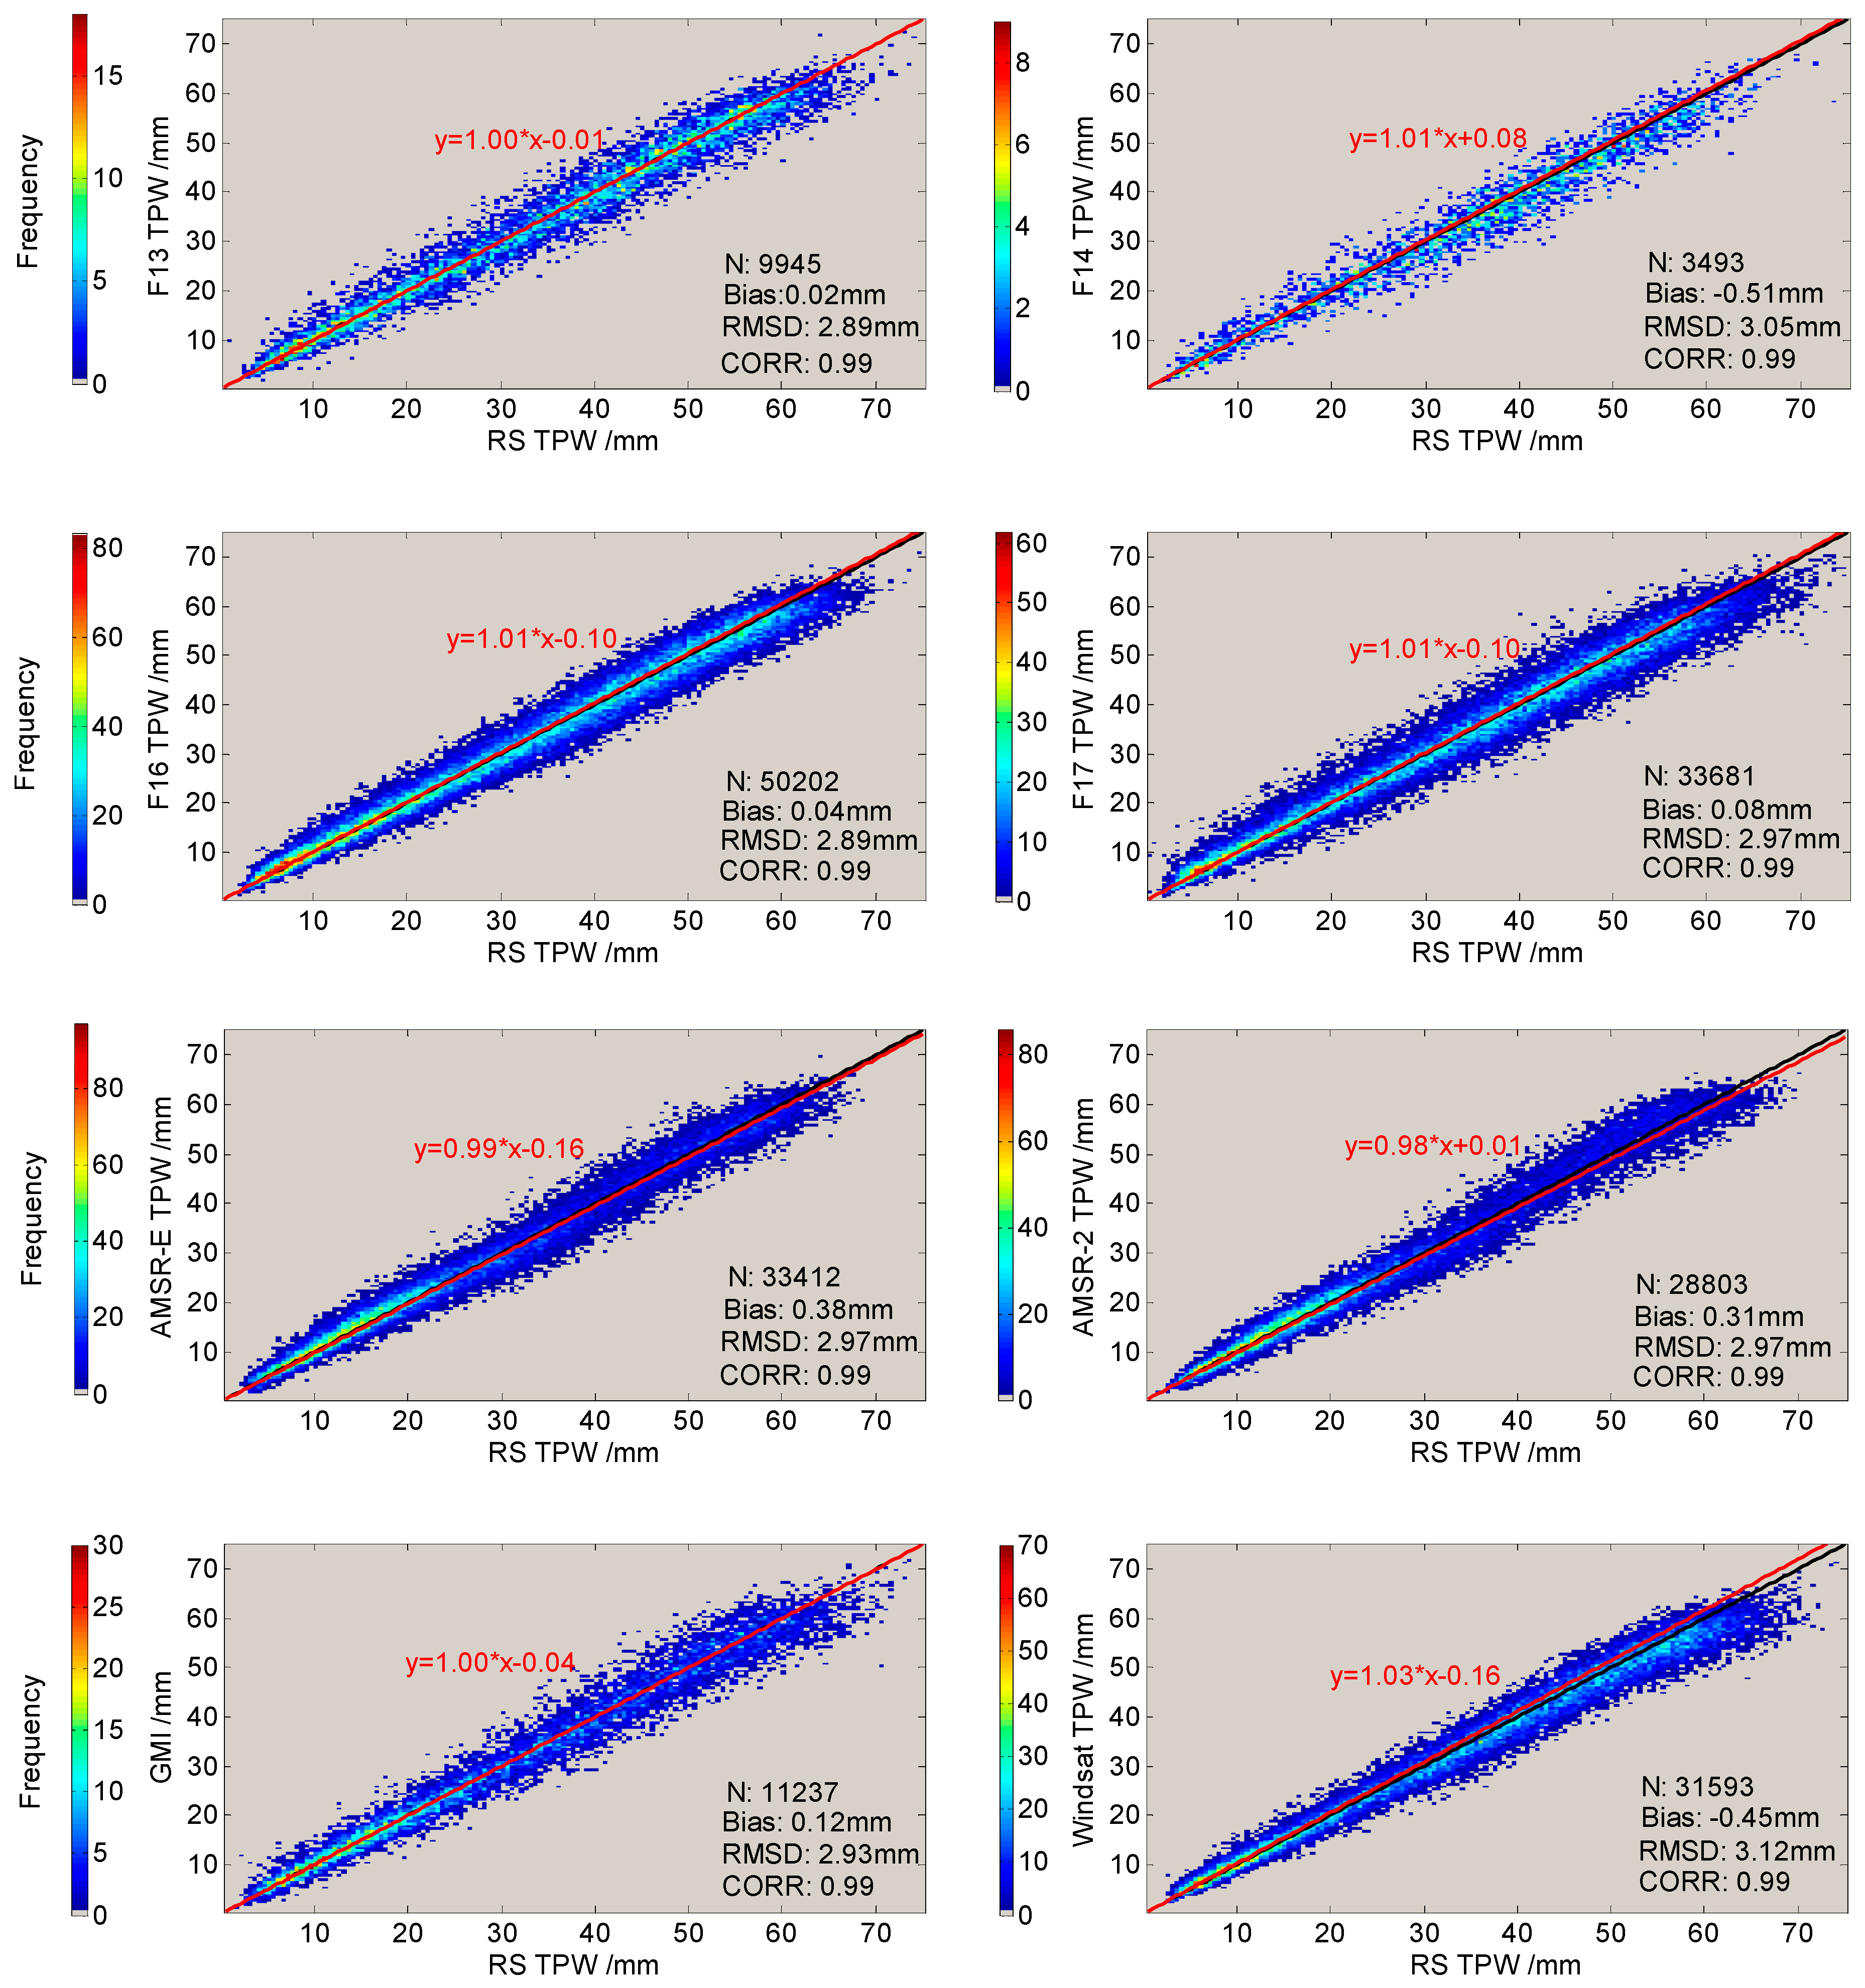
In order to avoid the impact caused by the error on the result of comparison, the samples of three radiosonde stations adopting IM-MK3 whose relative standard deviation can be more than 20% were eliminated. The result of overall comparison of each of the satellite for all the radiosonde stations is shown in Figure 5. Excellent agreement between the two types of TPW data can be found in Figure 5, with mean difference in the range −0.45 to 0.38 mm, root mean square error in the range 2.89 to 3.12 mm, and linear correlation coefficients between TPW retrieval and radiosonde TPW for all satellites reaching 0.99.

4. Discussion

In order to demonstrate the influences of sounding types and geophysical parameters at the location of each station on the TPW differences, we conduct a discussion of the result in this section.
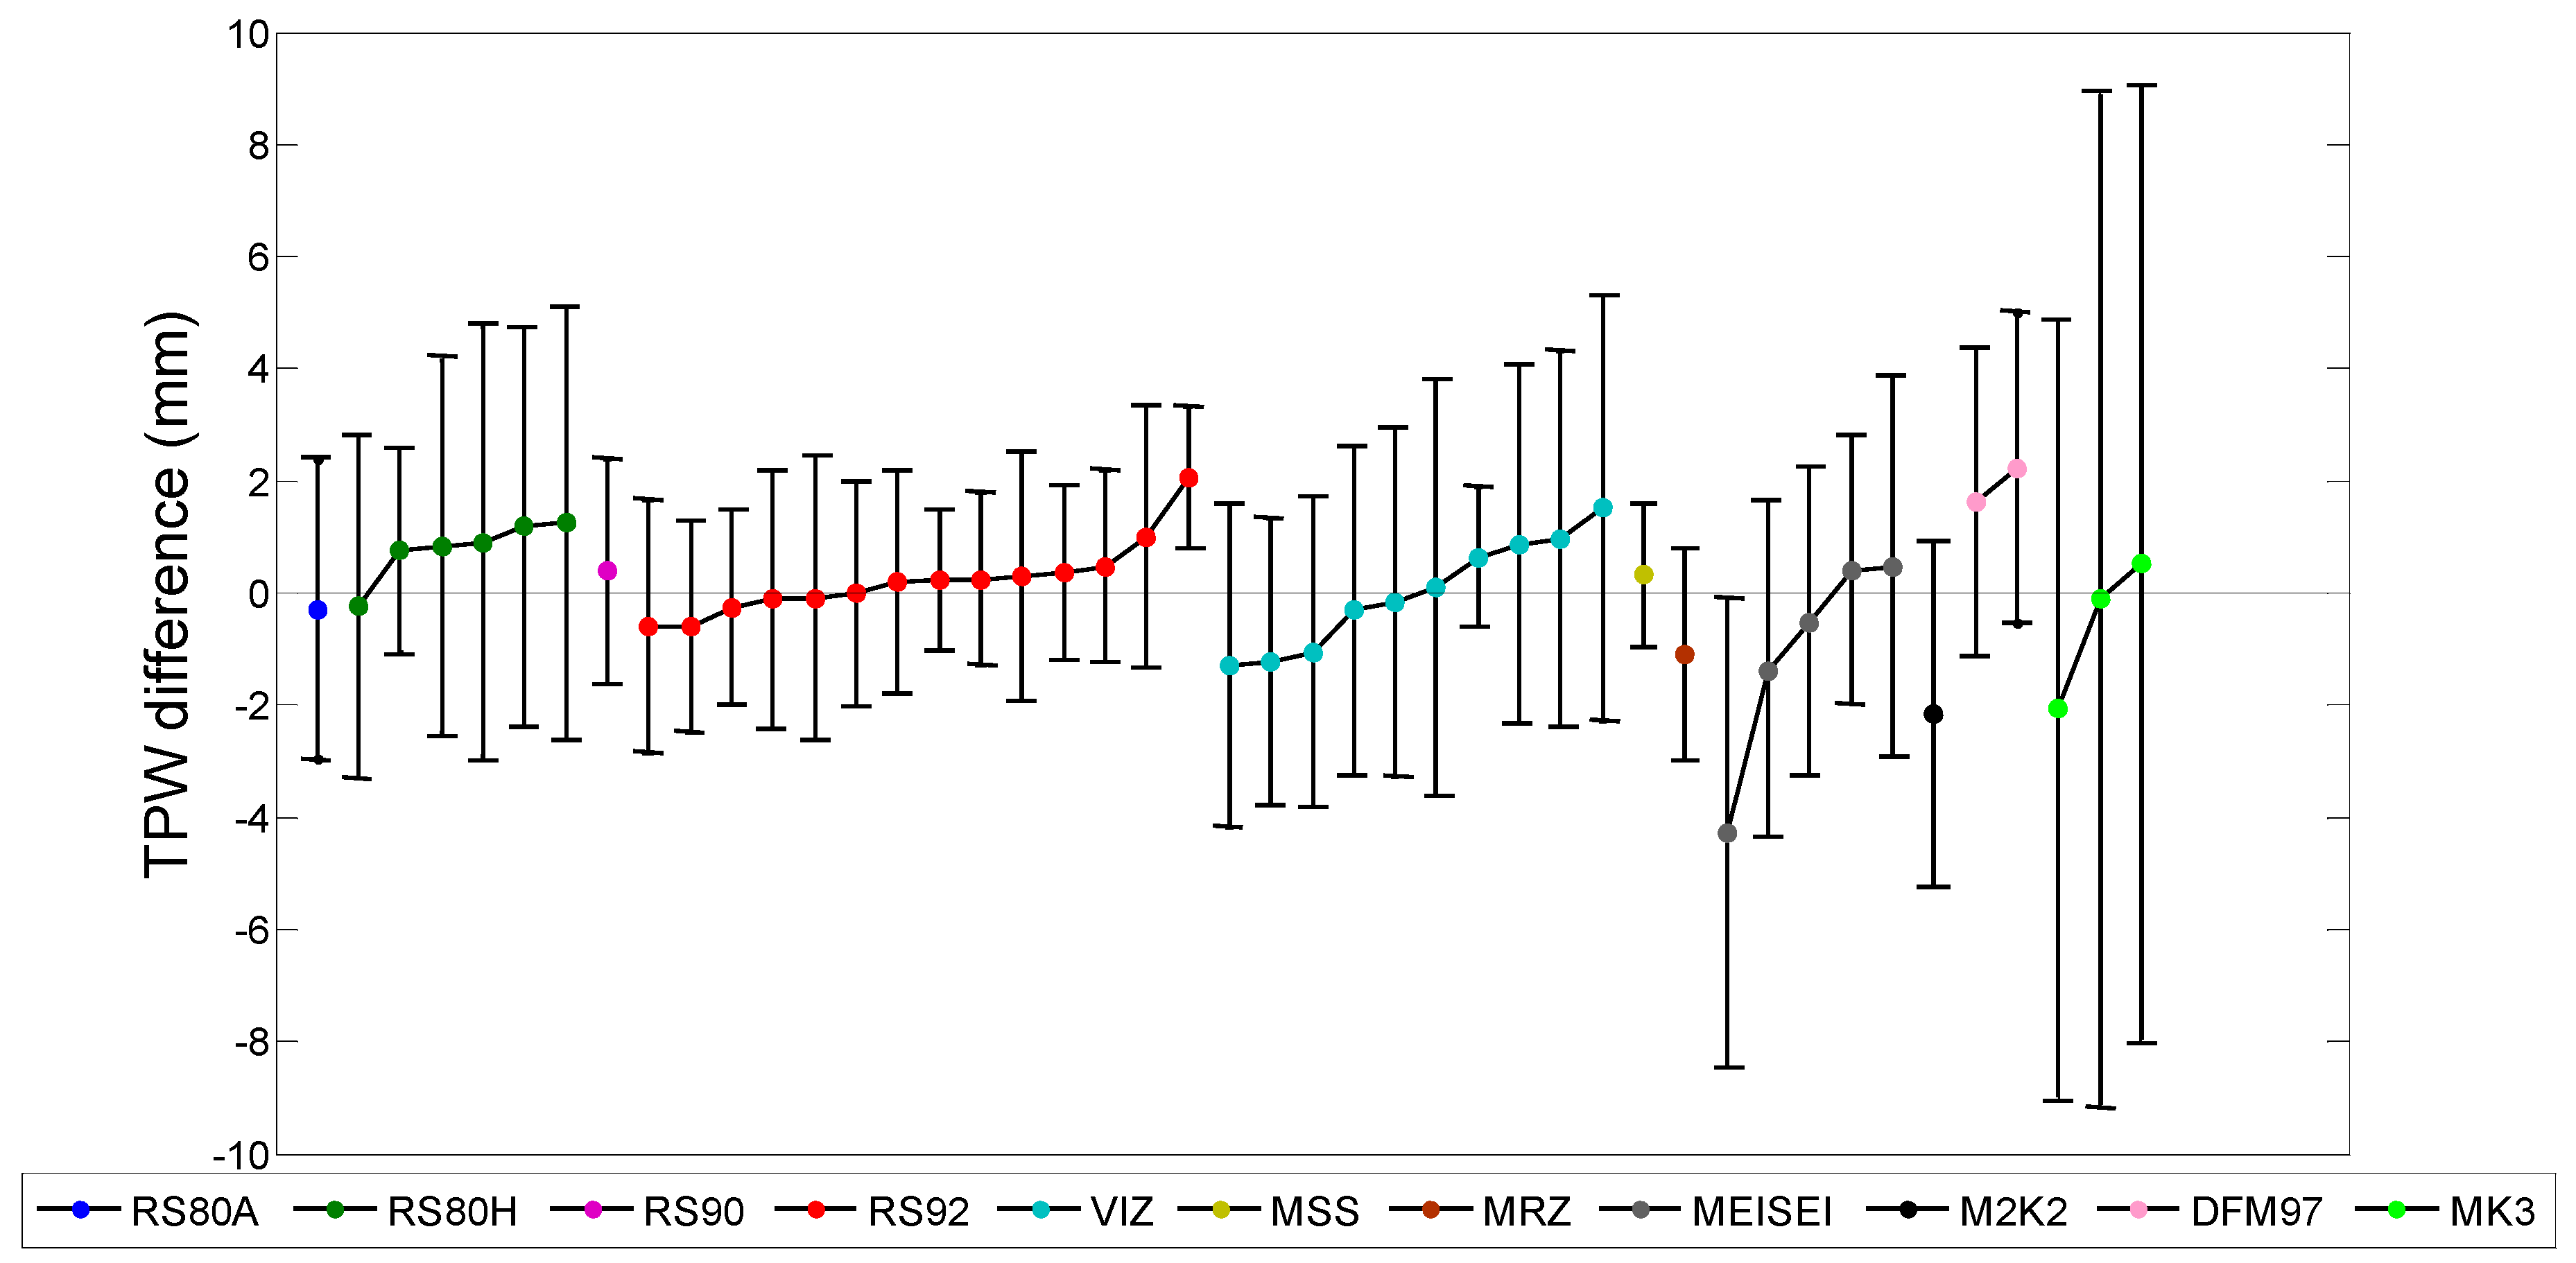
As is shown in Figure 4, for the forty-nine radiosonde stations matching both in time and spatial, only the GMI can match almost all radiosonde types (except for IM-MK3), so we decided to take the result of GMI as an example to explain the difference statistics for different sounding types (Figure 6). We also share the comparison results of WindSat and 3 stations adopting IM-MK3 type in Figure 6 to complete the analysis of all types of radiosondes. As we can see in Figure 6, TPW measured by type RS92 shows the best agreement with the GMI TPW retrieval, with mean differences varying from −1 to 1 mm; TPW measured by type RS80H and DFM-97 is about 1 mm less than the GMI TPW retrieval, while the TPW measurements of MRZ, M2K2 are about 1 mm greater than the GMI TPW retrieval. The largest standard deviation was found in the comparison between TPW measurements made by IM-MK3 and WindSat (Figure 4). Among all the radiosonde types, RS92 showed the best performance for water vapor measurements, which is consistent with the result from Wang and Zhang [26]. By contrast, it was proved that IM-MK3 from India showed relatively high random error in humidity and temperature measurement, which is consistent with the result from Kuo et al. [19] and Thorne et al. [33].
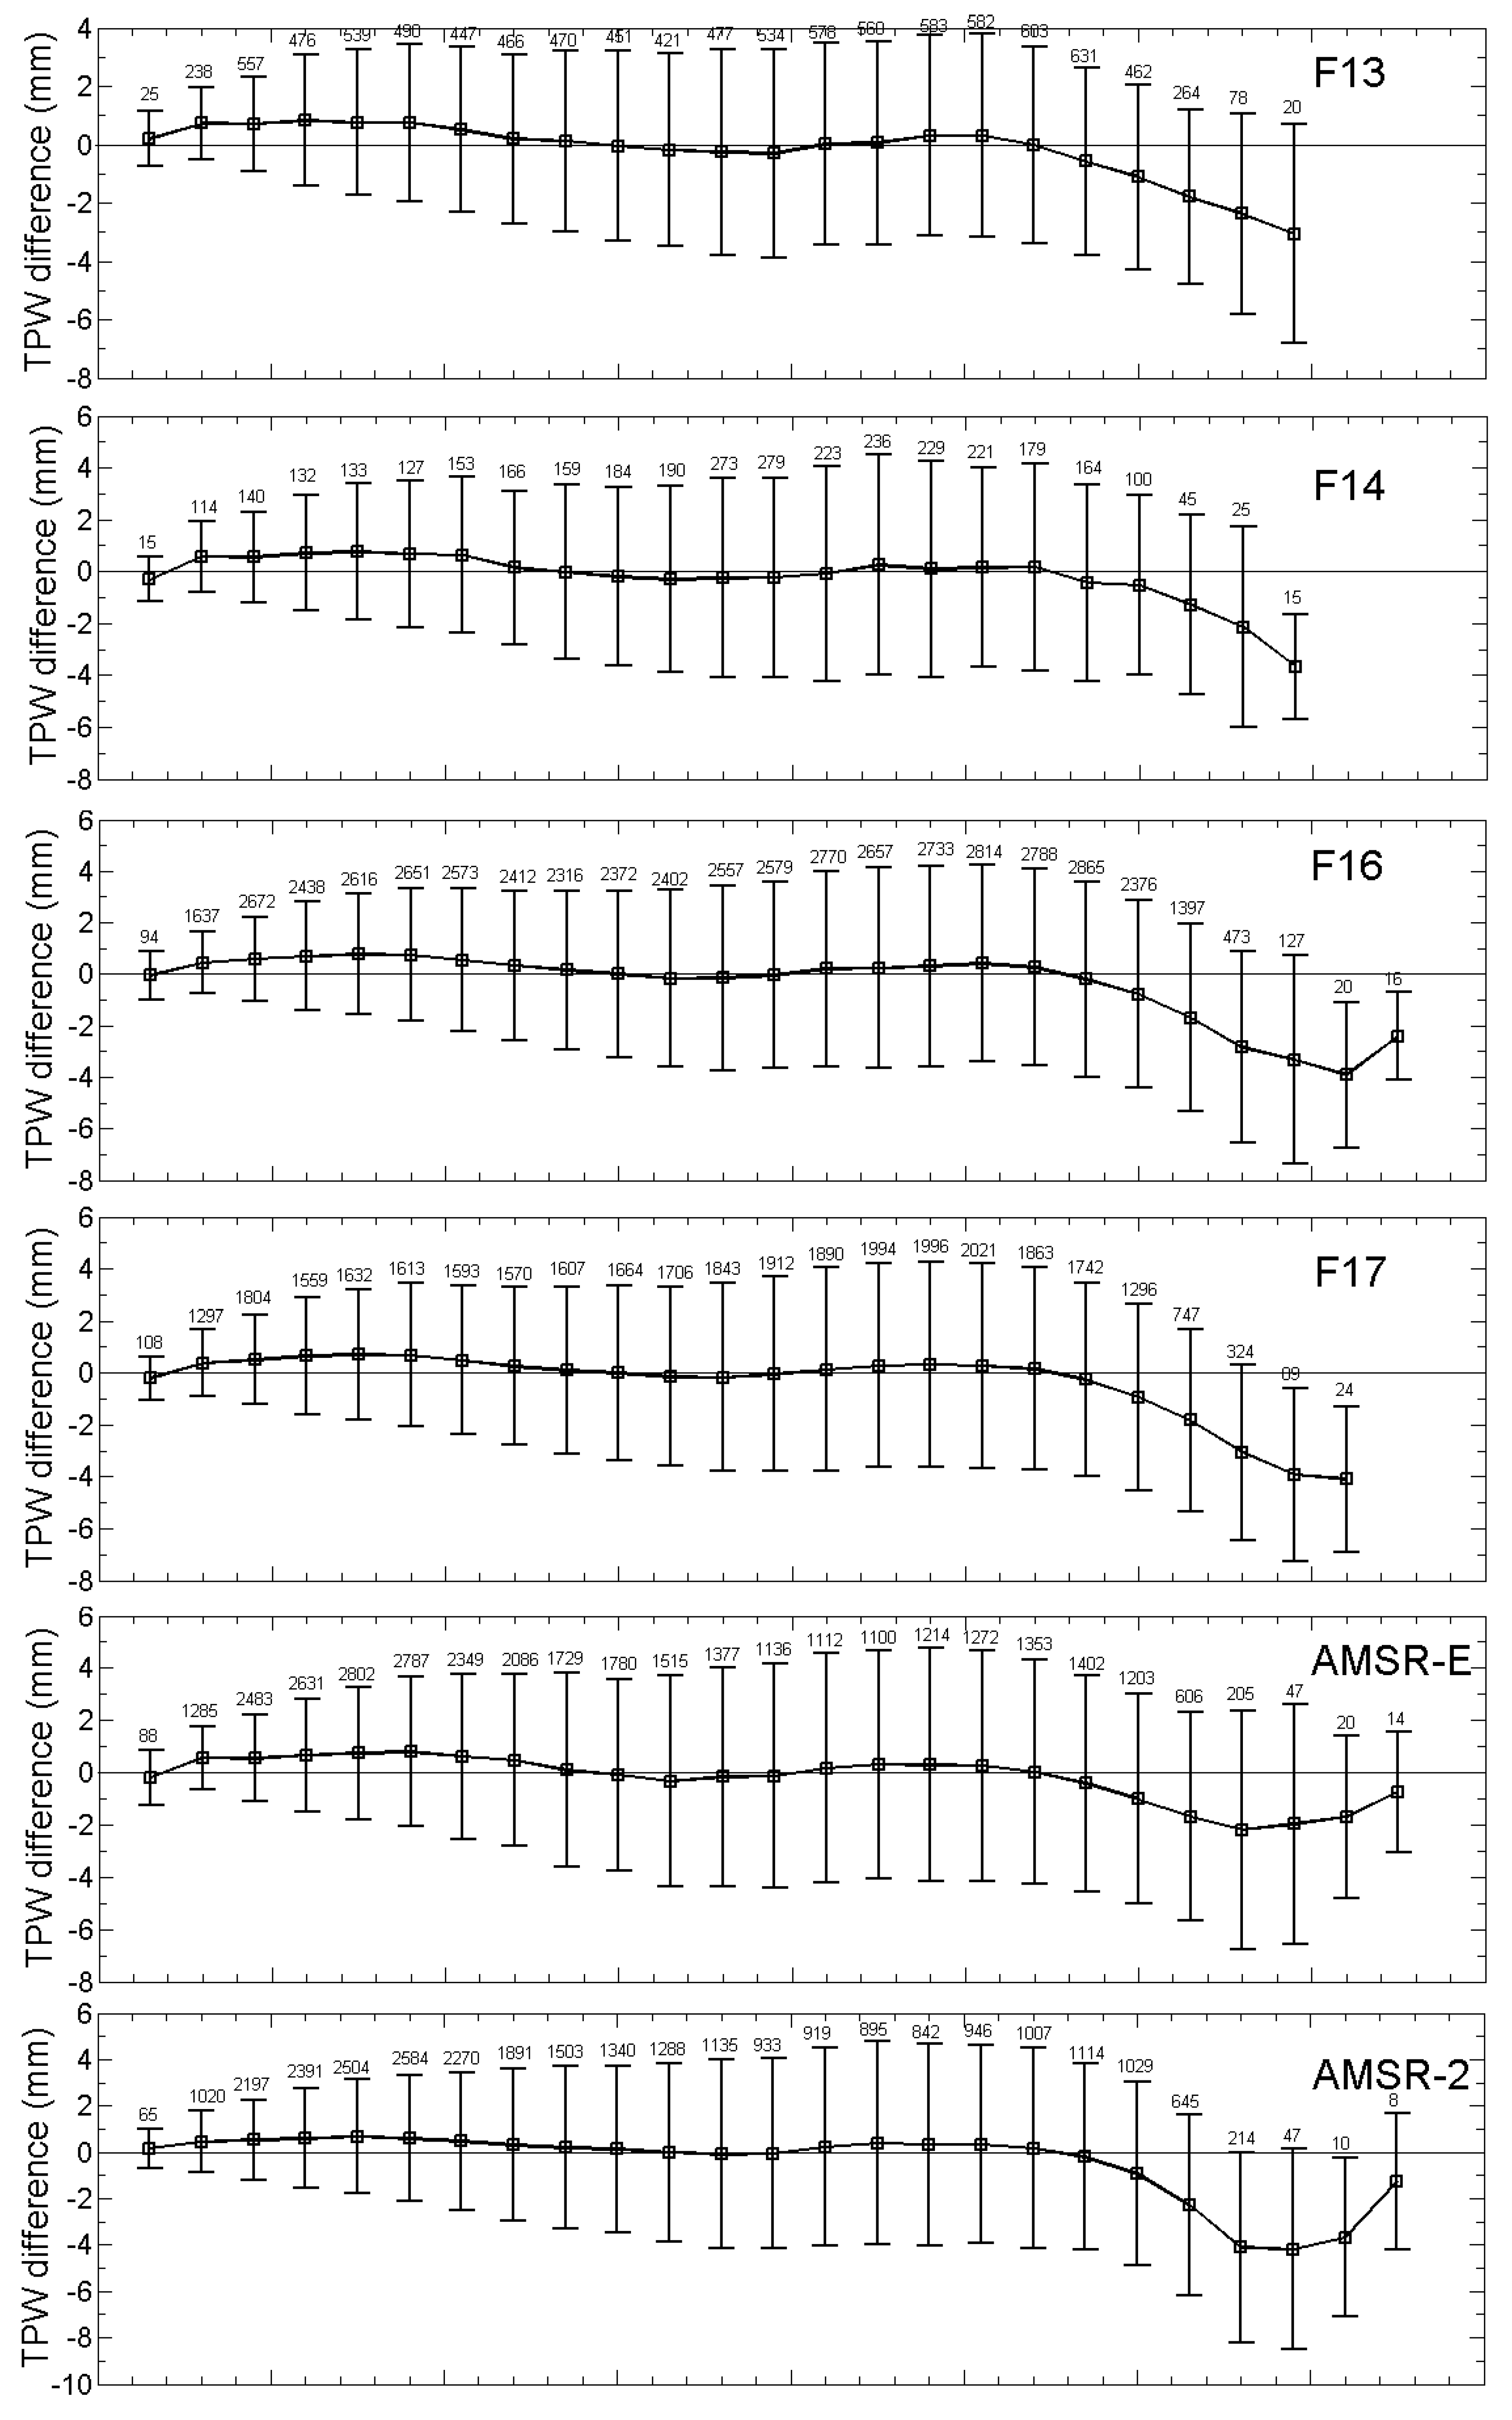
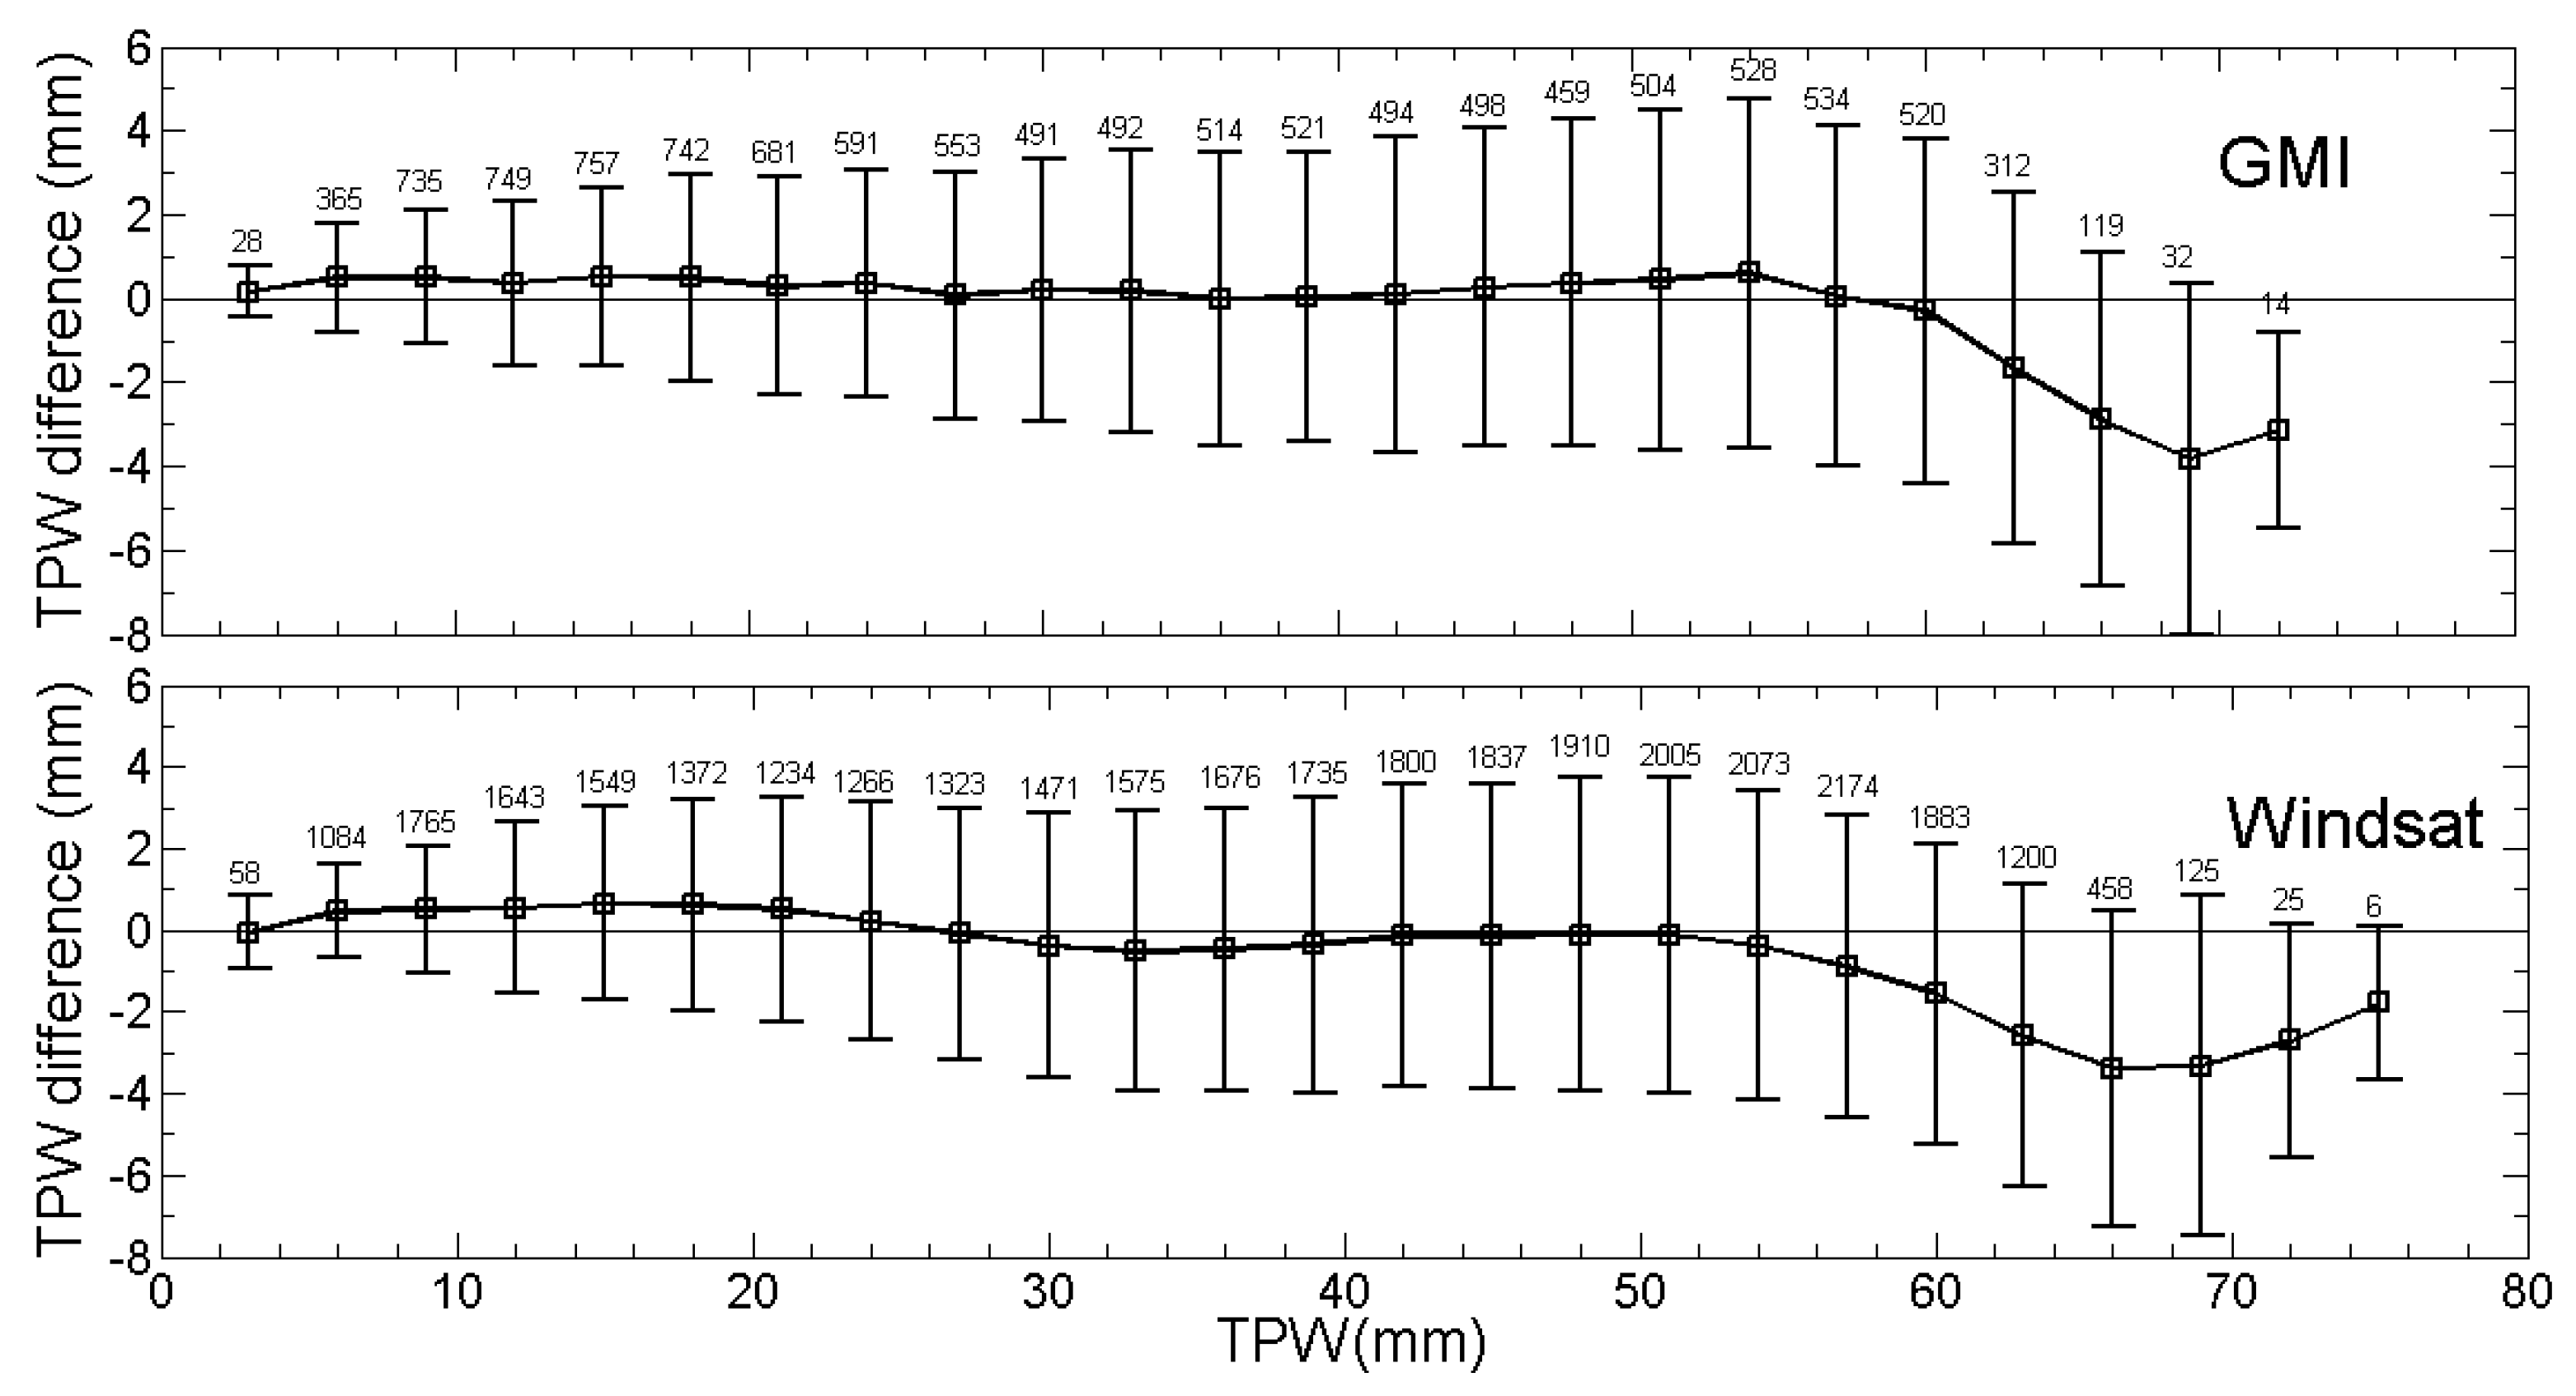
Variations of the TPW difference with the radiosonde TPW in a 3mm bin for each satellite are presented in Figure 7. TPW retrievals are slightly greater than radiosonde TPW for the TPW values below 20 mm for each satellite, and the mean difference is up to 1mm, which is in accordance with the relationship between mean difference and mean value of satellite TPW at high latitudes in Figure 4a,c. The two kinds of TPW data agree well for the values of TPW ranging from 20 to 60 mm, with the mean difference varying around zero. However, when the measurement value is greater than 60 mm, the water vapor retrieval precision of each satellite decreases obviously with a distinct dry bias, which can reach −4 mm. That could be the reason for the phenomenon in Figure 3c that the satellite TPW retrievals are less than the TPW values of radiosonde. Mears et al. pointed out that the TPW retrieval values of SSM/I and SSMI/S were less than the TPW values measured by ground-based GPS for high values of TPW [24].
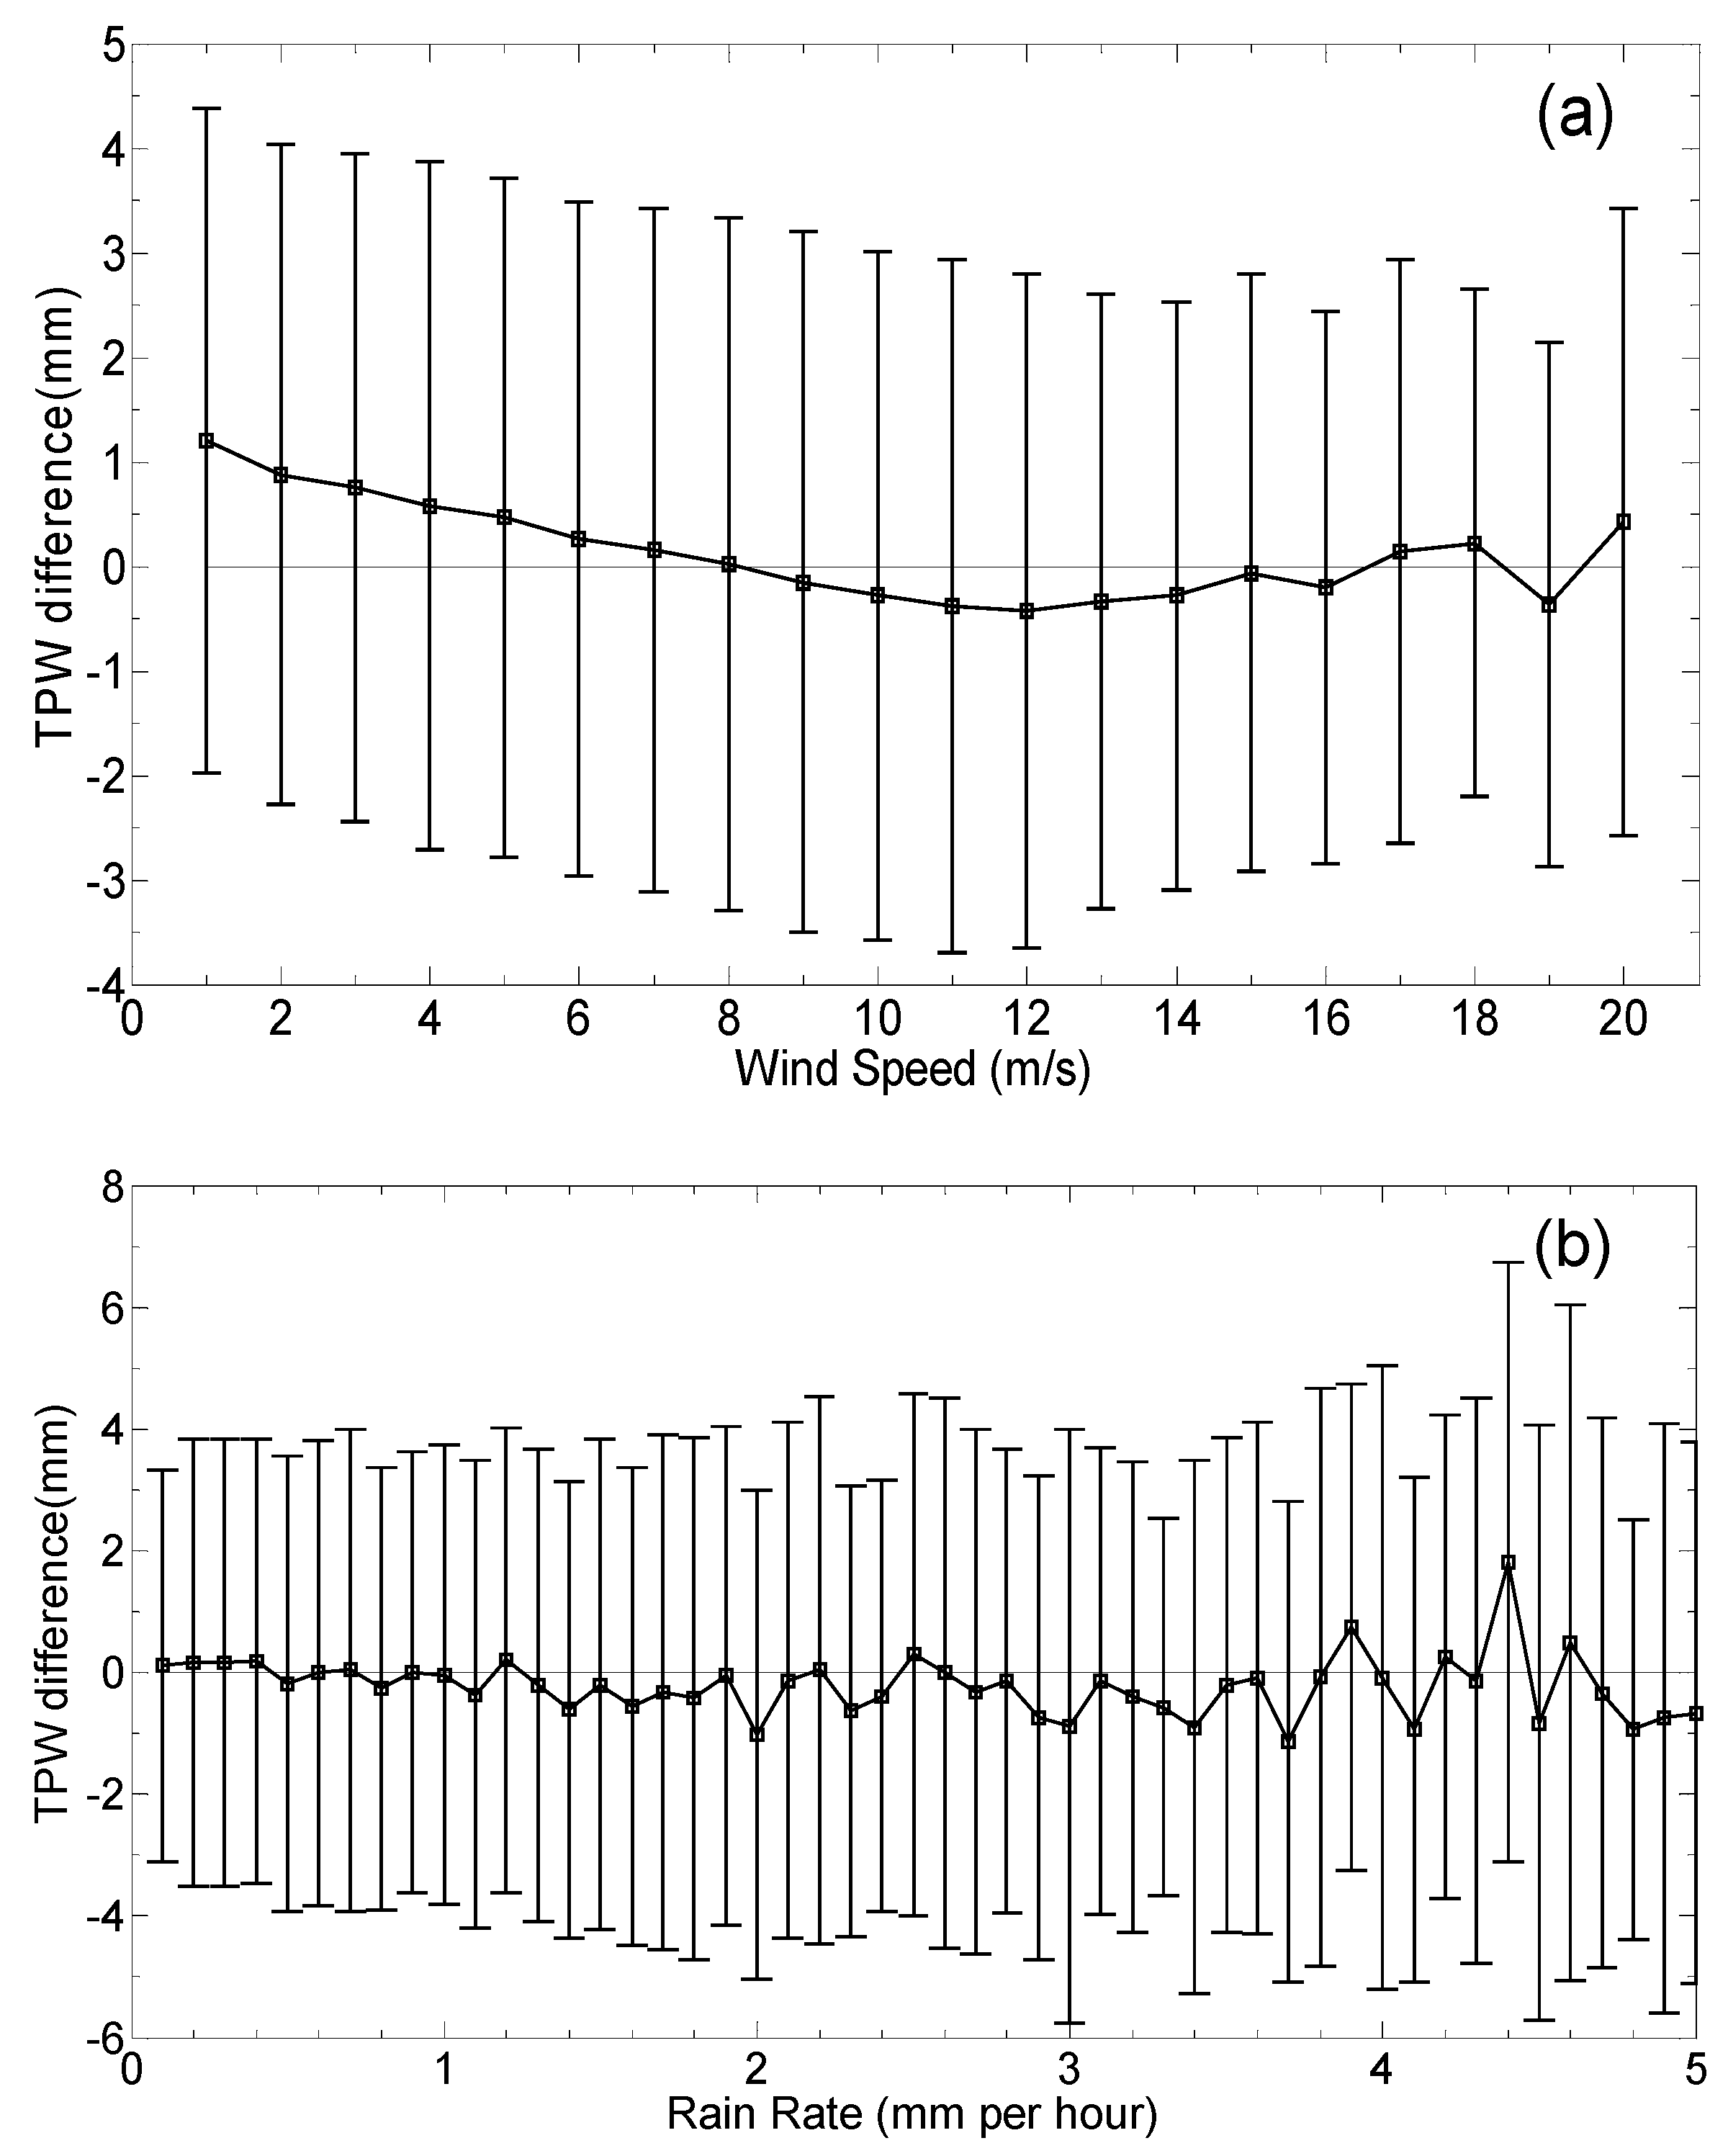
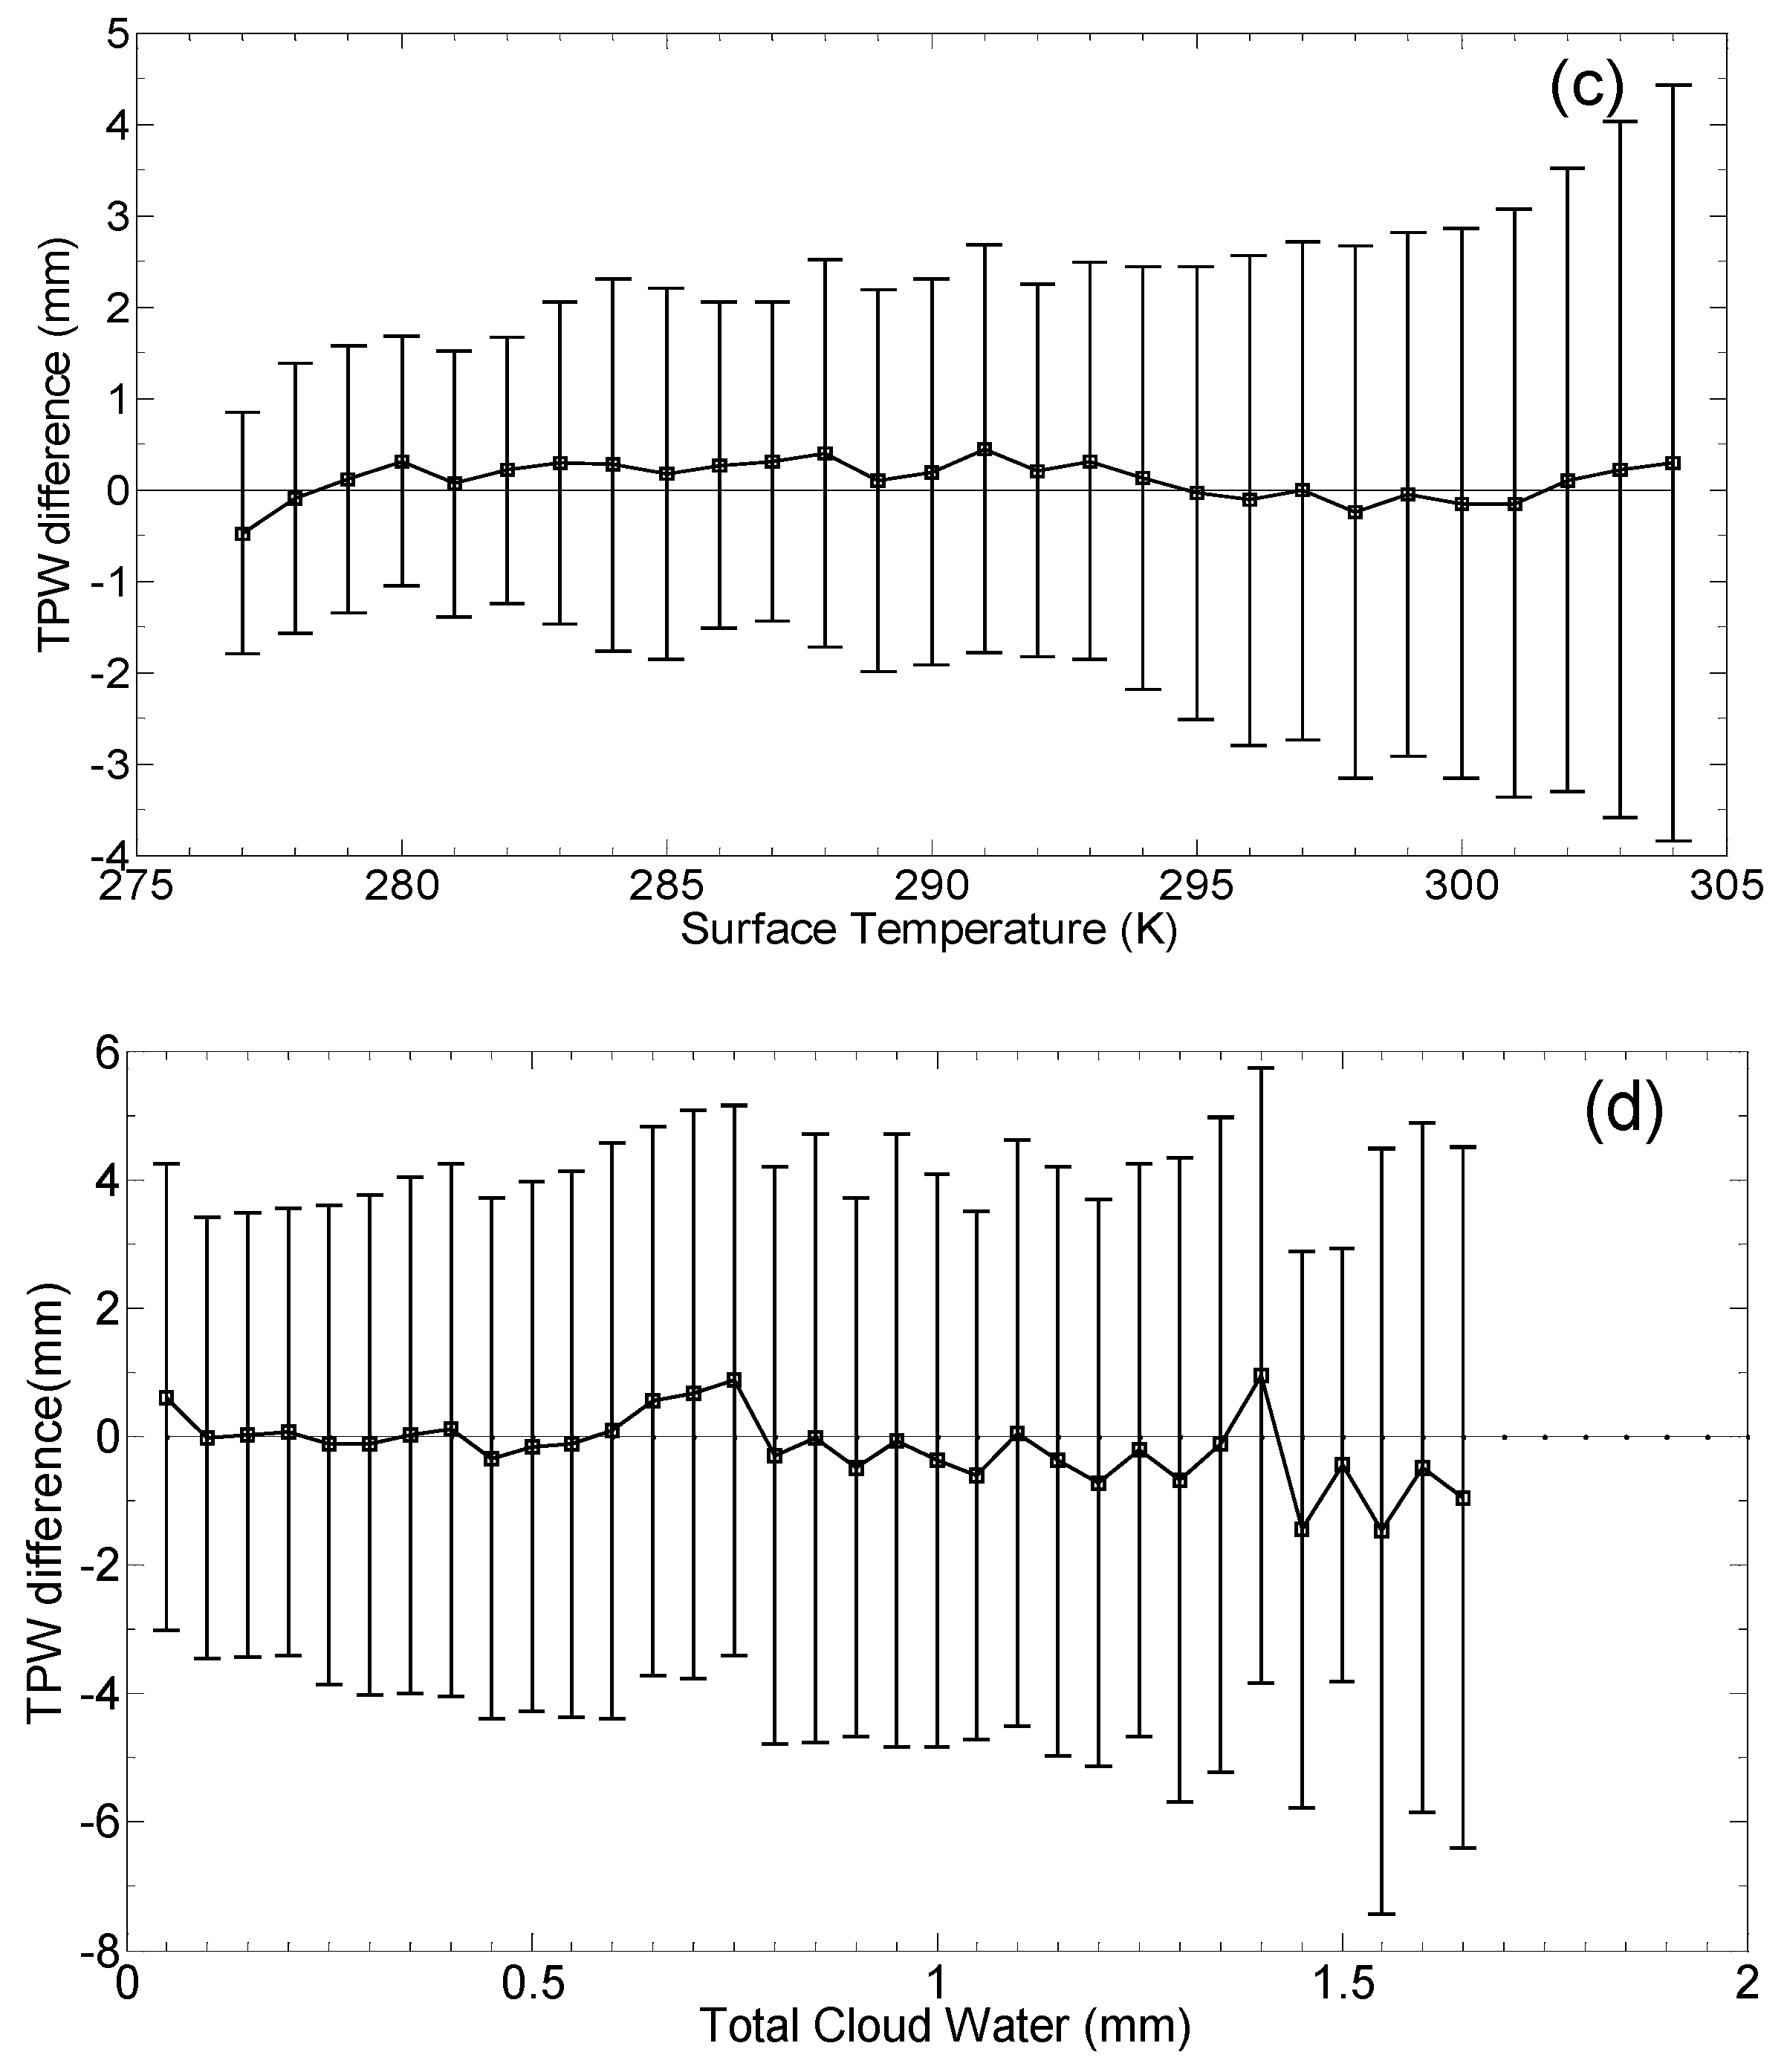
In addition to the value of TPW measurement, it was found that other geophysical parameters could also affect the retrieval of water vapor [17,28,34]. The relationships between TPW difference and wind speed, rain rate, sea surface temperature, and liquid water in cloud are analyzed here. We took AMSR-2 as an example to explain the conclusion. Figure 8 shows the variations of the mean differences and standard deviations with geophysical parameters, the data of wind speed, rain rate, sea surface temperature, and liquid cloud water are adopted from the retrieval products released by RSS.
As we can see in Figure 8a, the mean difference of TPW decreases as wind speed increases for the wind speed between 1 and 11 m/s, with a moderate slope of 0.2 mm. Validations of other satellite TPW products in our study can find that the unified microwave oceanic reverse algorithm (UMORA) overestimated the effect of the wind speed variability when retrieving the TPW values, for which the value of TPW retrieval decreased with the increase of the wind speed, which is consistent with the conclusion from Sohnand Smith [28]. UMORA was put forward by Wentz in 1997for the special sensor microwave/imager (SSM/I) [17], which is based on a model for the brightness temperature of the ocean and intervening atmosphere. The retrieved parameters are the near-surface wind, the total precipitable water, the cloud liquid water, and the line-of-sight wind. Wang et al. pointed out the reason is that high frequency (22 GHz and 37 GHz) was not sensitive to low wind speed, and therefore, large uncertainty was brought in when separating the signal of wind speed from total microwave radiances for TPW retrieval in UMORA [31].
Figure 8b shows variations of mean differences and standard deviations with rain rate. The mean differences of TPW are close to zero for the value of rain rate below 1 mm/h, while the amplitude of the mean difference grows when rain rate is greater than 1mm/h. It can be concluded that though RSS eliminated the TPW data of SSMI, SSMIS, and AMSR-E influenced by high rain rate, the precision of TPW retrieval is still affected by sprinkle because rain may strongly affect the reflection and assimilation of microwave. As a result, when the rain rate is greater than 1mm/h, the retrieval of TPW in rainfall areas should be used with caution.
Figure 8c,d shows variations of mean differences and standard deviations with sea surface temperature and liquid water in cloud. There is little evidence for the effect of SST and total cloud water on the precision of TPW retrieval.
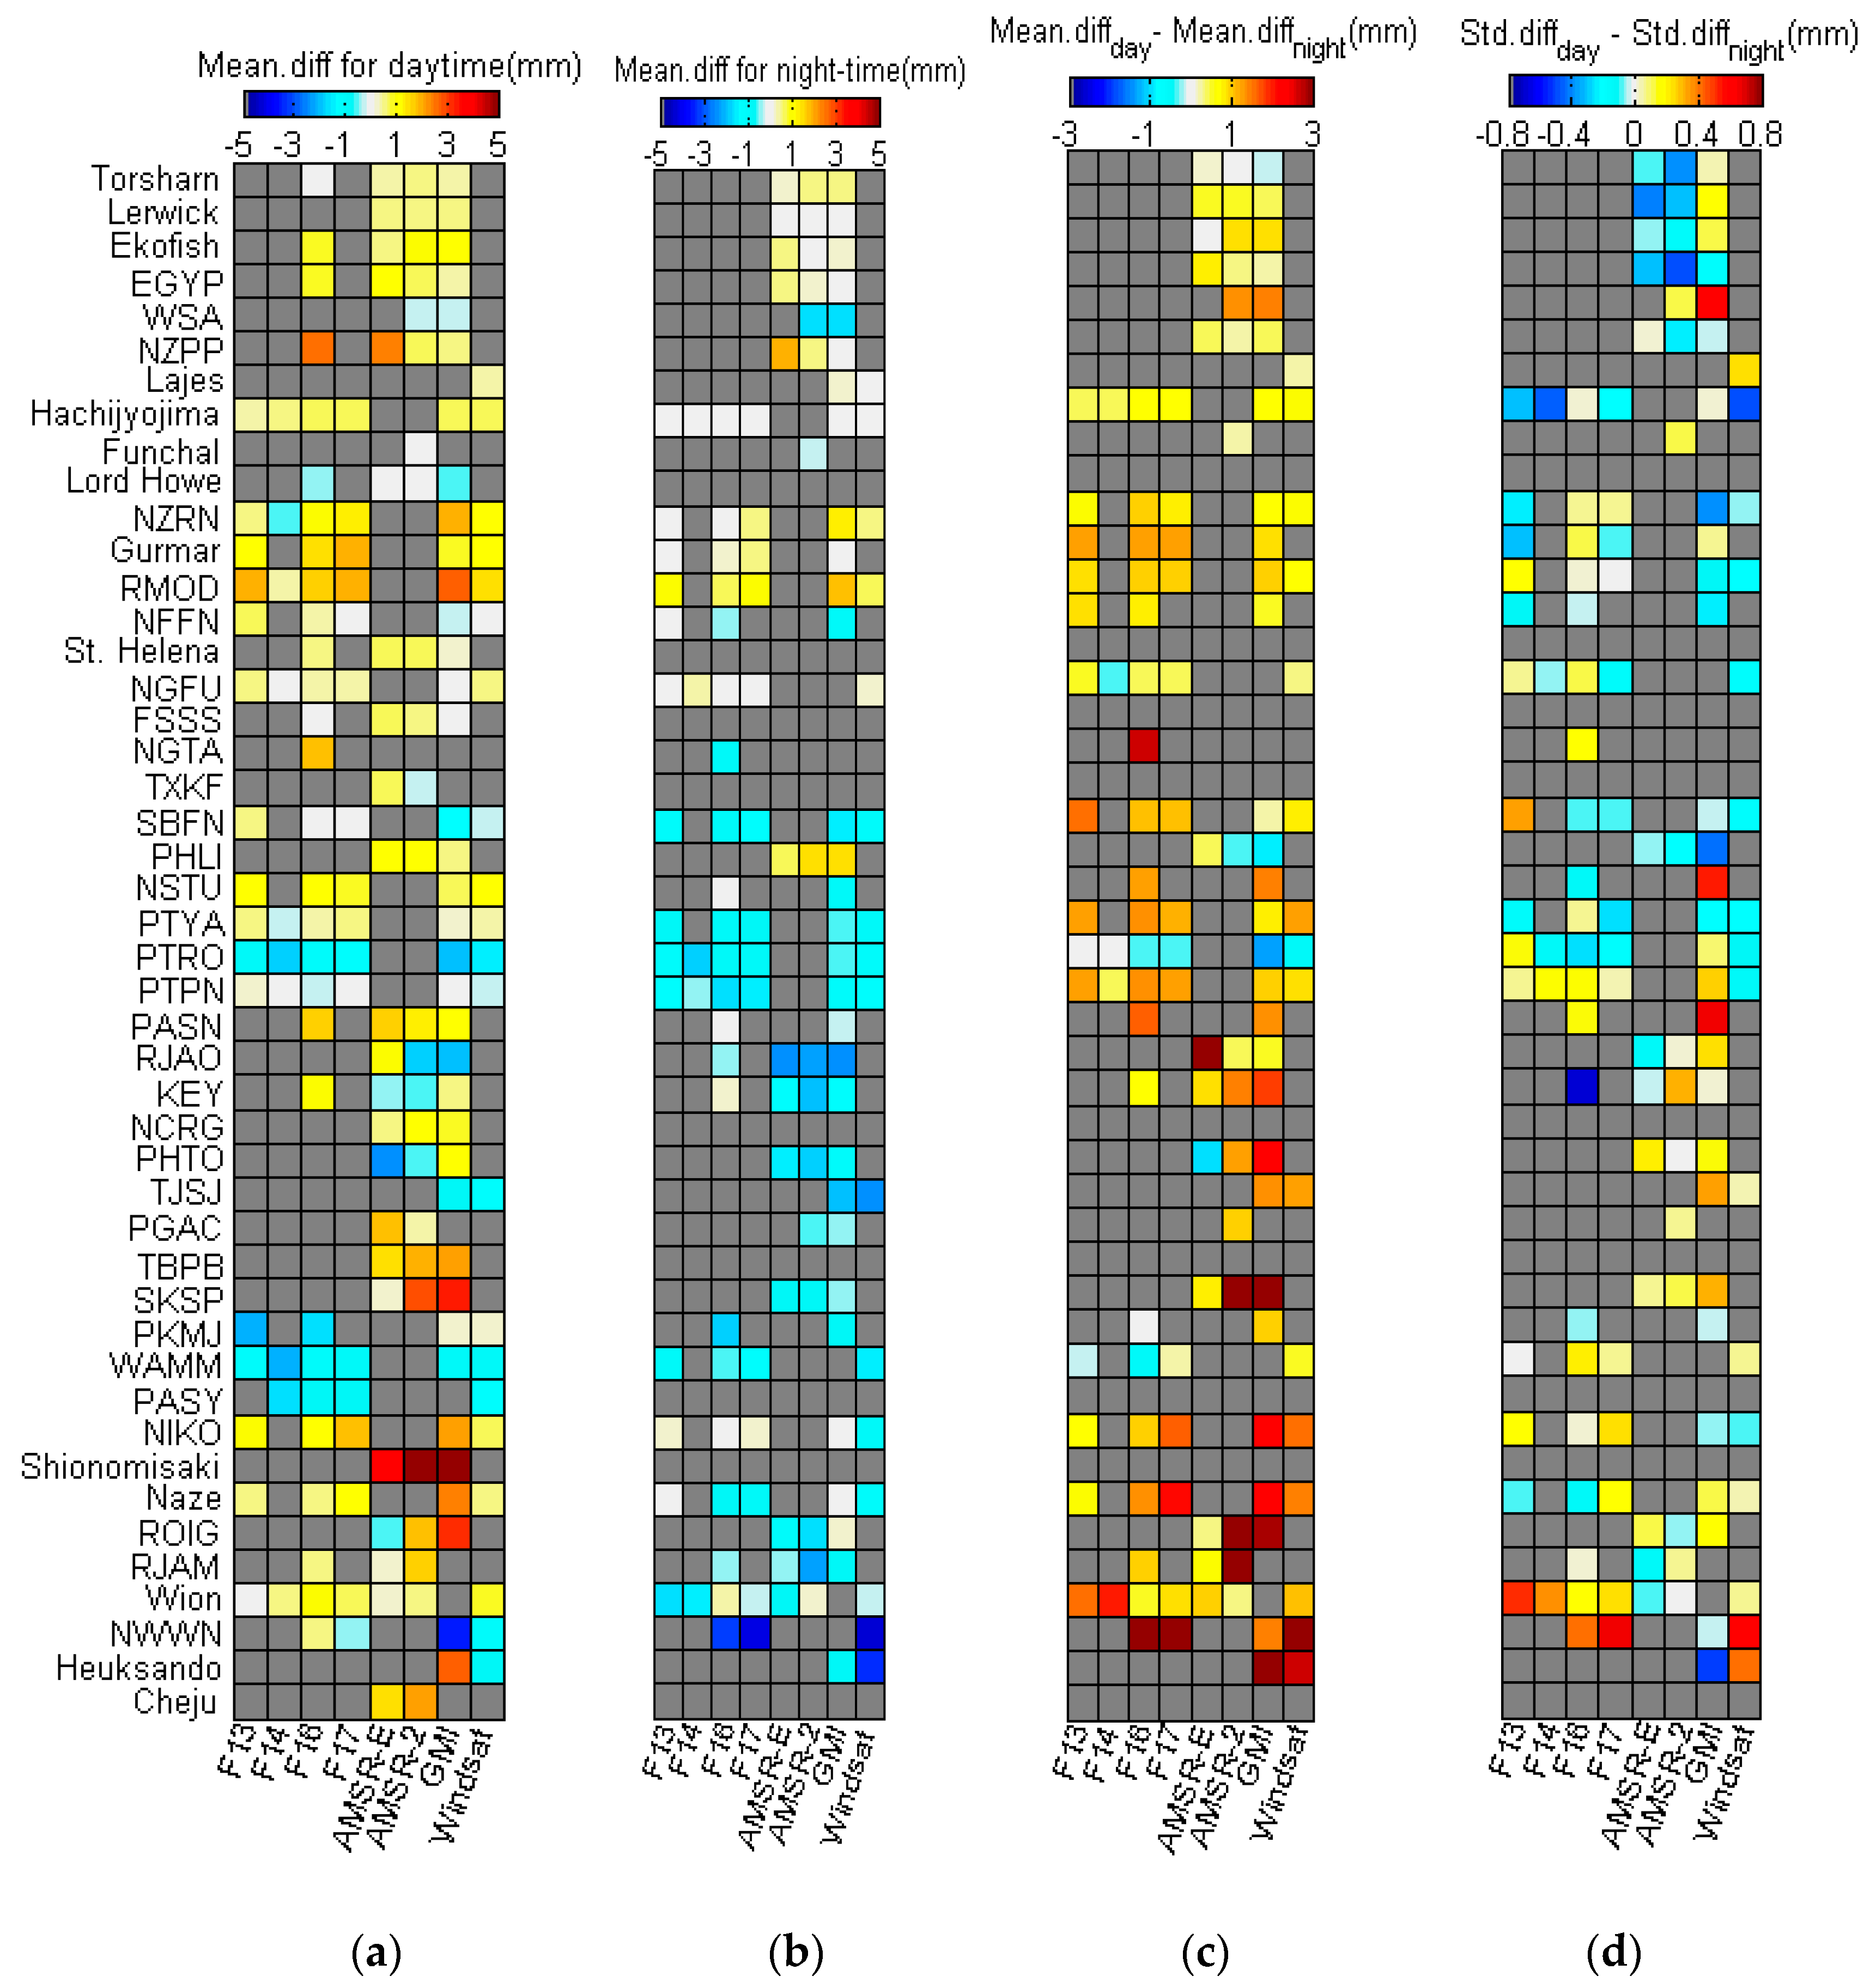
Some studies have revealed that there are day–night TPW differences both in the precision of the satellite retrievals and accuracy of radiosonde measurements [11,34,35]. Mean differences for daytime and night-time, difference values between day and night in mean values, and standard deviations of TPW difference for each satellite/radiosonde pair are exhibited in Figure 9. As is shown in Figure 9a,b, the mean difference of most stations during night is close to zero, while the mean difference of most stations during day time is positive around 1 mm (such as in stations Lerwick, Ekofish, Pleasant airport, Hachijyojima, Funafuti, and Beringa). Statistics of day–night difference for each satellite for all radiosonde stations are revealed in Table 2, from which we can also find that standard deviations during night-time are slightly smaller than those during daytime for F13, F16, F17, AMSR-E, AMSR-2, and GMI. From difference values between day and night in mean values and standard deviations of TPW difference (Figure 9c,d), we can see that the day–night difference of standard deviations is not significant, but that of mean differences is distinct. Day–night difference in the mean difference is around 1mm in middle and high latitude areas, while it may reach 3mm in low latitude areas where there is always strong sunlight shining.
Liu et al. also pointed out that comparison between MODIS TPW and radiosonde data was better during night-time than daytime, and the day–night variation of the performance of satellite retrieval was thought to be the reason [36]. We regard the effect of the sunlight on the humidity sensor of radiosonde as the primary cause of the day–night difference in the comparison between satellite and radiosonde. This point is also supported by a number of studies. The dry bias was caused by solar radiation heating on the radiosonde humidity sensor during daytime [35,37]. A total of 3–7% day–night difference of Vaisala relative humidity measurements was found in the WMO (World Meteorological Organization) radiosonde intercomparison project [38]. TPW measured by most of the radiosonde types at daytime is plagued by a dry bias, especially for those measured by Vaisala types [26].

5. Conclusions

An overall comparison between the TPW measurements made by satellite-borne microwave radiometers and radiosondes from Jun 2007 to Dec 2015was conducted by matching two kinds of data in space and time. Eleven radiosonde types, eight satellites, and a total of 192 satellite/radiosonde pairs were taken into consideration here. Excellent overall agreement was found between two types of TPW data, with mean differences ranging from −0.51 to 0.38 mm, standard deviation around 3 mm, and correlation coefficient reaching 0.99.
Analysis of the time series of the TPW difference shows that there are inhomogeneities in the radiosonde data. Analysis of the variation of the TPW difference with geophysical parameters shows that precision of satellite TPW retrieval decreases significantly with a distinct dry bias for the values of TPW above 60 mm, and when the wind speed is in the range of 1–10 m/s, satellite retrievals show a bias related to the wind speed; in addition, the precipitation stronger than 1mm/h has a distinct influence on the TPW retrieval. Analysis of mean value and standard deviation of the difference for 11 radiosonde types shows that radiosonde type RS92 has the best performance for TPW measurement, while the TPW measurements made by type IM-MK3 from India is quite unreliable, which should be used prudently. Finally, the comparison between the results of day and night was conducted, which revealed that nearly all the radiosonde data acquired by sounding in day time are plagued by a dry bias.
Remote sensing data and radiosonde data are both main data sources for the initial field of modern numerical weather forecast, whose precision can affect the quality of weather forecast. The findings here are valuable for future improvements in the quality of radiosonde data and the satellite retrieval algorithm, and this article can act as a reference material for researchers to choose appropriate TPW production for climate research as well.

Supplementary Materials

The following are available online at https://www.mdpi.com/2073-4433/10/7/390/s1, Table S1: IGRA number, name, location, elevation, sounding frequency and type of each matched station.

Author Contributions

The manuscript was prepared by J.-P.G., Y.-T.Y., and J.-N.W.; organized by J.-P.G., L.-F.Z., and M.-Y.Z. Y.-T.Y. preprocessed the data. All the authors reviewed the manuscript and contributed their part to improve the manuscript. All authors have read and approved the final manuscript.

Funding

This work was funded by [Beijing Open Research Fund for Nanjing Joint Center of Atmospheric Research] grant number [NJCAR2018ZD03]

Acknowledgments

The TPW products were obtained from Remote Sensing System (www.remss.com/). The radiosonde data obtained from University of Wyoming College of Engineering (weather.uwyo.edu/upperair/sounding.html).

Conflicts of Interest

The authors declare that they have no conflicts of interest.

References

  1. Wang, J.; Zhang, L. Climate applications of a global, 2-hourly atmospheric precipitable water dataset derived from IGS tropospheric products. J. Geod. 2009, 83, 209–217. [Google Scholar] [CrossRef] [Green Version]
  2. Mears, C.A.; Santer, B.D.; Wentz, F.J.; Taylor, K.E.; Wehner, M.F. Relationship between temperature and precipitable water changes over tropical oceans. Geophys. Res. Lett. 2007, 34, 497–507. [Google Scholar] [CrossRef]
  3. Mccarthy, M.P.; Thorne, P.W.; Titchner, H.A. An analysis of tropospheric humidity trends from radiosondes. J. Clim. 2009, 22, 5820–5838. [Google Scholar] [CrossRef]
  4. Santer, B.D.; Taylor, K.E.; Gleckler, P.J.; Bonfils, C.; Barnett, T.P.; Pierce, D.M.; Mears, C.; Wentz, F.J.; Brüggemann, W.; Gillett, N.P.; et al. Incorporating model quality information in climate change detection and attribution studies. Proc. Natl. Acad. Sci. USA 2009, 106, 14778–14783. [Google Scholar] [CrossRef] [PubMed] [Green Version]
  5. Van Malderen, R.; Brenot, H.; Pottiaux, E.; Beirle, S.; Hermans, C.; De Mazière, M.; Wagner, T.; De Backer, H.; Bruyninx, C. A multi-site intercomparison of integrated water vapour observations for climate change analysis. Atmos. Meas. Tech. 2014, 7, 1075–1151. [Google Scholar] [CrossRef]
  6. MengistuTsidu, G.; Blumenstock, T.; Hase, F. Observations of precipitable water vapour over complex topography of ethiopia from ground-based GPS, FTIR, radiosonde and ERA-interim reanalysis. Atmos. Meas. Tech. 2015, 8, 3277–3295. [Google Scholar] [CrossRef]
  7. Racette, P.E.; Westwater, E.R.; Han, Y.; Gasiewski, A.J.; Klein, M.; Cimini, D.; David, C.J.; Will, M.; Edward, J.K.; James, R.W.; et al. Measurement of low amounts of precipitable water vapor using ground-based millimeter-wave radiometry. J. Atmos. Ocean. Technol. 2003, 22, 317–337. [Google Scholar] [CrossRef]
  8. Ferrare, R.A.; Melfi, S.H.; Whiteman, D.N.; Evans, K.D.; Schmidlin, F.J.; Starr, D.O. A comparison of water vapor measurements made by ramanlidar and radiosondes. J. Atmos. Ocean. Technol. 1995, 12, 1177–1195. [Google Scholar] [CrossRef]
  9. Behrendt, A.; Wulfmeyer, V.; Girolamo, P.D.; Kiemle, C.; Bauer, H.S.; Schaberl, T.; Summa, D.; Wang, J.; Browell, E.V. Intercomparison of water vapor data measured with lidar during ihop_2002. Part I: Airborne to ground-based lidar systems and comparisons with chilled-mirror hygrometer radiosondes. J. Atmos. Ocean. Technol. 2007, 24, 3–21. [Google Scholar] [CrossRef]
  10. Bokoye, A.I.; Royer, A.; Cliche, P.; O’Neill, N. Calibration of sun radiometer based atmospheric water vapor retrievals using GPS meteorology. J. Atmos. Ocean. Technol. 2007, 24, 964–979. [Google Scholar] [CrossRef]
  11. Van Baelen, J.; Aubagnac, J.P.; Dabas, A. Comparison of near-real time estimates of integrated water vapor derived with GPS, radiosondes, and microwave radiometer. J. Atmos. Ocean. Technol. 2005, 22, 201–210. [Google Scholar] [CrossRef]
  12. Wang, J.; Zhang, L.; Dai, A.; Van Hove, T.; Van Baelen, J. A near-global, 2-hourly data set of atmospheric precipitable water from ground-based GPS measurements. J. Geophys. Res. Atmos. 2007, 112, 236–242. [Google Scholar] [CrossRef]
  13. Bock, O.; Willis, P.; Wang, J.; Mears, C. A high-quality, homogenized, global, long-term (1993–2008) DORIS precipitable water data set for climate monitoring and model verification. J. Geophys. Res. Atmos. 2014, 119, 7209–7230. [Google Scholar] [CrossRef]
  14. Niell, A.E.; Coster, A.J.; Solheim, F.S.; Mendes, V.B.; Toor, P.C.; Langley, R.B.; Upham, C.A. Comparison of measurements of atmospheric wet delay by radiosonde, water vapor radiometer, GPS, and VLBI. J. Atmos. Ocean. Technol. 1972, 18, 830–850. [Google Scholar] [CrossRef]
  15. King, M.D.; Menzel, W.P.; Grant, P.S.; Myers, J.S.; Arnold, G.T.; Platnick, S.E.; Liam, E.; Tsay, S.-I.; Moeller, C.C.; Fitzgerald, M.; et al. Airborne scanning spectrometer for remote sensing of cloud, aerosol, water vapor, and surface properties. J. Geophys. Res. Atmos. 2009, 13, 777–794. [Google Scholar] [CrossRef]
  16. Gunshor, M.M.; Schmit, T.J.; Menzel, W.P. Intercalibration of the infrared window and water vapor channels on operational geostationary environmental satellites using a single polar-orbiting satellite. J. Geophys. Res. Atmos. 2004, 21, 61–68. [Google Scholar] [CrossRef]
  17. Wentz, F.J. A well-calibrated ocean algorithm for special sensor microwave/imager. J. Geophys. Res. Atmos. 1997, 102, 8703–8718. [Google Scholar] [CrossRef]
  18. Soden, B.; Lanzante, J. An Assessment of Satellite and Radiosonde Climatologies of Upper-Tropospheric Water Vapor. J. Climate. 1995, 9, 1235–1250. [Google Scholar] [CrossRef]
  19. Kuo, Y.H.; Schreiner, W.S.; Wang, J.; Rossiter, D.L.; Zhang, Y. Comparison of GPS radio occultation soundings with radiosondes. Geophys. Res. Lett. 2005, 32, 215–236. [Google Scholar] [CrossRef]
  20. Yang, J.; Qiu, J.A. Method for estimating precipitable water and effective water vapor content from ground humidity parameters. Chin. J. Atmos. Sci. 2002, 26, 9–22. [Google Scholar]
  21. Soden, B.J.; Lanzante, J.R. An assessment of satellite and radiosondeclimatologiesof upper-tropospheric water vapor. J. Clim. 1996, 9, 1235–1250. [Google Scholar] [CrossRef]
  22. Wentz, B.F.J.; Meissner, T. Algorithm Theoretical Basis Document (ATBD) Version 2: AMSR Ocean Algorithm (RSS Technology Proposal No.121599A1); Remote Sensing System: Santa Rosa, CA, USA, 2000.
  23. Thao, S.; Eymard, L.; Obligis, E.; Picard, B. Trend and variability of the atmospheric water vapor: A mean sea level issue. J. Atmos. Ocean. Technol. 2014, 31, 1881–1901. [Google Scholar] [CrossRef]
  24. Mears, C.A.; Wang, J.; Smith, D.; Wentz, F.J. Intercomparison of total precipitable water measurements made by satellite-borne microwave radiometers and ground-based GPS instruments. J. Geophys. Res. Atmos. 2015, 120, 2492–2504. [Google Scholar] [CrossRef]
  25. Wentz, F.J. SSM/I Version 7 Calibration Report (RSS Technology Report No. 011012); Remote Sensing System: Santa Rosa, CA, USA, 2013. [Google Scholar] [CrossRef]
  26. Wang, J.; Zhang, L. Systematic errors in global radiosondeprecipitable water data from comparisons with ground-based GPS measurements. J. Clim. 2008, 21, 2218–2238. [Google Scholar] [CrossRef]
  27. Alishouse, J.C.; Snyder, S.A.; Vongsathorn, J.; Ferraro, R.R. Determination of oceanic total precipitable water from the SSM/I. IEEE Trans. Geosci. Remote Sens. 1990, 28, 811–816. [Google Scholar] [CrossRef]
  28. Sohn, B.J.; Smith, E.A. Explaining sources of discrepancy in SSM/I water vapor algorithms. J. Clim. 2003, 16, 3229–3255. [Google Scholar] [CrossRef]
  29. Bock, O.; Bouin, M.; Walpersdorf, A.; Lafore, J.P.; Janicot, S.; Guichard, F.; Agusti-Panareda, A. Comparison of ground-based GPS precipitable water vapour to independent observations and NWP model reanalyses over africa. Q. J. R. Meteorol. Soc. 2010, 133, 2011–2027. [Google Scholar] [CrossRef]
  30. Buehler, S.A.; Stman, S.; Melsheimer, C.; Holl, G.; Eliasson, S.; John, V.O.; Mendrok, J.A. multi-instrument comparison of integrated water vapour measurements at a high latitude site. Atmos. Chem. Phys. Discuss. 2012, 12, 21013–21063. [Google Scholar] [CrossRef]
  31. Wang, Y.; Fu, Y.; Liu, G.; Liu, Q.; Sun, L. A new water vapor algorithm for TRMM microwave imager (TMI) measurements based on a log linear relationship. J. Geophys. Res. Atmos. 2009, 114, 6149–6150. [Google Scholar] [CrossRef]
  32. University of Wyoming College of Engineering/ Upperair Air Data/ Soundings Page. Available online: http://weather.uwyo.edu/upperair/sounding.html (accessed on 11 July 2019).
  33. Thorne, P.W.; Parker, D.E.; Tett, S.F.B.; Jones, P.D.; Mccarthy, M.; Coleman, H.; Brohan, P. Revisiting radiosonde upper air temperatures from 1958 to 2002. J. Geophys. Res. Atmos. 2005, 110, 812–821. [Google Scholar] [CrossRef]
  34. Chelton, D.B.; Esbensen, S.K.; Schlax, M.G.; Thum, N.; Freilich, M.H.; Wentz, F.J.; Schopf, S. Observations of coupling between surface wind stress and sea surface temperature in the eastern tropical pacific. J. Clim. 1913, 14, 1479–1498. [Google Scholar] [CrossRef]
  35. Wang, J. Understanding and Correcting Humidity Measurement ErrorsfromVaisala RS80 and VIZ Radiosondes. (Radiosonde Workshop, Hampton University). Available online: http://www.eol.ucar.edu/homes/junhong/paper/RadiosondeWS02.pdf (accessed on 11 July 2019).
  36. Liu, H.; Tang, S.; Zhang, S.; Hu, J. Evaluation of modis water vapour products over china using radiosonde data. Int. J. Remote Sens. 2015, 36, 680–690. [Google Scholar] [CrossRef]
  37. Vömel, H.; Selkirk, H.; Miloshevich, L.; Valverdecanossa, J.; Valdés, J.; Kyrö, E.; Diaz, J.A. Radiation dry bias of the vaisala RS92 humidity sensor. J. Atmos. Ocean. Technol. 2007, 24, 953–963. [Google Scholar] [CrossRef]
  38. Nash, J.; Smout, R.; Oakley, T.; Pathack, B.; Kurnosenko, S. WMO Intercomparison of High Quality Radiosonde Systems: Final Report. Available online: http://www.wmo.int/pages/prog/www/IMOP/intercomparisons/RSO-2005/RSO-IC-2005_Final_Report.pdf (accessed on 11 July 2019).
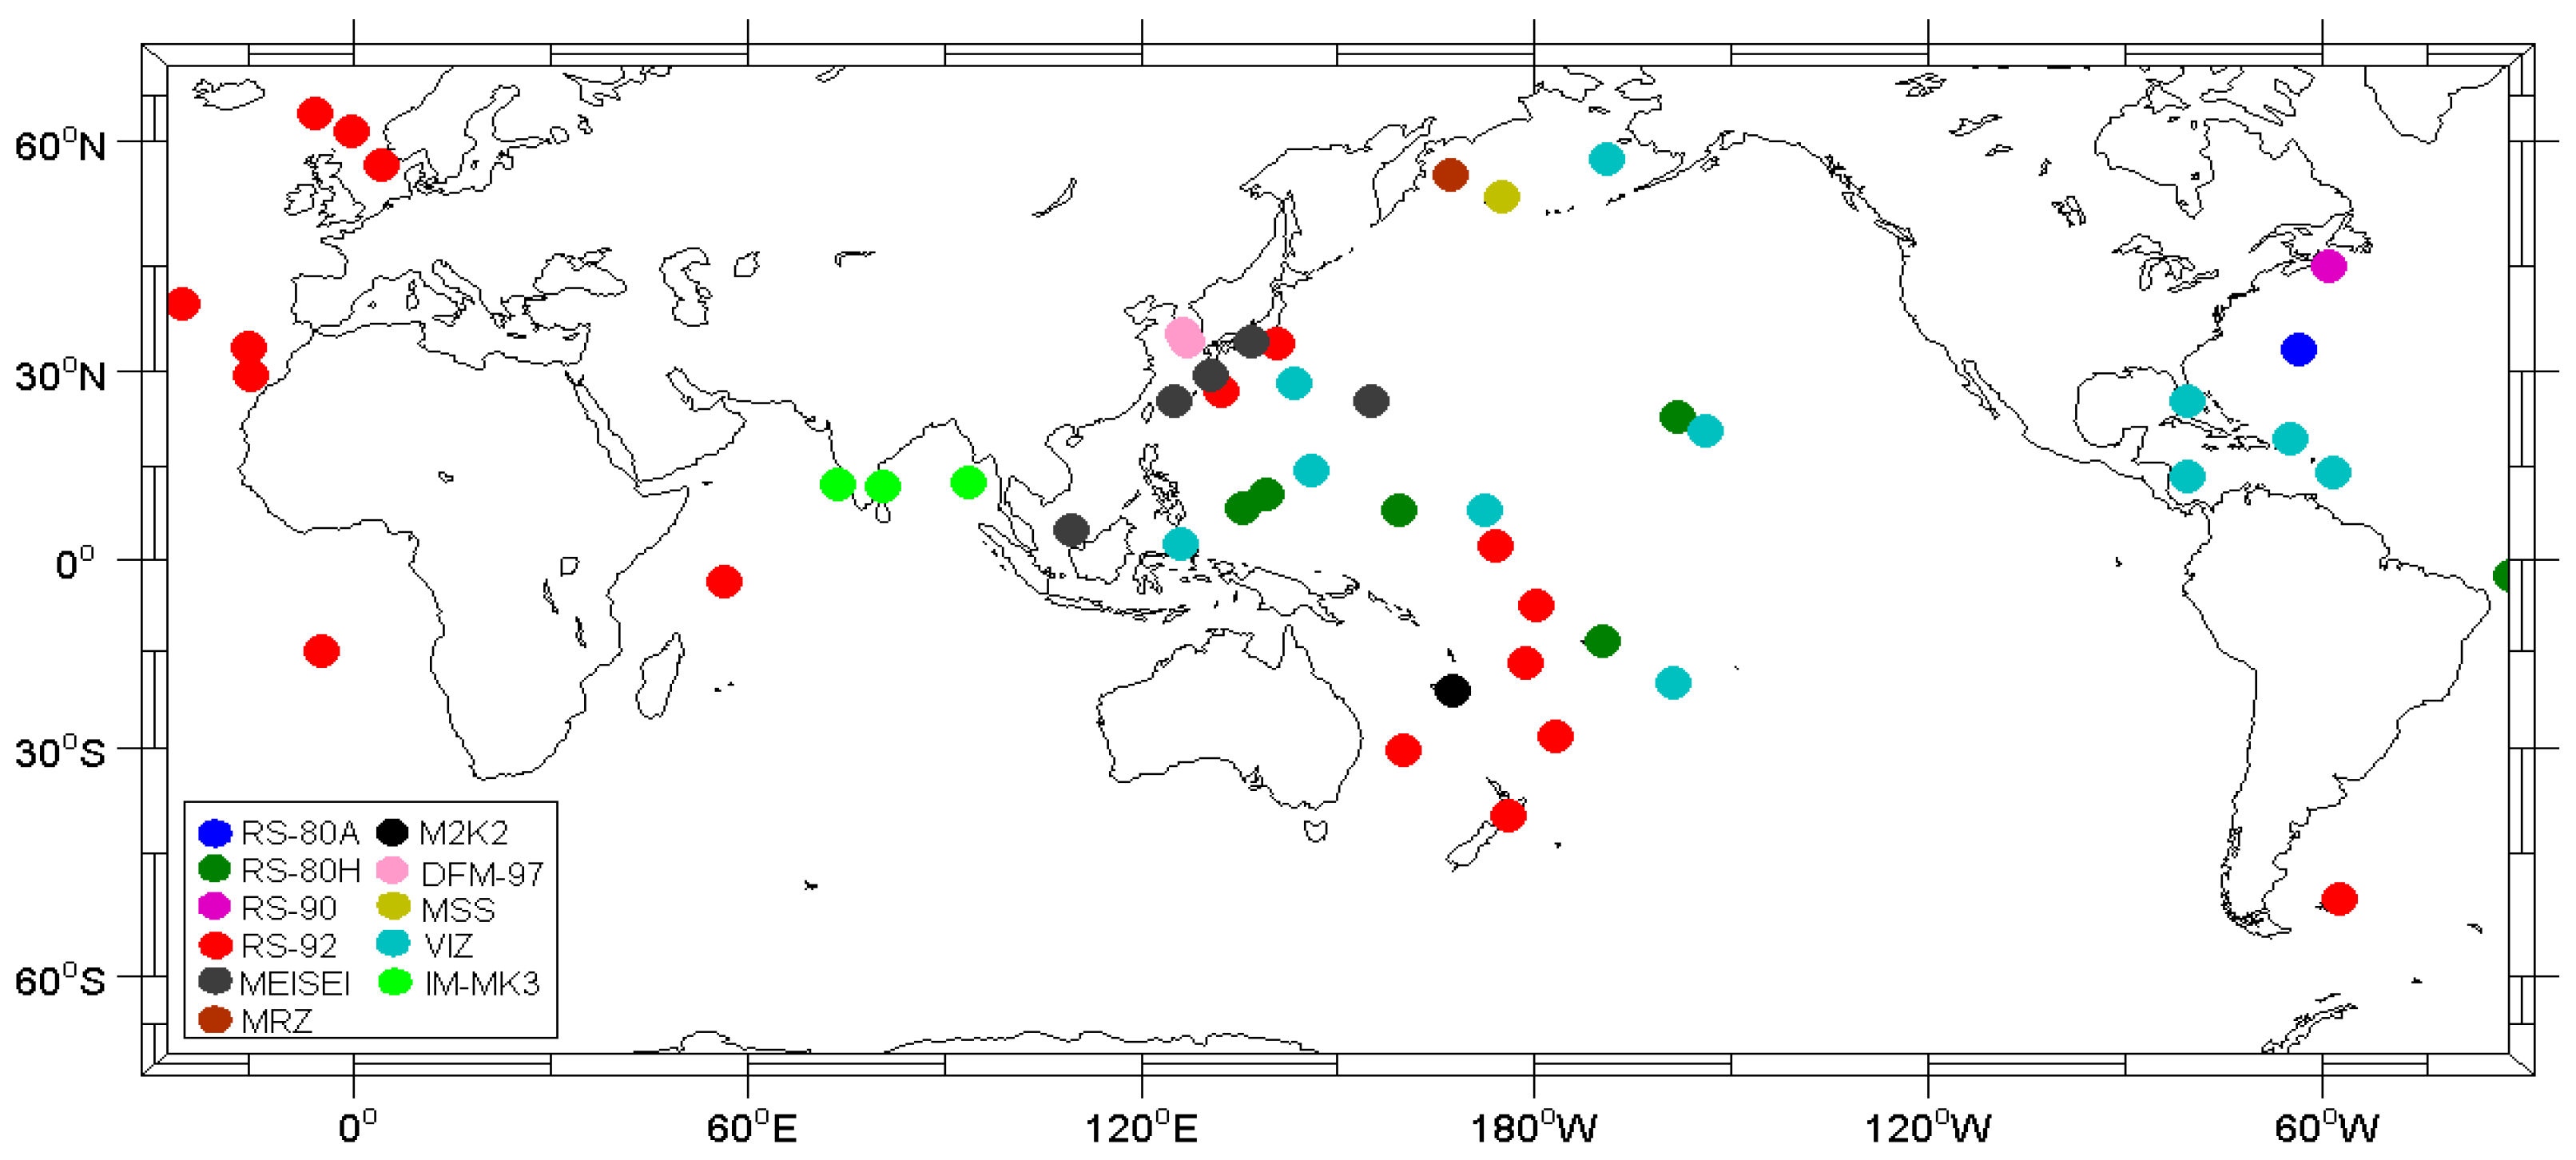
Figure 1. Geographic distribution of matched radiosonde stations. Different colors indicate the 11 sounding types used in the article.
Atmosphere 10 00390 g001
Figure 2. Mean difference as a function of station elevation before (white) and after(black) the altitude correction.
Atmosphere 10 00390 g002
Figure 3. Time series of satellite total precipitable water (TPW), radiosonde TPW, and the differences. (a) for Station WSA (Sable island), (b) for Station VEPB (Blair), (c) for Station WAMM (Menado). Red dots represent satellite TPW retrievals; black dots represent TPW of radiosonde; blue dots represent the difference between them (the former minus the later); light blue lines represent zero. Mean difference, standard deviation of differences, as well as name and radiosonde type of each radiosonde station are marked on each panel.
Atmosphere 10 00390 g003
Figure 4. Summary statistics for TPW differences and mean values for each satellite–radiosonde pair. (a) Mean values of the differences; (b) standard deviations of the differences; (c) mean values of the satellite TPW; (d) relative standard deviations of the differences.
Atmosphere 10 00390 g004
Figure 5. Scatter plots of coincident TPW measurements of the satellites and radiosonde.
Atmosphere 10 00390 g005
Figure 6. Mean values and standard deviations of the TPW differences (Satellite-RS) for 11 radiosonde types.
Atmosphere 10 00390 g006
Figure 7. Mean values and standard deviations of TPW differences as a function of radiosonde TPW in each 3mm TPW bin for each satellite.
Atmosphere 10 00390 g007aAtmosphere 10 00390 g007b
Figure 8. Mean values and standard deviations of TPW differences as a function of (a) wind speed, (b) rain rate, (c) SST (Sea Surface Temperature), and (d) total cloud water. The squares and error bars suggest statistics for mean values and standard deviations of TPW differences, respectively, in each bin of 1 m/s wind speed (a), 0.1 mm/hour rain rate (b), 1K SST (c), and 0.05mm Cloud water (d).
Atmosphere 10 00390 g008aAtmosphere 10 00390 g008b
Figure 9. Summary statistics of TPW day–night differences for each satellite–RS station pair. (a) mean values of the difference for daytime; (b) mean values of the difference for night-time; (c) differences between the mean differences for day and night; (d) differences between the standard deviations for day and night.
Atmosphere 10 00390 g009
Table 1. Satellite instruments used in the article.
SatelliteInstrumentStart DateEnd Date
DMSP-F13SSM/IMay 1995November 2009
DMSP-F14SSM/IMay 1997August 2008
DMSP-F16SSMI/SOctober 2003Present
DMSP-F17SSMI/SDecember 2006Present
NASA AquaAMSR-EJune 2002October 2011
GCOM-W1AMSR-2May 2012Present
GPMGMIFebruary 2014Present
CoriolisWindSatFebruary 2003Present
Table 2. Summary statistics of TPW difference for each satellite during day and night.
Mean.Diff(mm)Std.Diff(mm)
DaytimeNight-TimeDaytimeNight-Time
F130.21−0.212.942.91
F14−0.54−0.502.843.12
F160.42−0.252.902.86
F170.36−0.223.032.90
AMSR-E0.680.113.172.70
AMSR-20.86−0.203.092.73
GMI0.66−0.343.022.77
WindSat0.01−0.802.843.22