Results of Three Years of Ambient Air Monitoring Near a Petroleum Refinery in Richmond, California, USA
Abstract
1. Introduction
2. Materials and Methods
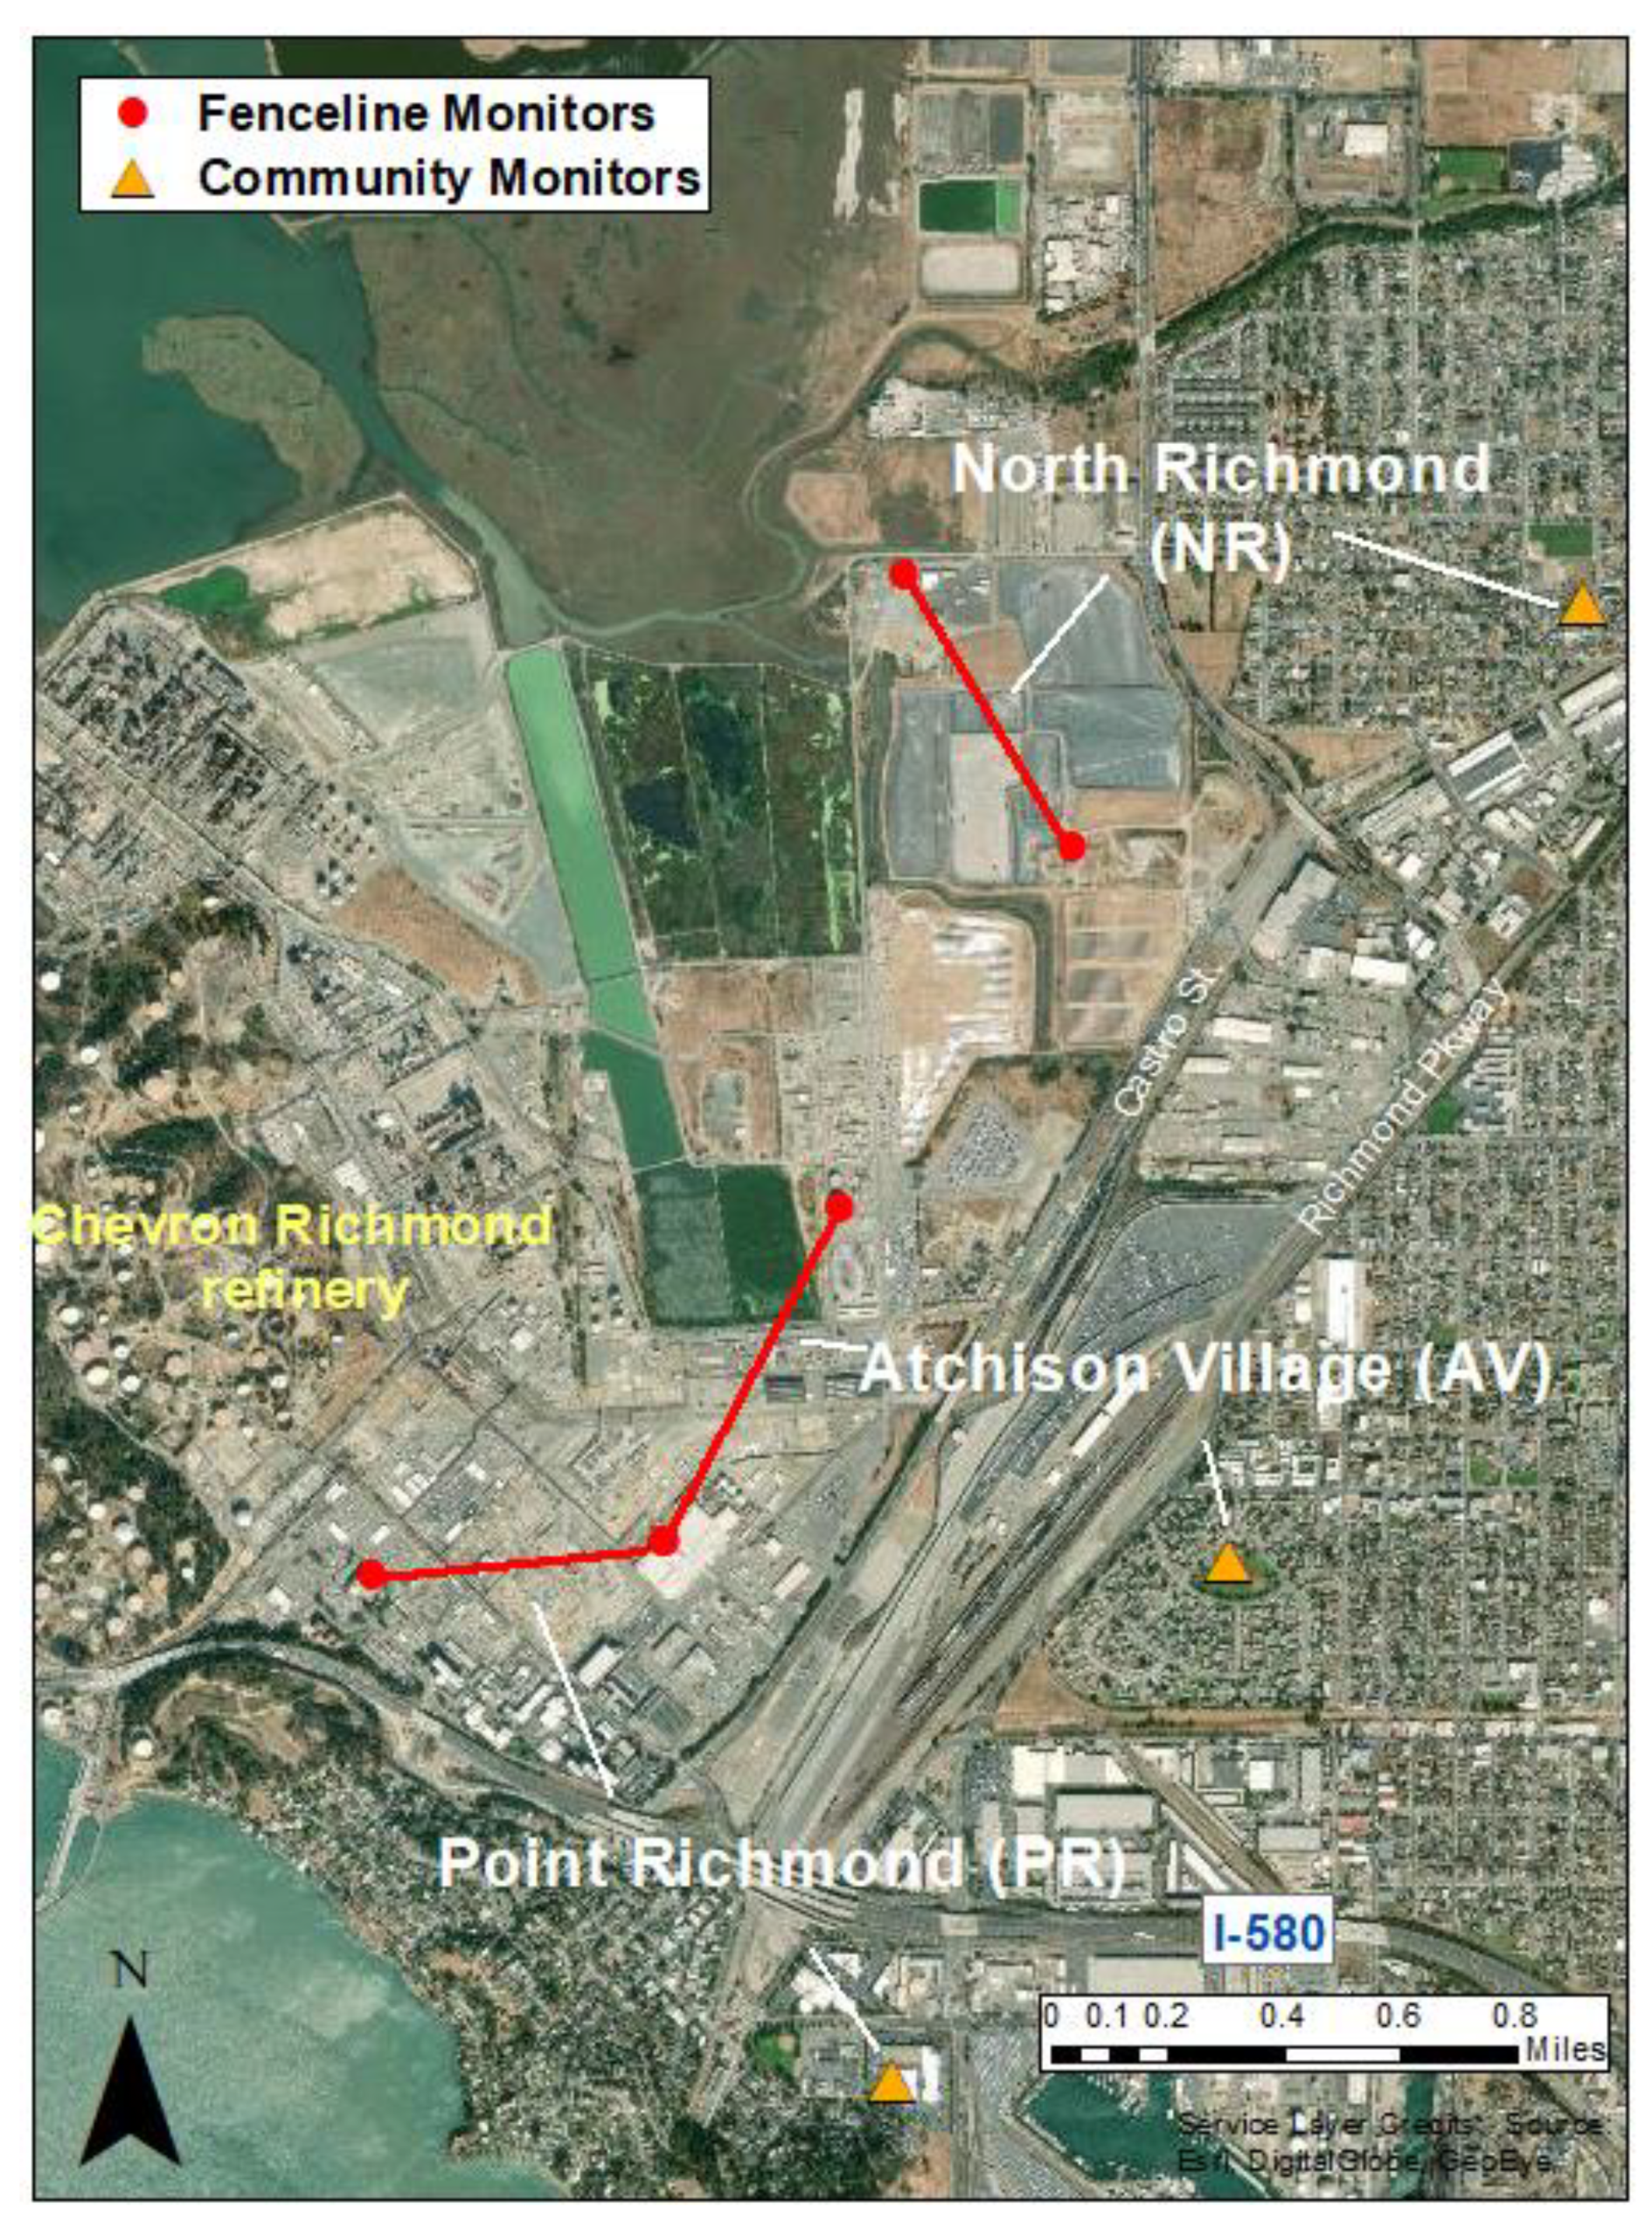
2.1. Description of Monitoring Network
2.2. Selection of Ambient Air Risk Screening Levels
2.3. Source Apportionment Methodologies
2.3.1. Positive Matrix Factorization
2.3.2. Principal Component Analysis
3. Results and Discussions
3.1. Ambient Air Monitoring Results
3.1.1. Community Data Overview
3.1.2. Fenceline Data Overview
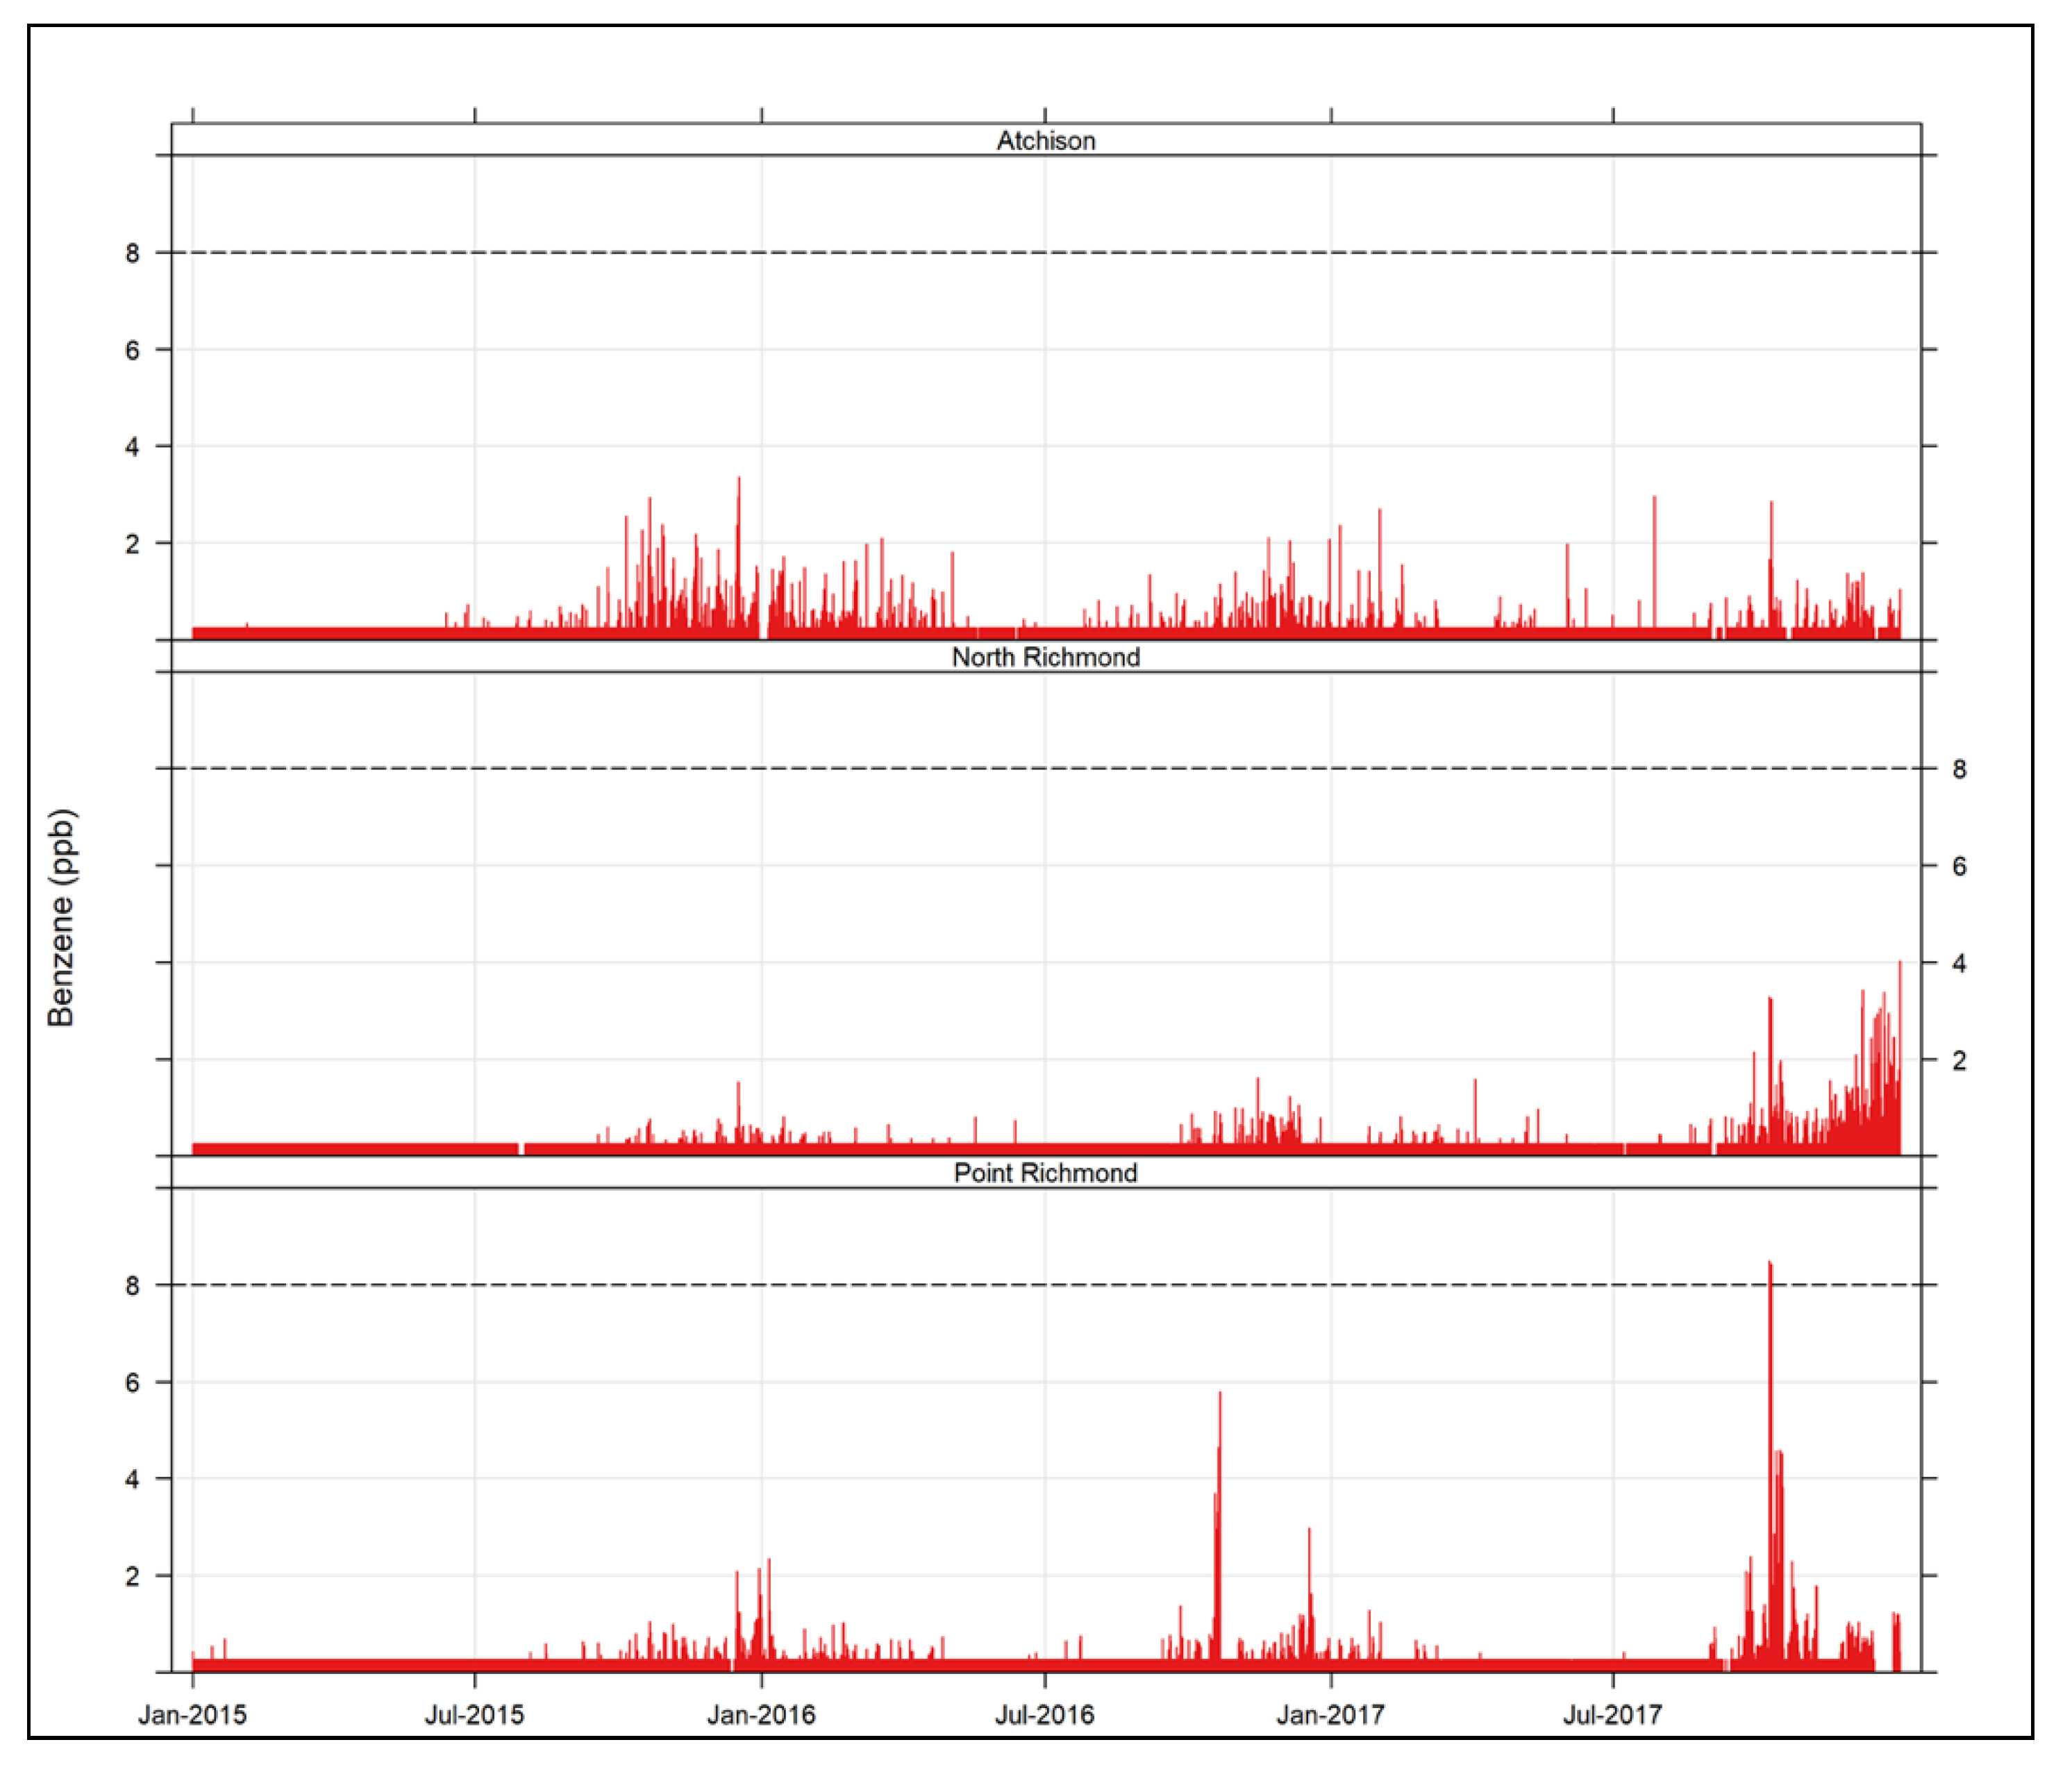
3.1.3. Volatile Organic Compounds (VOC)
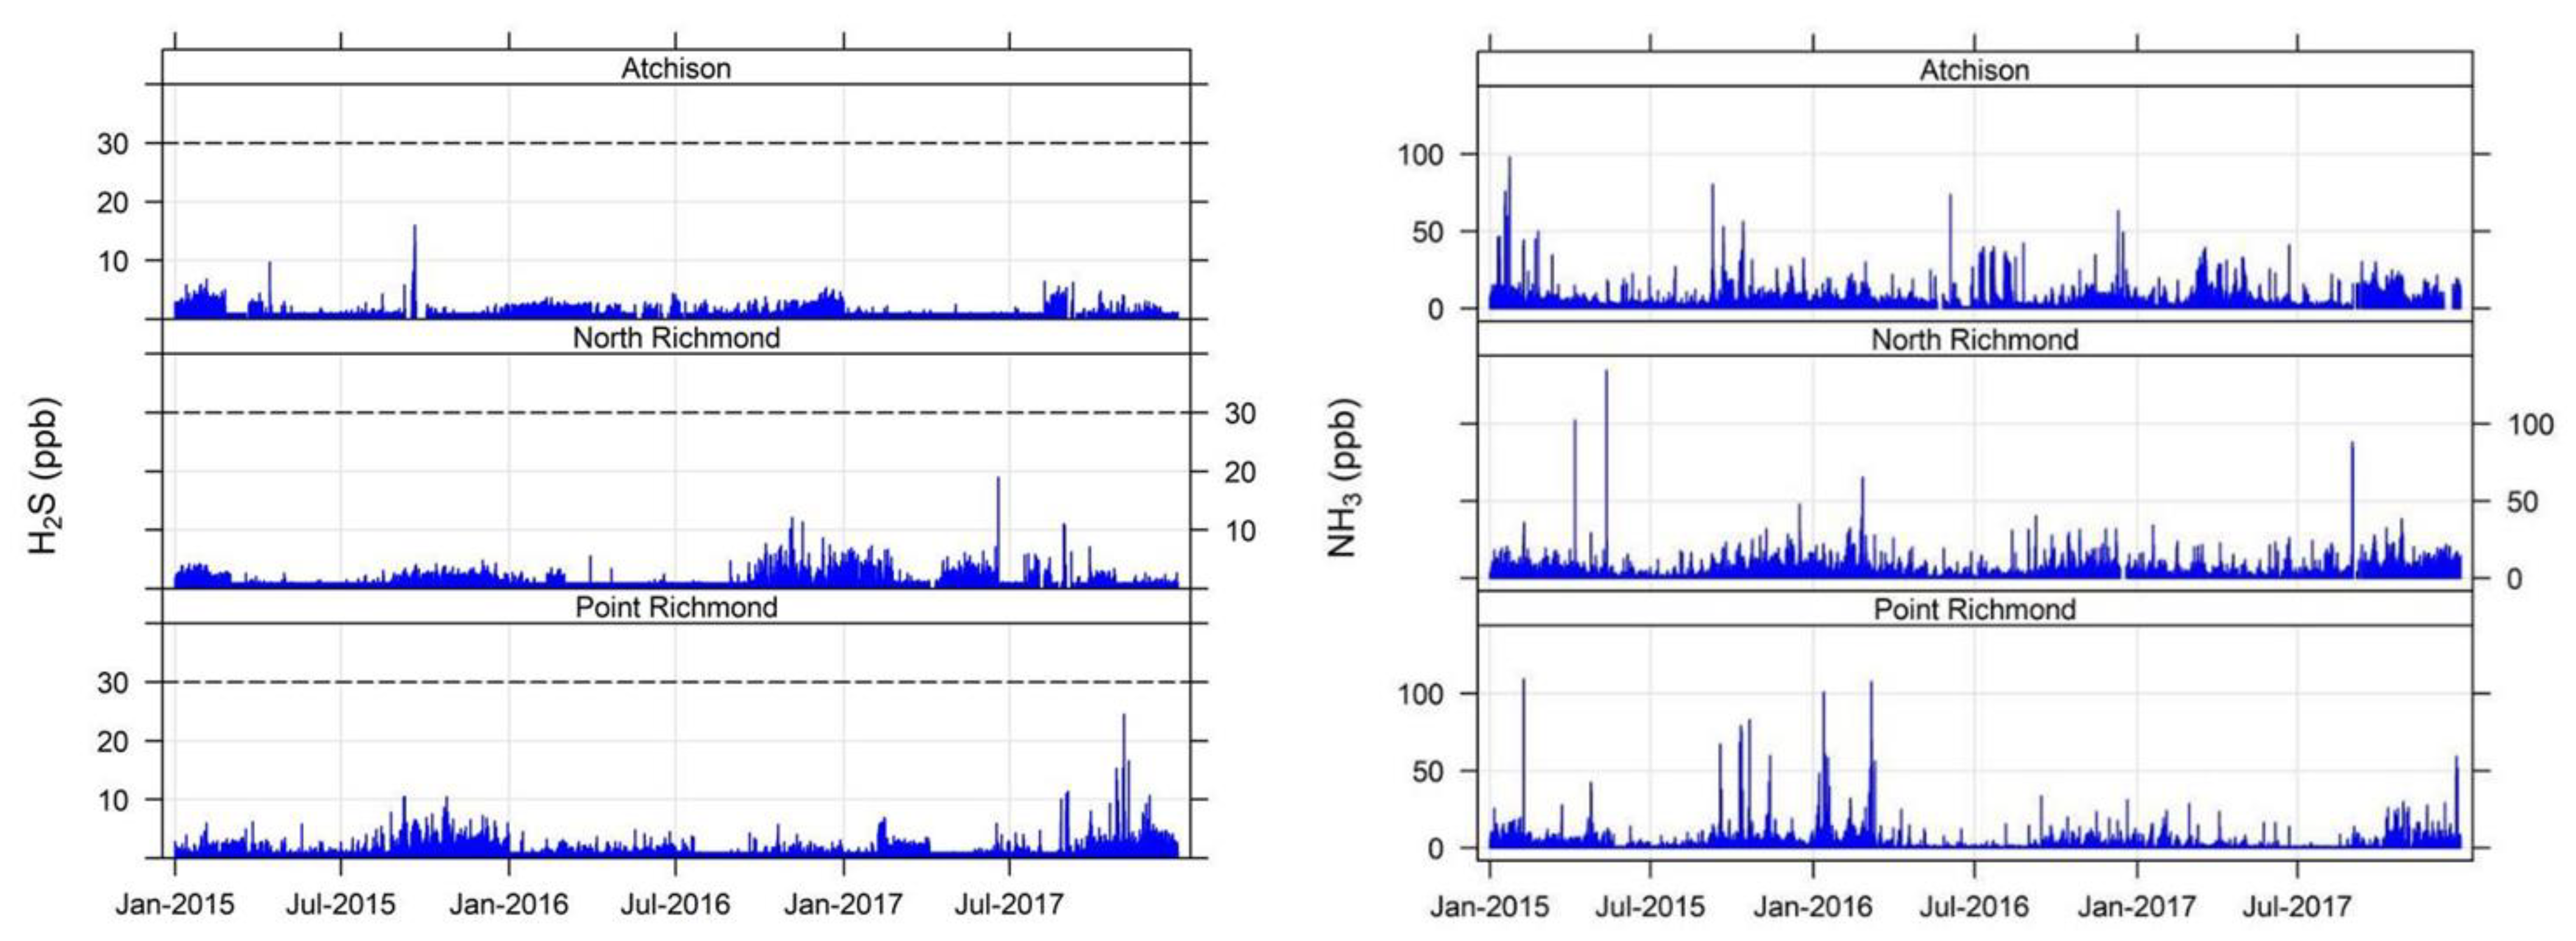
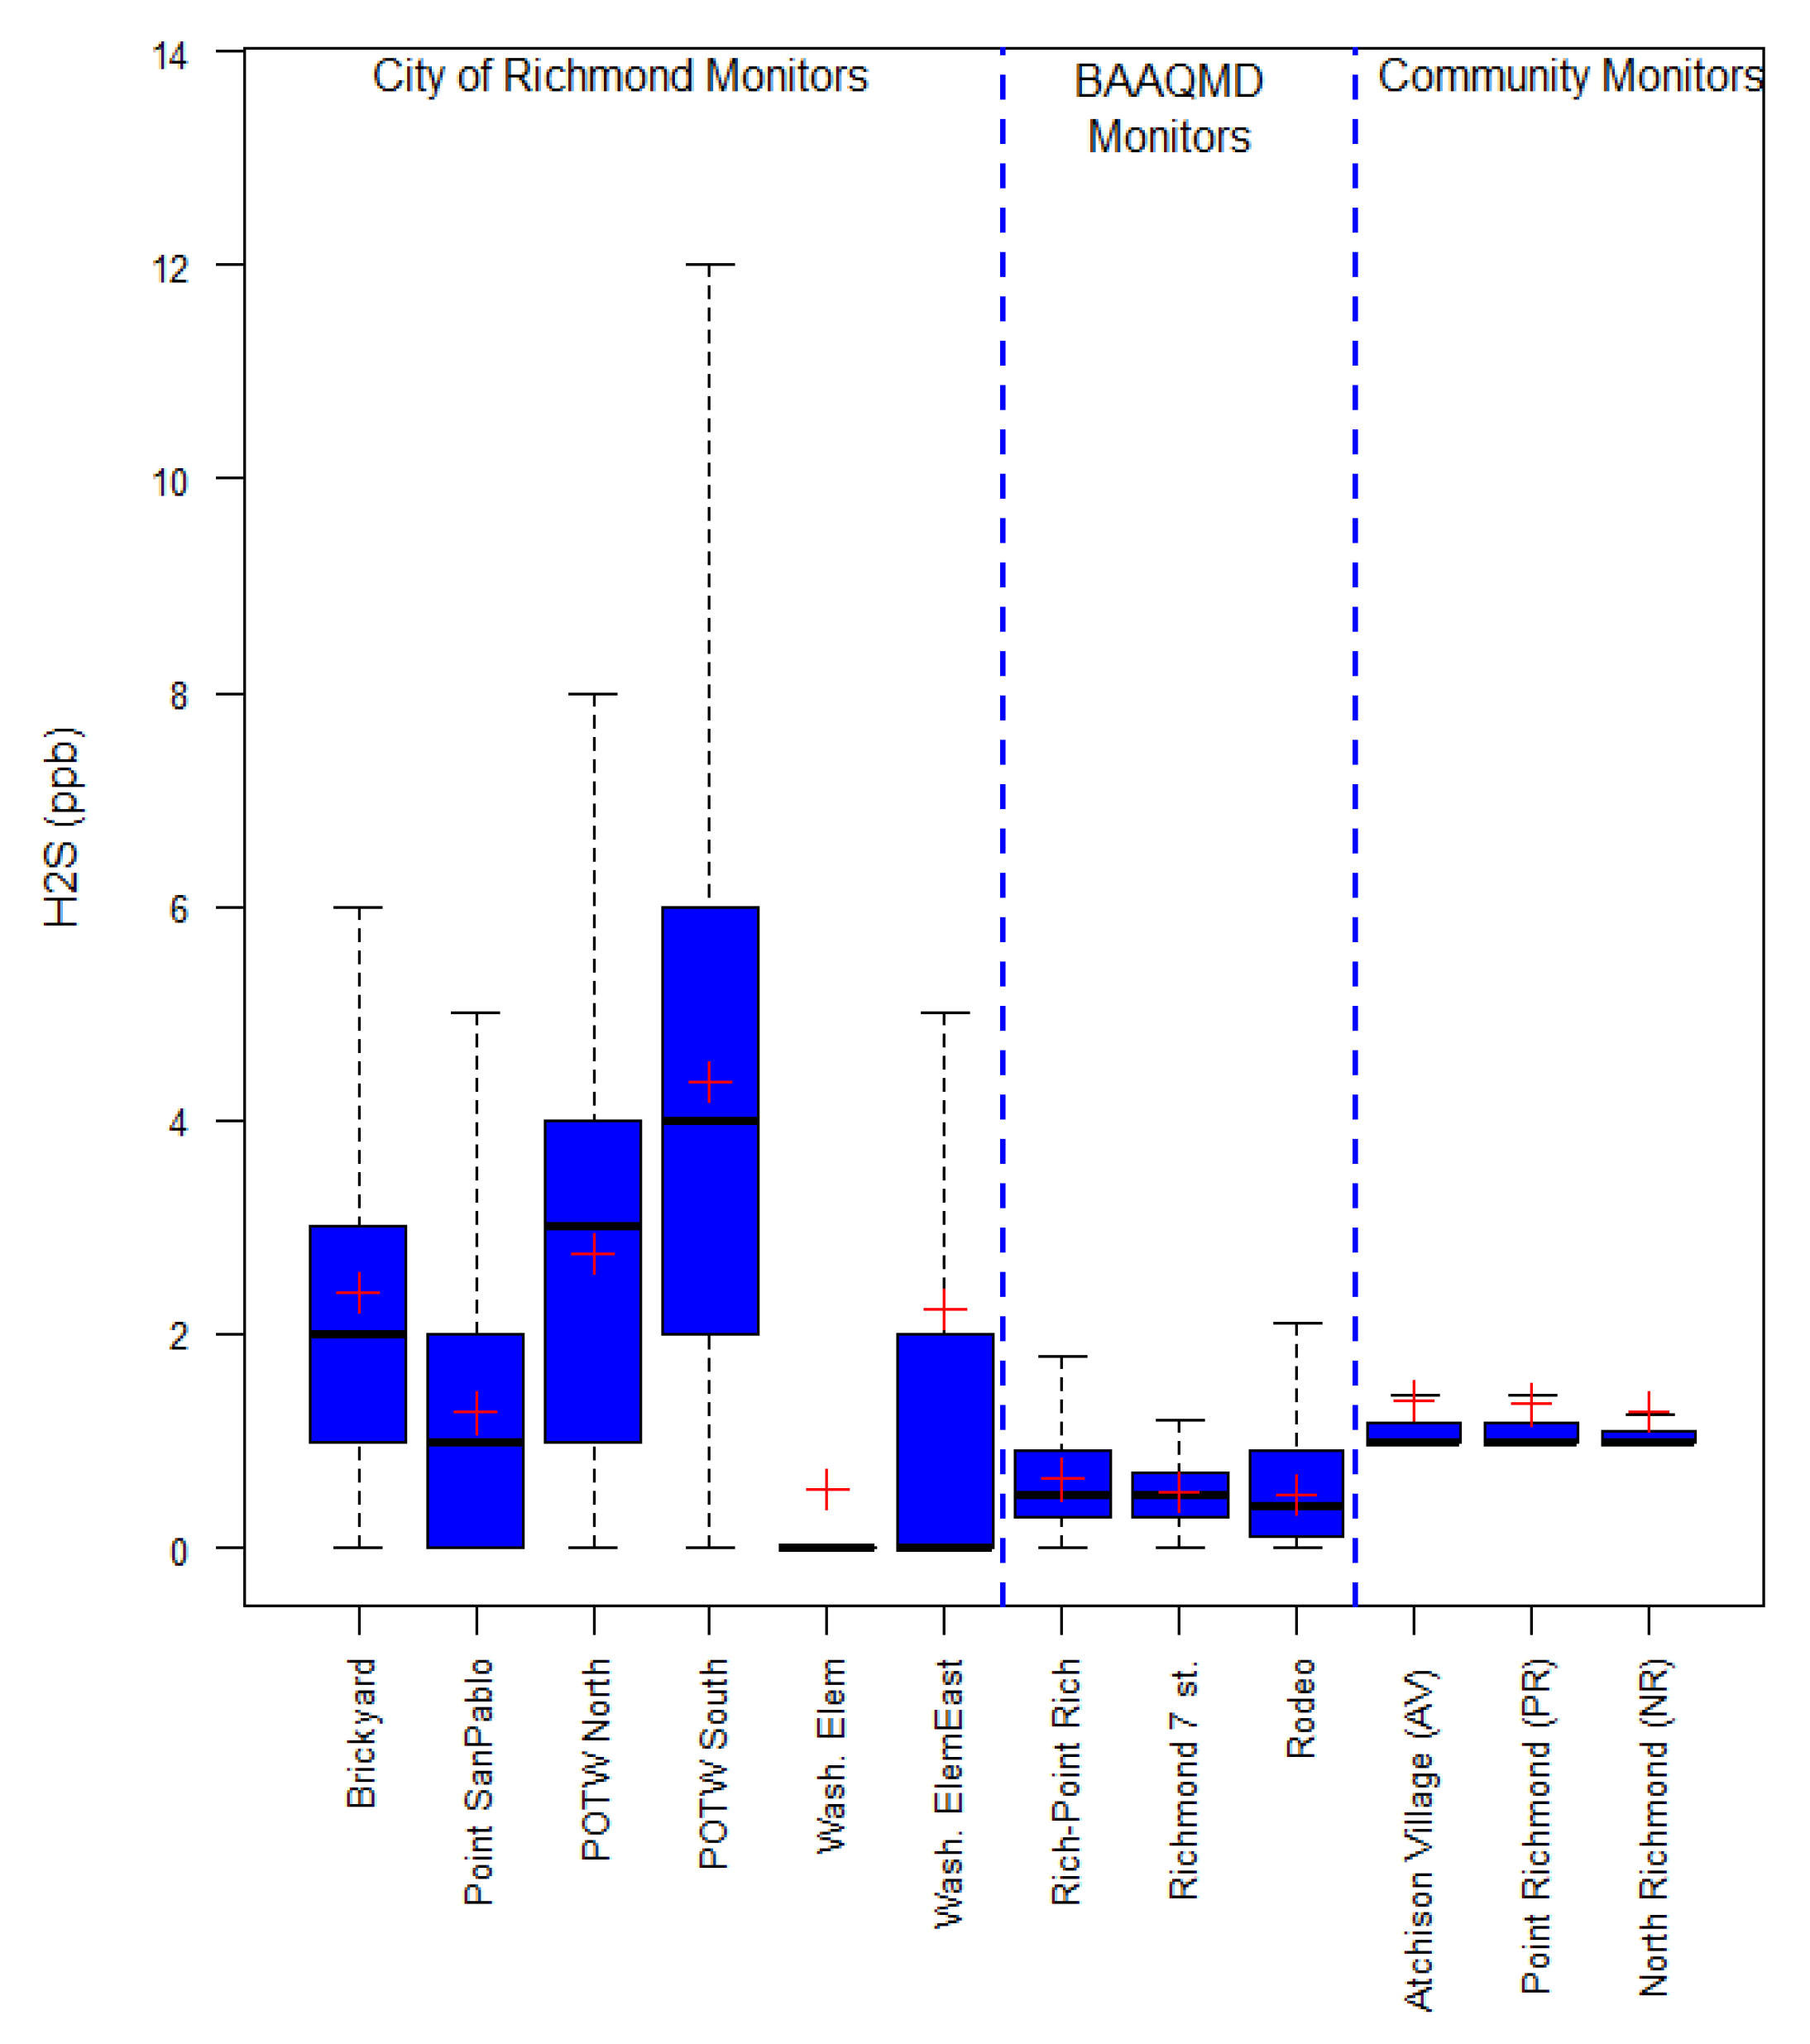
3.1.4. Hydrogen Sulfide and Ammonia
3.1.5. PM2.5 and Black Carbon
3.2. VOC Source Apportionment
3.2.1. Atchison Village
3.2.2. North Richmond
3.2.3. Point Richmond
3.2.4. Inter-site Comparison of VOC source Contributions
4. Conclusions
Supplementary Materials
Author Contributions
Funding
Acknowledgments
Conflicts of Interest
References
- Al-Salem, S.M.; Khan, A.R. Comparative assessment of ambient air quality in two urban areas adjacent to petroleum downstream/upstream facilities in Kuwait. Braz. J. Chem. Eng. 2008, 25, 683–696. [Google Scholar] [CrossRef][Green Version]
- Simpson, I.J.; Marrero, J.E.; Batterman, S.; Meinardi, S.; Barletta, B.; Blake, D.R. Air quality in the Industrial Heartland of Alberta, Canada and potential impacts on human health. Atmos. Environ. 2013, 81, 702–709. [Google Scholar] [CrossRef] [PubMed]
- Pandya, G.H.; Kondawar, V.K.; Gavane, A.G. An integrated investigation of volatile organic compound emission in the atmosphere from refinery and its off-site facilities. Indian J. Chem. Technol. 2007, 14, 283–291. [Google Scholar]
- Baltrenas, P.; Baltrenaite, E.; Sereviciene, V.; Pereira, P. Atmospheric BTEX concentrations in the vicinity of the crude oil refinery of the Baltic region. Environ. Monit. Assess. 2011, 182, 115–127. [Google Scholar] [CrossRef] [PubMed]
- Kalabokas, P.D.; Hatzianestis, J.; Bartzis, J.G.; Papagiannakopoulos, P. Atmospheric concentrations of saturated and aromatic hydrocarbons around a Greek oil refinery. Atmos. Environ. 2001, 35, 2545–2555. [Google Scholar] [CrossRef]
- Zhang, G.; Wang, N.; Jiang, X.; Zhao, Y. Characterization of Ambient Volatile Organic Compounds (VOCs) in the Area Adjacent to a Petroleum Refinery in Jinan, China. Aerosol Air Qual. Res. 2017, 17, 944–950. [Google Scholar] [CrossRef]
- Khanfar, A.R. Impact assessment of ambient air quality by oil refinery: A case study in Kuwait. J. Ind. Pollut. Control 2015, 31, 135–141. [Google Scholar]
- Wallace, H.W.; Sanchez, N.P.; Flynn, J.H.; Erickson, M.H.; Lefer, B.L.; Griffin, R.J. Source apportionment of particulate matter and trace gases near a major refinery near the Houston Ship Channel. Atmos. Environ. 2018, 173, 16–29. [Google Scholar] [CrossRef]
- Gariazzo, C.; Pelliccioni, A.; Di Filippo, P.; Sallusti, F.; Cecinato, A. Monitoring and analysis of volatile organic compounds around an oil refinery. Water Air Soil Pollut. 2005, 167, 17–38. [Google Scholar] [CrossRef]
- Rao, P.S.; Ansari, M.F.; Pipalatkar, P.; Kumar, A.; Nema, P.; Devotta, S. Measurement of particulate phase polycyclic aromatic hydrocarbon (PAHs) around a petroleum refinery. Environ. Monit. Assess. 2008, 137, 387–392. [Google Scholar] [CrossRef]
- Shie, R.-H.; Yuan, T.-H.; Chan, C.-C. Using pollution roses to assess sulfur dioxide impacts in a township downwind of a petrochemical complex. J. Air Waste Manag. Assoc. 2013, 63, 702–711. [Google Scholar] [CrossRef] [PubMed]
- Bozlaker, A.; Buzcu-Guven, B.; Fraser, M.P.; Chellan, S. Insights into PM10 sources in Houston, Texas: Role of petroleum refineries in enriching lanthanoid metals during episodic emission events. Atmos. Environ. 2013, 109–117. [Google Scholar] [CrossRef]
- Wei, W.; Cheng, S.; Li, G.; Wang, G.; Wang, H. Characteristics of volatile organic compounds (VOCs) emitted from a petroleum refinery in Beijing, China. Atmos. Environ. 2014, 89, 358–366. [Google Scholar] [CrossRef]
- Na, K.; Kim, Y.P.; Moon, K.-C.; Moon, I.; Gung, K. Concentrations of volatile organic compounds in an industrial area of Korea. Atmos. Environ. 2001, 35, 2747–2756. [Google Scholar] [CrossRef]
- Chang, C.-C.; Sree, U.; Lin, Y.-S.; Lo, J.-G. An examination of 7:00–9:00 P.M. ambient air volatile organics in different seasons of Kaohsiung city, southern Taiwan. Atmos. Environ. 2005, 39, 867–884. [Google Scholar] [CrossRef]
- Thoma, E.D.; Miller, C.M.; Chung, K.C.; Parsons, N.L.; Shine, B.C. Facility fence-line monitoring using passive samplers. J. Air Waste Manag. Assoc. 2011, 61, 834–842. [Google Scholar] [CrossRef] [PubMed]
- Olaguer, E.P.; Erickson, M.H.; Wijesinghe, A.; Neish, B.S. Source attribution and quantification of benzene event emissions in a Houston ship channel community based on real-time mobile monitoring of ambient air. J. Air Waste Manag. Assoc. 2015, 66, 164–172. [Google Scholar] [CrossRef]
- Sexton, K. Photochemical ozone formation from petroleum refinery emissions. Atmos. Environ. 1983, 17, 467–475. [Google Scholar] [CrossRef]
- Sexton, K.; Westberg, H. Ambient air measurements of petroleum refinery emissions. J. Air Pollut. Control Assoc. 1979, 29, 1149–1152. [Google Scholar] [CrossRef]
- Chambers, A.K.; Strosher, M.; Wootton, T.; Moncrieff, J.; McCready, P. Direct measurement of fugitive emissions of hydrocarbons from a refinery. J. Air Waste Manag. Assoc. 2008, 58, 1047–1056. [Google Scholar] [CrossRef]
- Chen, C.-L.; Shu, C.-M.; Fang, H.-Y. Location and characterization of VOC emissions at a petrochemical plant in Taiwan. Environ. Forensics 2006, 7, 159–167. [Google Scholar] [CrossRef]
- Dumanoglu, Y.; Kara, M.; Altiok, H.; Odabasi, M.; Elbir, T.; Bayram, A. Spatial and seasonal variation and source apportionment of volatile organic compounds (VOCs) in a heavily industrialized region. Atmos. Environ. 2014, 98, 168–178. [Google Scholar] [CrossRef]
- Sanchez, M.; Karnae, S.; John, K. Source Characterization of Volatile Organic Compounds Affecting the Air Quality in a Coastal Urban Area of South Texas. Int. J. Environ. Res. Public Health 2008, 5, 130–138. [Google Scholar] [CrossRef] [PubMed]
- Fujita, E.M. Hydrocarbon source apportionment for the 1996 Paso del Norte ozone study. Sci. Total Environ. 2001, 276, 171–184. [Google Scholar] [CrossRef]
- Leuchner, M.; Rappengluck, B. VOC source-receptor relationships in Houston during TExAQS-II. Atmos. Environ. 2010, 44, 4056–4067. [Google Scholar] [CrossRef]
- Xue, Y.; Ho, S.S.H.; Huang, Y.; Li, B.; Wang, L.; Dai, W.; Cao, J.; Lee, S. Source apportionment of VOCs and their impacts on surface ozone in an industry city of Baoji, Northwestern China. Sci. Rep. 2017, 7, 9979. [Google Scholar] [CrossRef] [PubMed]
- Lin, T.-Y.; Sree, U.; Tseng, S.-H.; Vhiu, K.H.; Wu, C.-H.; Lo, J.-G. Volatile organic compound concentrations in ambient air of Kaohsiung petroleum refinery in Taiwan. Atmos. Environ. 2004, 38, 4111–4122. [Google Scholar] [CrossRef]
- Chen, M.-J.; Lin, C.-H.; Lai, C.-H.; Cheng, L.-H.; Yang, Y.-H.; Huang, L.-J.; Yeh, S.-H.; Hsu, H.-T. Excess lifetime cancer risk assessment of volatile organic compounds emitted from a petrochemical an industrial complex. Aerosol Air Qual. Res. 2016, 16, 1954–1966. [Google Scholar] [CrossRef]
- Mintz, R.; McWhinney, R.D. Characterization of volatile organic compound emission sources in Fort Saskatchewan, Alberta using principal component analysis. J. Atmos. Chem. 2008, 60, 83–101. [Google Scholar] [CrossRef]
- California Assembly Bill No. 617. Non-Vehicular Air Pollution: Criteria Air Pollutants and Air Toxic Contaminants. Published on 26 July 2017. Available online: https://leginfo.legislature.ca.gov/faces/billNavClient.xhtml?bill_id=201720180AB617 (accessed on 5 September 2018).
- Fenceline Monitoring Plans. Available online: http://www.baaqmd.gov/plans-and-climate/emission-tracking-and-monitoring/fenceline-monitoring-plans (accessed on 5 September 2018).
- California Environmental Protection Agency, Office of Environmental Health Hazard Assessment. Analysis of Refinery Chemical Emissions and Health Effects. 2019. Available online: https://oehha.ca.gov/media/downloads/faqs/refinerychemicalsreport092717.pdf (accessed on 3 March 2019).
- Smith, B. Richmond Chevron Tax Settlement Agreement Community Air Monitoring Work Plan for Monitoring Section I (v). 2012. Available online: http://www.ci.richmond.ca.us/DocumentCenter/View/26764/RichmondCommunity-Air-Monitoring-Workplan11712withapp?bidId= (accessed on 5 October 2018).
- Richmond Community Air Monitoring Program Website. Available online: http://www.fenceline.org/richmond/ (accessed on 5 September 2018).
- NAAQS Table. Available online: https://www.epa.gov/criteria-air-pollutants/naaqs-table (accessed on 5 September 2018).
- BAAQMD, Bay Area Air Quality Management District. Regulation 12–15. Available online: http://www.baaqmd.gov/rules-and-compliance/current-rules/regulation-12-rule-15-archive (accessed on 10 October 2018).
- California Environmental Protection Agency, Office of Environmental Health Hazard Assessment. OEHHA Acute, 8-h and Chronic REL Summary. Available online: https://oehha.ca.gov/air/general-info/oehha-acute-8-hour-and-chronic-reference-exposure-level-rel-summary (accessed on 10 October 2018).
- Hopke, P. A Guide to Positive Matrix Factorization. Available online: https://www3.epa.gov/ttnamti1/files/ambient/pm25/workshop/laymen.pdf (accessed on 30 October 2018).
- Polissar, A.V.; Hopke, P.; Paatero, P.; Malm, W.C.; Sisler, J.F. Atmospheric aerosol over Alaska 2. Elemental composition and sources. J. Geophys. Res. 1998, 103, 19045–19057. [Google Scholar] [CrossRef]
- Maroto, A.; Bosque, R.; Heyden, Y.V. Estimating uncertainty. LC GC Eur. 2008, 21, 628–631. [Google Scholar]
- Leong, Y.J.; Sanchez, N.P.; Wallace, H.W.; Karakurt Cevik, B.; Hernandez, C.S.; Han, Y.; Flynn, J.H.; Massoli, P.; Floerchinger, C.; Fortner, E.C.; et al. Overview of surface measurements and spatial characterization of submicrometer particulate matter during the DISCOVER-AQ campaign in Houston, TX. J. Air Waste Manag. Assoc. 2017, 67, 854–872. [Google Scholar] [CrossRef] [PubMed]
- Thurstone, L.L. The vectors of mind. Psychol. Rev. 1934, 41. [Google Scholar] [CrossRef]
- USEPA. Guideline on Data Handling Conventions for the 8-h Ozone NAAQS. 1998. Available online: https://www3.epa.gov/ttn/naaqs/aqmguide/collection/cp2_old/19981201_oaqps_epa-454_r-99-017.pdf (accessed on 30 January 2019).
- Texas Commission on Environmental Quality. Air Monitoring Sites. Available online: https://www.tceq.texas.gov/airquality/monops/sites (accessed on 30 January 2019).
- Helsel, D.R. Less than obvious; statistical treatment of data below the detection limit. Environ. Sci. Technol. 1990, 24, 1767–1774. [Google Scholar] [CrossRef]
- Mass, C.F.; Ovens, D. The Northern California wildfires of 8–9 October 2017: The role of a major downslope wind event. Bull. Am. Meteorol. Soc. 2018. [Google Scholar] [CrossRef]
- Urbanski, S.P.; Hao, W.M.; Baker, S. Chemical composition of wildland fire emissions. Dev. Environ. Sci. 2009, 8, 79–107. [Google Scholar] [CrossRef]
- Lewis, A.C.; Evans, M.J.; Hopkins, J.R.; Punjabi, S.; Read, K.A.; Purvis, R.M.; Andrews, S.J.; Moller, S.J.; Carpenter, L.J.; Lee, J.D.; et al. The influence of biomass burning on the global distribution of selected non-methane organic compounds. Atmos. Chem. Phys. 2013, 13, 851–867. [Google Scholar] [CrossRef]
- BAAQMD, Bay Area Air Quality Management District. Air Monitoring Data. Available online: http://www.baaqmd.gov/about-air-quality/current-air-quality/air-monitoring-data?DataViewFormat=daily&DataView=aqi&StartDate=6/9/2019&ParameterId=&StationId=2036 (accessed on 10 September 2018).
- BAAQMD, Bay Area Air Quality Management District. 2017 Air Monitoring Network Plan. 2018. Available online: http://www.baaqmd.gov/~/media/files/technical-services/2017_network_plan_20180701-pdf.pdf?la=en (accessed on 10 September 2018).
- Fujita, E.; Campbell, D.E.; Desert Research Institute. Review of Current Air Monitoring Capabilities Near Refineries in the San Francisco Bay Area. 2013. Available online: http://councilofindustries.org/wp-content/uploads/2013/06/BAAQMD-Comm-Monitoring-DRI-Report_2013.pdf (accessed on 14 February 2019).
- USEPA. Sampling Methods for HAPS (Core HAPS and VOCs). 2019. Available online: https://aqs.epa.gov/aqsweb/documents/codetables/methods_haps.html (accessed on 27 December 2018).
- Gong, L.; Lewicki, R.; Griffin, R.J.; Flynn, J.H.; Lefer, B.L.; Tittel, F.K. Atmospheric ammonia measurements in Houston, TX using an external cavity quantum cascade laser-based sensor. Atmos. Chem. Phys. 2001, 11, 9721–9733. [Google Scholar] [CrossRef]
- Kourtidis, K.; Kelesis, A.; Maggana, M.; Petrakakis, M. Substantial traffic emissions contribution to the global H2S budget. Geophys. Res. Lett. 2004, 31. [Google Scholar] [CrossRef]
- Richmond H2S Monitoring. Available online: https://www.mysmartcover.com/h2s/map.php (accessed on 12 September 2018).
- California Air Resources Board. California Ambient Air Quality Standards (CAAQS). Available online: https://www.arb.ca.gov/research/aaqs/caaqs/caaqs.htm (accessed on 30 October 2018).
- South Coast Air Quality Management District. Multiple Air Toxics Exposure Study in the South Coast Air Basin. 2015. Available online: http://www.aqmd.gov/docs/default-source/air-quality/air-toxic-studies/mates-iv/mates-iv-final-draft-report-4-1-15.pdf?sfvrsn=7 (accessed on 31 October 2018).
- Brito, J.; Carbone, S.; dos Santos, D.A.M.; Dominutti, P.; de Oliveira Alves, N.; Rizzo, L.V.; Artaxo, P. Disentangling vehicular emission impact on urban air pollution using ethanol as a tracer. Sci. Rep. 2018, 8, 10679. [Google Scholar] [CrossRef]
- Titos, G.; Lyamani, H.; Drinovec, L.; Olmo, F.J.; Mocnik, G. Evaluation of the impact of transportation changes on air quality. Atmos. Environ. 2015, 114, 19–31. [Google Scholar] [CrossRef]
- Uria-Tellaetxe, I.; Carslaw, D.C. Conditional bivariate probability function for source identification. Environ. Model. Softw. 2014, 59, 1–9. [Google Scholar] [CrossRef]
- Lai, C.-H.; Chuang, K.-Y.; Chang, J.-W. Source apportionment of volatile organic compounds at an international airport. Aerosol Air Qual. Res. 2013, 13, 689–698. [Google Scholar] [CrossRef]
- Liu, Y.; Shao, M.; Fu, L.; Lu, S.; Zeng, L.; Tang, D. Source profiles of volatile organic compounds (VOCs) measured in China: Part, I. Atmos. Environ. 2008, 42, 6247–6260. [Google Scholar] [CrossRef]
- Chang, C.-C.; Wang, J.-L.; Liu, S.-C.; Lung, S.-H.C. Assessment of vehicular and non-vehicular contributions to hydrocarbons using exclusive vehicular indicators. Atmos. Environ. 2006, 40, 6349–6361. [Google Scholar] [CrossRef]
- USEPA. SPECIATE 4.5 Database. 2016. Available online: https://www.epa.gov/air-emissions-modeling/speciate-version-45-through-40 (accessed on 27 September 2018).
- Cai, H.; Xie, S.D. Tempo-spatial variation of emission inventories of speciated volatile organic compounds from on-road vehicles in China. Atmos. Chem. Phys. 2009, 9, 6983–7002. [Google Scholar] [CrossRef]
- Na, K.; Moon, K.-C.; Kin, Y.P. Source contribution to aromatic VOC concentration and ozone formation potential in the atmosphere of Seoul. Atmos. Environ. 2005, 39, 5517–5524. [Google Scholar] [CrossRef]
- Watson, J.G.; Chow, J.C.; Fujita, E.M. Review of volatile organic compound source apportionment by chemical mass balance. Atmos. Environ. 2001, 35, 1567–1584. [Google Scholar] [CrossRef]
- Duffy, B.L.; Nelson, P.F.; Ye, Y.; Weeks, I.A. Speciated hydrocarbon profiles and calculated reactivities of exhaust and evaporative emissions from 82 in-use light-duty Australian vehicles. Atmos. Environ. 1999, 33, 291–307. [Google Scholar] [CrossRef]
- Wang, X. Analysis of Ambient VOCs Levels and Potential Sources in Windsor. Ph.D. Thesis, University of Windsor, Windsor, ON, Canada, 2014. [Google Scholar]
- Song, Y.; Shao, M.; Liu, Y.; Lu, S.; Kuster, W.; Goldan, P.; Xie, S. Source apportionment of ambient volatile organic compounds in Beijing. Environ. Sci. Technol. 2007, 41, 4348–4353. [Google Scholar] [CrossRef]
- Yuan, Z.; Lau, A.K.H.; Shao, M.; Louie, P.K.K.; Liu, S.C.; Zhu, T. Source analysis of volatile organic compound by positive matrix factorization in urban and rural environments in Beijing. J. Geophys. Res. 2009, 114. [Google Scholar] [CrossRef]
- Borbon, A.; Locoge, N.; Veillerot, M.; Gallo, J.C.; Guillermo, R. Characterization of in a French urban atmosphere: Overview of the main sources. Sci. Total Environ. 2002, 292, 177–191. [Google Scholar] [CrossRef]
- Belalcazar, L.C.; Fuhrer, O.; Ho, M.D.; Zarate, E.; Clappier, A. Estimation of road traffic factors from a long-term tracer study. Atmos. Environ. 2009, 43, 5830–5837. [Google Scholar] [CrossRef]
- Hwa, M.-Y.; Hsieh, C.-C.; Wu, T.-C.; Chang, L.-F.W. Real-world vehicle emissions and VOC profile in the Taipei tunnel located at Taiwan Taipei area. Atmos. Environ. 2002, 36, 1993–2002. [Google Scholar] [CrossRef]
- Rivas, I.; Kumar, P.; Hagen-Zanker, A.; Andrade, M.D.F.; Slovic, A.D.; Pritchard, J.P.; Geurs, K.T. Determinants of black carbon, particle mass and number concentrations in London transport microenvironments. Atmos. Environ. 2017, 161, 247–262. [Google Scholar] [CrossRef]
- Xie, Y.; Berkowitz, C.M. The use of positive matrix factorization with conditional probability functions in air quality studies: An application to hydrocarbon emissions in Houston, Texas. Atmos. Environ. 2006, 40, 3070–3091. [Google Scholar] [CrossRef]
- Na, K.; Kim, Y.P.; Moon, K.C. Diurnal characteristics of volatile organic compounds in the Seoul atmosphere. Atmos. Environ. 2003, 37, 733–742. [Google Scholar] [CrossRef]
- Yuan, B.; Shao, M.; Lu, S.; Wang, B. Source profiles of volatile organic compounds associated with solvent use in Beijing, China. Atmos. Environ. 2010, 44, 1919–1926. [Google Scholar] [CrossRef]
- Zhang, R.; Wang, G.; Guo, S.; Zamora, M.L.; Ying, Q.; Lin, Y.; Wang, W.; Hu, M.; Wang, Y. Formation of urban fine particulate matter. Chem. Rev. 2015, 115, 3803–3855. [Google Scholar] [CrossRef]
- Tang, J.H.; Chu, K.W.; Chan, L.Y.; Chen, Y.J. Non-methane hydrocarbon emission profiles from printing and electronic industrial processes and its implications on the ambient atmosphere in the Pearl River Delta, South China. Atmos. Pollut. Res. 2014, 5, 151–160. [Google Scholar] [CrossRef]
- USEPA. OPPT Chemical Fact Sheet-Chemicals in the Environment: 1,2,4-Trimethylbenzene. 1994. Available online: https://semspub.epa.gov/work/05/914913.pdf (accessed on 15 November 2018).
| Community Monitor | Date | Benzene (ppb) | Toluene (ppb) | Ethylbenzene (ppb) | m,p- xylene (ppb) | o-xylene (ppb) |
|---|---|---|---|---|---|---|
| Atchison Village | 2015 | 0.28 | 0.45 | 0.25 | 0.32 | 0.57 |
| 2016 | 0.27 | 0.50 | 0.26 | 0.29 | 0.74 | |
| 2017 | 0.27 | 0.42 | 0.26 | 0.27 | 1.13 | |
| North Richmond | 2015 | 0.25 | 0.29 | 0.25 | 0.26 | 0.31 |
| 2016 | 0.26 | 0.33 | 0.25 | 0.26 | 0.36 | |
| 2017 | 0.32 | 0.48 | 0.26 | 0.29 | 1.37 | |
| Point Richmond | 2015 | 0.26 | 0.32 | 0.25 | 0.27 | 0.25 |
| 2016 | 0.28 | 0.37 | 0.25 | 0.27 | 0.25 | |
| 2017 | 0.31 | 0.41 | 0.25 | 0.28 | 0.27 | |
| Chronic REL | Yearly | 0.93 | 70 | 460 | 200 | 200 |
| Community Monitor | Year | Ammonia (ppb) | Hydrogen Sulfide (ppb) | BC (µg/m3) | PM2.5 (µg/m3) |
|---|---|---|---|---|---|
| Atchison Village | 2015 | 5.8 | 1.45 | 0.53 | 7.7 |
| 2016 | 6.2 | 1.58 | 0.32 | 8.1 | |
| 2017 | 6.3 | 1.11 | 0.25 | 8.4 | |
| North Richmond | 2015 | 4.4 | 1.35 | 0.47 | 9.0 |
| 2016 | 4.4 | 1.19 | 0.47 | 7.7 | |
| 2017 | 5.1 | 1.30 | 0.49 | 10.0 | |
| Point Richmond | 2015 | 4.0 | 1.50 | 0.43 | 7.2 |
| 2016 | 3.3 | 1.08 | 0.36 | 7.0 | |
| 2017 | 2.6 | 1.44 | 0.45 | 8.7 | |
| Chronic exposure thresholds | Yearly Avg. | 287 a | 7 a | b | 12 c |
| Community Monitor | |||
|---|---|---|---|
| PMF Factor | Atchison Village | North Richmond | Point Richmond |
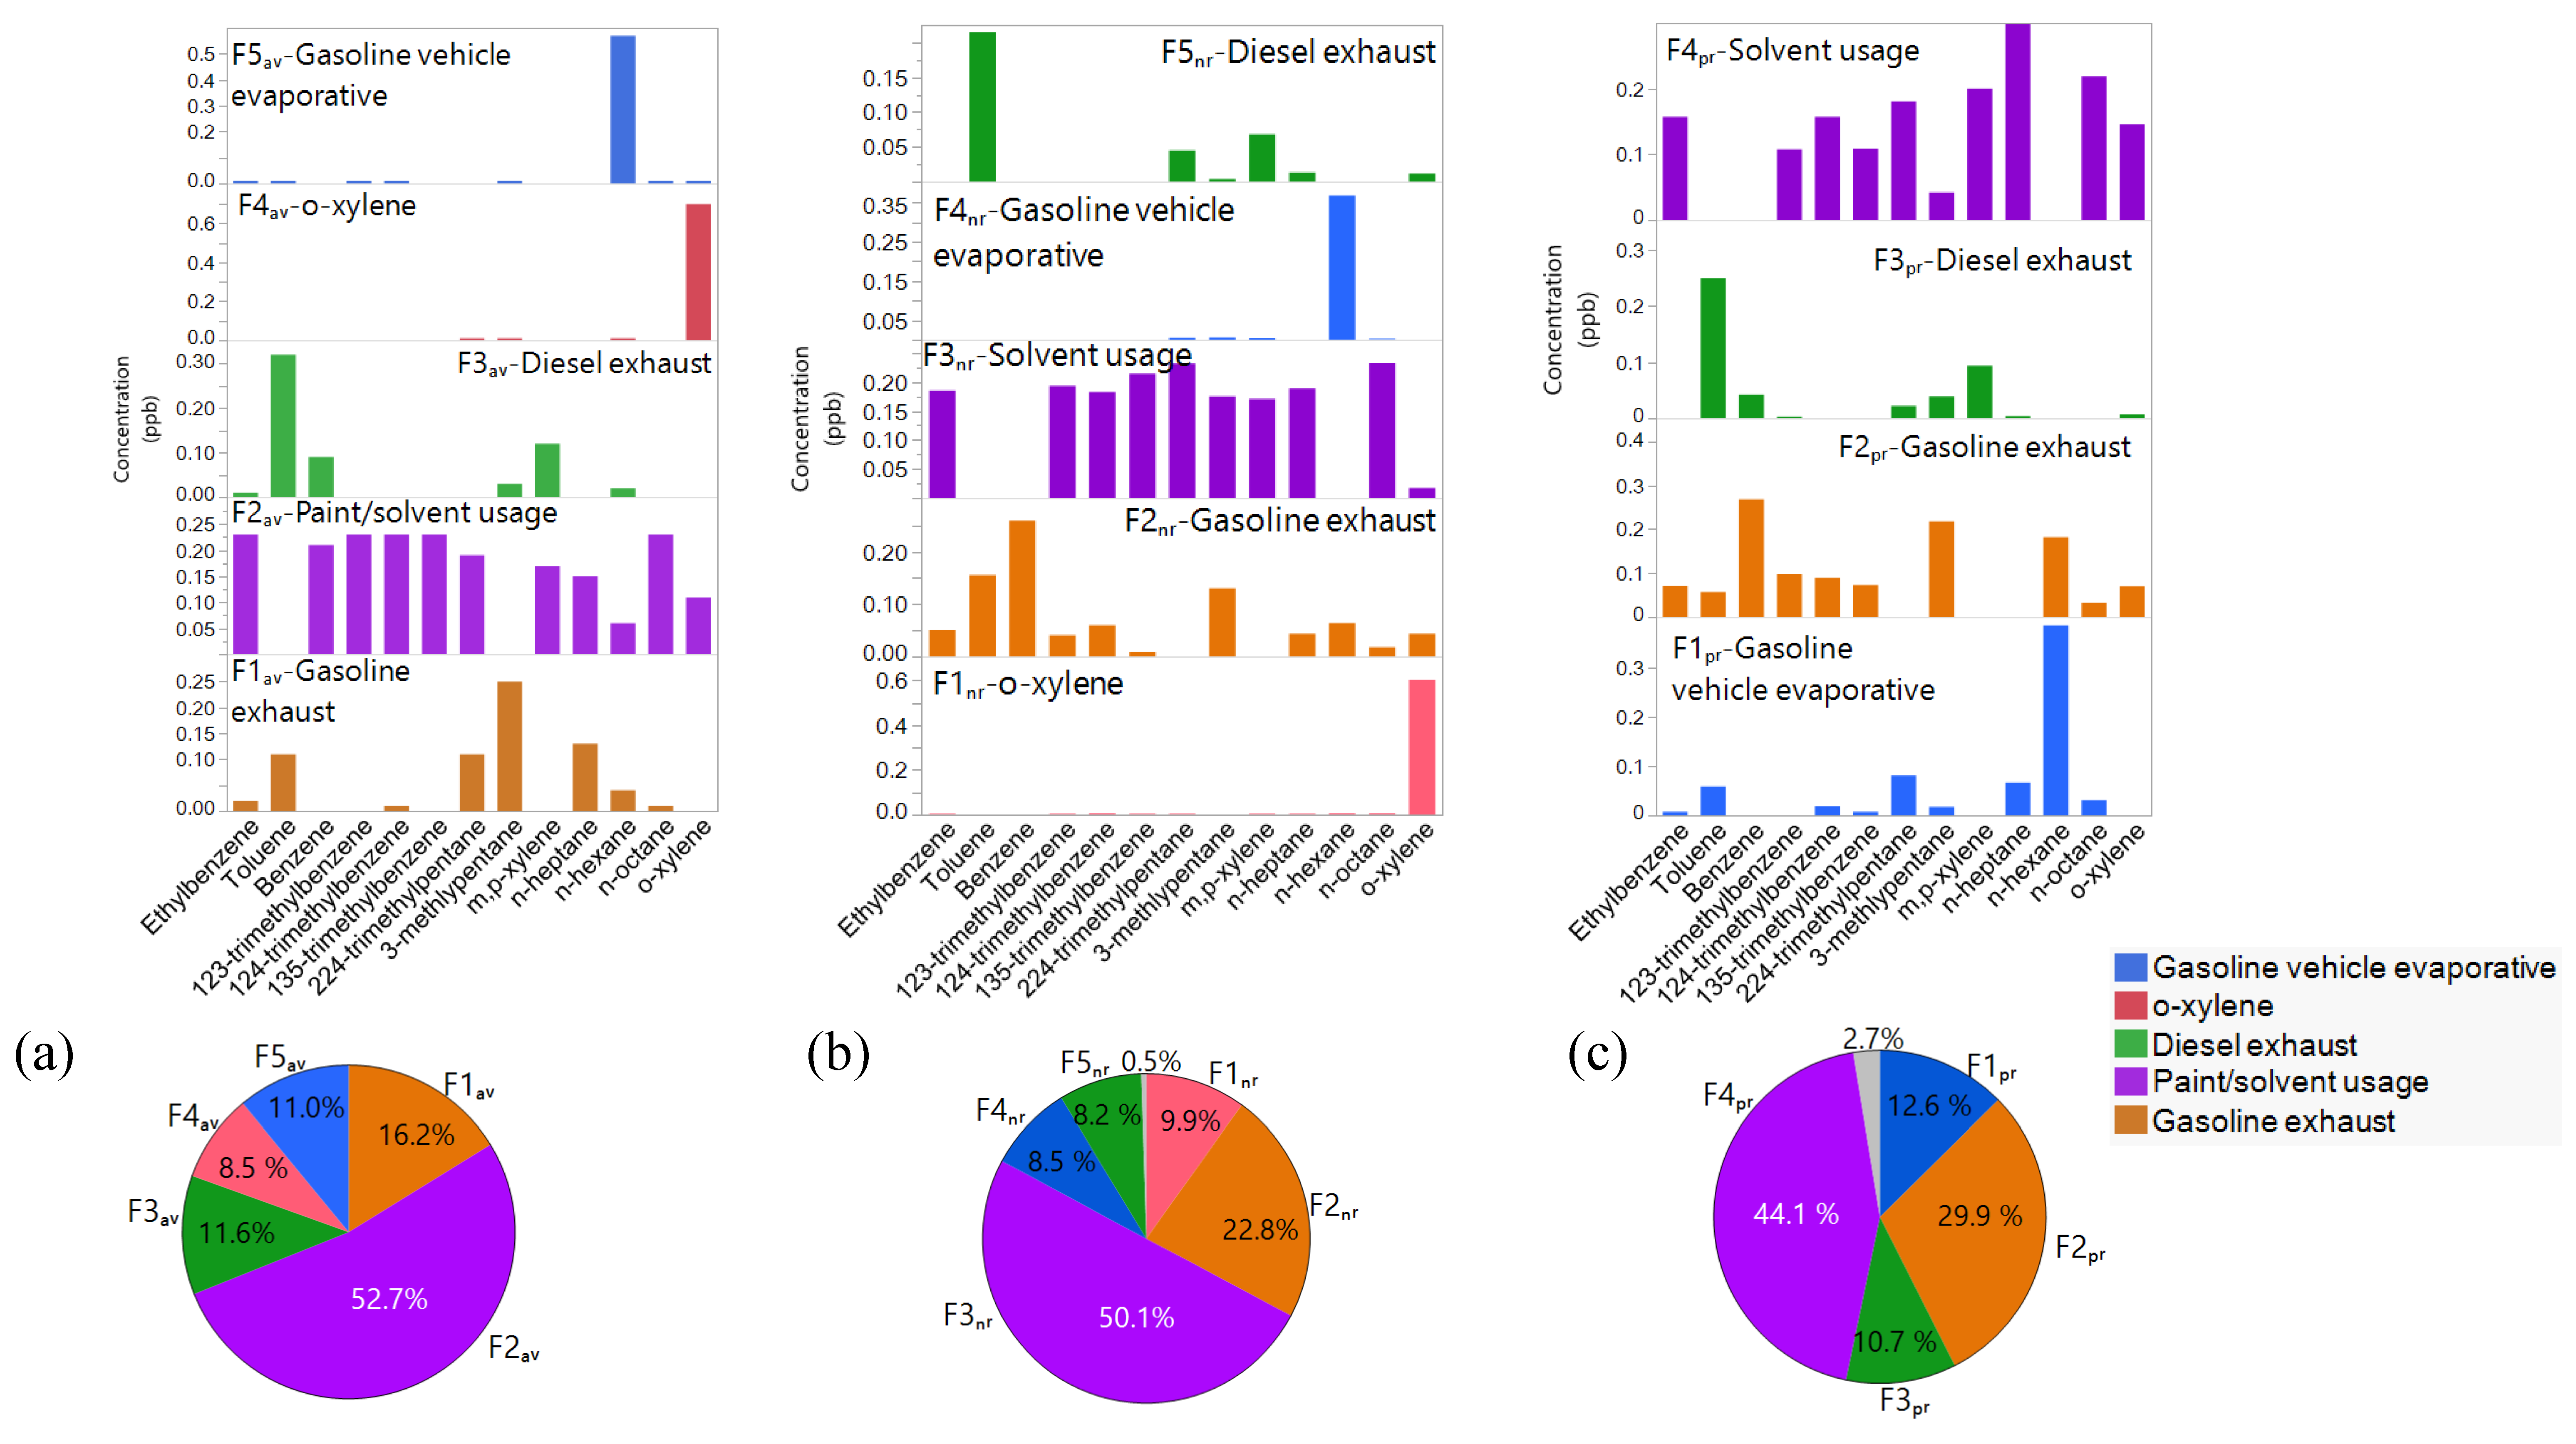
| Vehicle gasoline exhaust | 16.2 | 22.8 | 29.9 |
| Vehicle diesel exhaust | 11.6 | 8.5 | 10.7 |
| Gasoline vehicle evaporative | 11.0 | 8.2 | 12.6 |
| Paint/Solvent usage | 52.7 | 50.1 | 44.1 |
| Unidentified (o-xylene) | 8.5 | 9.9 | ---- |
| Unexplained | ---- | 0.5 | 2.7 |
| Aggregated traffic contributions | 38.8 | 39.9 | 55.1 |
© 2019 by the authors. Licensee MDPI, Basel, Switzerland. This article is an open access article distributed under the terms and conditions of the Creative Commons Attribution (CC BY) license (http://creativecommons.org/licenses/by/4.0/).
Share and Cite
Sanchez, N.P.; Saffari, A.; Barczyk, S.; Coleman, B.K.; Naufal, Z.; Rabideau, C.; Pacsi, A.P. Results of Three Years of Ambient Air Monitoring Near a Petroleum Refinery in Richmond, California, USA. Atmosphere 2019, 10, 385. https://doi.org/10.3390/atmos10070385
Sanchez NP, Saffari A, Barczyk S, Coleman BK, Naufal Z, Rabideau C, Pacsi AP. Results of Three Years of Ambient Air Monitoring Near a Petroleum Refinery in Richmond, California, USA. Atmosphere. 2019; 10(7):385. https://doi.org/10.3390/atmos10070385
Chicago/Turabian StyleSanchez, Nancy P., Arian Saffari, Stephanie Barczyk, Beverly K. Coleman, Ziad Naufal, Christopher Rabideau, and Adam P. Pacsi. 2019. "Results of Three Years of Ambient Air Monitoring Near a Petroleum Refinery in Richmond, California, USA" Atmosphere 10, no. 7: 385. https://doi.org/10.3390/atmos10070385
APA StyleSanchez, N. P., Saffari, A., Barczyk, S., Coleman, B. K., Naufal, Z., Rabideau, C., & Pacsi, A. P. (2019). Results of Three Years of Ambient Air Monitoring Near a Petroleum Refinery in Richmond, California, USA. Atmosphere, 10(7), 385. https://doi.org/10.3390/atmos10070385


