Numerical Modeling of Meteotsunami–Tide Interaction in the Eastern Yellow Sea

Abstract
1. Introduction
2. Data and Model Description
2.1. Atmospheric Modeling Configuration
2.2. Wave Modeling Configuration
2.3. Tide Modeling Configuration
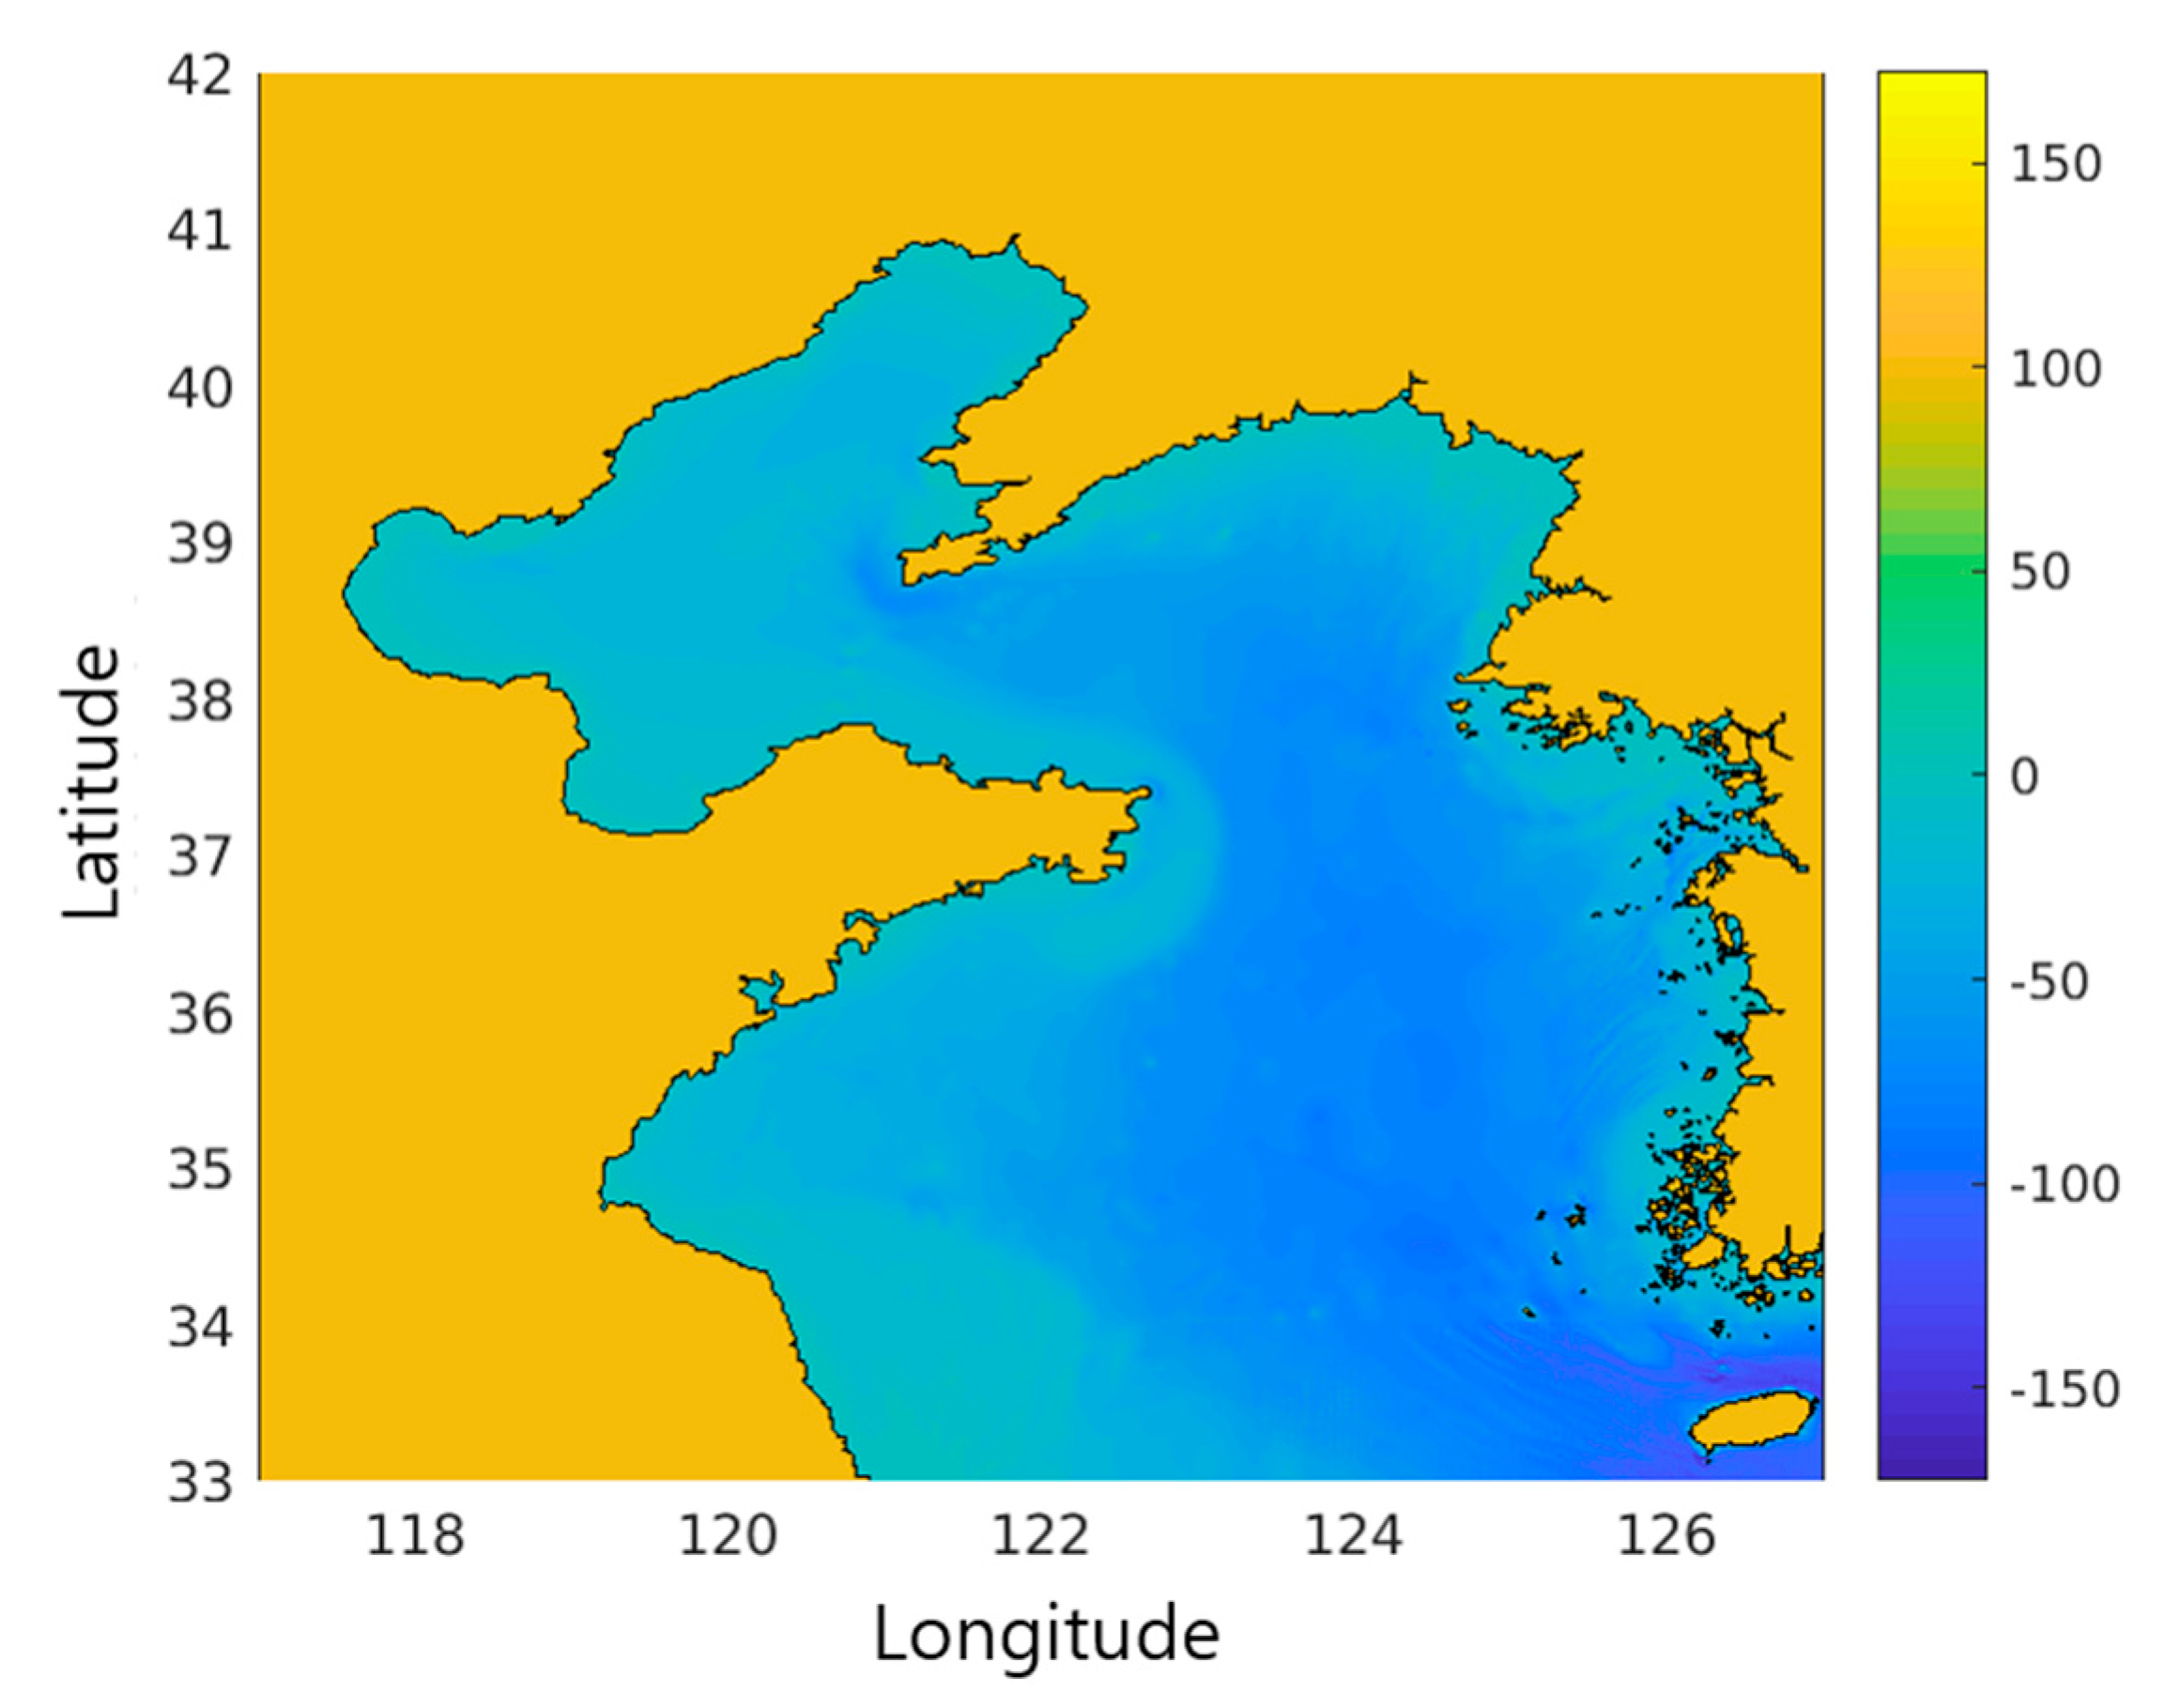
2.4. Computational Setup
3. Experimental Cases
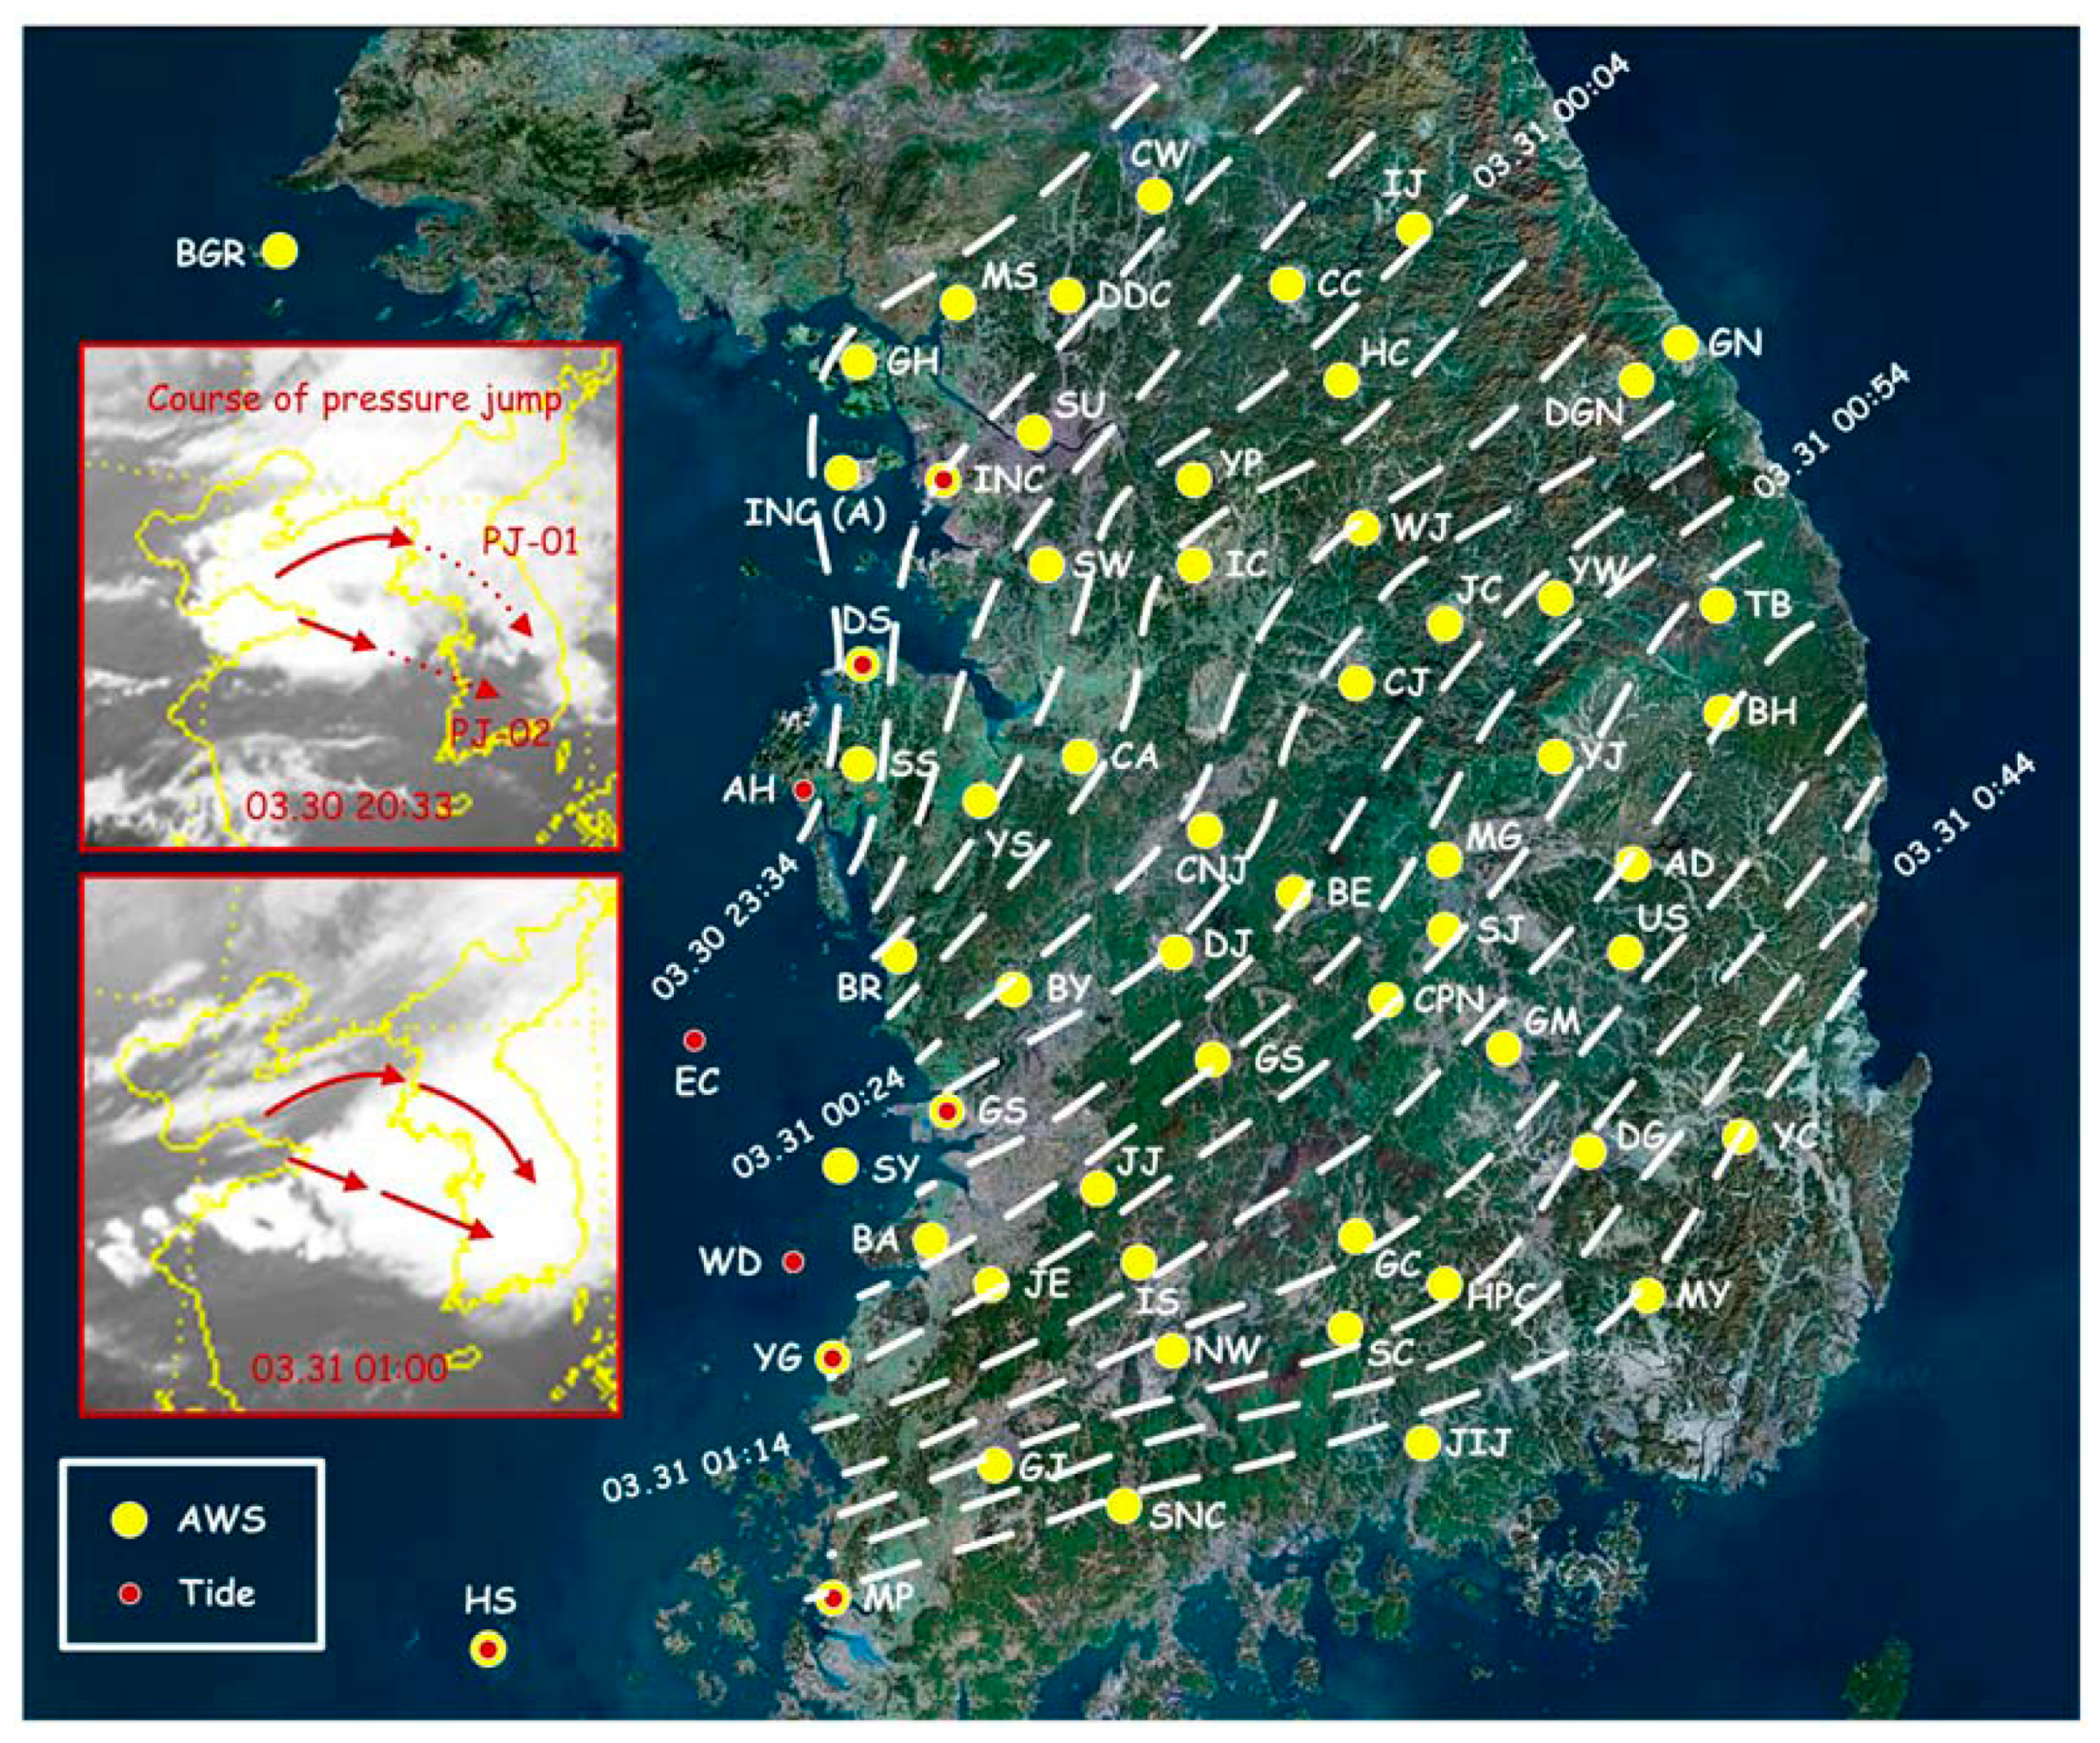
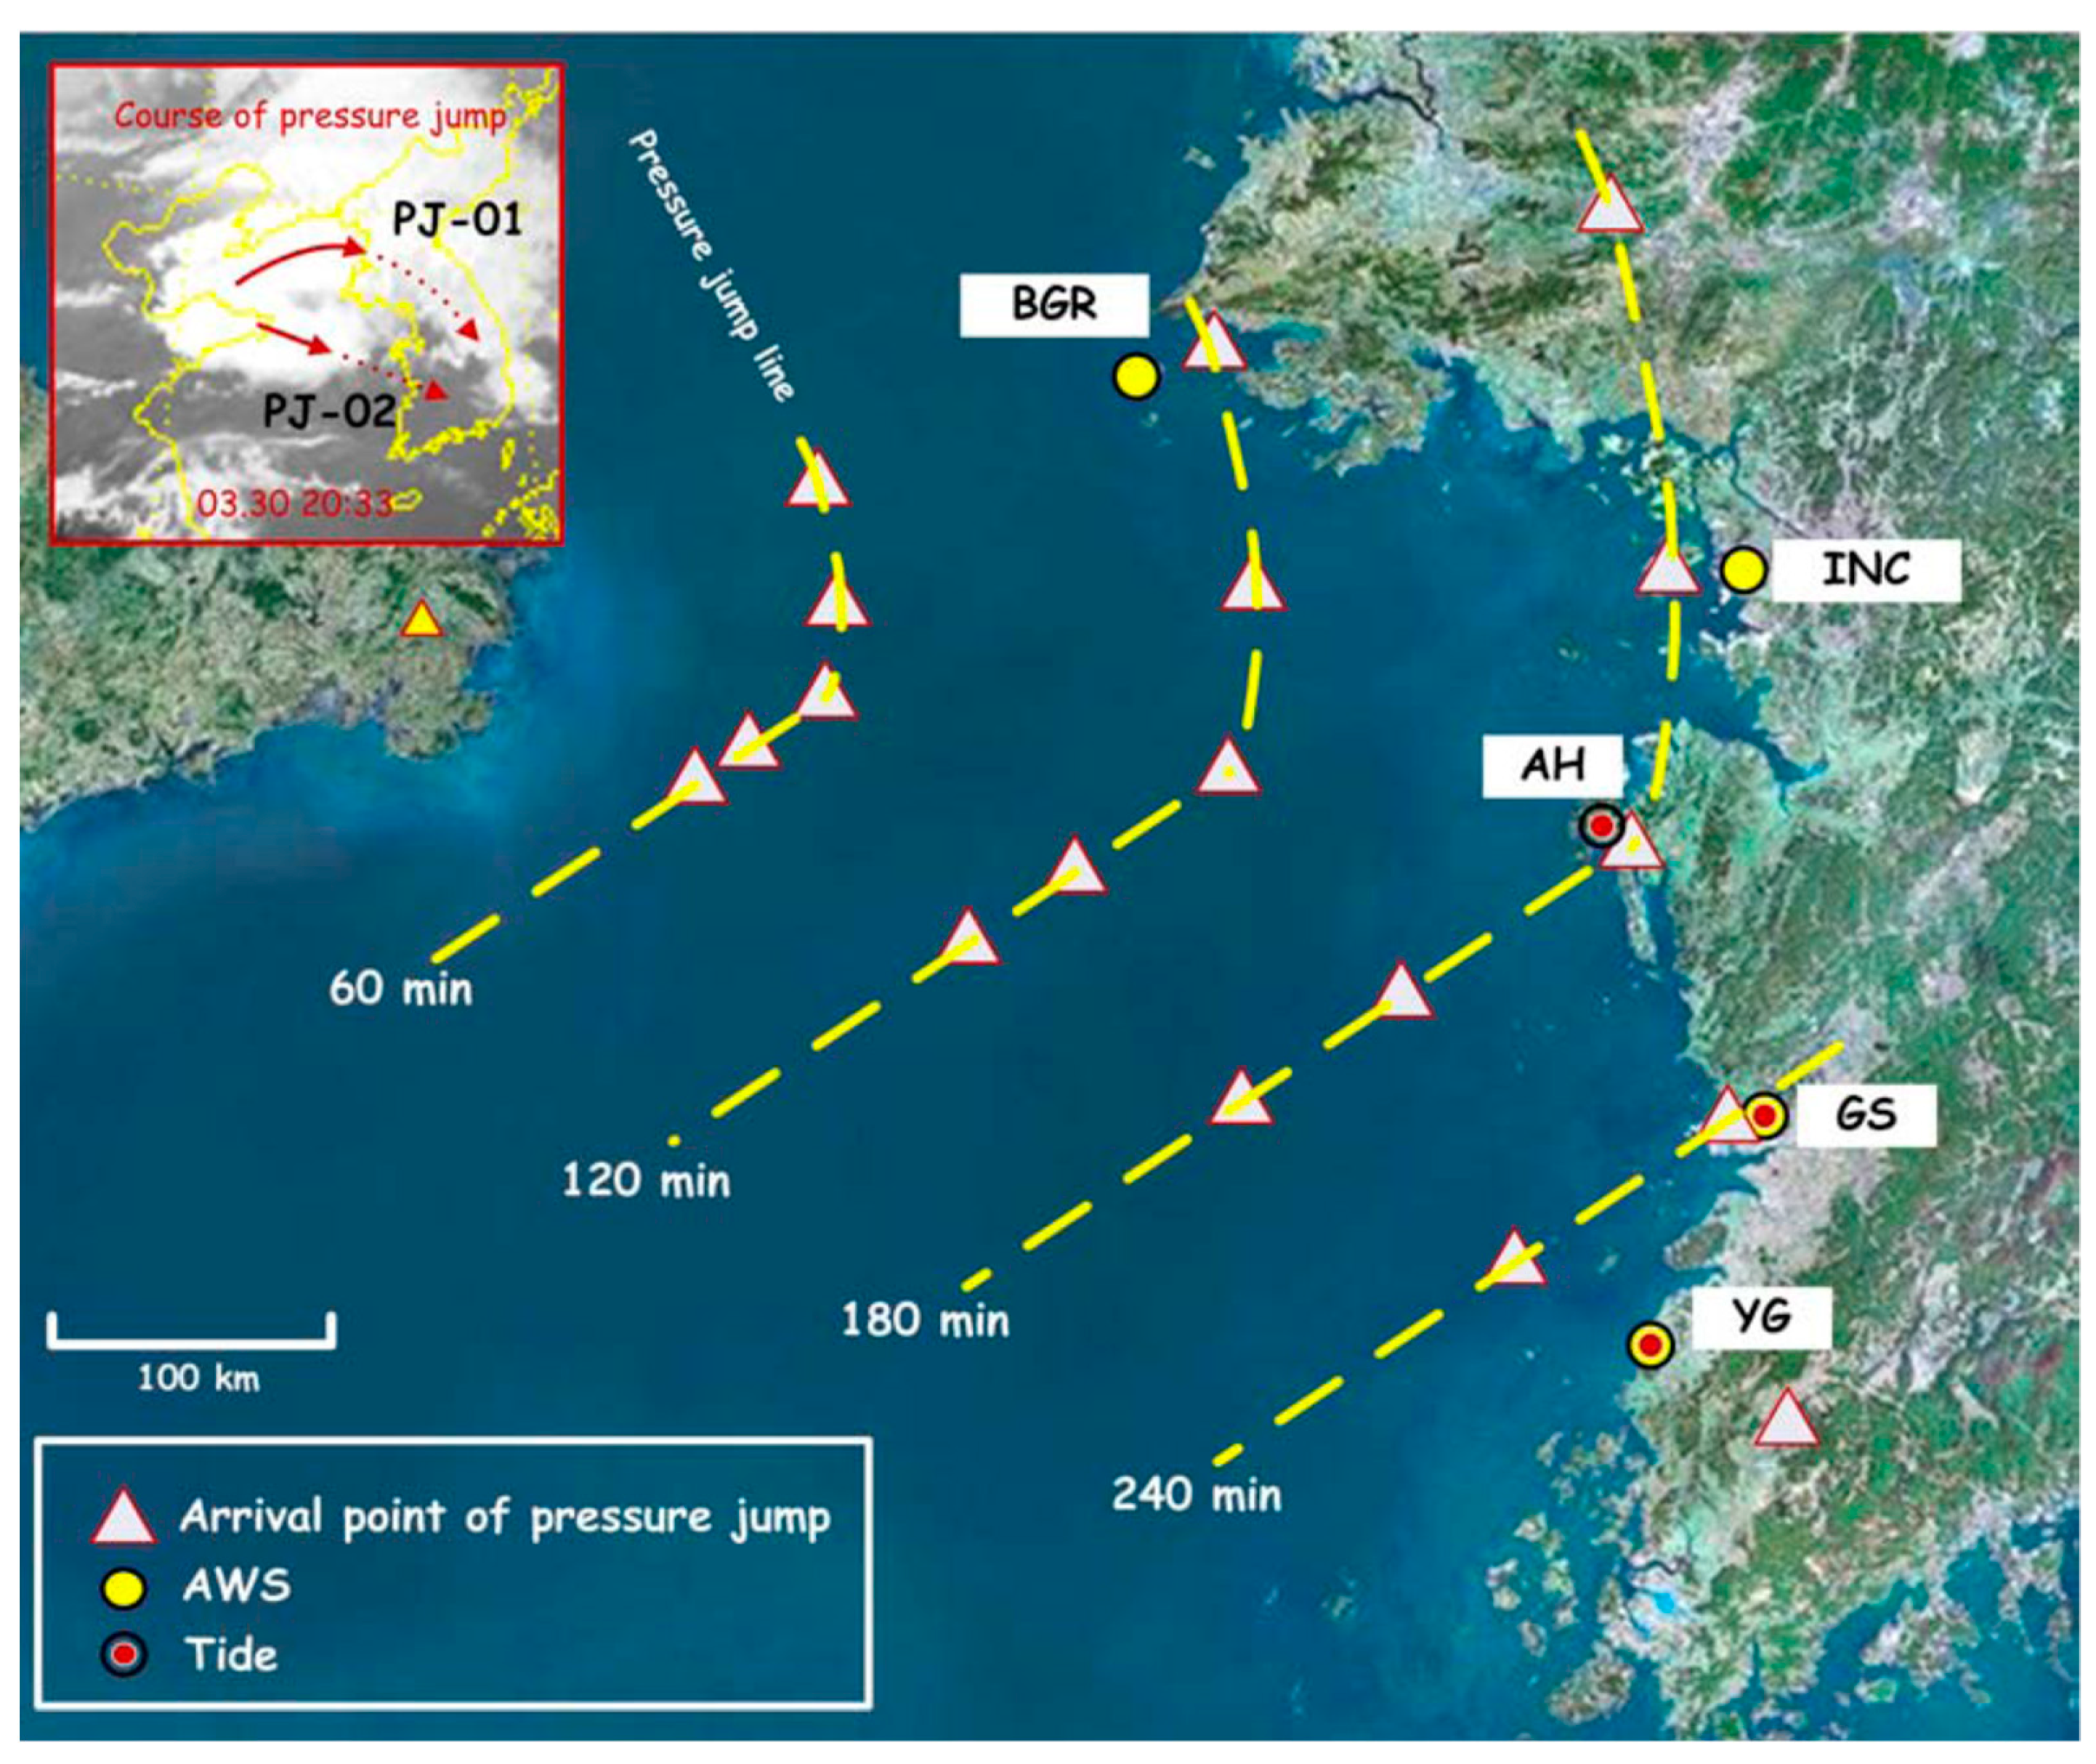
3.1. Meteotsunami in the Yellow Sea (31 March 2007)
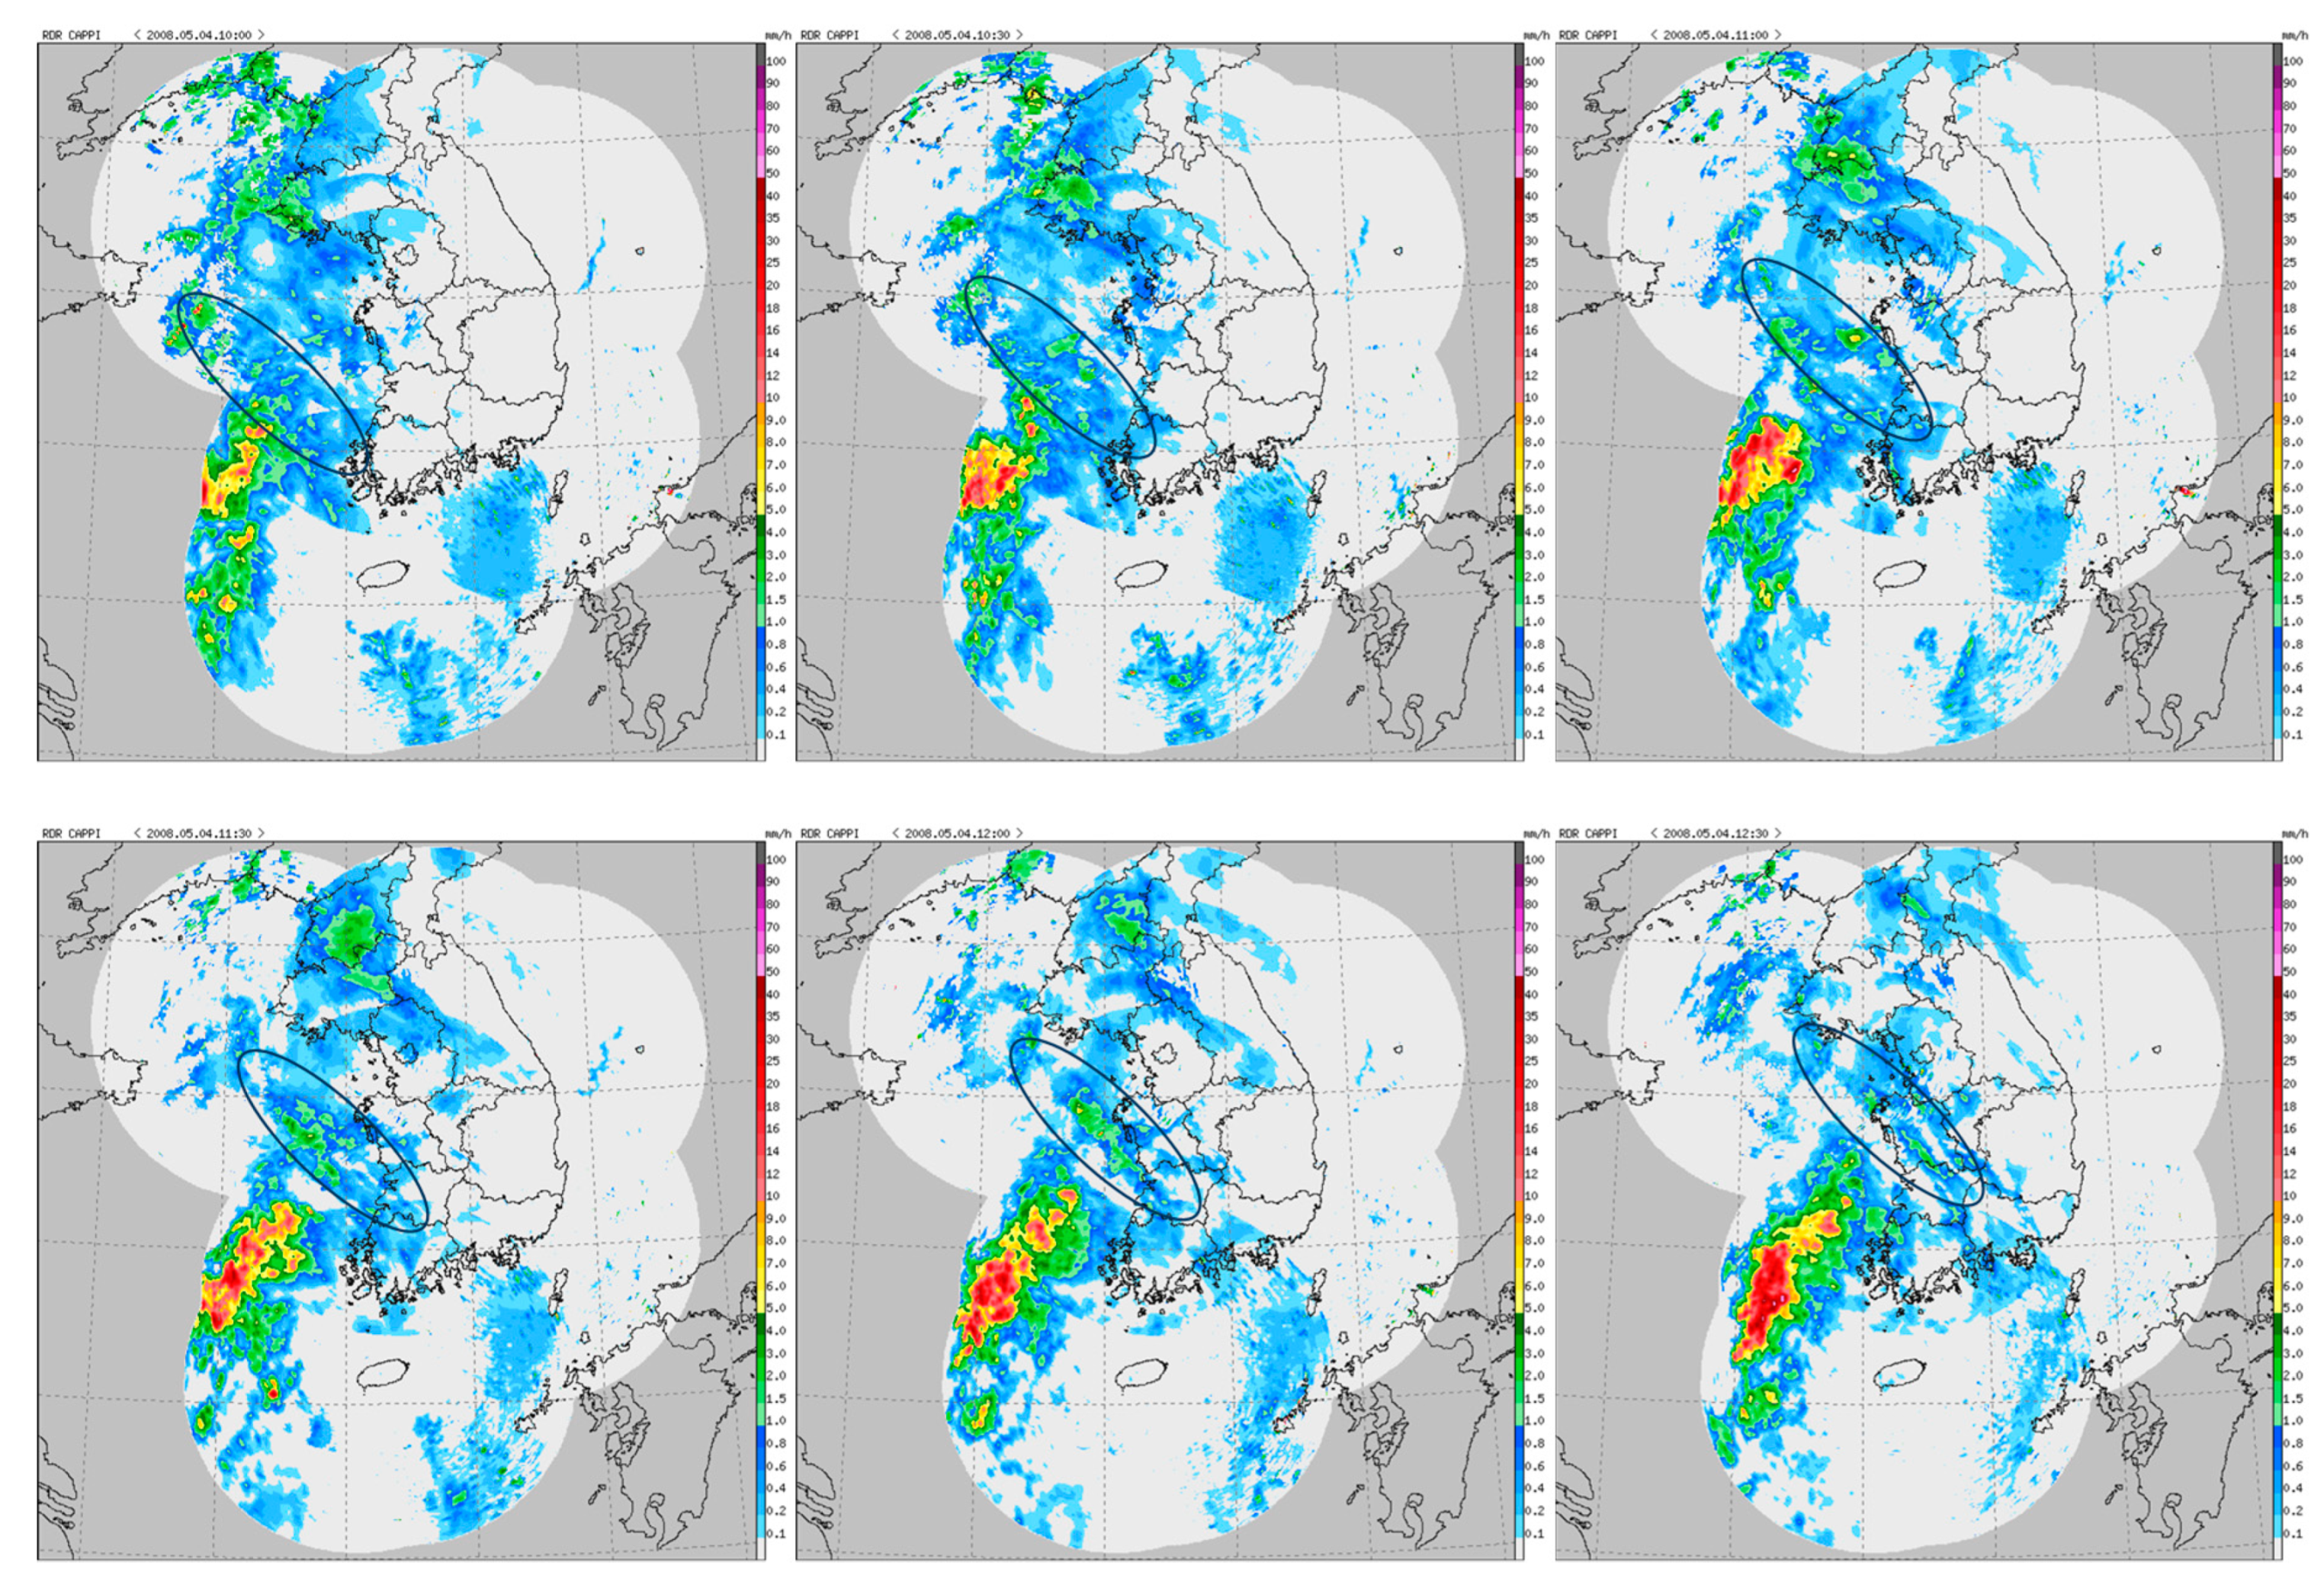
3.2. Meteotsunami in the Yellow Sea (4 May 2008)
4. Results and Discussion
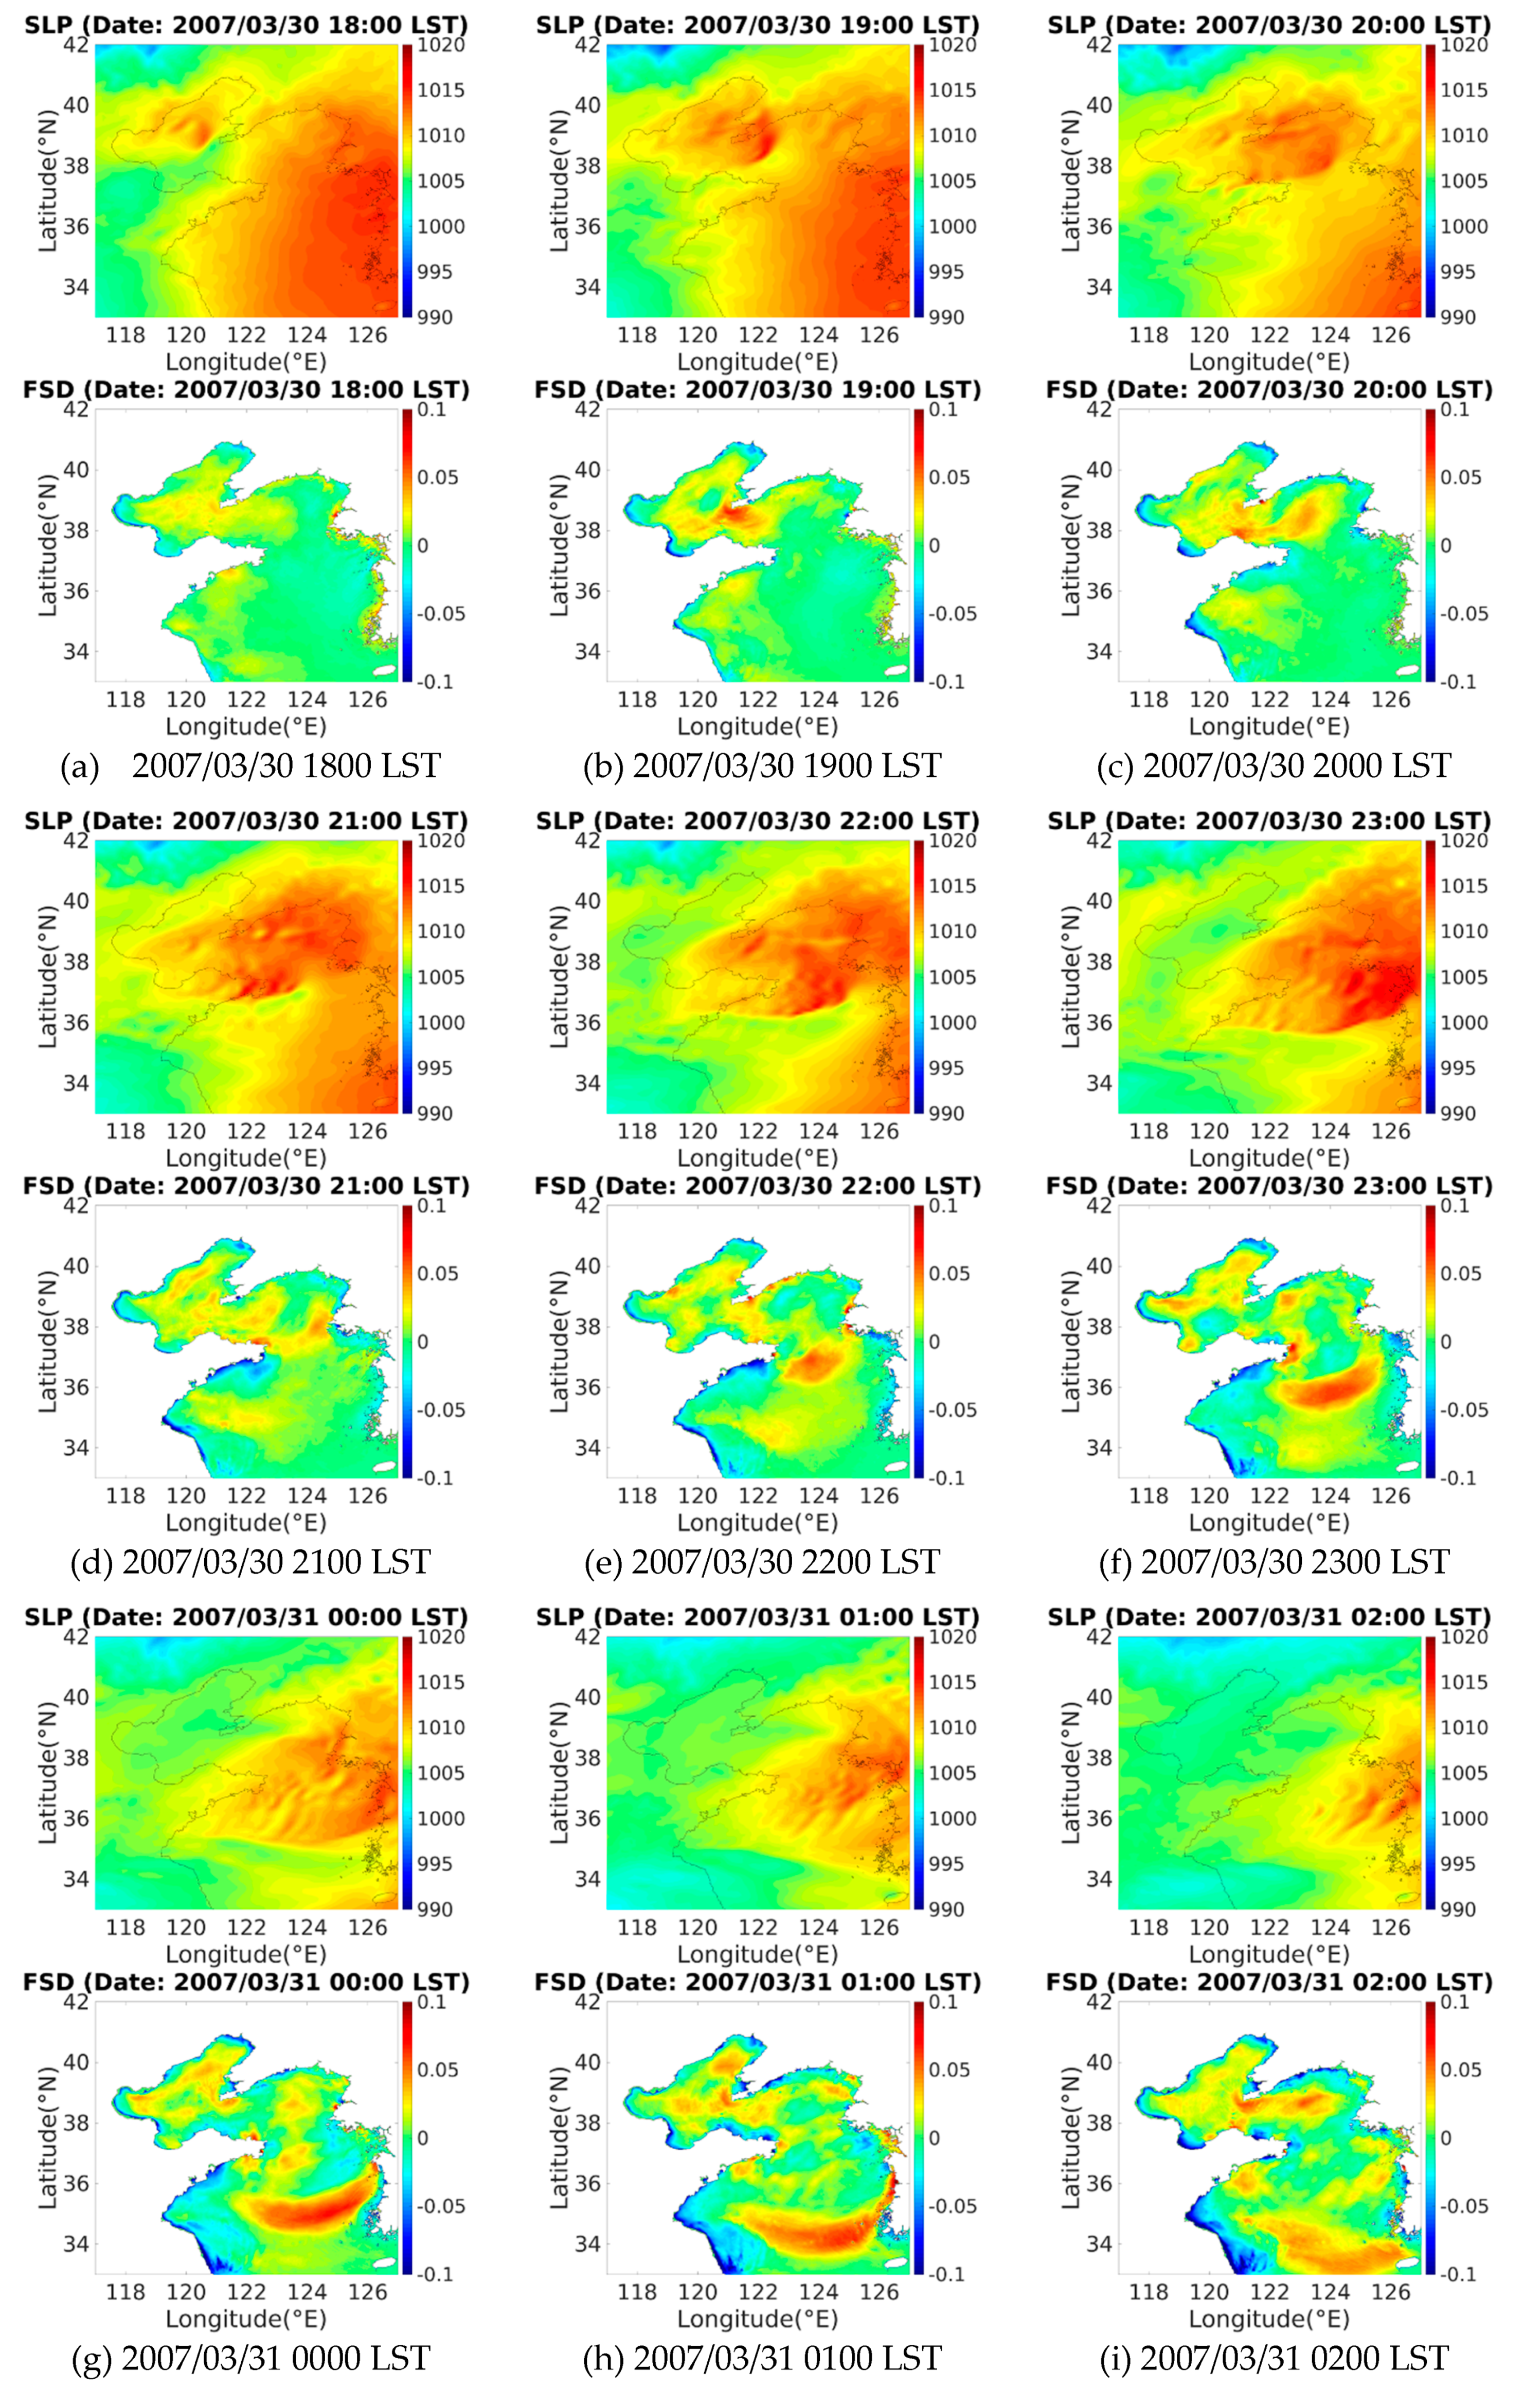
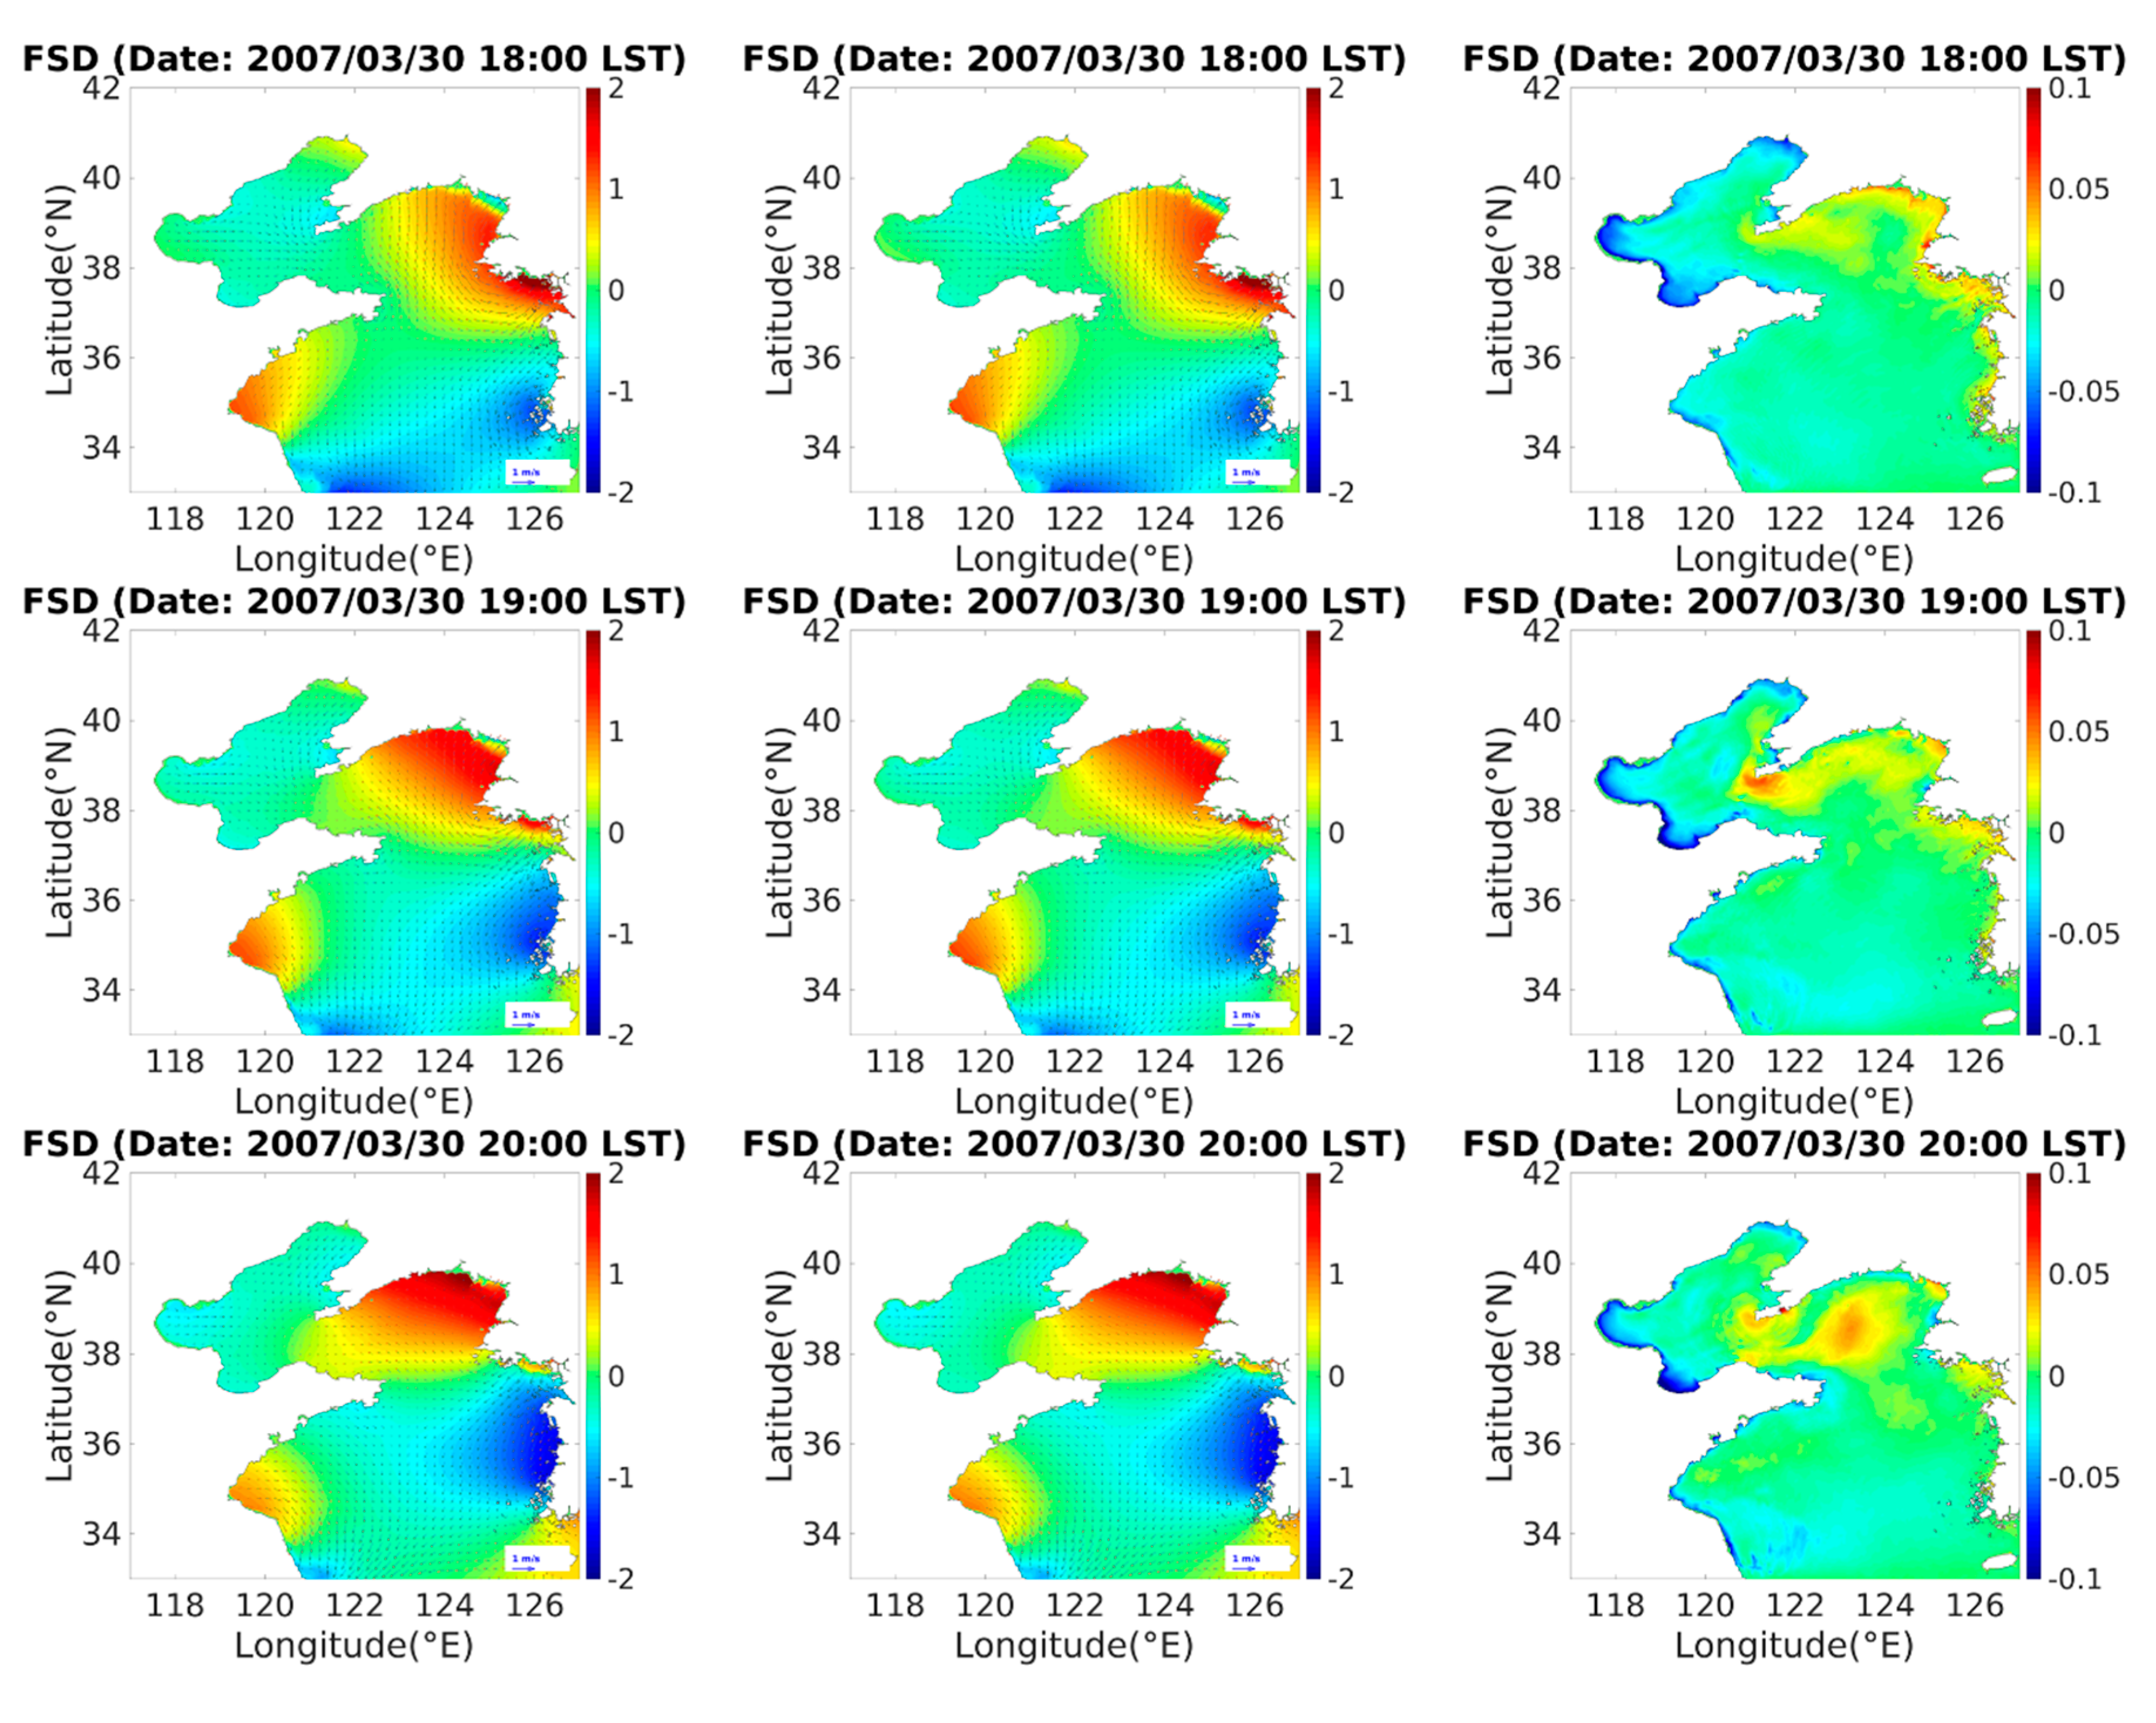
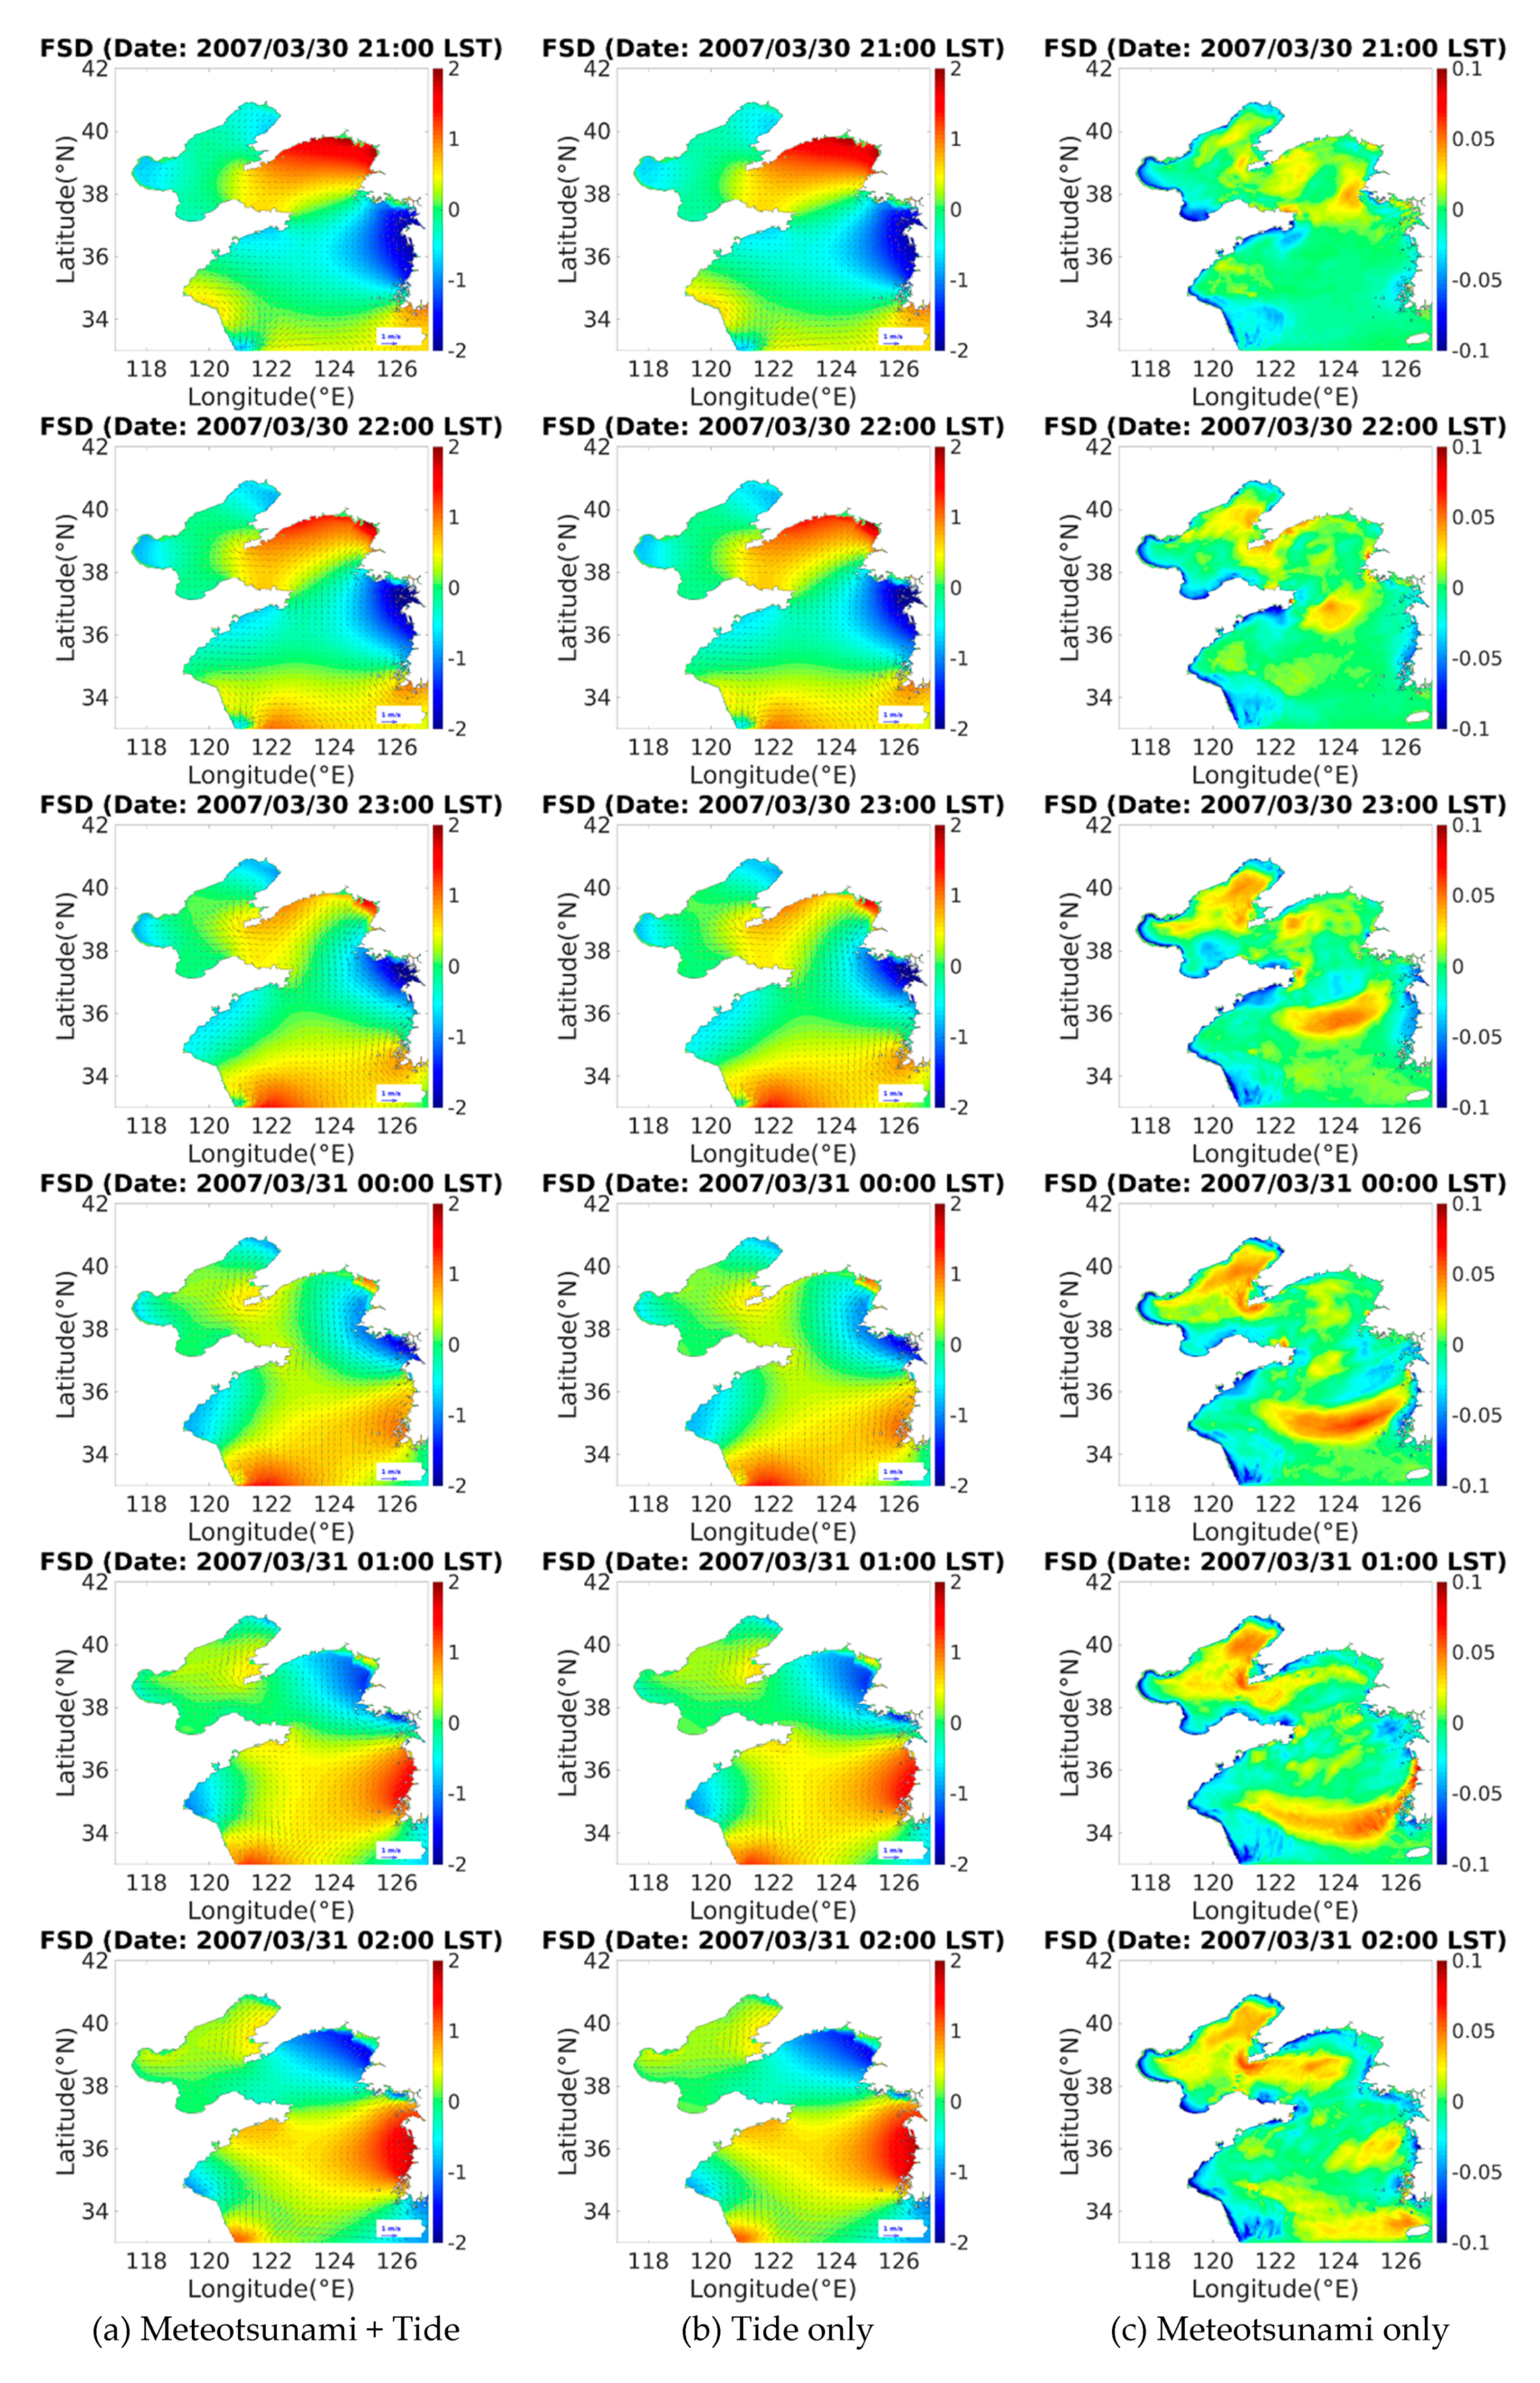
4.1. Numerical Simulation of a Meteotsunami (31 March 2007)
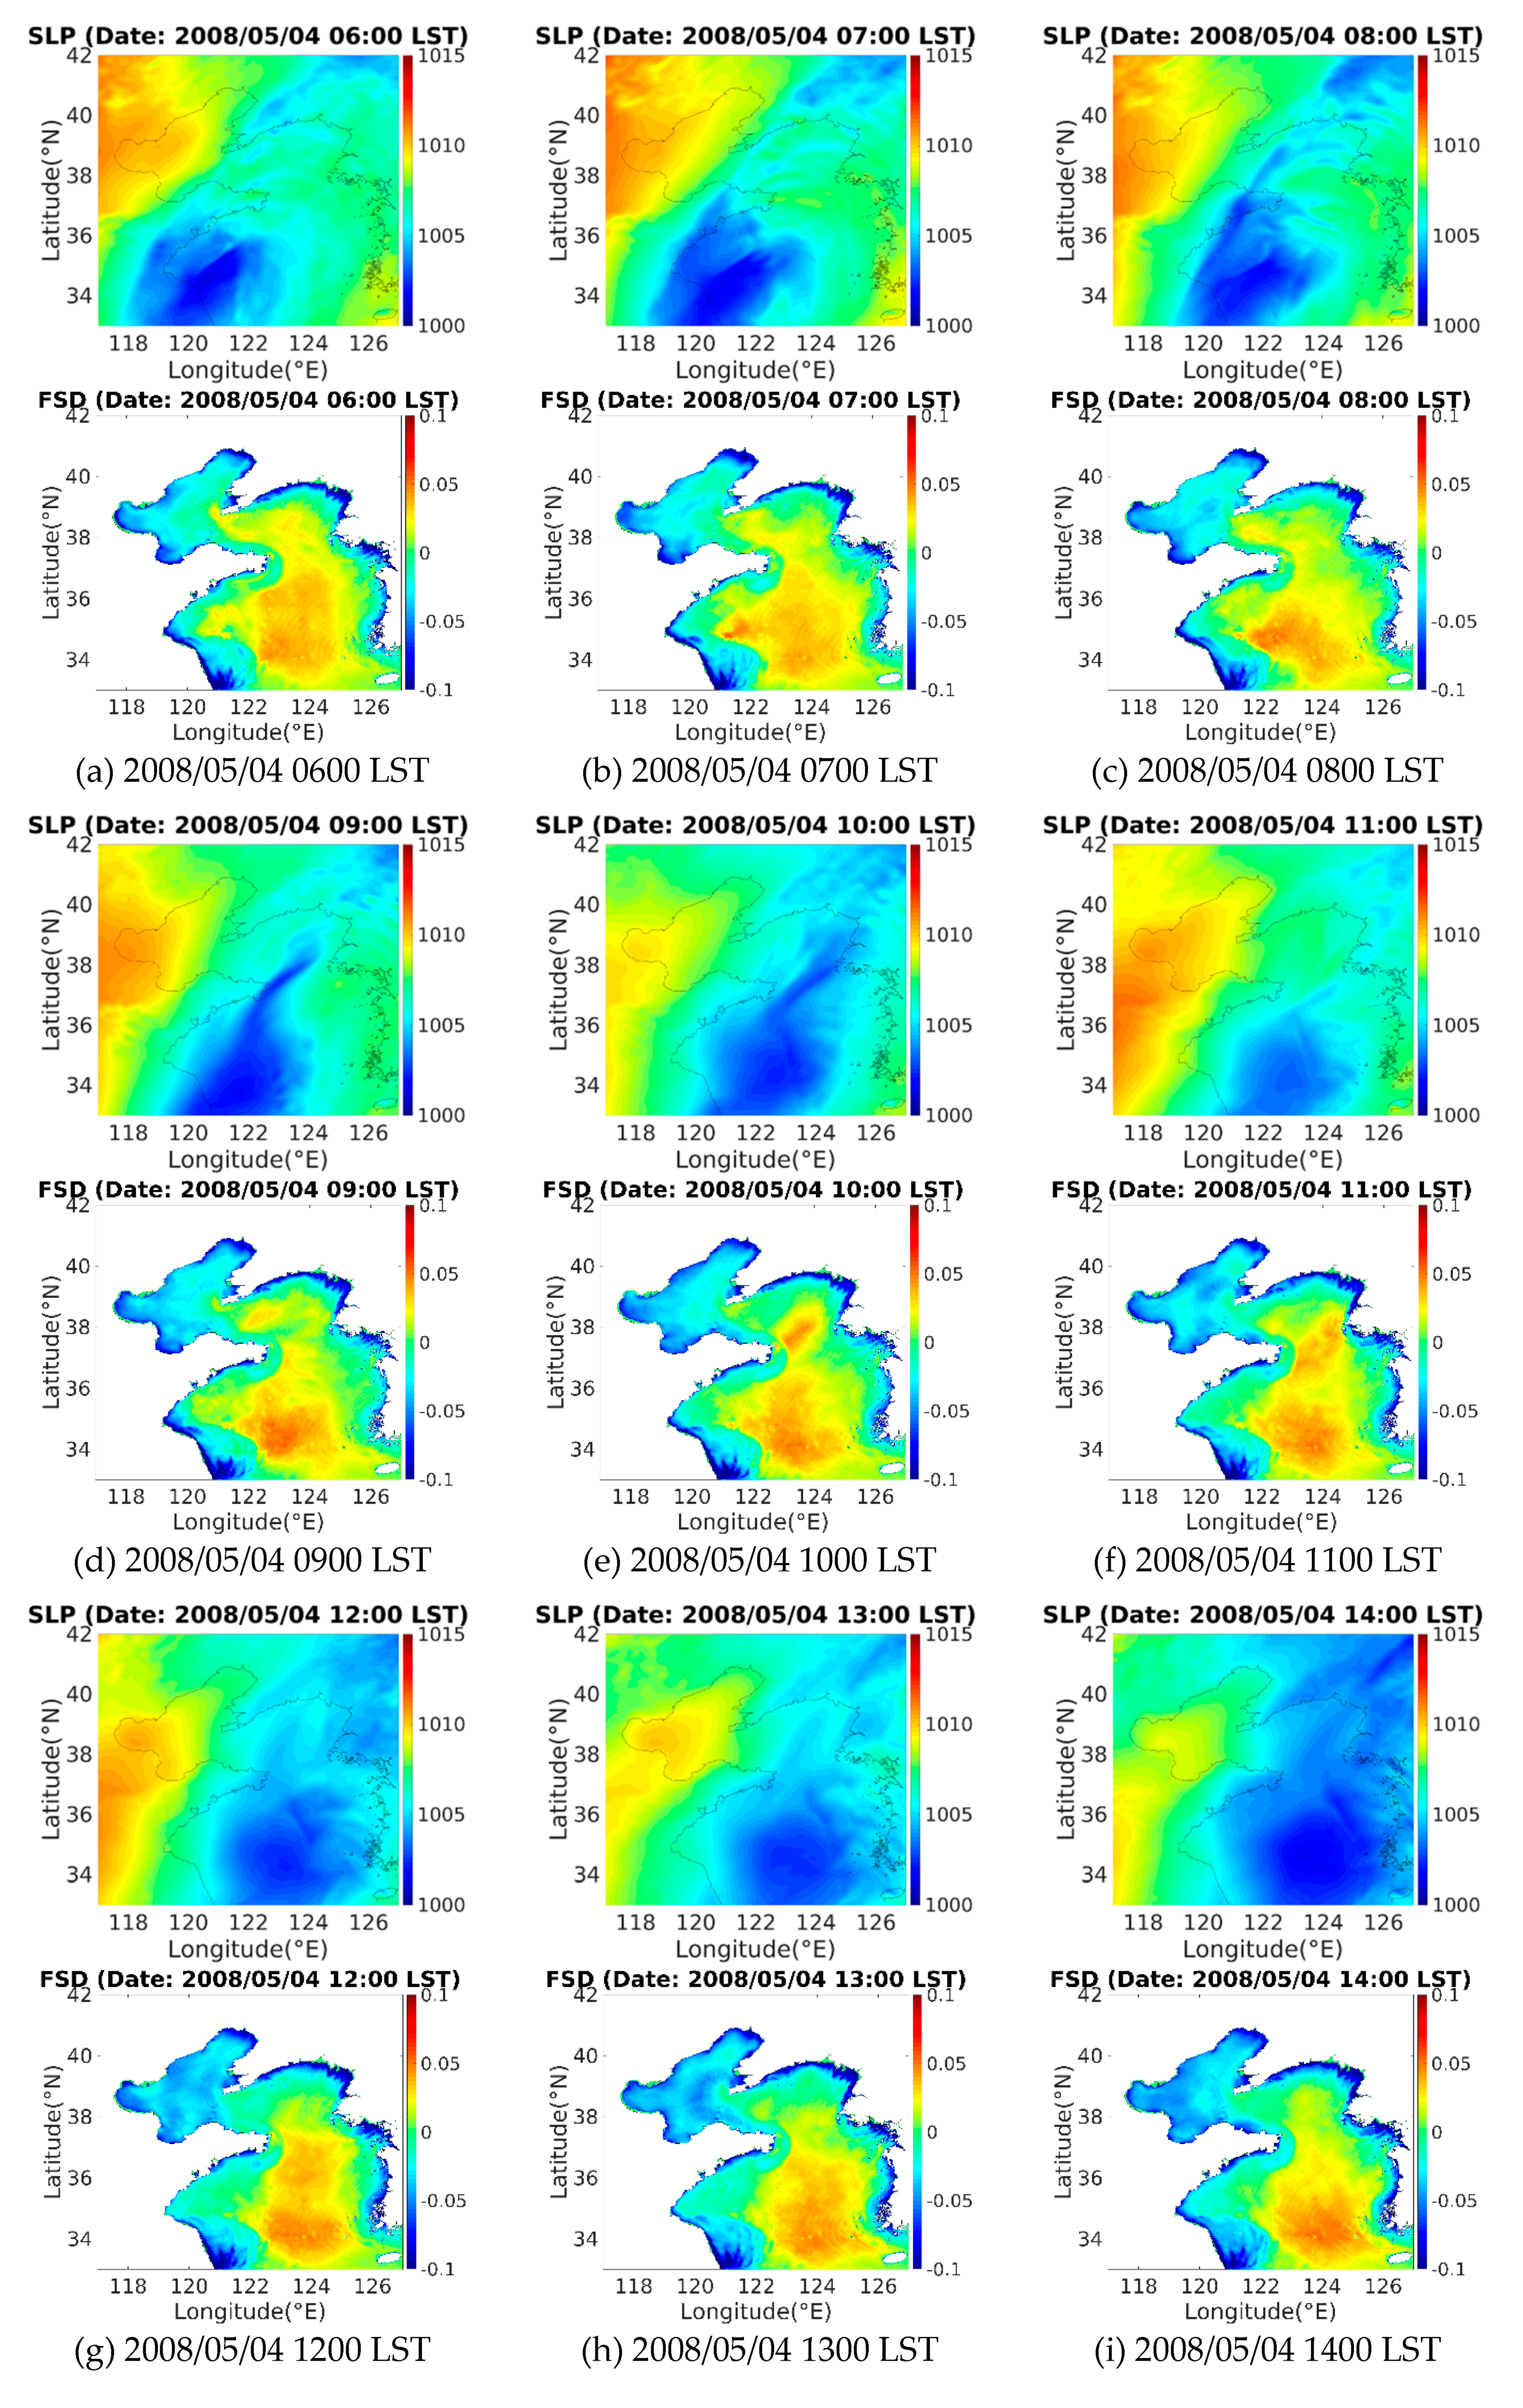
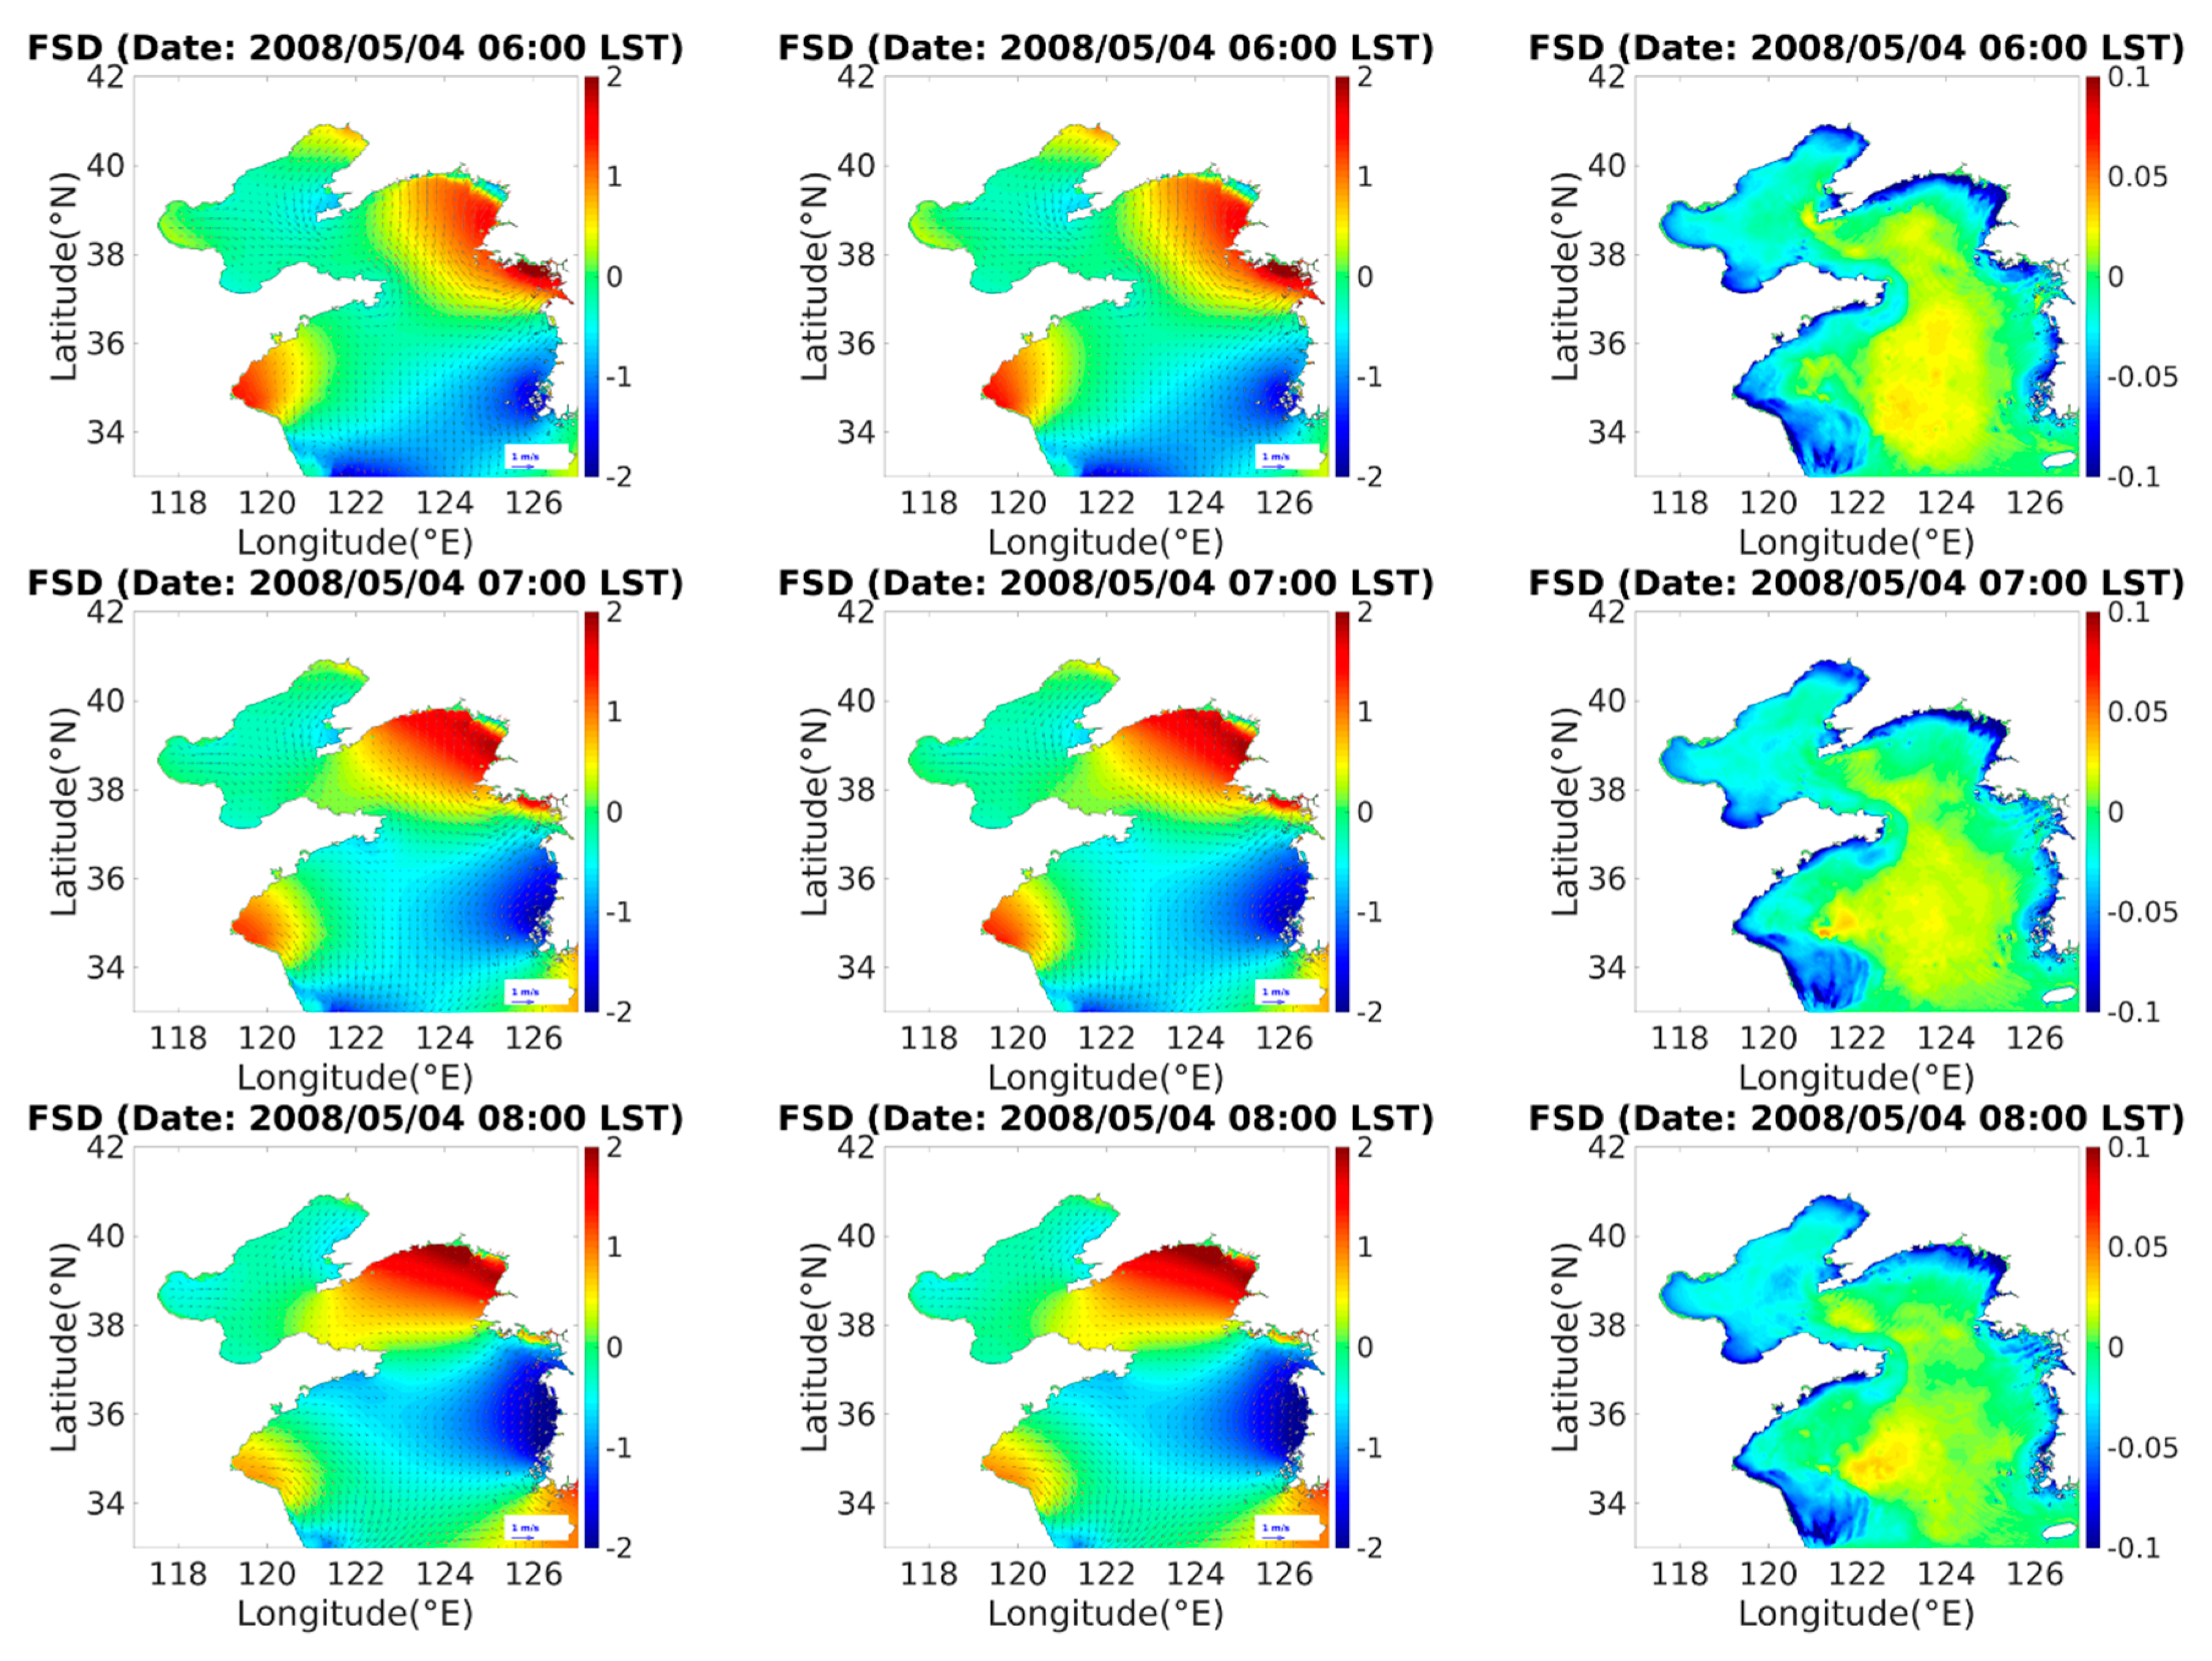
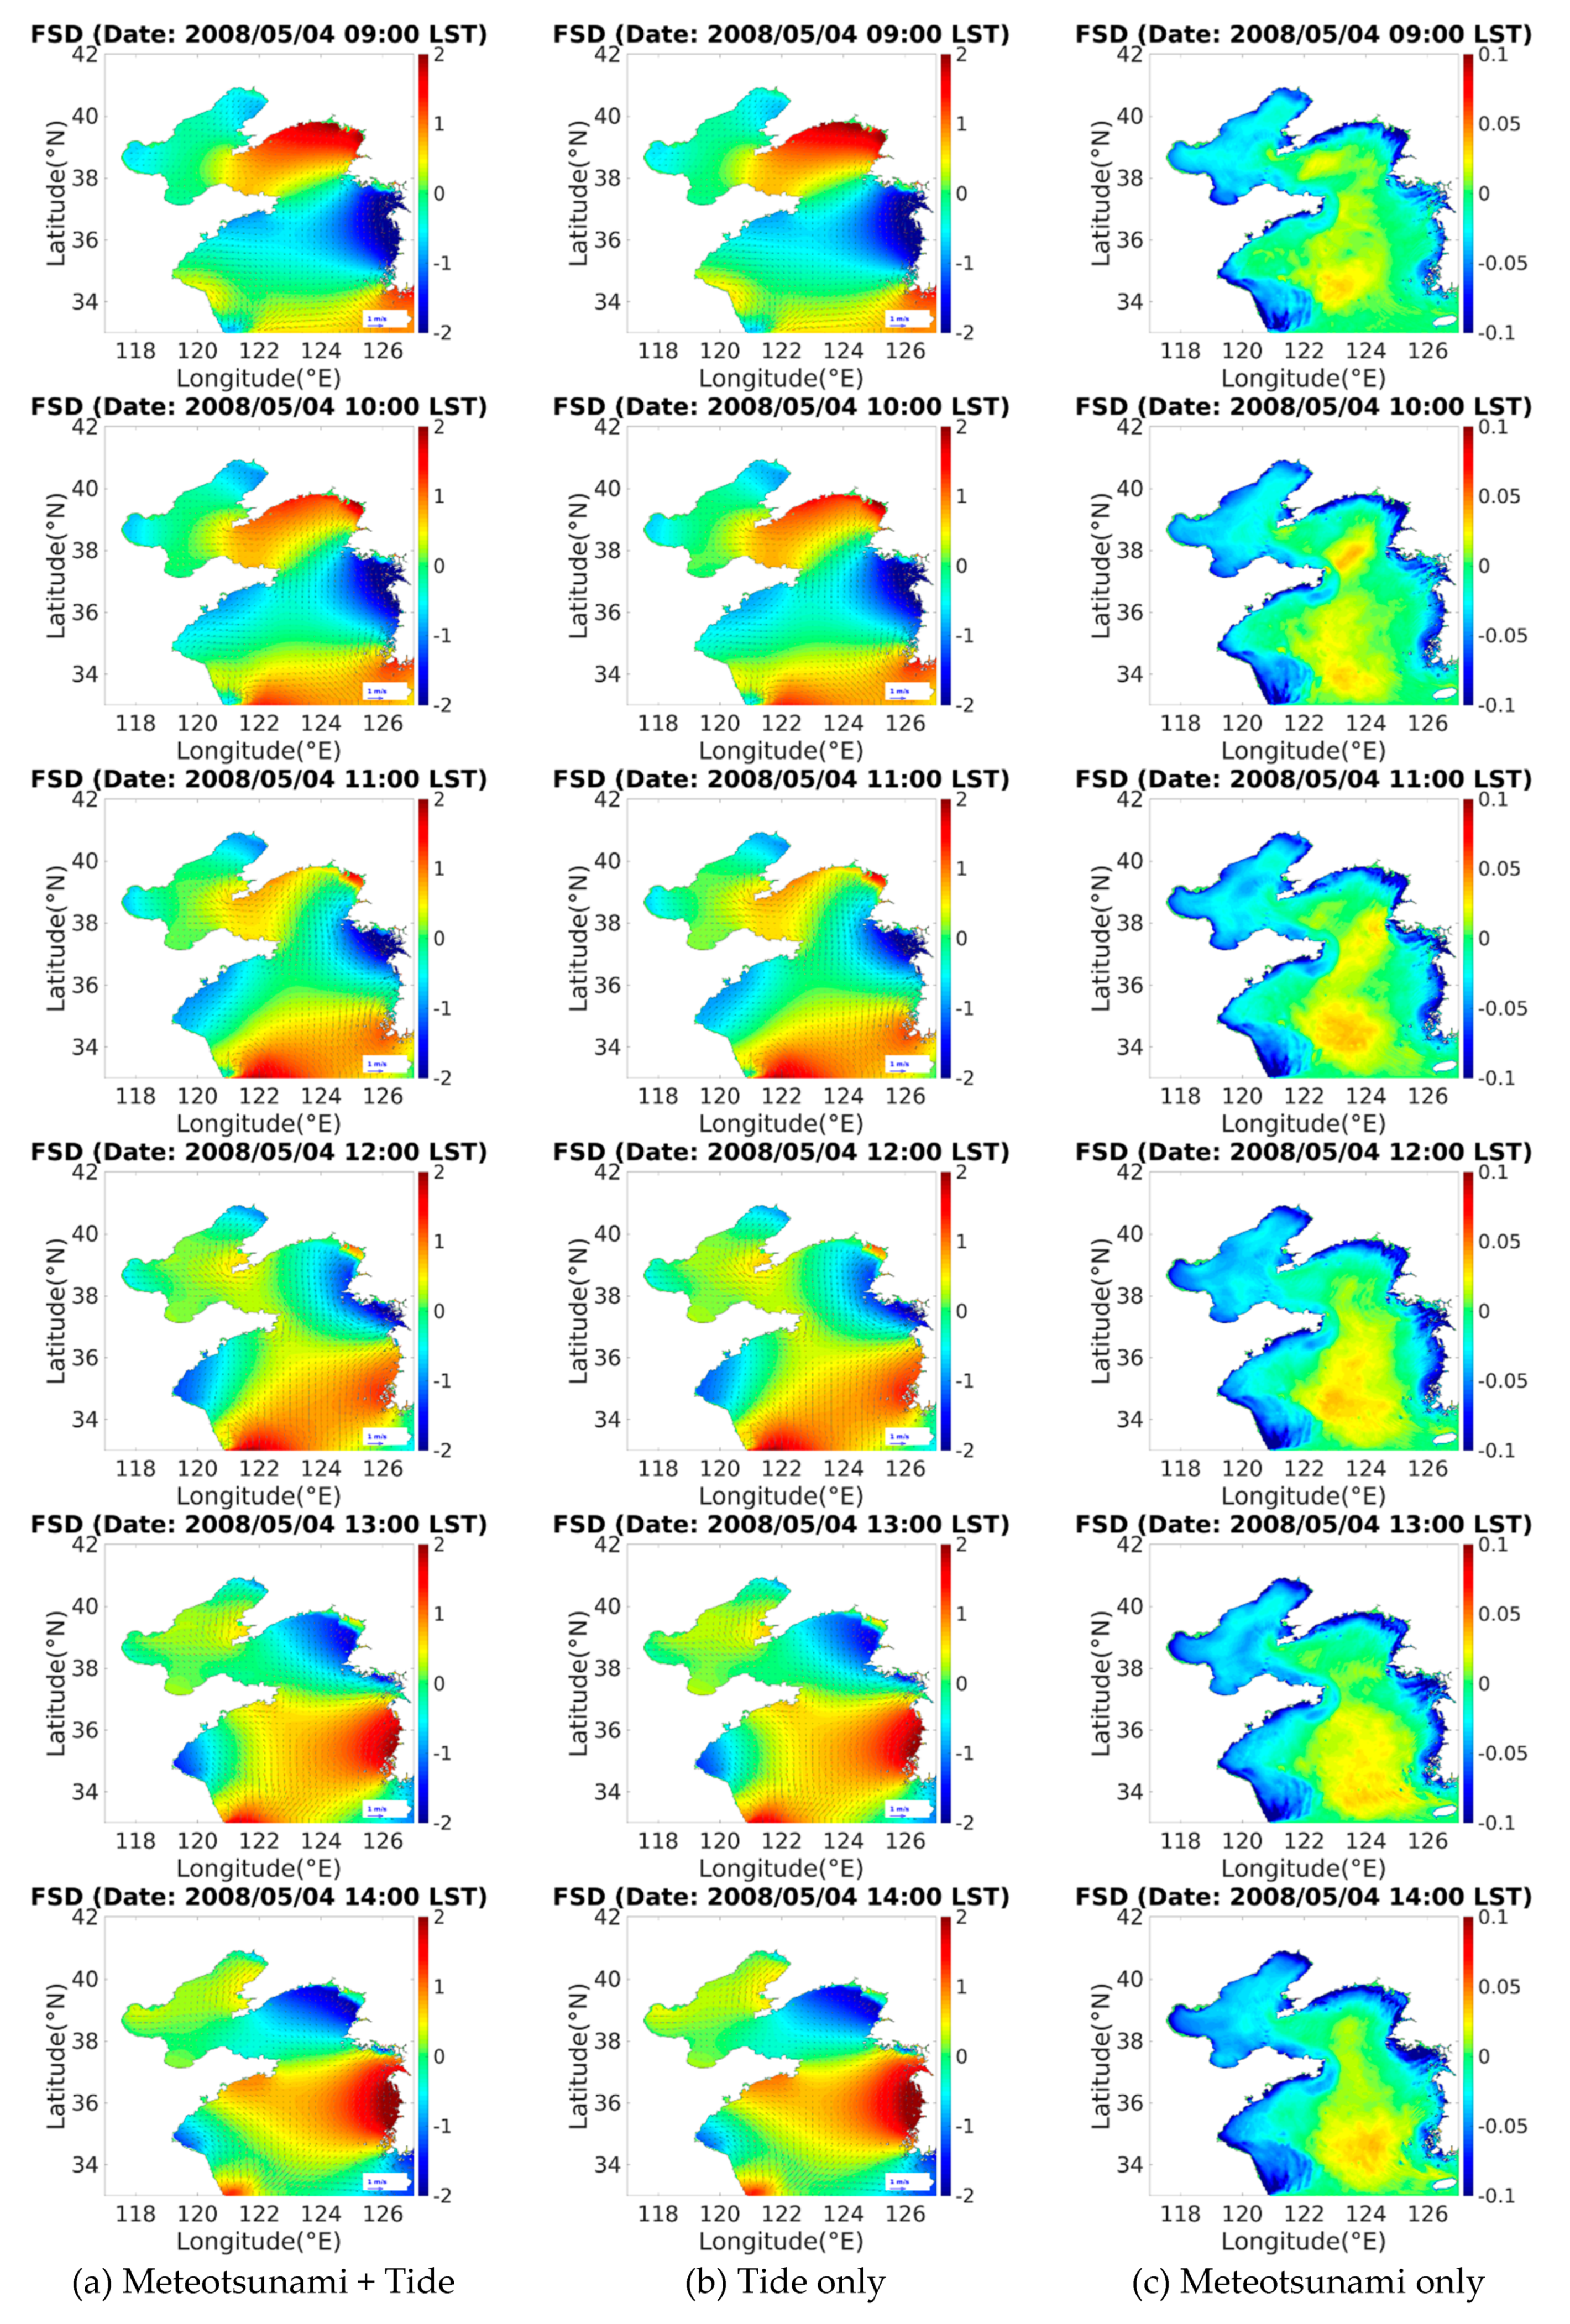
4.2. Numerical Simulation of a Meteotsunami (4 May 2008)
4.3. Discussion
5. Conclusions and Remarks
Author Contributions
Funding
Acknowledgments
Conflicts of Interest
References
- Defant, A. Physical Oceanography; Pergamon Press: Oxford, UK, 1961; Volume 2. [Google Scholar]
- Rabinovich, A.B.; Monserrat, S. Meteorological tsunamis near the Balearic and Kuril Islands: Descriptive and statistical analysis. Nat. Hazards 1996, 13, 55–90. [Google Scholar] [CrossRef]
- Monserrat, S.; Vilibić, I.; Rabinovich, A.B. Meteotsunamis: Atmospherically induced destructive ocean waves in the tsunami frequency band. Nat. Hazards Earth Syst. Sci. 2006, 6, 1035–1051. [Google Scholar] [CrossRef]
- Lamb, H. Hydrodynamics; Dover publications: Cambridge, UK, 1932. [Google Scholar]
- Proudman, J. The effects on the sea of changes in atmospheric pressure. Mon. Not. R. Astron. Soc. Geophys. Suppl. 1929, 2, 197–209. [Google Scholar] [CrossRef]
- Vilibić, I.; Monserrat, S.; Rabinovich, A.B.; Mihanović, H. Numerical modelling of the destructive meteotsunami of 15 June 2006 on the coast of the Balearic Islands. Pure Appl. Geophys. 2008, 165, 2169–2195. [Google Scholar] [CrossRef]
- Bae, J.S. Study of Meteorological Tsunamis Generated in the Yellow Sea. Ph.D. Thesis, Hanyang University, Seoul, Korea, 2012. [Google Scholar]
- Choi, B.-J.; Park, Y.; Kwon, K. Generation and growth of long ocean waves along the west coast of Korea in March 2007. Ocean Polar Res. 2008, 30, 453–466. (In Korean) [Google Scholar] [CrossRef]
- Choi, J.-Y.; Lee, D.-Y. Analysis of small-scale atmospheric pressure jumps related to the generation of abnormal extreme waves at Boryeong. Ocean Polar Res. 2009, 31, 379–388. (In Korean) [Google Scholar]
- Cho, K.-H.; Choi, J.-Y.; Park, K.-S.; Hyun, S.-K.; Oh, Y.; Park, J.-Y. A synoptic study on tsunami-like sea level oscillations along the west coast of Korea using an unstructured-grid ocean model. J. Coast. Res. 2013, 65, 678–683. [Google Scholar] [CrossRef]
- Oh, S.C.; Shin, C.H.; Yoon, S.B. Simulation of inundation along the west coast of Korea from the meteotsunami of 2007. J. Coast. Res. 2016, 75, 1202–1206. [Google Scholar] [CrossRef]
- Ha, T.; Choi, J.-Y.; Yoo, J.; Chun, I.; Shim, J. Transformation of small-scale meteorological tsunami due to terrain complexity on western coast of Korea. J. Coast. Res. 2014, 70, 284–289. [Google Scholar] [CrossRef]
- Ha, T.; Yoon, J.-S.; Heo, K.-Y. Numerical simulations of a meteotsunami using both atmospheric and phase-resolving wave models in the Yellow Sea. J. Coast. Res. 2018, 85, 11–15. [Google Scholar] [CrossRef]
- Ha, T.; Park, K.-S.; Cho, J.-S.; Cho, Y.-S. Tsunami-tide interaction in the Southern Sea of the Korean Peninsula. In Proceedings of the 25th Annual International Ocean and Polar Engineering Conference (ISOPE-2015), Kona, HI, USA, 21–26 June 2015; pp. 759–764. [Google Scholar]
- Ha, T.; Cho, Y.-S. Tsunami propagation over varying water depths. Ocean Eng. 2015, 101, 67–77. [Google Scholar] [CrossRef]
- Kowalik, Z.; Proshutinsky, A. Tsunami-tide interactions: A Cook Inlet Case Study. Cont. Shelf Res. 2010, 30, 633–642. [Google Scholar] [CrossRef]
- Kowalik, Z.; Proshutinsky, T.; Proshutinsky, A. Tide-tsunami interactions. Sci. Tsunami Hazards 2006, 24, 242–256. [Google Scholar]
- Tolkova, E. Tide-tsunami interaction in Columbia River, as implied by historical data and numerical simulations. Pure Appl. Geophys. 2012, 170, 1115–1126. [Google Scholar] [CrossRef]
- Skamarock, W.C.; Klemp, J.B.; Dudhia, J.; Gill, D.O.; Barker, D.M.; Duda, M.G.; Huang, X.-Y.; Wang, W.; Powers, J.G. A Description of the Advanced Research WRF Version 3; NCAR: Boulder, CO, USA, 2008. [Google Scholar]
- Barker, D.; Huang, X.; Liu, Z.; Auligné, T.; Zhang, X.; Rugg, S.; Ajjaji, R.; Bourgeois, A.; Bray, J.; Chen, Y.; et al. The Weather Research and Forecasting Model’s Community Variational/Ensemble Data Assimilation System: WRFDA. Bull. Am. Meteorol. Soc. 2012, 93, 831–843. [Google Scholar] [CrossRef]
- Heo, K.-Y.; Ha, T.; Choi, J.-Y.; Park, K.-S.; Kwon, J.-I.; Jun, K. Evaluation of wind and wave simulations using different global reanalyses. J. Coast. Res. 2017, 79, 99–103. [Google Scholar] [CrossRef]
- Lim, H.; Hong, S.-Y. Effects of bulk ice microphysics on the simulated monsoonal precipitation over east Asia. J. Geophys. Res. 2005, 110, 166–181. [Google Scholar] [CrossRef]
- Iacono, M.; Delamere, J.; Mlawer, E.; Shephard, M.; Clough, S.; Collins, W. Radiative forcing by long-lived greenhouse gases: Calculations with the AER radiative transfer models. J. Geophys. Res. 2008, 113. [Google Scholar] [CrossRef]
- Hong, S.-Y.; Noh, Y.; Dudhia, J. A new vertical diffusion package with an explicit treatment of entrainment processes. Mon. Weather Rev. 2006, 134, 2318–2341. [Google Scholar] [CrossRef]
- Kain, J.S. The Kain–Fritsch Convective Parameterization: An Update. J. Appl. Meteorol. 2004, 43, 170–181. [Google Scholar] [CrossRef]
- Wang, X.; Liu, P.L.F. An explicit finite difference model for simulating weakly nonlinear and weakly dispersive waves over slowly varying water depth. Coast. Eng. 2011, 58, 173–183. [Google Scholar] [CrossRef]
- Egbert, G.D.; Bennett, A.F.; Foreman, M.G.G. Topex/Poseidon tides estimated using a global inverse model. J. Geophys. Res. 1994, 99, 24821–24852. [Google Scholar] [CrossRef]
- Egbert, G.D.; Erofeeva, S.Y. Efficient inverse modeling of barotropic ocean tides. J. Atmos. Ocean. Technol. 2002, 19, 183–204. [Google Scholar] [CrossRef]
- Egbert, G.D.; Erofeeva, S.Y.; Ray, R.D. Assimilation of altimetry data for nonlinear shallow-water tides: Quarter-diurnal tides of the Northwest European Shelf. Cont. Shelf Res. 2010, 30, 668–679. [Google Scholar] [CrossRef]
- Stammer, D.; Ray, R.D.; Andersen, O.B.; Arbic, B.K.; Bosch, W.; Carrère, L.; Cheng, Y.; Chinn, D.S.; Dushaw, B.D.; Egbert, G.D.; et al. Accuracy assessment of global barotropic ocean tide models. Rev. Geophys. 2014, 52, 243–282. [Google Scholar] [CrossRef]
- Yoon, J.-S.; Lee, J.; Ha, T. Development of a numerical algorithm considering tide-tsunami interaction. J. Coast. Res. 2019, 91, 11–15. [Google Scholar]
- Seo, S.-N. Digital 30sec gridded bathymetric data of Korea marginal seas—KorBathy30s. J. Korea Soc. Coast. Ocean Eng. 2008, 20, 110–120. (In Korean) [Google Scholar]
- Yoo, J.; Lee, D.-Y.; Ha, T.; Cho, Y.-S.; Woo, S.-B. Characteristics of abnormal large waves measured from coastal videos. Nat. Hazards Earth Syst. Sci. 2010, 10, 947–956. [Google Scholar] [CrossRef]


| Description | Option | Configuration |
|---|---|---|
| Physics | Microphysics | WSM5 [22] |
| Longwave radiation | RRTMG [23] | |
| Shortwave radiation | RRTMG [23] | |
| Planetary boundary layer | YSU PBL [24] | |
| Surface layer | Monin–Obukhov | |
| Land surface model | Noah LSM | |
| Cumulus | Kain–Fritsch [25] | |
| Grid | Horizontal grid spacing | 20 km, 4 km |
| Vertical levels | 31 levels with top at 50 hPa | |
| WRFDA | Surface assimilation option | 2 |
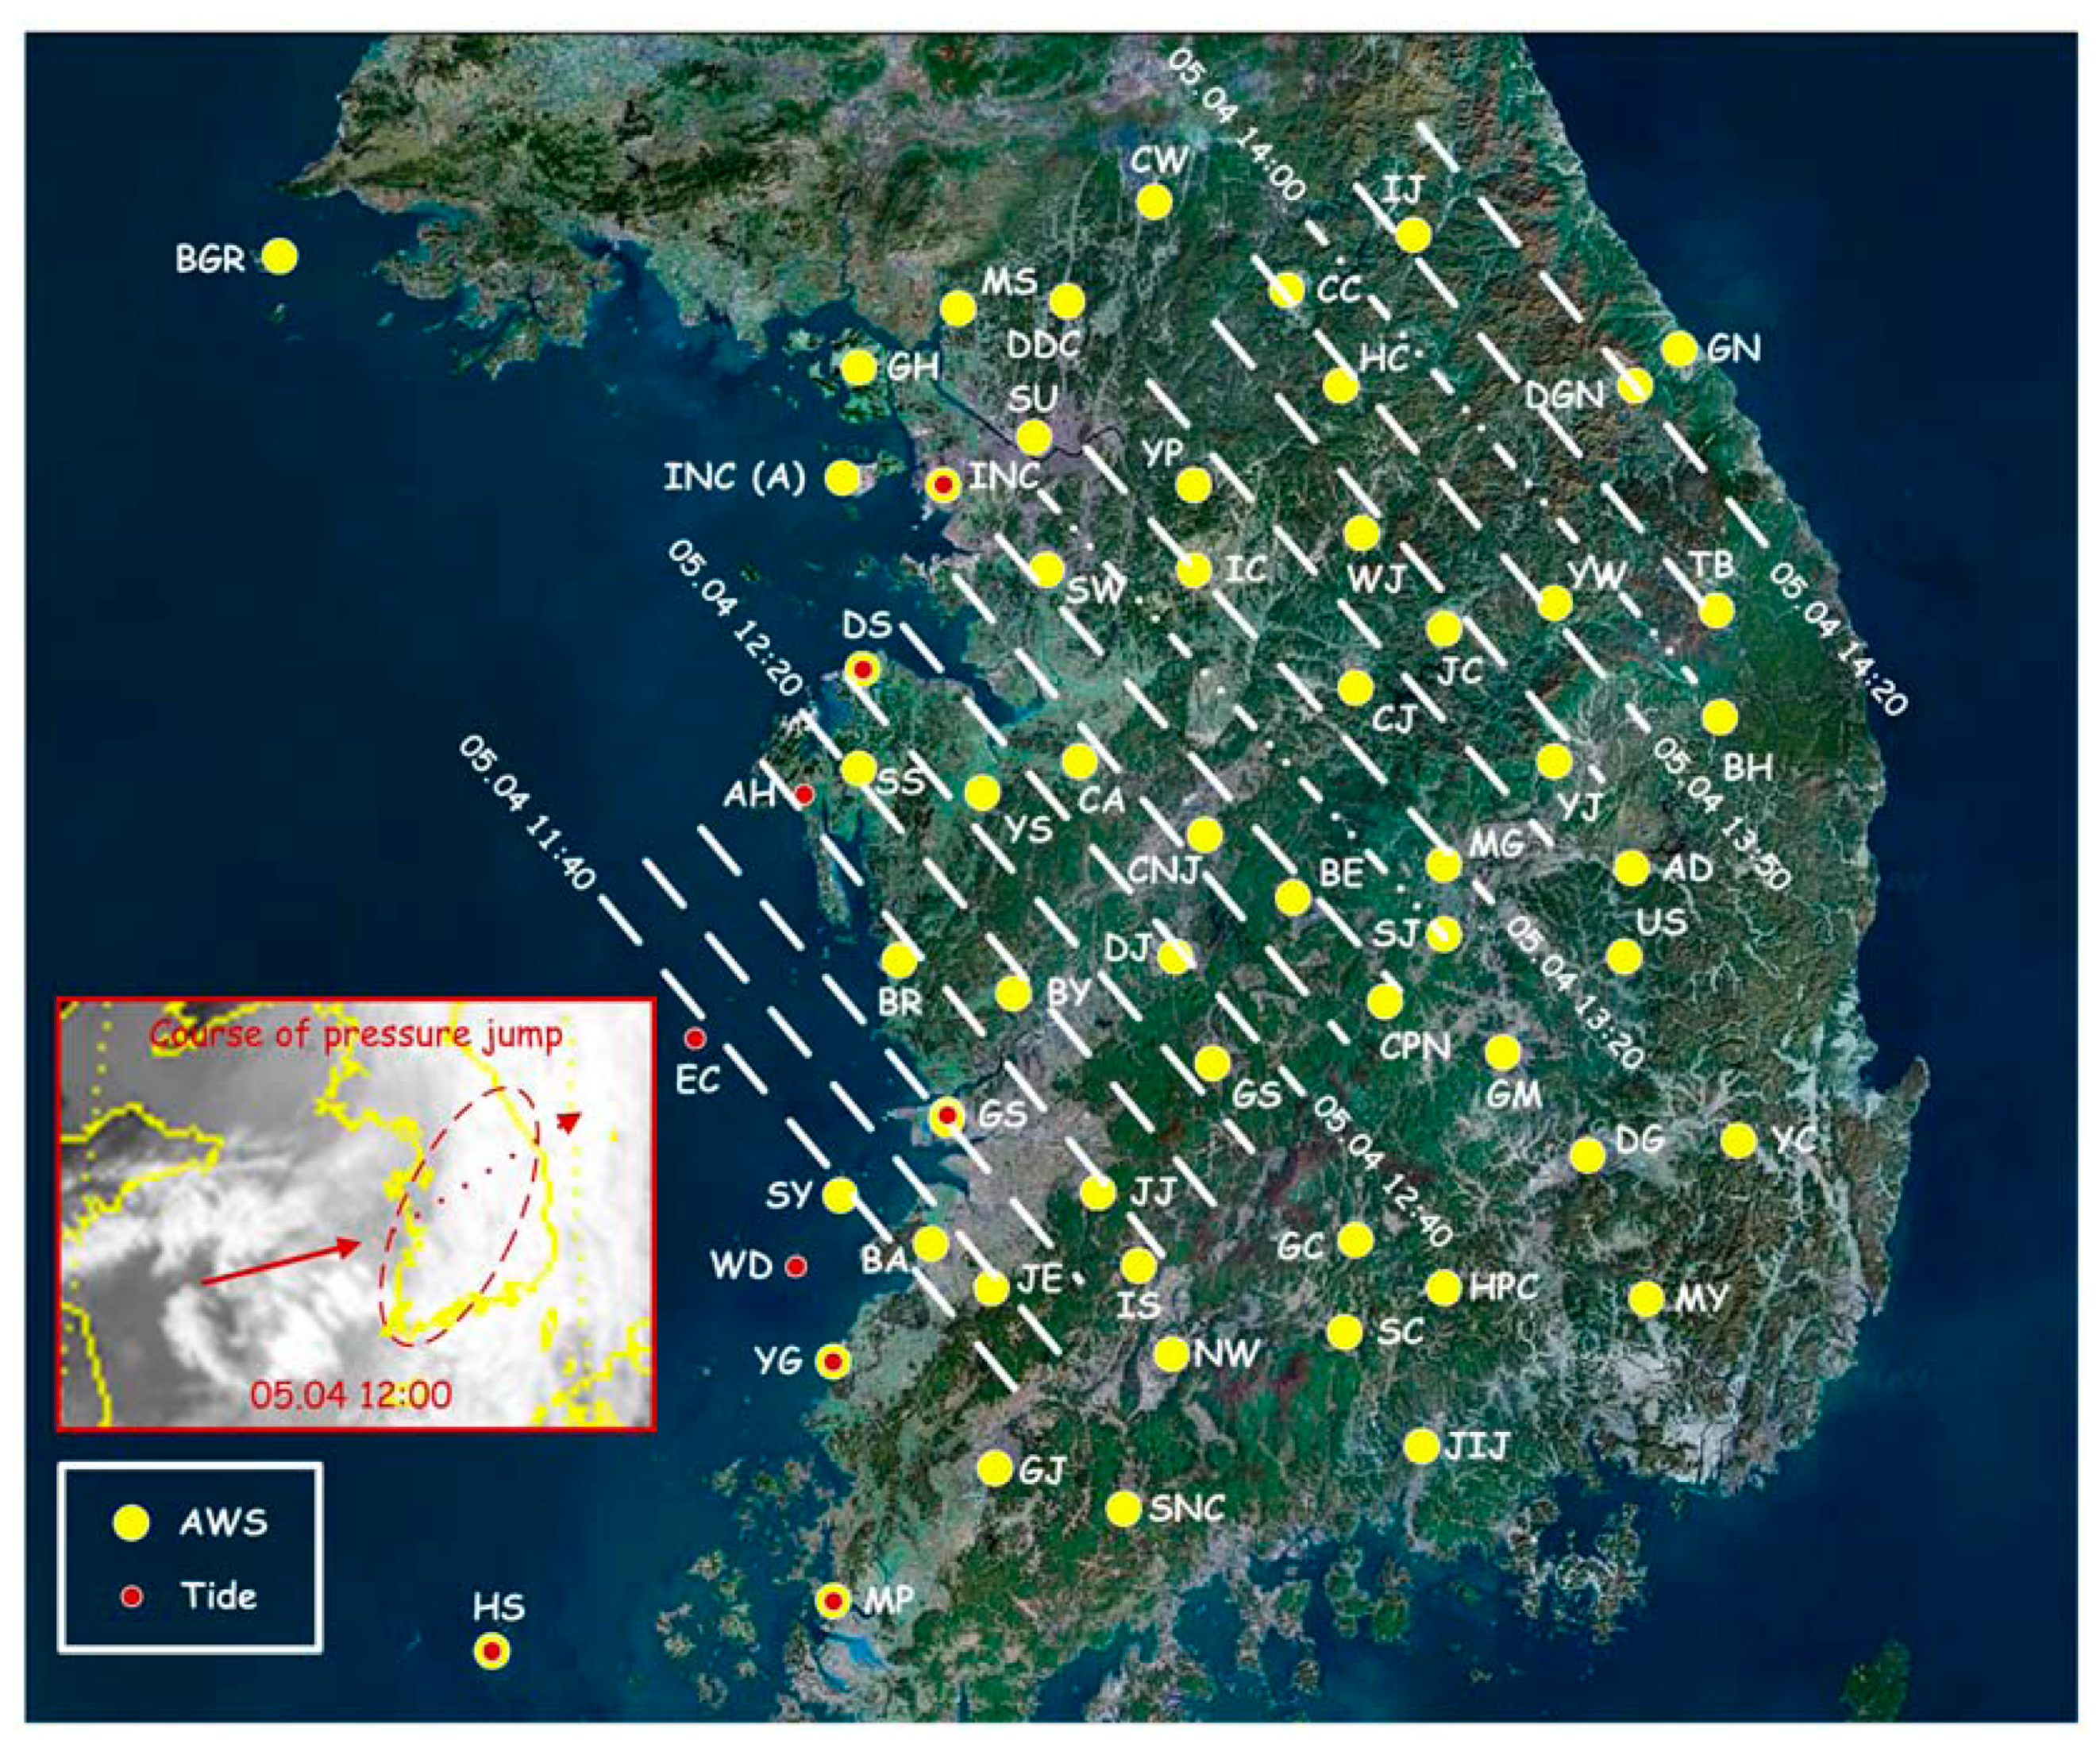
| Station | Abbreviation | Station | Abbreviation | Station | Abbreviation |
|---|---|---|---|---|---|
| Andong | AD | Gangneung | GN | Moonsan | MS |
| Anheung | AH | Geochang | GC | Mungyeong | MG |
| Baegryeong | BGR | Geumsan | GS | Namwon | NW |
| Boeun | BE | Gumi | GM | Sancheong | SC |
| Bonghwa | BH | Gunsan | GS | Sangju | SJ |
| Boryeong | BR | Gwangju | GJ | Seonyu | SY |
| Buan | BA | Hapcheon | HPC | Seosan | SS |
| Buyeo | BY | Heuksan | HS | Seoul | SU |
| Cheonan | CA | Hongcheon | HC | Suncheon | SNC |
| Cheongju | CNJ | Icheon | IC | Suwon | SW |
| Cheorwon | CW | Imsil | IS | Taebaek | TB |
| Chuncheon | CC | Incheon (airport) | INC (A) | Uiseong | US |
| Chungju | CJ | Incheon | INC | Wido | WD |
| Chupungnyeong | CPN | Inje | IJ | Wonju | WJ |
| Daegu | DG | Jecheon | JC | Yangpyeong | YP |
| Daegwalnyeong | DGN | Jeongeup | JE | Yeongcheon | YC |
| Daejeon | DJ | Jeonju | JJ | Yeonggwang | YG |
| Daesan | DS | Jinju | JIJ | Yeongju | YJ |
| Dongducheon | DDC | Milyang | MY | Yeongwol | YW |
| Eocheong | EC | Mokpo | MP | Yesan | YS |
| Ganghwa | GH |
© 2019 by the authors. Licensee MDPI, Basel, Switzerland. This article is an open access article distributed under the terms and conditions of the Creative Commons Attribution (CC BY) license (http://creativecommons.org/licenses/by/4.0/).
Share and Cite
Heo, K.-Y.; Yoon, J.-S.; Bae, J.-S.; Ha, T. Numerical Modeling of Meteotsunami–Tide Interaction in the Eastern Yellow Sea. Atmosphere 2019, 10, 369. https://doi.org/10.3390/atmos10070369
Heo K-Y, Yoon J-S, Bae J-S, Ha T. Numerical Modeling of Meteotsunami–Tide Interaction in the Eastern Yellow Sea. Atmosphere. 2019; 10(7):369. https://doi.org/10.3390/atmos10070369
Chicago/Turabian StyleHeo, Ki-Young, Jae-Seon Yoon, Jae-Seok Bae, and Taemin Ha. 2019. "Numerical Modeling of Meteotsunami–Tide Interaction in the Eastern Yellow Sea" Atmosphere 10, no. 7: 369. https://doi.org/10.3390/atmos10070369
APA StyleHeo, K.-Y., Yoon, J.-S., Bae, J.-S., & Ha, T. (2019). Numerical Modeling of Meteotsunami–Tide Interaction in the Eastern Yellow Sea. Atmosphere, 10(7), 369. https://doi.org/10.3390/atmos10070369