Article

Dust-Associated Airborne Microbes Affect Primary and Bacterial Production Rates, and Eukaryotes Diversity, in the Northern Red Sea: A Mesocosm Approach

1
Earth and Planetary Sciences, University of California, Santa Cruz, CA 95060, USA
2
Israel Oceanographic and Limnological Research, National Institute of Oceanography, 3108000 Haifa, Israel
3
The Interuniversity Institute for Marine Sciences of Eilat, POB 469, 88103 Eilat, Israel
4
Department of Ecology, Evolution and Behavior-Alexander Silberman Institute of Life Sciences, Hebrew University of Jerusalem, 91904 Jerusalem, Israel
5
Institute of Biophysics, CNR, 56124 Pisa, Italy
6
Institute of Marine Science, University of California, Santa Cruz, CA 95060, USA
*
Author to whom correspondence should be addressed.
Atmosphere 2019, 10(7), 358; https://doi.org/10.3390/atmos10070358
Submission received: 17 June 2019 / Revised: 25 June 2019 / Accepted: 26 June 2019 / Published: 28 June 2019
(This article belongs to the Special Issue Detection and Monitoring of Bioaerosols)

Abstract

:
The northern Red Sea (NRS) is a low-nutrient, low-chlorophyll (LNLC) ecosystem with high rates of atmospheric deposition due to its proximity to arid regions. Impacts of atmospheric deposition on LNLC ecosystems have been attributed to the chemical constituents of dust, while overlooking bioaerosols. Understanding how these vast areas of the ocean will respond to future climate and anthropogenic change hinges on the response of microbial communities to these changes. We tested the impacts of bioaerosols on the surface water microbial diversity and the primary and bacterial production rates in the NRS, a system representative of other LNLC oceanic regions, using a mesocosm bioassay experiment. By treating NRS surface seawater with dust, which contained nutrients, metals, and viable organisms, and “UV-treated dust” (which contained only nutrients and metals), we were able to assess the impacts of bioaerosols on local natural microbial populations. Following amendments (20 and 44 h) the incubations treated with “live dust” showed different responses than those with UV-treated dust. After 44 h, primary production was suppressed (as much as 50%), and bacterial production increased (as much as 55%) in the live dust treatments relative to incubations amended with UV-treated dust or the control. The diversity of eukaryotes was lower in treatments with airborne microbes. These results suggest that the airborne microorganisms and viruses alter the surface microbial ecology of the NRS. These results may have implications for the carbon cycle in LNLC ecosystems, which are expanding and are especially important since dust storms are predicted to increase in the future due to desertification and expansion of arid regions.

1. Introduction

Aerosols impact marine ecosystems by delivering macro- and micronutrients to surface seawater upon deposition [1,2,3]. These nutrients typically induce an increase in phytoplankton abundance and bacterial biomass and activity [4,5,6,7]. Atmospheric deposition also supplies a diverse array of microbes to marine ecosystems [8,9,10], of which up to 25% remain viable [11]. Upon deposition, airborne microorganisms affect phytoplankton/bacterial populations in surface seawater [7,12,13,14], and contribute to bacterial production [13] and N2 fixation [7,14], impacting both the carbon (C) and the nitrogen (N) cycles.
The impact of airborne microbes may be particularly important in low-nutrient low-chlorophyll (LNLC) regions, which make up 60% of the global oceans [15], particularly where or when aerosol deposition rates are high. The Gulf of Aqaba (GOA) in the northern Red Sea (NRS) is a LNLC region with high atmospheric deposition due to its proximity to the Arabian, Sahel, Negev, and Sahara deserts. This proximity leads to high annual rates of dust deposition (50–500 g m−2) in the NRS, with average dust loads reaching ~40 µg m−3 and ~700 µg m−3 during normal non-storm conditions and single dust storm events, respectively [16,17,18]. Previous studies showed that dust deposition in the NRS surface waters may alter chlorophyll a concentration, especially during the stratified most oligotrophic conditions in summer [17].
Thus far, observed changes in phytoplankton abundance (Prochlorococcus, Synechococcus, and picoeukaryotes) following aerosol deposition events or in simulated deposition experiments, have been solely attributed to the chemical constituents of aerosols (i.e., nutrients) [19], while biotic constituents have been typically ignored [7]. This has also been the case for the NRS [20], despite reports that diverse arrays of microorganisms are present in aerosols in neighboring systems [13,21,22], including the NRS [23].
Currently, the impact of airborne microbes on native phytoplankton and bacterial populations and putative antagonistic or synergistic relationships that may occur are still poorly assessed. In this study, we investigated the role of dust-associated airborne microbes on primary and bacterial production using the NRS as a model ecosystem. To this end, we conducted mesocosm experiments where “live dust” (containing potentially viable airborne microbes and nutrients) or “UV-treated dust” (contributing only leached chemical constituents) were added to surface seawater collected from the NRS. Microbial abundances and both primary and bacterial production were measured daily over 72 h. Metagenomics was used to assess how the surface water microbial community changed after the dust amendments and differences between live and “UV-treated” dust additions assessed.

2. Methods

2.1. Dust Collection

Dust was collected at the NRS (29°28′ N, 34°55′ E) on 18 May 2017, during a large storm event that originated from the Sahara Desert [7]. Dust particles were collected on pre-cleaned glass plates and kept frozen (which may have impacted viability of some of the organisms) until the experiment in July 2017. Prior to the experiment a subsample of the dust was placed under UV light for 48 h to kill the microorganisms associated with it (hereafter referred to as “UV-treated dust”). It has been shown that >95% of airborne microbes are inactivated by this UV treatment [7]. The remaining dust samples were left as is (hereafter referred to as “live dust”). Thus, live dust contributed nutrients, trace metals, and airborne microorganisms to the microcosms, whereas the UV-treated dust contributed only nutrients and trace metals.

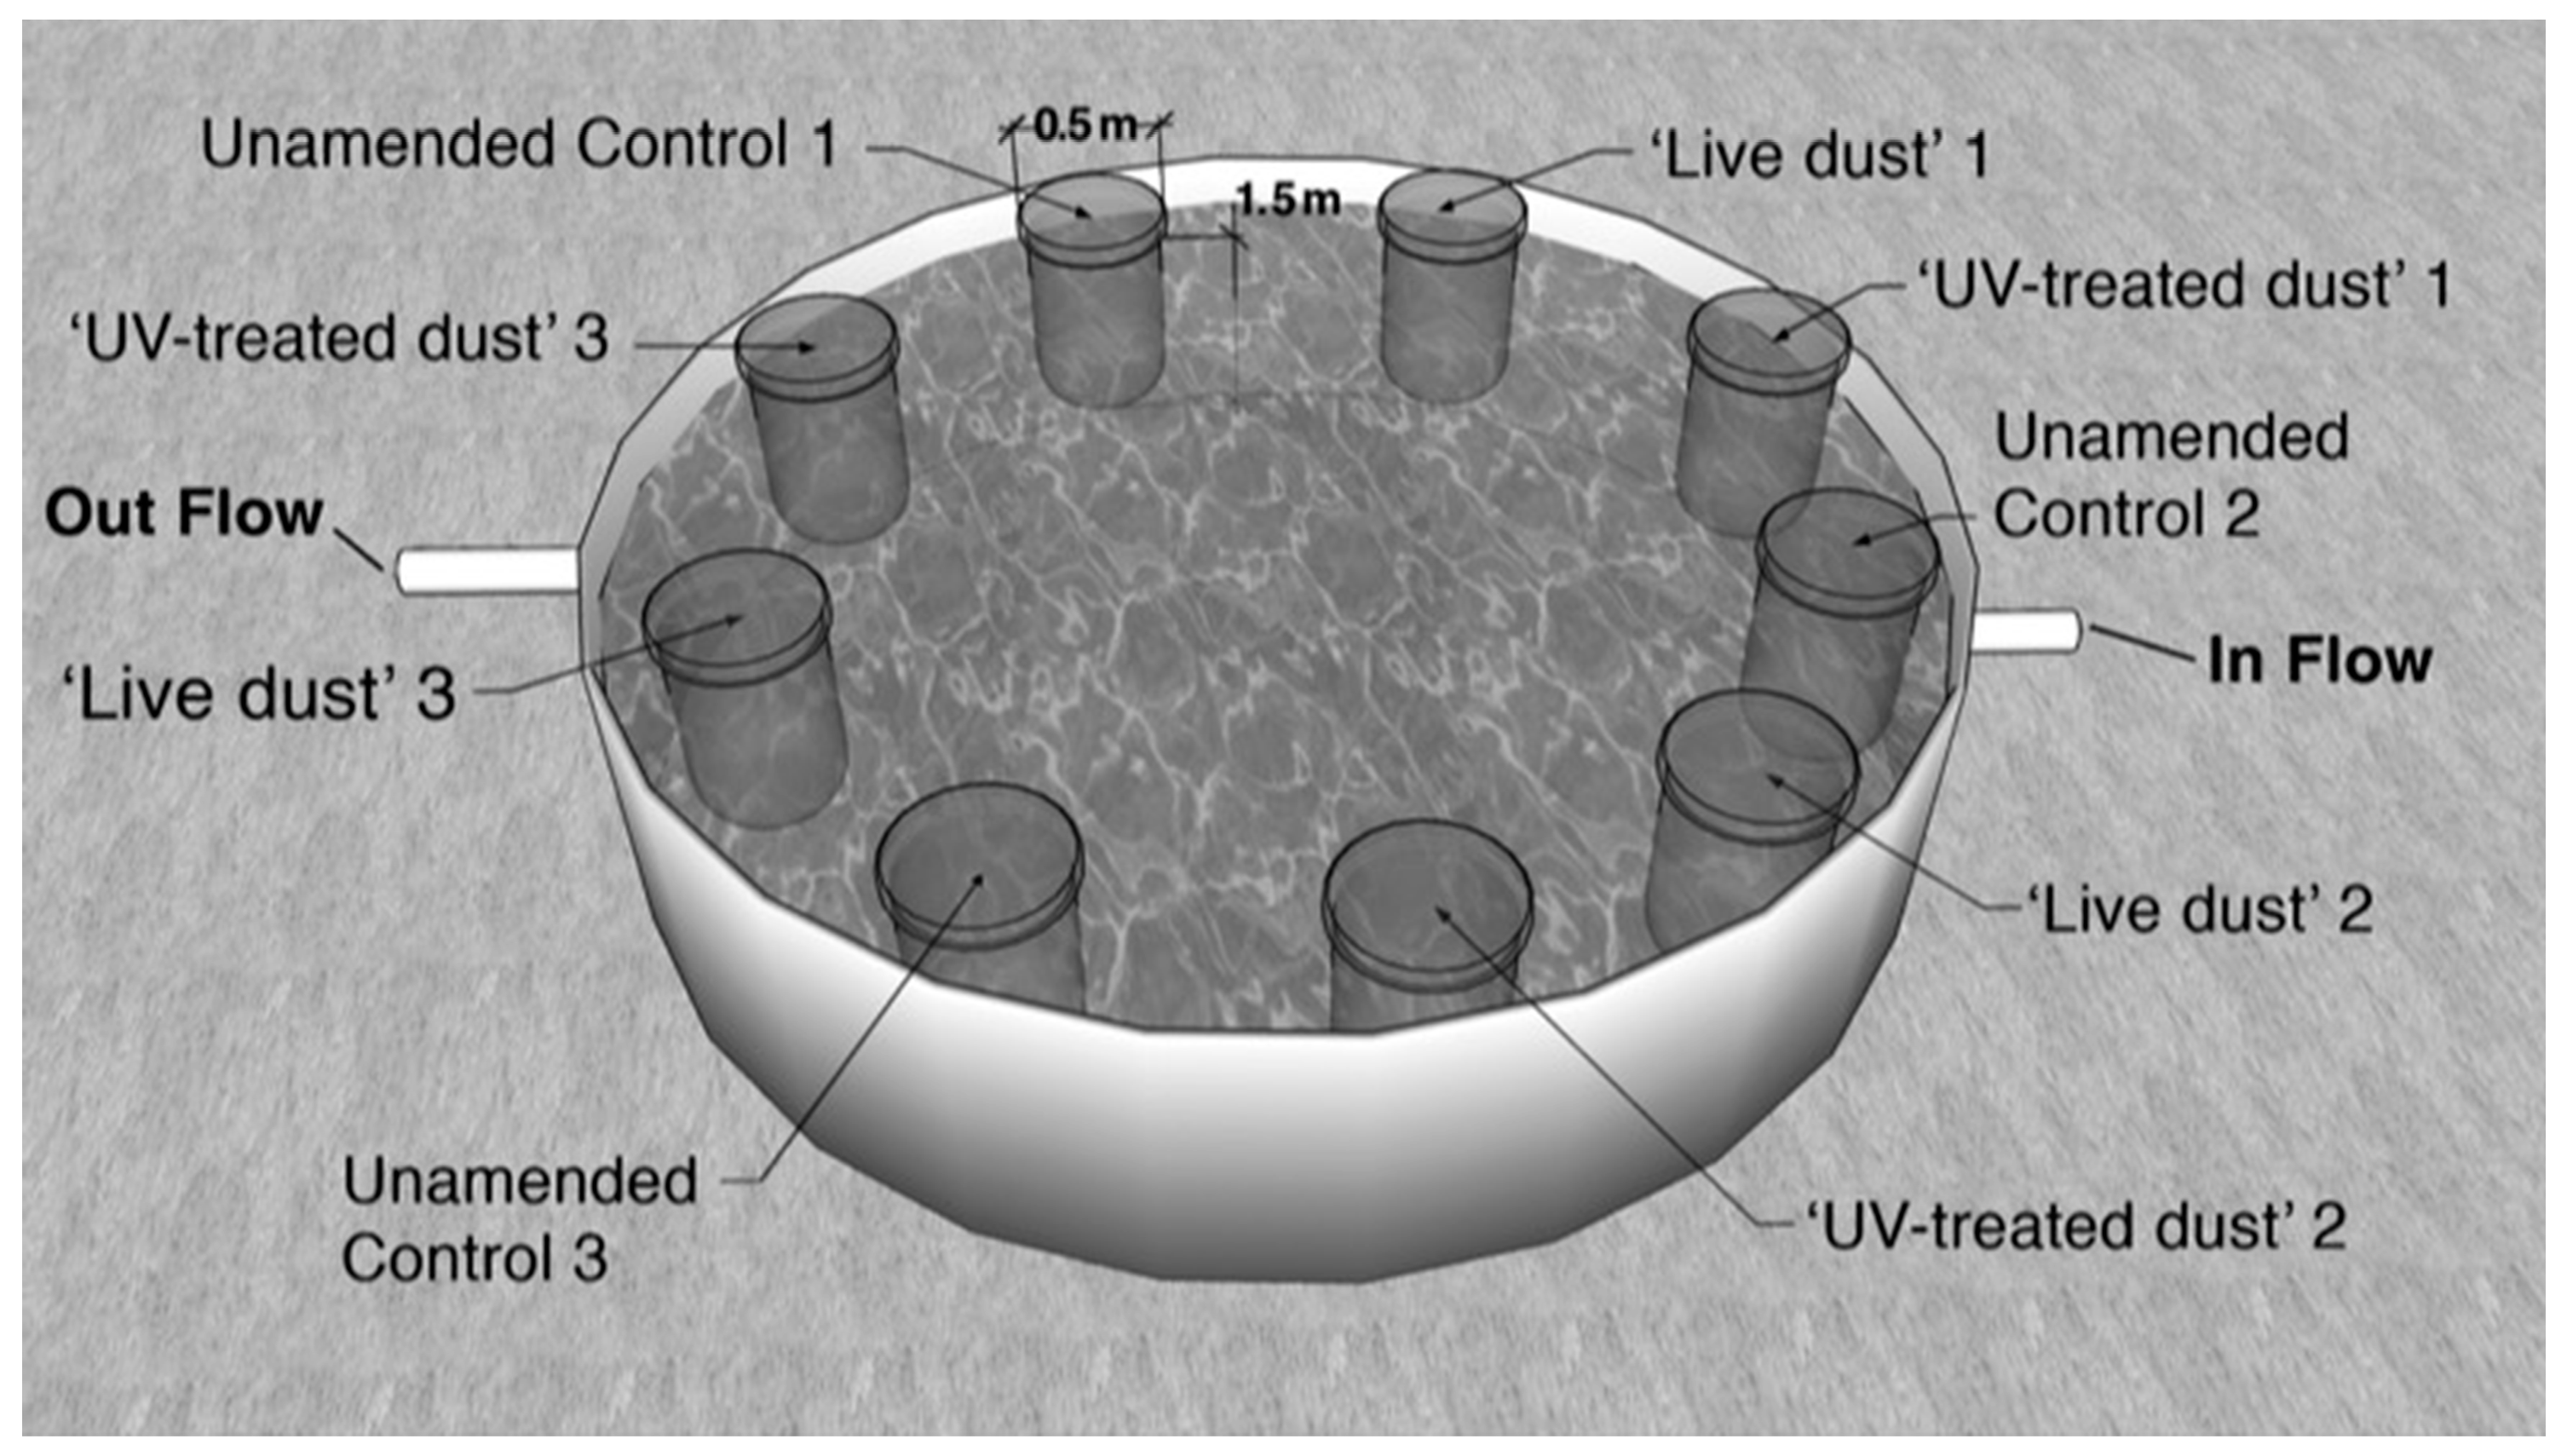
2.2. Experimental Setup

In order to assess the specific contribution/impact of viable airborne microorganisms following dust deposition events in the NRS, surface seawater (from ~10 m depth) from the NRS was homogeneously distributed into nine polycarbonate mesocosm bags (each 300 L) on 9 July 2017. The mesocosms were submerged in a shaded pool with circulating seawater to maintain ambient temperatures (25–28 °C) and low light intensities (80–100 μmol quanta m−2 s−1 during midday, LI-COR PAR sensor) (Figure 1). The mesocosms were amended with the following treatments, in triplicate: (1) seawater with the addition of 0.8 mg L−1 of dust (live dust), (2) seawater with the addition of 0.8 mg L−1 of UV-treated dust, and finally (3) unamended seawater as a control (seawater with no dust added to simulate normal non-dust storm conditions). The amount of dust added (0.8 mg L−1) was within the range of natural atmospheric deposition to the upper mixed layer of the NRS (~15 m) during intense dust storm events [17,24,25].The bags were mixed and subsampled before amendments were added at 6, 24, 44, and 72 h post dust additions as described below. We note that what we refer to as dust includes not only mineral dust but also other aerosol constituents that were deposited along with the mineral dust during the storm.

2.3. Bacterial Production (BP) and Primary Production (PP)

To quantify the impacts of airborne microbes on heterotrophic production, BP was measured using the (4,5-3H)-leucine incorporation method [26]. Briefly, seawater samples collected daily from the mesocosms (1.7 mL) were amended with 10 nmol of leucine L−1 (Perkin Elmer, specific activity 156 Ci mmol−1) and incubated for 4–6 h in the dark. Incubations were stopped by the addition of 100 µL of cold 100% trichloroacetic acid (TCA). Control samples containing seawater, radioisotope, and TCA added immediately upon collection were also run daily. At the lab, the samples were microcentrifuged twice with TCA 5% and 1 mL of scintillation cocktail (Ultima-Gold) was added to each vial. Disintegrations per minute (DPM) were measured using a TRI-CARB 2100 TR (Packard) liquid counter. A conversion factor of 1.5 kg C mol−1 per mole leucine was used [27].
To assess the impacts of airborne microbes on autotrophic production, the PP was measured following the 14C incorporation method [28]. Briefly, water samples were analyzed in triplicate with dark and zero time controls. The samples (50 mL) were collected at 8:00 a.m. into transparent polycarbonate bottles (Nalgene) and amended with 5 μCi of NaH14CO3 (Perkin Elmer). The bottles were incubated for 4–6 h in the same pool where the mesocosms were placed. The incubations were terminated by filtering the spiked seawater onto GF/F filters under low pressure (<50 mmHg). Excess 14C-bicarbonate was removed from the filters by acidification with HCl (32%) overnight. After adding 5 mL of scintillation cocktail (Ultima-Gold) to each vial, the radioactivity was measured using a TRI-CARB 2100 TR (Packard) liquid counter.

2.4. Chlorophyll-a (Chl-a)

To measure Chl-a, a proxy for total phytoplankton biomass, subsamples of seawater (500 mL) collected from the different mesocosms were passed through a Whatman GF/F filter, and 90% acetone solution was used for overnight extraction. The Chl-a concentrations were quantified using the non-acidification method [29], using a Trigoly fluorimeter equipped with 436 nm excitation and 680 nm emission filters.

2.5. Picophytoplankton and Heterotrophic Bacterial Abundance

To quantify the abundance of picophytoplankton and heterotrophic bacteria, seawater subsamples (1.7 mL) were collected from the different mesocosm bags, fixed with 50% glutaraldehyde (0.15% final concentration, Sigma G7651), incubated for 10 min at room temperature, snap frozen in liquid nitrogen, and stored in −80 °C until analyses within a few weeks. Cell counts were performed by flow cytometry (Attune, Applied Biosystems) equipped with a syringe-based fluidic system and 488 nm and 405 nm lasers. Cyanobacteria (Synechococcus and Prochlorococcus) and picoeukaryotes were detected based on the orange fluorescence of phycoerythrin (585 nm) and the red fluorescence of Chl-a (630 nm), side scattered and forward scattered at a flow rate of 100 µl min−1. Heterotrophic bacterial cells were first stained with a SYTO9 solution for 10 min in the dark and then run at a low flow rate of 25 µL min−1 using a discrimination threshold of green fluorescence (520 nm). One µm beads (Polysciences) were used as internal reference.

2.6. β-Glucosidase (β-Glu), Aminopeptidase (AMA), and Alkaline Phosphatase (APA) Activity

To determine the rate of polysaccharide degradation by bacteria, β-Glu activity was determined by the 4-methylumbelliferyl-β-D-glucopyranoside (Sigma M3633) method [30], and AMA was determined by the L-Leu-7-amido-4-methyl-coumarin method. Substrate was added in triplicate to 1 mL water samples (final concentration of 50 µM) and incubated in the dark at an ambient temperature for 24 h. To assess the rate of scavenging of organic matter due to phosphate limitation, the APA was determined by the 4-methylumbeliferyl phosphate (MUF-P: Sigma M8168) method [31]. Substrate was added in triplicate to 1 mL water samples (final concentration of 50 µM) and incubated in the dark at an ambient temperature for 24 h. The increase in fluorescence of 4-methylumbelliferone (MUF) was measured at 365 nm excitation, 455 nm emissions (GloMax®-Multi Detection System E9032) and calibrated against a MUF standard (Sigma M1508).

2.7. DNA Extraction, Library Preperation, and Sequencing

To assess the diversity of microorganisms, seawater (1 L) from each mesocosm was filtered onto 0.2 µm polycarbonate filters. Total DNA was extracted from the filters using the phenol chloroform method [32]. Total DNA was also extracted from the aerosols collected using the same method. Polymerase chain reaction (PCR) using primers 515 (forward) and 806 (reverse) for 16S rRNA and primers EUK7F (forward) and EUK570R (reverse) for 18S rRNA, with barcodes on the forward primer, were carried out using the HotStarTaq Plus Master Mix Kit (Qiagen, Valencia, CA, USA). The samples were pooled together in equal proportions (based on their MW and DNA concentrations), purified using calibrated Ampure XP beads, and used to prepare libraries using a Nextera DNA Sample Preparation Kit (IllFumina). Libraries were loaded to a 600 Cycles v3 Reagent cartridge (Illumina) and sequenced by illumina MiSeq.

2.8. Bioinformatics

Samples were processed using the open-source Quantitative Insights into Microbial Ecology 2 (QIIME 2) pipeline [33]. Sequences were demultiplexed and barcodes were trimmed. Data were denoised using DADA2 [34], sequences were clustered into amplicon sequence variants (ASVs) which can be thought of as 100% operational taxonomic units (OTUs). Taxonomic classifier was trained [35] using Greengenes [36] for 16S and Silva [37] for 18S. Taxonomies were assigned using the naive Bayes method [38].

2.9. Statistical Analysis

The data in figures and tables are means and standard deviations (n = 3). Differences between treatments were tested using analysis of variance (ANOVA) and Tukey’s post-hoc testing, and a p-value of 0.05 was used to determine significance unless noted otherwise. All tests were performed using R.

3. Results

The initial properties of the NRS surface waters used in the experiment (i.e., control mesocosms) are as shown in Rahav et al. [7]. Briefly, the surface water of the NRS exhibited oligotrophic characteristics with low micro- and macronutrients levels that were representative of summer conditions in the NRS: NO3 + NO2 (140 ± 13 nM), PO4 (8 ± 1 nM), DOC (74 ± 1 µM), Fe (8.5 ± 1.8 nM), Zn (8.7 ± 2.1 nM) and Cu (1.4 ± 0.9 nM) [39,40]. Additionally, bacterial abundance (3.5 × 10⁵ ± 15 × 104 cell/mL), bacterial production (1.41 ± 0.08 μg C L−1 h−1), primary production (0.60 ± 0.01 μg C L−1 h−1), ß-Gl (1.42 ± 0.07 nM L−1 h−1), APA (5.58 ± 0.17 nM L−1 h−1), AMA (2.60 ± 0.09 nM L−1 h−1), Chl-a (0.28 ± 0.01 μg/L), and Prochlorococcus (1.49 × 10⁴ ± 179 cell/mL), Synechococcus (5.14 × 10⁴ ± 1.04 × 10⁴ cell/mL), picoeukaryote (1.58 × 10³ ± 118 cell/mL) abundances in the surface water of the NRS were determined (Supplementary Table S1). Leached micro/macronutrient concentrations added by the live or UV-treated dust additions to the mesocosms were similar, representing: ~48 nM NO3 + NO2 (+34% of the ambient levels) and ~2.4 nM PO4 (+30%), 165 ± 2 nM DOC (+0.22%), 3.3 nM Fe (+39%), ~7 nM Zn (+77%), and <1 nM Cu (+28%) (Supplementary Table S2).
Although we reported results for all time points, we only included results from 20 h and 44 h after dust additions, and not 72 h, in our statistical analysis. These time intervals were selected because this was when the maximum differences in parameters between treatments were observed. Moreover, many of the parameters began to decrease after 44 h (including in the control treatments), suggesting that the changes observed were more likely due to “bottle effects” than to the changes in response to nutrient or microbial additions.

3.1. Changes in Phytoplankton and Bacterial Abundance following Dust Additions

Chl-a was measured as a proxy for total phytoplankton biomass (Figure 2A). For all treatments Chl-a concentrations increased slightly 20 h after amendments, and then steadily decreased throughout the experiment (Figure 2A). Overall, Chl-a concentrations were significantly higher in treatments amended with live dust and UV-treated dust as compared with the control 20–44 h after amendment (Table 1, Figure 2A). However, there were no significant differences between Chl-a concentrations of the live dust and UV-treated dust treatments.
Prochlorococcus (Figure 2B), Synechococcus (Figure 2C) and picoeukaryotes (Figure 2D) dominate autotrophic communities in the NRS during the summer time [41]. All three autotrophs’ abundances were different in the dust amendments as compared with the control treatments (Figure 2B–D). Prochlorococcus abundances decreased dramatically immediately after amendment in both dust treatments, while in the control we saw a decrease at only 20 h after amendment (Figure 2B). There was a slight increase in all treatments at 44 h, followed by another decrease. Prochlorococcus abundances were significantly lower in the live dust treatments (mean 3.7 × 10³ cells/mL) and UV-treated dust (mean 5.8 × 10³ cells/mL) than in the control treatments (mean 9.0 × 10³ cells/mL) at 20 h post addition (Figure 2B, Supplementary Table S3). Prochlorococcus abundance in the dust treatments remained significantly lower than the control throughout the remainder of the experiment (Figure 2B), with no significant differences between live dust and UV-treated dust at both 20 h and 44 h after amendment. Synechococcus abundances initially decreased in all treatments and increased again at 20 h (Figure 2C). Synechococcus abundances in the dust treatments decreased again at 44 h after addition and were significantly different between the control (mean 6.62 × 10⁴ cells/mL), live dust (mean 4.73 × 10⁴ cells/mL), and UV-treated dust (mean 5.64 × 10⁴ cells/mL), treatments (Figure 2C, Supplementary Table S3). Synechococcus abundance was significantly higher in the control than in the live dust (28%) and UV-treated dust (14%) (p-value < 0.05) treatments, and live dust treatments had significantly lower Synechococcus abundance (−9.0 × 10³ cells/mL) than the UV-treated dust treatments (Table 1, Supplementary Table S4). Picoeukaryote abundance was significantly increased in the live dust at 20 h and at 44 h (mean 4.4 × 10³ cells/mL, mean 5.2 × 10³ cells/mL, respectively) and UV-treated dust (mean 4.6 × 10³ cells/mL, 5.2 × 10³ cells/mL, respectively) treatments than in the control (mean 1.9 × 10³ cells/mL, mean 1.9 × 10³ cells/mL, respectively) (Figure 2D, Supplementary Table S3), after which abundances declined (Figure 2D) paralleling the dynamic of total Chl-a (Figure 2A). There was no significant difference in picoeukaryote abundance between the live dust and UV-treated dust (Supplementary Table S4).
Heterotrophic bacterial abundance (BA) 20 h post-amendment in both dust treatments increased up to ~150% relative to control levels, after which BA remained constant (Figure 2E). The BA in the control remained relatively stable throughout the experiment (Figure 2E). There was a significant difference (p-value < 0.05) in heterotrophic bacterial abundance between the control (mean 3.68 × 10⁵ cell/mL) and the live dust (mean 9.09 × 10⁵ cell/mL) and UV-treated dust (mean 9.91 × 10⁵ cell/mL) treatments at 20 h, and between the control (mean 3.96 × 10⁵ cell/mL) and the live dust (mean 9.13 × 10⁵ cell/mL), and UV-treated dust (mean 9.17 × 10⁵ cell/mL) treatments at 44 h (Figure 2E, Supplementary Tables S3 and S4). There were no significant differences in BA between the live dust and UV-treated dust (Supplemental Table S4).

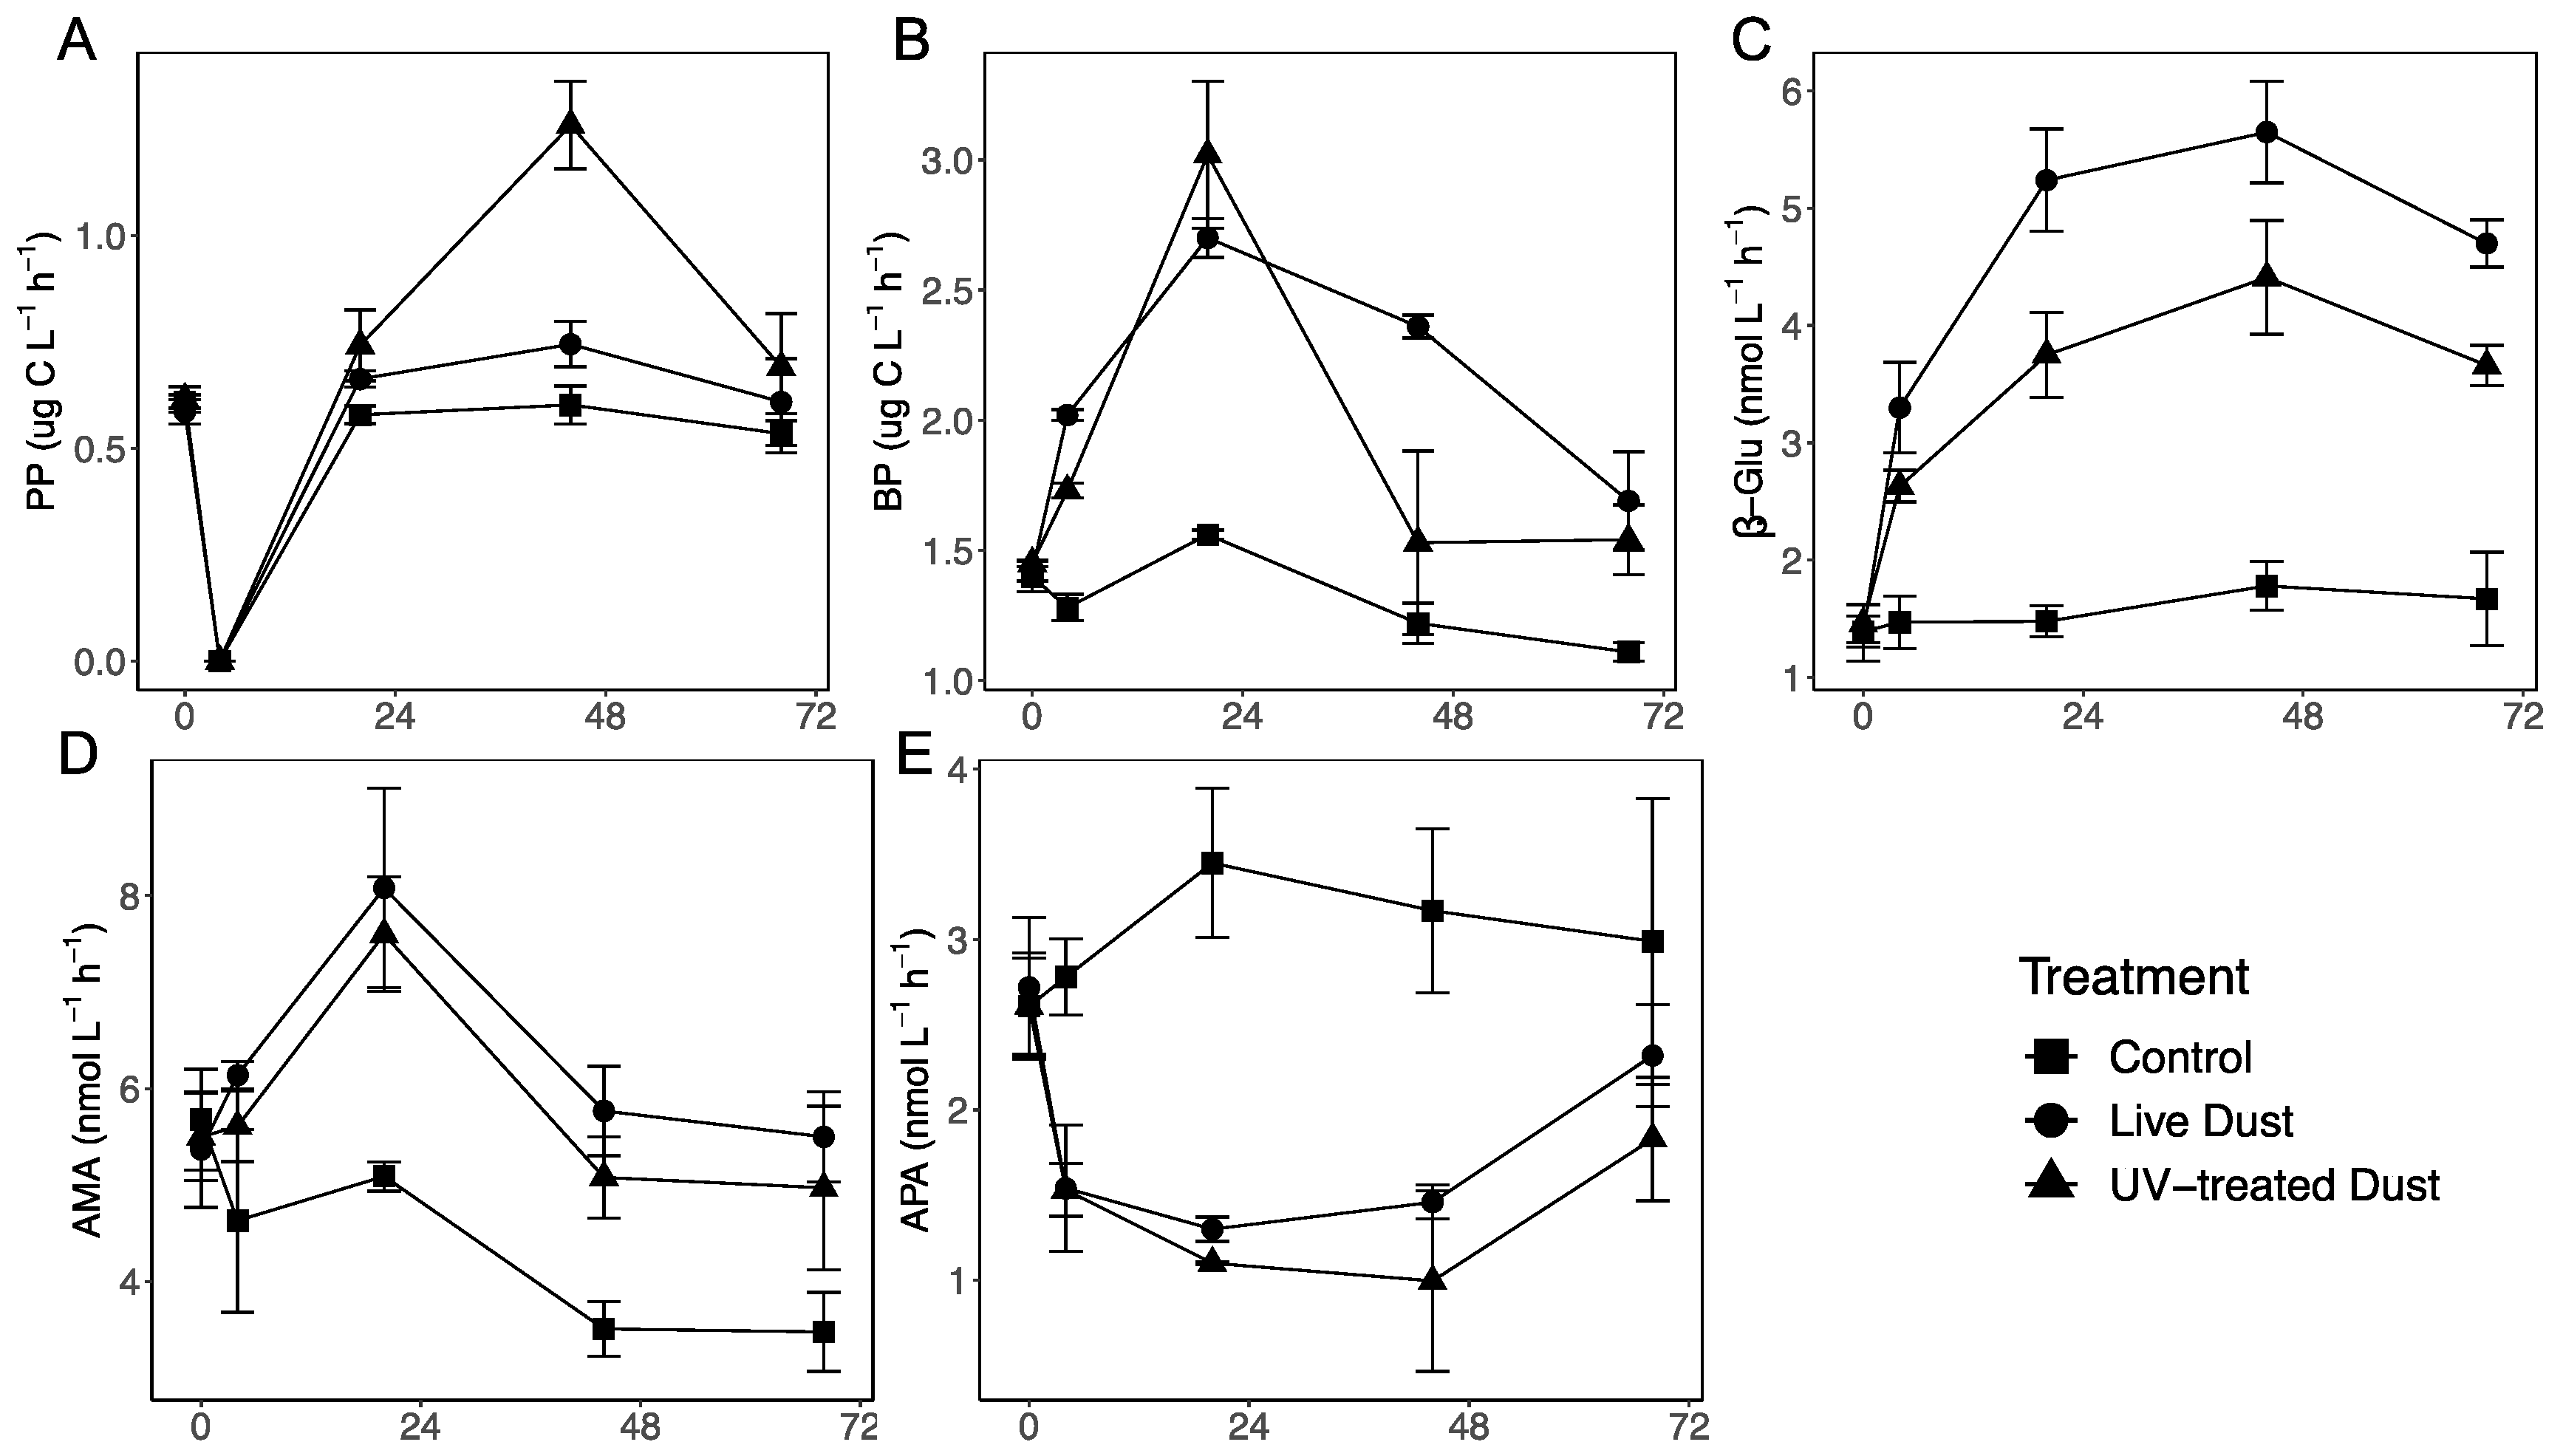
3.2. Changes in Autotrophic and Heterotrophic Production following Dust Additions

Rates of primary production (PP) in all the treatments were relatively constant throughout the experiment with small differences between dust and control treatments, aside from 44 h after amendment (Figure 3A). The PP in live dust (20 h mean 0.66 µg C L−1 h−1, 44 h mean 0.74 µg C L−1 h−1), and UV-treated dust (20 h mean 0.74 µg C L−1 h−1, 44 h mean 1.25 µg C L−1 h−1) treatments were significantly higher than the control (20 h mean 0.58 µg C L−1 h−1, 44 h mean 0.60 µg C L−1 h−1) at 20 h and 44 h (Figure 3A, Supplementary Table S3). At 44 h, PP rates were significantly lower in the live dust treatments than in UV-treated dust treatments, with a net difference of 0.52 µg C L−1 h−1 (Table 1, Supplementary Table S4).
Rates of heterotrophic bacterial production (BP) increased in the live dust (mean 2.70 µg C L−1 h−1) and UV-treated dust (mean 3.02 µg C L−1 h−1), treatments 20 h after amendment, and were significantly higher than rates of BP in the control (mean 1.56 µg C L−1 h−1) (Figure 3B, Supplementary Table S3), respectively. At 44 h after amendment, BP rates decreased in the UV-treated dust treatments (mean 1.53 µg C L−1 h−1) drastically while the live dust (mean 2.36 µg C L−1 h−1) remained relatively stable (Figure 3B). Live dust treatments with airborne microbes had significantly higher rates of BP than both control and UV-treated dust treatments (Supplementary Table S4). The net BP rates of airborne microbes (difference between average BP rates in live and UV-treated treatments) was 0.83 µg C L−1 h−1 (Table 1).
Extracellular enzymatic activity rates were used as additional measures of the activity of different groups of organisms. Beta-glucosidase (β-Glu) (Figure 3C) and leu-aminopeptidase (AMA) (Figure 3D) activities were used to measure the extracellular enzymatic activity of heterotrophic prokaryotes, whereas alkaline phosphatase activity (APA) (Figure 3E) rates were used to measure extracellular enzymatic activity of algae.
While β-Glu activity rates of the control remained relatively constant throughout the experiment (20 h mean 1.48 nM L−1 h−1, 44 h mean 1.78 nM L−1 h−1), β-Glu activity rates of the live dust (20 h mean 5.24 nM L−1 h−1, 44 h mean 5.66 nM L−1 h−1) and UV-treated dust (20 h mean 3.75 nM L−1 h−1, 44 h mean 4.41 nM L−1 h−1) treatments increased significantly 20 h and 44 h after amendments (Figure 3C). The ß-Gl activity rates were significantly higher in live dust treatments than UV-treated dust treatments (Supplementary Table S4), with airborne microbes contributing up to 1.24 nM L−1 h−1 (Table 1). The AMA rates in the live dust’(mean 8.08 nM L−1 h−1) and UV-treated dust (mean 7.59 nM L−1 h−1) treatments increased 20 h after amendment, whereas AMA rates in the control decreased (mean 5.09 nM L−1 h−1) (Figure 3D, Supplementary Table S4). At both timepoints, both UV-treated dust and live dust treatments had higher rates of AMA (64% and 45%, respectively at 44 h) than the control (p-value < 0.05), but no significant differences between the live and UV-treated treatments were observed (Figure 3D, Supplementary Table S4).
The APA rates decreased for both live dust (mean 1.3 nM L−1 h−1) and UV-treated dust (mean 1.097 nM L−1 h−1) treatments while rates in the control (mean 3.45 nM L−1 h−1) increased 20 h after amendment (Figure 3E). There were no significant differences in the APA rates between the live and UV-treated dust throughout the experiment (Supplementary Table S4).

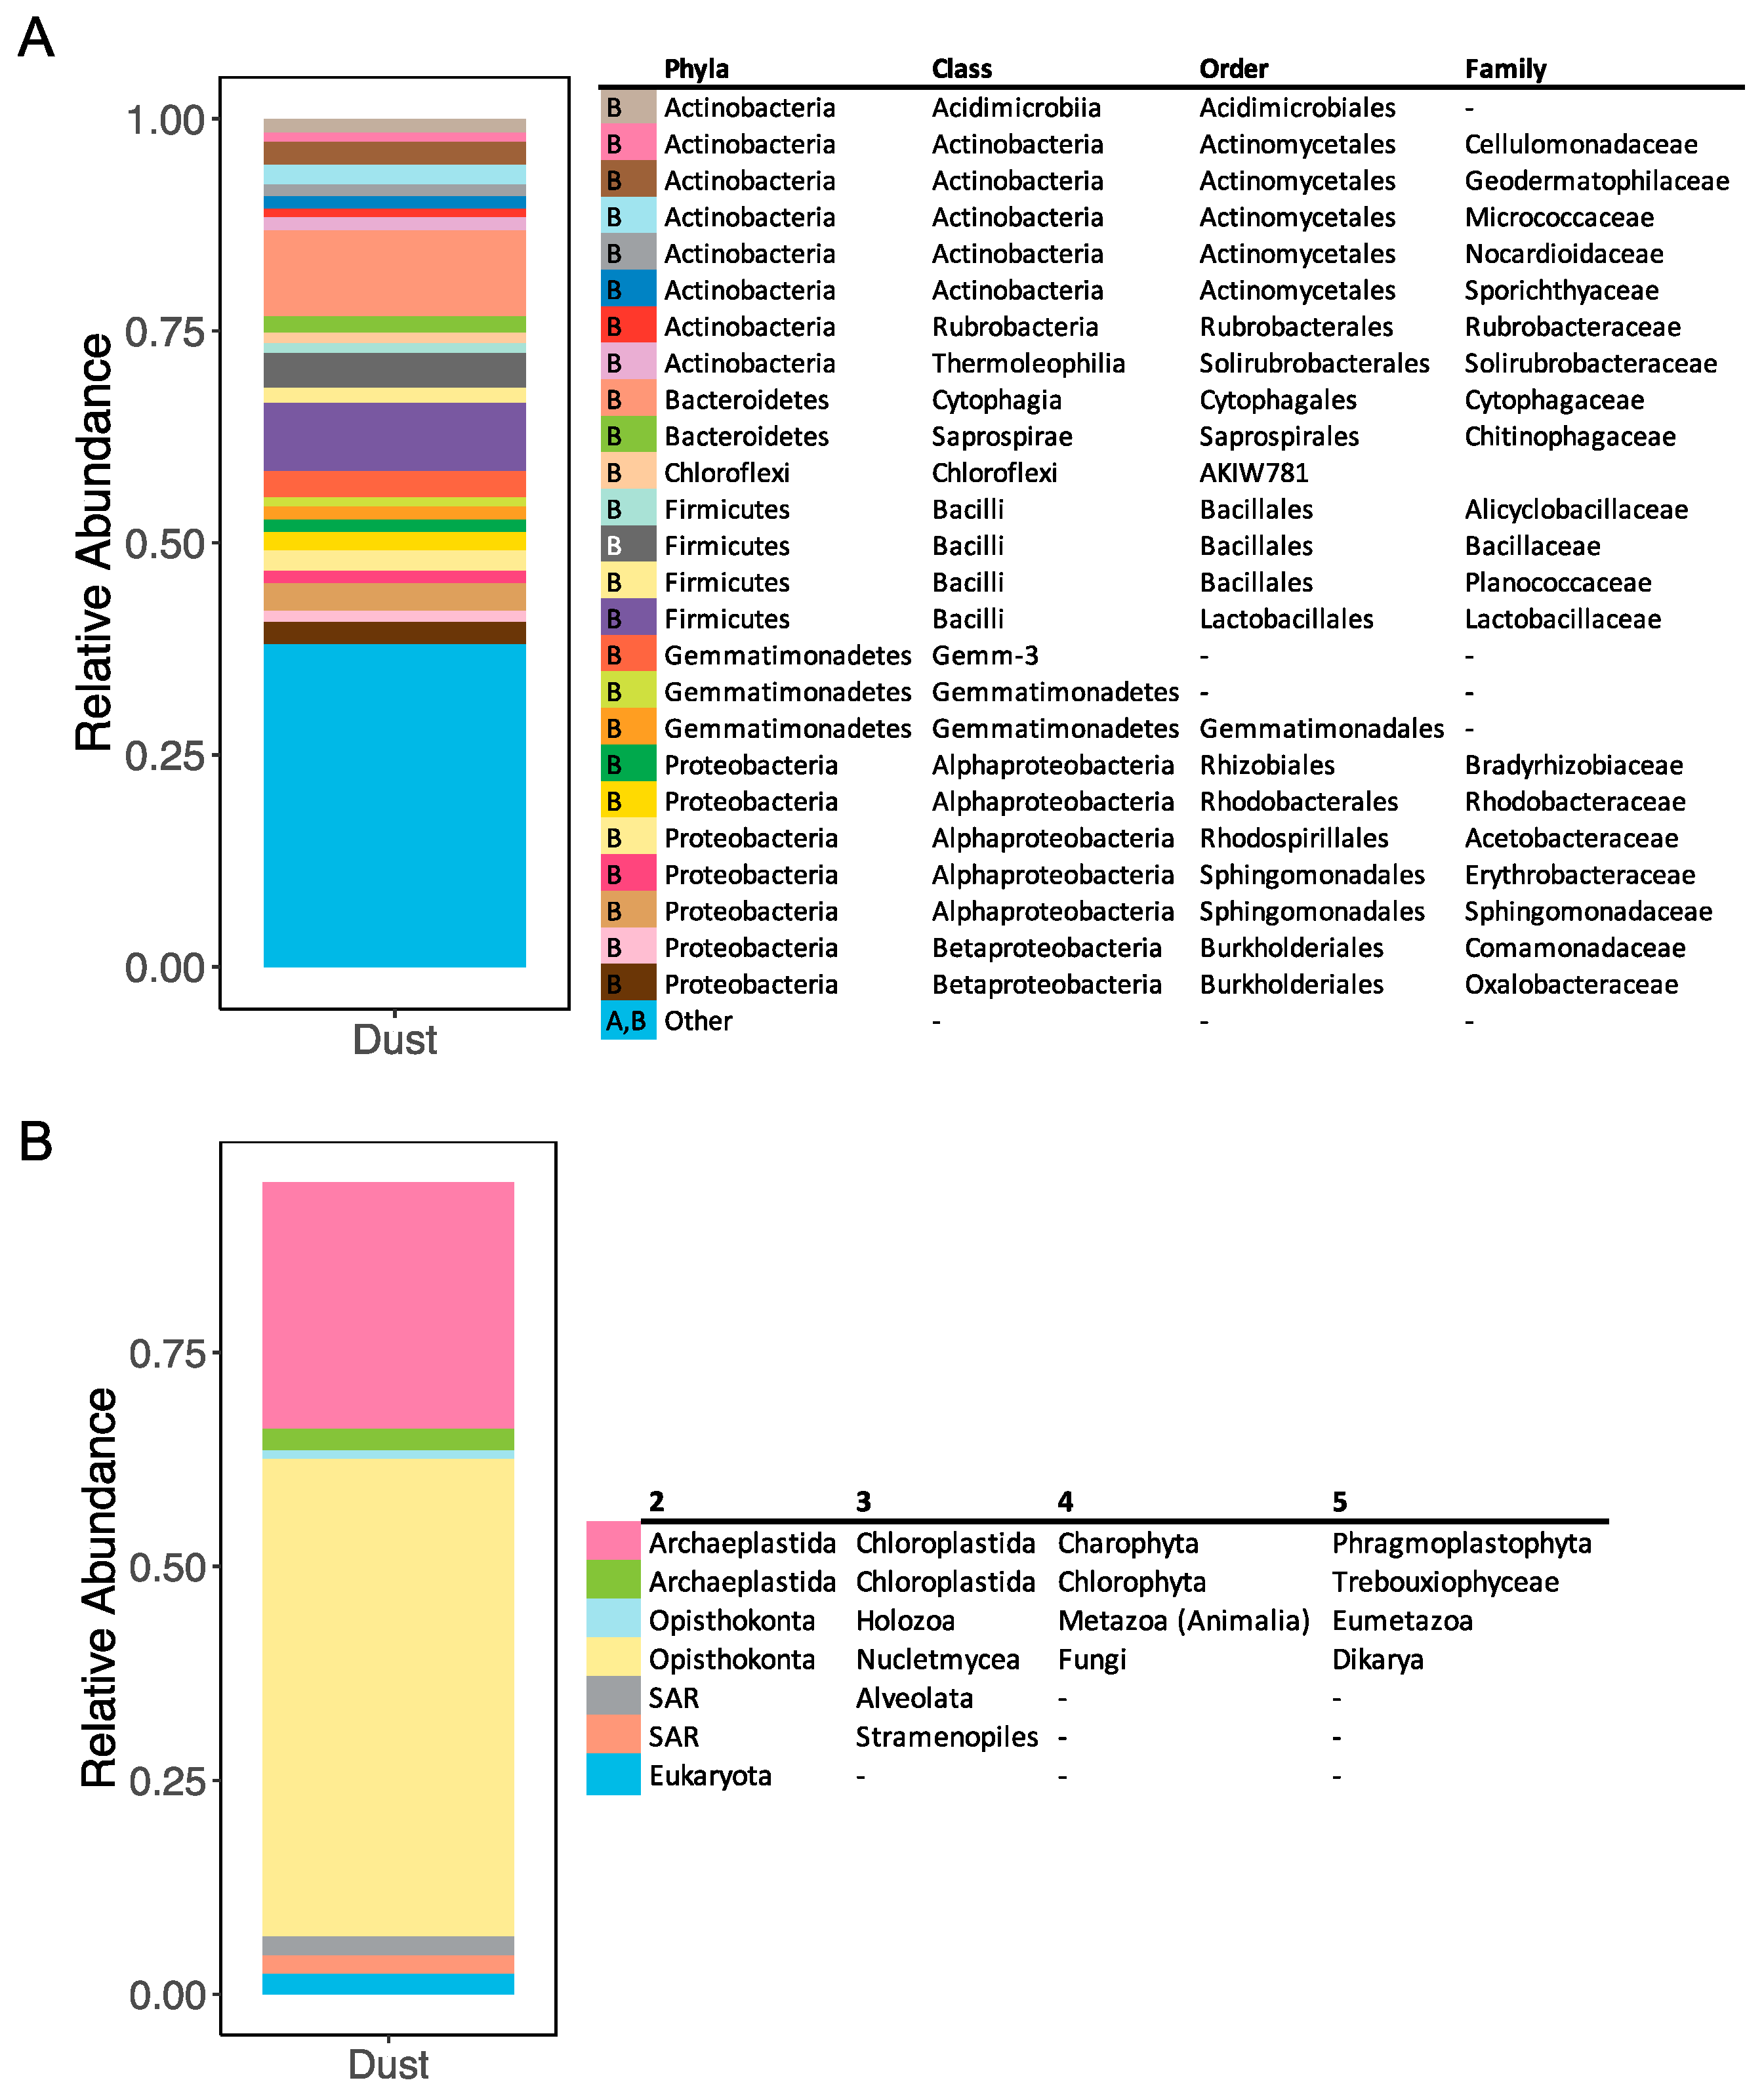
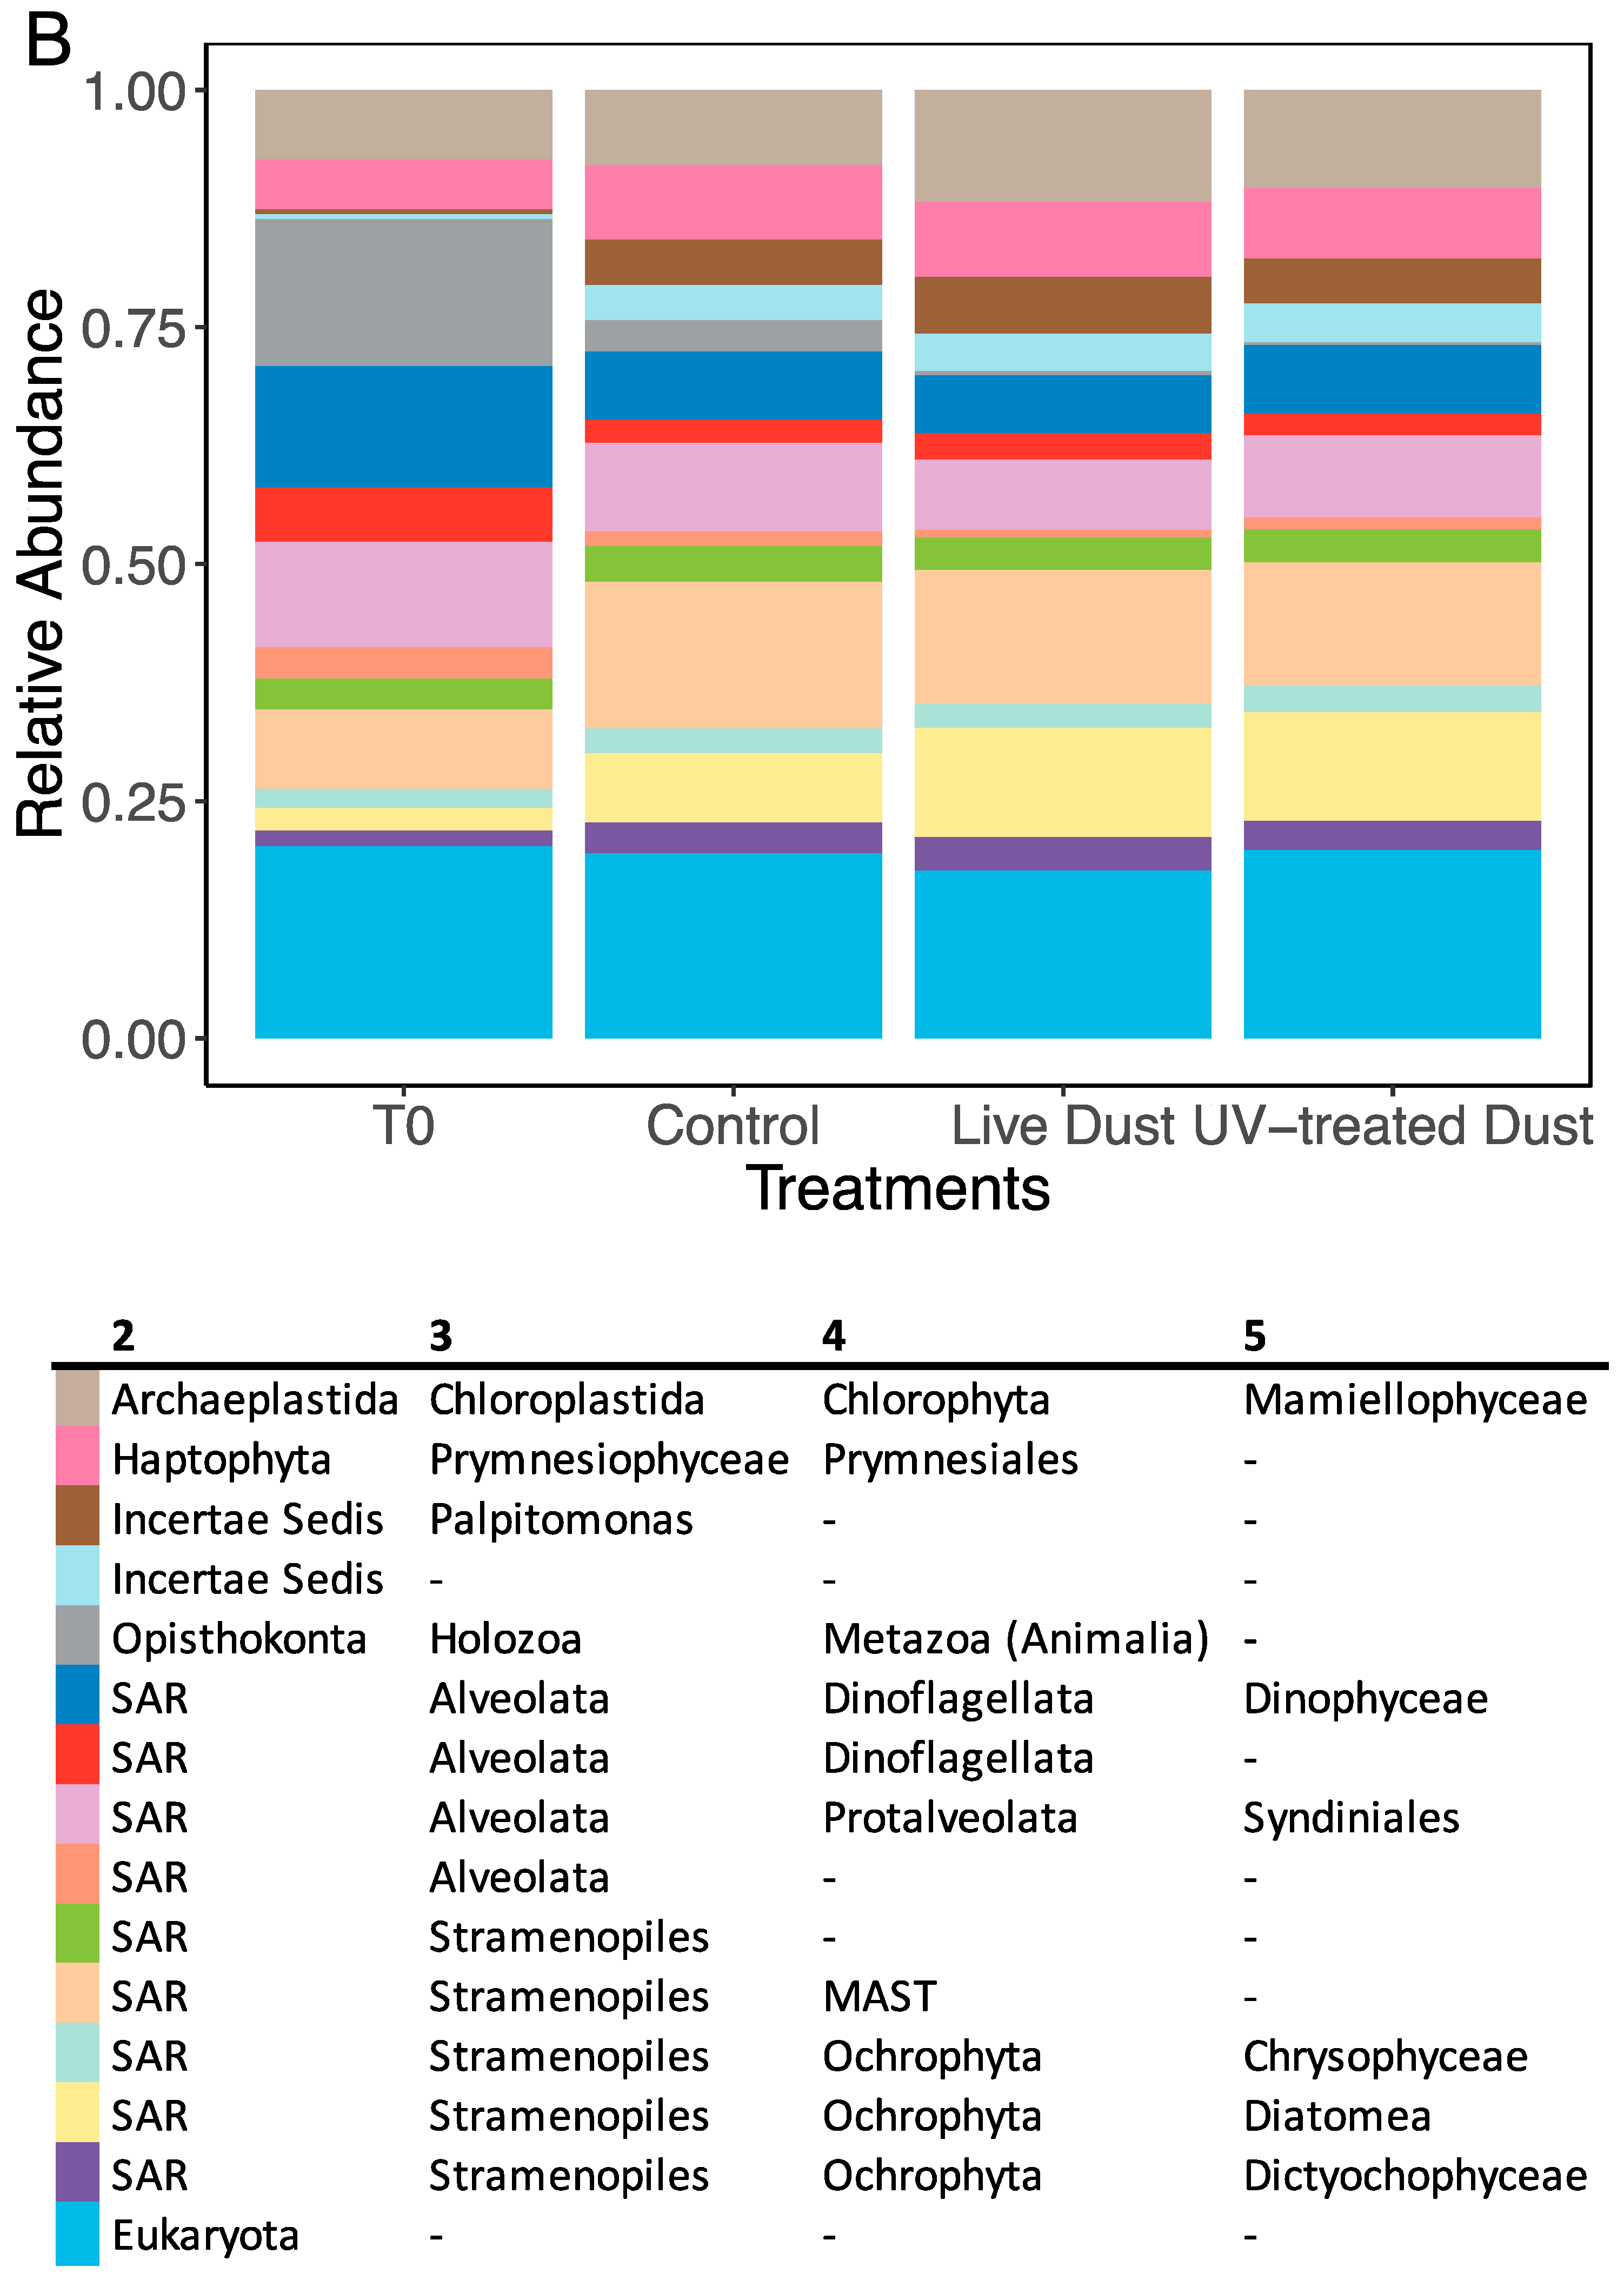
3.3. Dust-Associated Prokaryotes and Eukaryotes

The prokaryotic community in the dust sample collected and used in this experiment was comprised of bacteria from the Firmicutes (15%), Gemmatimonadetes (15%), Actinobacteria (13%) and Bacteroidetes (12%) phyla (Figure 4A). A large portion of prokaryotes (30%) were bacteria phyla that individually made up less than 1% of the relative abundance (Figure 4A). The eukaryotic community in the aerosols was dominated by Dikarya (55%), a subkingdom of Fungi containing the Ascomycota and Basidiomycota phyla, and Phragmoplastophyta (29%), a subclade of Charophyta (Figure 4B). All the organisms in the Phragmoplastophyta subclade were land plants (Supplementary Table S5). Of the eukaryotes in the dust, at least 8% were marine organisms (algae, protists) (Supplementary Table S5).

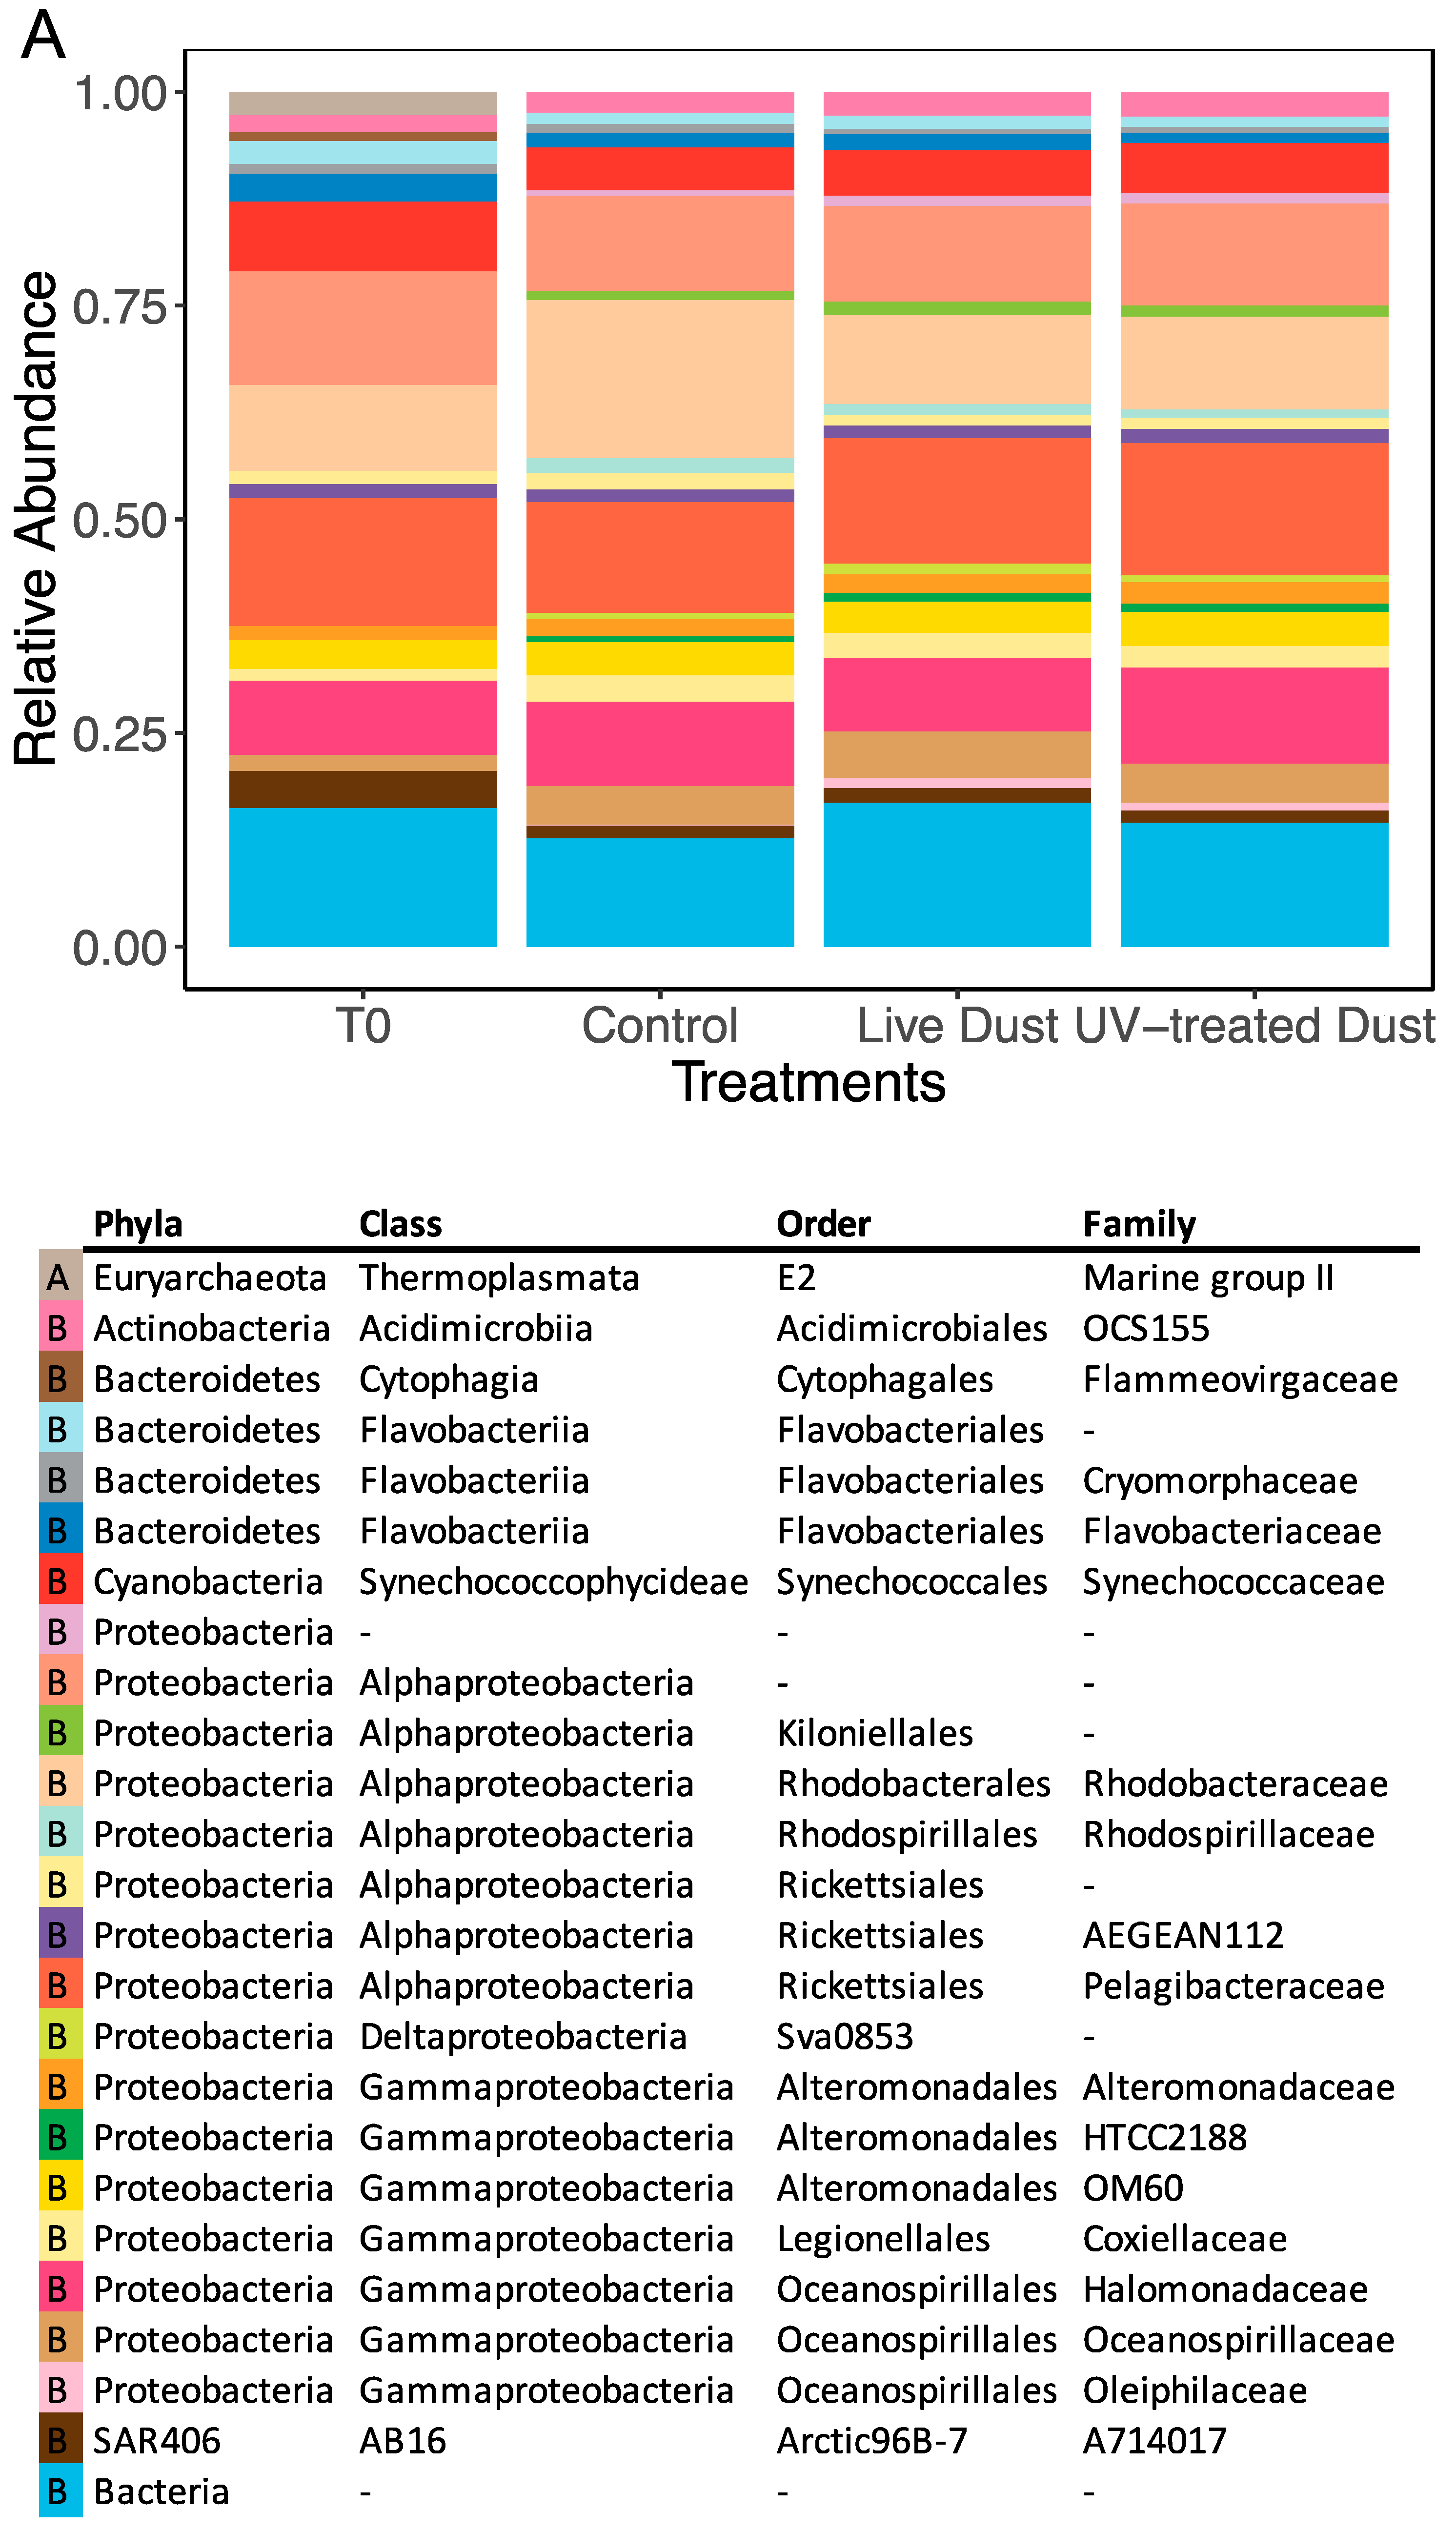
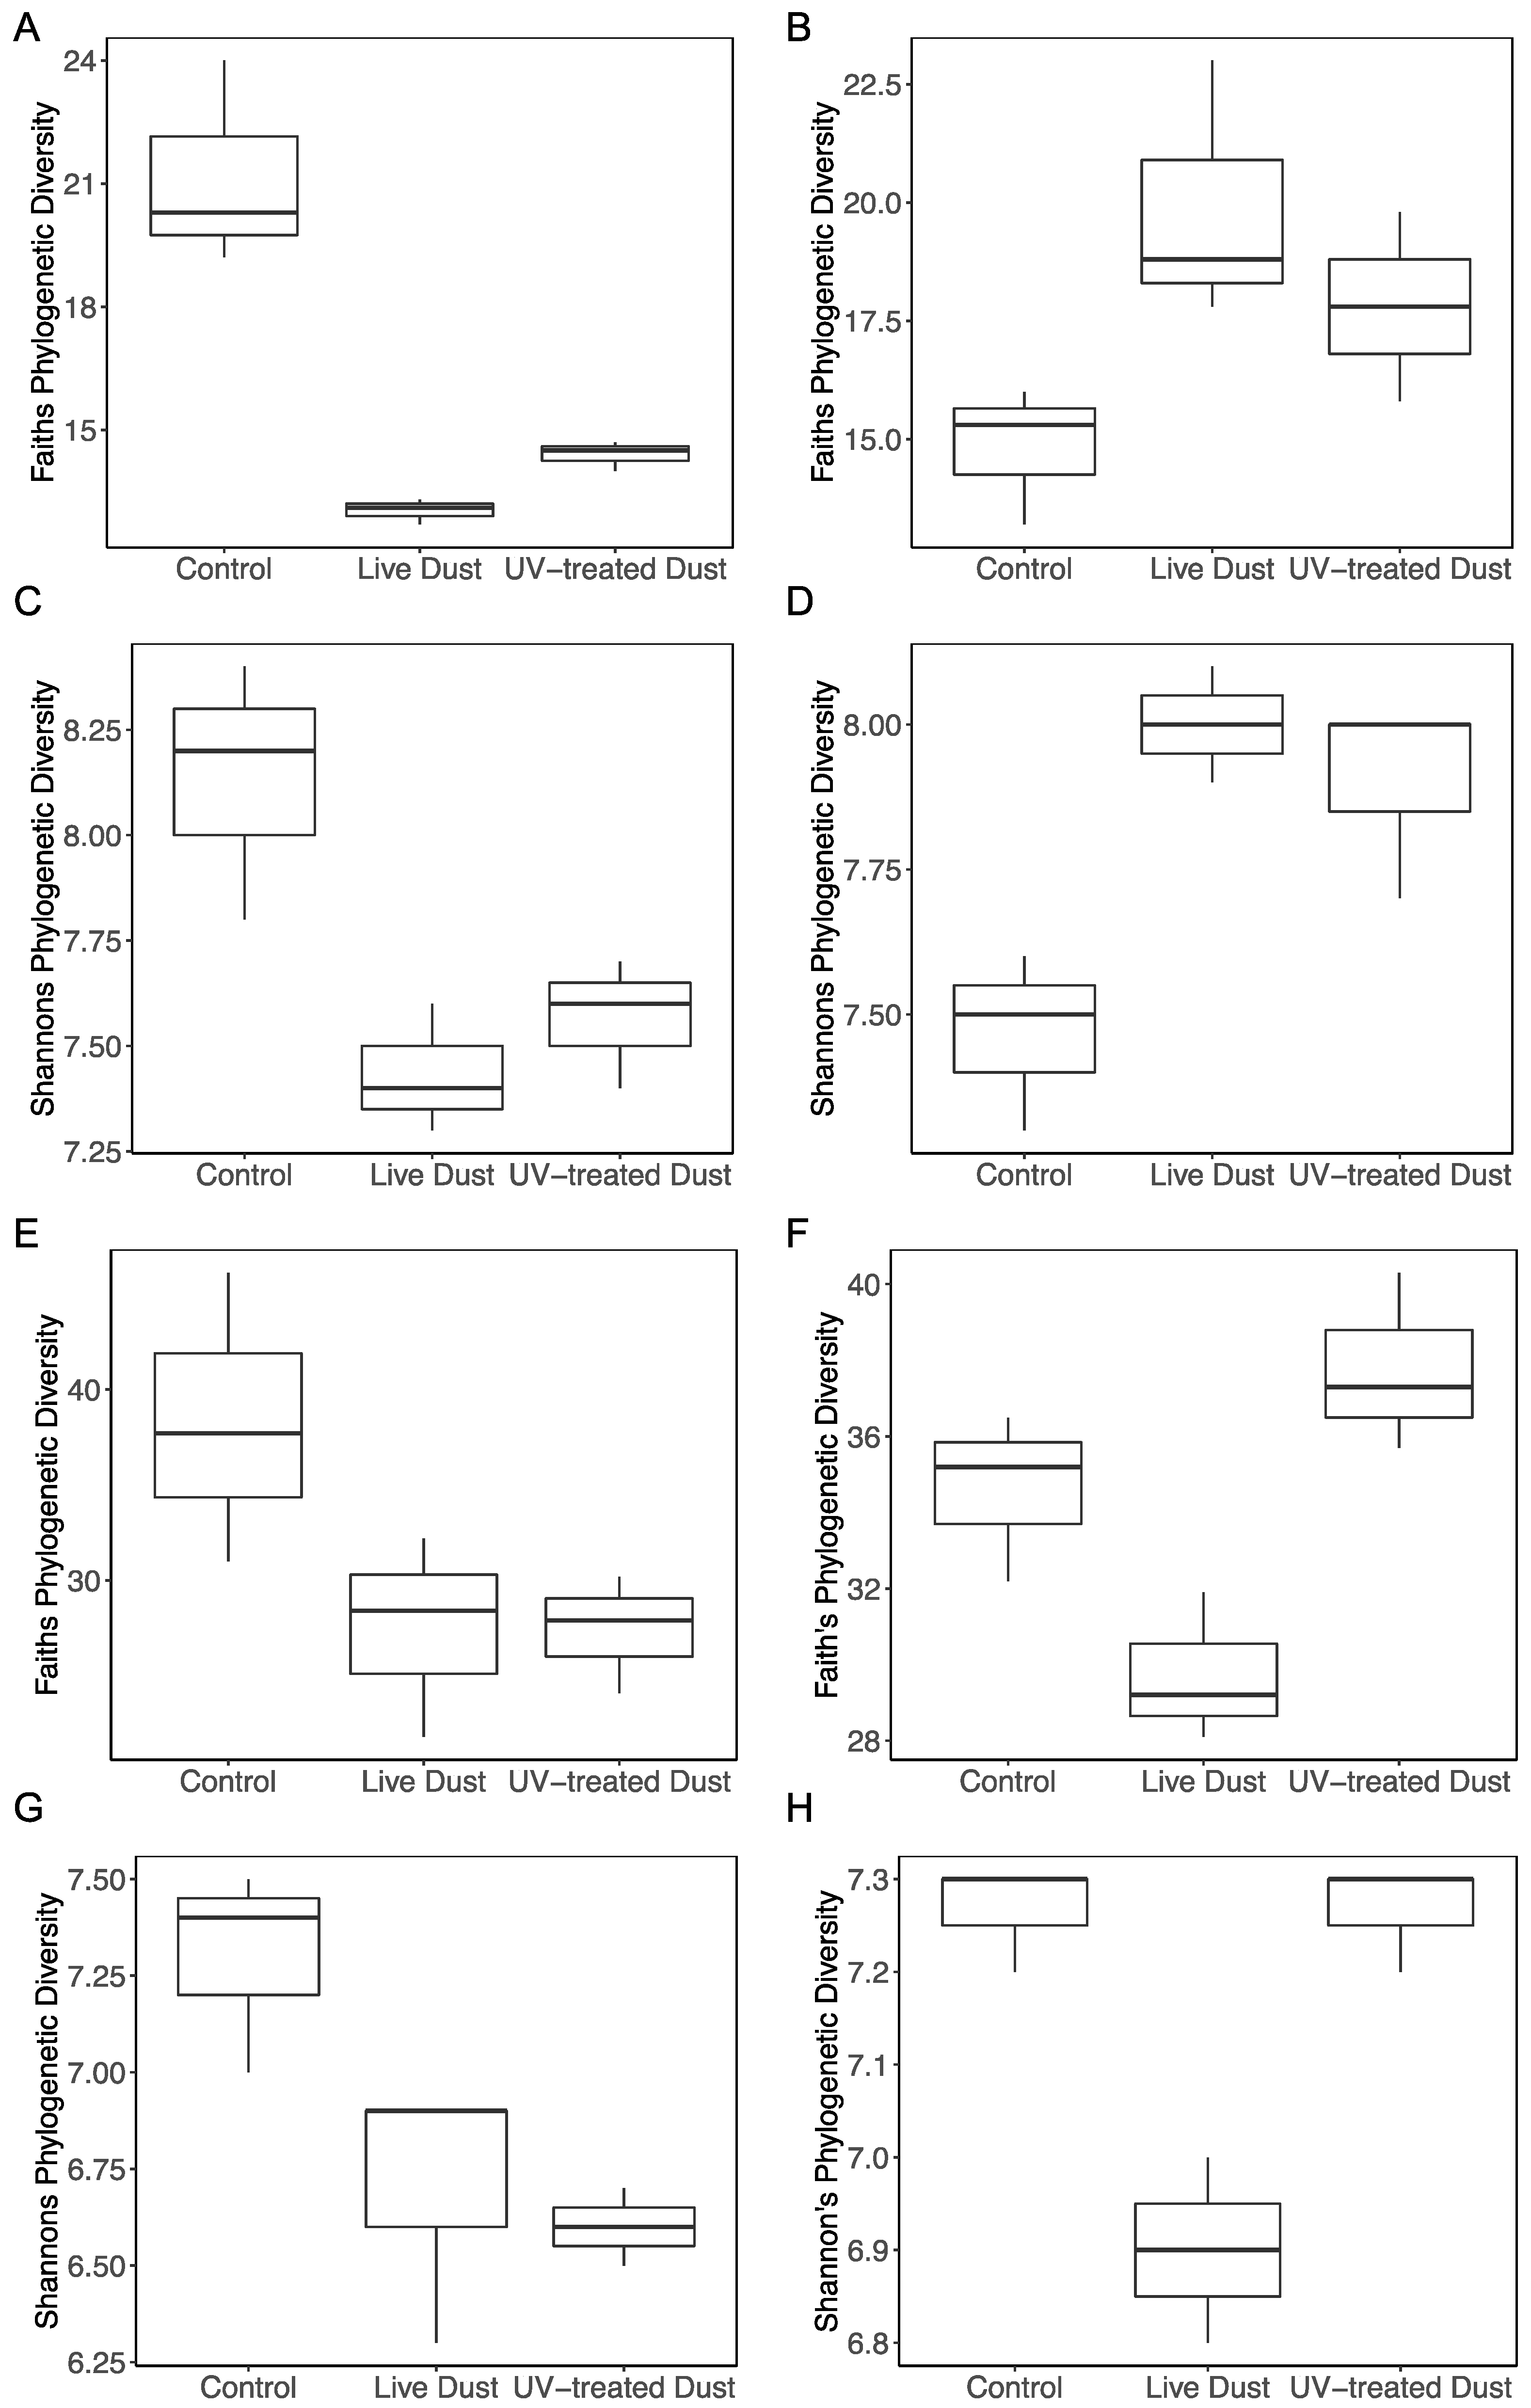
3.4. Changes in Prokaryotic and Eukaryotic Diversity following Dust Addition

The prokaryotic community in the NRS surface water was dominated by Proteobacteria constituting ~60% of taxa before the experiment, and ~70% to 75% during the experiment (Figure 5A). Alphaproteobacteria and Gammaproteobacteria were also abundant classes, making up 40–48% and 17–25% of the community, respectively (Figure 5A). Shannon’s diversity index (H) and Faith’s phylogenetic diversity (FPD) index were used to characterize the diversity of prokaryotes (Figure 6). At both timepoints (20 h, 44 h), the diversity (H and FPD) was significantly different between the control and the dust treatments (Figure 6, Supplementary Figure S1). At 20 h, the prokaryotic diversity (H and FPD) of the control (mean H = 8.1, mean FPD = 21.2) was significantly higher than in both the live dust (mean H = 7.4, mean FPD = 13.0) and the UV-treated dust (mean H = 7.6, mean FPD = 14.4) treatments (Kruskal–Wallis test: H = 3.857, df = 2, p < 0.05) (Figure 6, Supplementary Figure S1). The opposite trend was seen at 44 h after amendment, where the diversity (H and FPD) of both live dust (mean H = 8.0, mean FPD = 19.9) and UV-treated dust (mean H = 7.9, mean FPD = 17.7) treatments was higher than the that of the control (mean H = 7.5, mean FPD = 14.8) (Kruskal–Wallis test: H = 3.857, df = 2, p < 0.05) (Figure 6, Supplementary Figure S1). Similarly, beta diversity (Bray–Curtis) showed no differences between the live dust and UV-treated dust treatments at 20 h and 44 h after amendment.
The eukaryotic community of the NRS was dominated by Alveolata (Dinoflagellata and Protalveolata) before the experiment (33%) and by Stramenopiles (Marine Stramenopiles and Ochrophyta) (33%) during the experiment (Figure 5B). The diversity of eukaryotes was also measured using Shannon’s diversity (H) and Faith’s phylogenetic diversity (FPD) indices (Figure 6). The control (mean H = 7.3, mean FPD = 38.2) had higher diversity than that in the live dust (mean H = 6.7) and UV-treated dust (mean H = 6.6 and mean FPD = 27.3) treatments 20 h after amendment (Kruskal–Wallis test: H = 3.857, df = 2, p < 0.05), with no differences between the live dust and UV-treated dust (Figure 6, Supplementary Figure S1). At 44 h after amendment, the live dust treatments (mean H = 6.9, mean FPD = 29.7) had lower diversity than both the UV-treated dust (mean H = 7.3, mean FPD = 37.8) and the control (mean H = 7.3, mean FPD = 34.6) treatments (Figure 6). The beta diversity (Bray–Curtis) showed no differences between the live dust and UV-treated dust treatments at 20 h and 44 h after amendment.

4. Discussion

4.1. Impact of Airbone Microbes (or Dust Deposition) on Phytoplankton Biomass and Primary Production

The NRS receives high amounts of dust deposition every year, reaching dust loads of ~30 µg m−3 in normal non-storm conditions and ~700 µg m−3 during dust events [16,17,18]. Dust particles shelter and serve as a temporary habitat for microorganisms, protecting them from direct exposure to UV radiation [42,43]. Microorganisms survive long-range transport, and it has been reported that up to 25% of airborne microorganisms remain viable upon deposition [11,44] and subsequently thrive in novel marine ecosystems and impact native microbial populations and processes [13,14]. Low-nutrient, low-chlorophyll (LNLC) marine environments are strongly impacted by dust addition during high deposition events, because atmosphere is a crucial source of limiting nutrients and trace metals [19]. However, the potential effects of airborne microorganisms delivered by atmospheric deposition in these areas has been often overlooked. Specifically, several studies in LNLC systems have shown an increase in primary production rates following aerosol addition and have solely attributed this outcome to the delivery of limiting nutrients (P, N, Fe) for photosynthesis [6,13,45,46,47,48,49,50,51,52,53]. Picophytoplankton, including cyanobacteria (Prochlorococcus and Synechococcus) and picoeukaryotes, account for a large portion of algal biomass and primary productivity in LNLC systems [41,54,55,56,57]. Two factors that drive picophytoplankton abundance in LNLC regions are (1) nutrient availability [58,59], and (2) population decline through viral infections and lysis [60]. Previous studies have shown that atmospheric deposition affects picophytoplankton variably, both increasing abundance due to a supply of nutrients [45,46,47] and decreasing abundance due to a supply of toxic metals [20]. Comparing the effect of live dust potentially carrying live microorganisms and viruses (Figure 4) and UV-treated dust where microorganisms (and other biotic entities as viruses) were inactivated, we provide evidence that airborne microorganisms also have an impact on surface ecosystem.
Both live dust and UV-treated dust amendments led to an initial (0 to 44 h) increase of phytoplankton biomass as indicated by Chl-a (Figure 2A), mostly explained by the increase in picoeukaryotes (Figure 2D). This response likely resulted from the released nutrients from the dust particles that boosted cell growth (Supplementary Table S2). In contrast, cyanobacteria declined or showed small variations as compared with the control samples (Figure 2B,C). We note however that Chl-a and PP at 44 h were lower in the live dust samples, suggesting that living constituents present in the live dust negatively impacted phytoplankton growth and primary productivity rates (Figure 2A and Figure 3A).
This effect could have resulted from the (1) introduction of competitors for the same food resources, for example heterotrophic bacteria [61,62] and/or (2) introduction of predatory and/or pathogenic entities, for example viruses [12,63]. Indeed, the dust used in the experiment contained bacteria as well as other marine organisms (Figure 4, Supplementary Table S5), which could compete with ambient phytoplankton for resources and may have served as vectors for viruses.
Viruses are abundant in desert soils, reaching concentrations of 2.2 × 10³ to 1.1 × 10⁷ virus-like particles per gram [64]. Upon aerosolization, viruses travel long distances via dust storms. The number of airborne viruses has been reported to increase by an order of magnitude during dust storms as compared with normal atmospheric conditions [65]. Dust storms also pick up marine viruses, which become aerosolized through wind-induced bubble bursting on ocean surface [12,63,66] while traveling over oceans. Some airborne viruses have been shown to infect phytoplankton in numbers large enough to terminate entire blooms [12]. Furthermore, there are viruses known to infect cyanobacteria that are very host-specific [67], potentially explaining why the three autotrophic populations which were measured here (picoeukaryotes, Prochlorococcus and Synechococcus) responded differently during the experiment.

4.2. Impact of Airborne Microbes (or Dust Deposition) on Heterotrophic Prokaryotes Production

Atmospheric dust deposition has also been shown to increase heterotrophic prokaryotes production rates in LNLC systems [5,14,46,48,68]. While these previous studies suggested that the input of nutrients from aerosols has increased in-situ surface water BP (i.e., that of resident heterotrophic bacteria in the marine surface layer), the differences in BP between the live dust and UV-treated dust treatments show that viable airborne microbes also rapidly contribute to increasing marine BP rates (by 50%, Figure 3B). Similar results, showing contributions of airborne microbes to BP, as well as to N2 fixation, have been previously reported for southeastern Mediterranean waters [13,14]. The BP rates were previously tested in microcosm bioassay experiments where aerosols collected during a dust storm were added to sterile southeastern Mediterranean water and showed that BP increased by fourfold [13], corresponding to 20–50% of the typical BP rates measured in the open and coastal southeastern Mediterranean, respectively [5,69]. Our study furthers their findings by showing that BP rates increase with the addition of airborne microbes in non-sterile water with resident microbial community from the Gulf of Aqaba in the NRS.
Our conclusion is also supported by the enzyme activity data (Figure 3C–E). Extracellular enzymes are synthesized by microorganisms to hydrolyze polymeric substances into bioavailable monomers [70]. Measuring rates of extracellular enzyme activity therefore provide insight into productivity of marine microbes. We show that AMA and β-Gl activities increased significantly with dust addition, while APA rates decreased significantly (Figure 3A–E). Synthesis of extracellular enzymes are dependent on nutrient availability (APA dependent on P, AMA and β-Gl dependent on organic carbon) and their activity rates change with the input of nutrients via atmospheric deposition [71,72]. The β-Gl activity is attributed mostly to heterotrophic bacteria [30,73], while AMA activity is attributed to heterotrophic bacteria as well as cyanobacteria, phytoplankton, and zooplankton [30,73,74,75] and its activities have been shown to increase after aerosol addition in a microcosm study in the Mediterranean Sea [72]. Specifically, β-Gl is utilized in hydrolysis of cellobiose found in polymers, such as cellulose and mucopolysaccharides, and can be related to Chl-a [76,77], whereas AMA is utilized in the decay of particulate matter composed of biotic and abiotic material [74,75]. APA, synthesized by phytoplankton [73], has also been shown to vary in response to dust additions to the Mediterranean [71,72] and northern Red Sea [78] seawater during incubation experiments. Changes in enzymatic activity were observed in both the UV-treated dust and live dust treatments as compared with the control, showing that chemical components of atmospheric deposition are enhanced in-situ microbial activities, as previously suggested. However, we also measured differences in β-Gl activity rates between the UV-treated dust and live dust treatments, indicating that viable airborne microorganisms specifically contribute to increasing β-Gl activity rates (20–25%, Figure 3C). A significant difference between UV-treated dust and live dust treatments was not observed in the AMA activity rates (Figure 3D), which is also synthesized by heterotrophic bacteria. These results suggest that deposited airborne microbes preferentially synthesized β-Gl for hydrolysis of carbohydrates, and since the chemical constituents were the same in both treatments, the preferential use of this enzyme in the live dust treatment likely corresponds to synthesis by the microbial assemblage of the dust (Figure 4A).
Interestingly, although we saw differences in the BP between treatments, the heterotrophic bacteria abundance significantly increased with the addition of dust in both treatments relative to the control but was not different between the live dust and UV-treated dust treatments (Figure 2B). This difference in cell specific activity (bacterial production per bacterial abundance) was previously observed in a mesocosm study in the southeastern MS [13]. We attribute this increase solely to the chemical constituents of aerosols, which provide nutrients and organic C to increase heterotrophic bacteria abundance, in both treatments regardless of their origin [5,14,46,48,68]. Alternatively, there may be a higher removal of heterotrophic bacteria in the live dust treatments by grazing or viral lysis, preventing an increase in abundance.

4.3. Microbial Population in the Dust and their Impact on Biodiversity

Most of the bacteria found in the dust (>1%) were not found in the seawater from the mesocosm experiments (>1%) at the family level, aside from organisms belonging to the family Rhodobacteraceae (Figure 4A and Figure 5A). However, there was a large number of eukaryotes (Alveolates and Stramenopiles) present in the dust, as well as in all the seawater samples (Figure 4B and Figure 5B). These organisms made up 8% of the dust (Figure 4B, Supplementary Table S5), and up to 52% of the seawater samples. These marine organisms likely become aerosolized from ocean surfaces through bubble bursting and sea spray [12,63,66].
We found similar taxonomic relative abundances in all treatments at 44 h after amendment (Figure 5), however this visual representation is not sensitive enough to detect differences in diversity. Therefore, to quantitatively assess community differences we calculated diversity of both prokaryotes and eukaryotes of treatments (live dust, UV-treated dust, and control) (Figure 6, Supplementary Figure S1) using alpha diversity metrics. Alpha diversity metrics are used quantitatively (Shannon’s diversity index), qualitatively (Faith’s phylogenetic diversity), and phylogenetically (Faith’s phylogenetic diversity) to show how many unique taxa are present in a sample. Our experiment showed that eukaryote diversity (both measures) was different between live dust and UV-treated dust treatments at 44 h, with significantly lower diversity when airborne microbes were present (Figure 6). The lower diversity in the live dust treatments indicate that the number of unique eukaryotes in the NRS surface water decreased with the addition of airborne microbes. The difference in diversity may be a result of competitive relationships between airborne microbes and eukaryotes in the NRS surface water. Alternatively, airborne viruses or fungi in our sample may have specifically infected certain marine eukaryote groups. However, the diversity of prokaryotes did not change between treatments, indicating that there was no antagonistic relationship between the bioaerosols and bacterial communities of the NRS. These processes need to be further studied.

5. Conclusions

Our results show that microbial diversity is altered by bioaerosols and that while the rates of primary productivity decline, the rates of bacterial production increase in response to the deposition of bioaerosols. Since our experiment lasted 72 h, with most changes occurring in the first 48 h, the observed effects of bioaerosols might be transient. Although our study was conducted in mesocosms and lasted only ~72 h, surface water with local microbial assemblages was used and the amount of aerosol added was representative of conditions during dust storm events. The results are consistent with previous reports indicating that atmospheric deposition is a crucial source of nutrients and trace metals in LNLC systems [2,3,79,80]. However, we also clearly show unique effects of airborne microorganisms impacting biogeochemical processes indicating that the impact of bioaerosols is also relevant, particularly in LNLC regions where dust storm events occur. Importantly, since dust deposition is predicted to increase with climate change, the impact of airborne microorganisms found in our study may also increase. Additional studies that improve our understanding of how these geographically vast areas of ocean will be impacted by bioaerosols will be of great value.

Supplementary Materials

The following are available online at https://www.mdpi.com/2073-4433/10/7/358/s1: Figure S1. Alpha diversity (Faith’s phylogenetic or Shannon’s diversity indices) for control, “live dust”, “UV-treated dust” treatments; (A) Shannon’s diversity index (DI) for prokaryotes at 20 h; (B) Faith’s phylogenetic diversity (PD) for prokaryotes at 20 h; (C) Shannon’s DI for prokaryotes at 44 h; (D) Faith’s PD for prokaryotes at 44 h; (E) Shannon’s DI for eukaryotes at 20 h; (F) Faith’s PD for eukaryotes at 20 h.; Table S1. Chemical and biological properties of the NRS water used in the experiment (before amendments); Table S2. Nutrients and trace metals concentrations added from the aerosols to each mesocosm; Table S3. ANOVA test results between control, “UV-treated” and “live-dust’ treatments at 20 h or 44 h; Table S4. Tukey post-hoc test results between “UV-treated” and control, “live-dust” and control and “live-dust” and “UV-treated’ treatments at 20 h or 44 h; Table S5. Eukaryotes, relative abundances (abundance), and general information on taxa (details).

Author Contributions

Project administration and design A.P.; Writing—original draft, E.M.; Writing—review and editing, E.M., A.P., E.R., M.J.F., S.R., O.R., Y.G., C.S., and B.H.

Acknowledgments

This study was supported by the Israel Science Foundation (grant 1211/17) to B. H and E. R and by the NSF-OCE (grant 0850467) and the NSF-OISE (grant 1358134) to A. P. E.M was supported by the NSF GRFP. Y. G. was supported by the Banca del Monte di Lombardia Foundation. We would like to thank Wan-Chen Tu for her contribution on the trace metal analysis. The authors thank the personnel in the InterUniversity Institute for Marine Sciences in Eilat (IUI).

Conflicts of Interest

The authors declare no conflict of interest.

References

  1. Herut, B.; Collier, R.; Krom, M.D. The role of dust in supplying nitrogen and phosphorus to the southeast Mediterranean. Limnol. Oceanogr. 2002, 47, 870–878. [Google Scholar] [CrossRef]
  2. Jickells, T.D.; An, Z.S.; Anderson, K.K.; Baker, A.R.; Bergametti, G.; Brooks, N.; Cao, J.J.; Boyd, P.W.; Duce, R.A.; Hunter, K.A.; et al. Global iron connections between desert dust, ocean biogeochemistry, and climate. Science 2005, 308, 67–71. [Google Scholar] [CrossRef]
  3. Duce, R.A.; LaRoche, J.; Altieri, K.; Arrigo, K.R.; Baker, A.R.; Capone, D.G.; Cornell, S.; Dentener, F.; Galloway, J.; Ganeshram, R.S.; et al. Impacts of atmospheric anthropogenic nitrogen on the open ocean. Science 2008, 320, 893–897. [Google Scholar] [CrossRef]
  4. Duce, R.A.; Liss, P.S.; Merrill, J.T.; Elliot, A.L.; Buat-Menard, P.; Hicks, B.B.; Miller, J.M.; Prospero, J.M.; Arimoto, R.; Church, T.M.; et al. The atmospheric input of trace species to the world ocean. Glob. Biogeochem. Cycles 1991, 5, 193–259. [Google Scholar] [CrossRef]
  5. Pulido-Villena, E.; Wagener, T.; Guieu, C. Bacterial response to dust pulses in the western Mediterranean: Implications for carbon cycling in the oligotrophic ocean. Glob. Biogeochem. Cycles 2008, 22, GB1020. [Google Scholar] [CrossRef]
  6. Herut, B.; Rahav, E.; Tsagaraki, T.M.; Giannakourou, A.; Tsiola, A.; Psarra, S.; Lagaria, A.; Papageorgiou, N.; Mihalopoulos, N.; Theodosi, C.N.; et al. The potential impact of Saharan dust and polluted aerosols on microbial populations in the east Mediterranean Sea, an overview of a mesocosm experimental approach. Front. Mar. Sci. 2016, 3, 226. [Google Scholar] [CrossRef]
  7. Rahav, E.; Paytan, A.; Mescioglu, E.; Galletti, Y.; Rosenfeld, S.; Raveh, O.; Santinelli, C.; Ho, T.; Herut, B. Airborne microbes contribute to N2 fixation in surface water of the Northern Red Sea. Geophys. Res. Lett. 2018, 2–10. [Google Scholar] [CrossRef]
  8. Kellogg, C.A.; Griffin, D.W. Aerobiology and the global transport of desert dust. Trends Ecol. Evol. 2006, 21, 638–644. [Google Scholar] [CrossRef]
  9. Griffin, D.W.; Kubilay, N.; Kocak, M.; Gray, M.A.; Borden, T.C.; Shinn, E.A. Airborne desert dust and aeromicrobiology over the Turkish Mediterranean coastline. Atmos. Environ. 2007, 41. [Google Scholar] [CrossRef]
  10. Mayol, E.; Arrieta, J.M.; Jiménez, M.A.; Martínez-Asensio, A.; Garcias-Bonet, N.; Dachs, J.; González-Gaya, B.; Royer, S.J.; Benítez-Barrios, V.M.; Fraile-Nuez, E.; et al. Long-range transport of airborne microbes over the global tropical and subtropical ocean. Nat. Commun. 2017, 8, 1–8. [Google Scholar] [CrossRef]
  11. Womack, A.M.; Bohannan, B.J.M.; Green, J.L. Biodiversity and biogeography of the atmosphere. Philos. Trans. R. Soc. Lond. B Biol. Sci. 2010, 365, 3645–3653. [Google Scholar] [CrossRef] [Green Version]
  12. Sharoni, S.; Trainic, M.; Schatz, D.; Lehahn, Y.; Flores, M.J.; Bidle, K.D.; Ben-Dor, S.; Rudich, Y.; Koren, I.; Vardi, A. Infection of phytoplankton by aerosolized marine viruses. Proc. Natl. Acad. Sci. USA 2015, 112, 6643–6647. [Google Scholar] [CrossRef] [Green Version]
  13. Rahav, E.; Ovadia, G.; Paytan, A.; Herut, B. Contribution of airborne microbes to bacterial production and N2 fixation in seawater upon aerosol deposition. Geophys. Res. Lett. 2016, 43, 719–727. [Google Scholar] [CrossRef]
  14. Rahav, E.; Paytan, A.; Chien, C.-T.; Ovadia, G.; Katz, T.; Herut, B. The impact of atmospheric dry deposition associated microbes on the southeastern Mediterranean Sea surface water following an intense dust storm. Front. Mar. Sci. 2016, 3. [Google Scholar] [CrossRef]
  15. Antoine, D.; André, J.M.; Morel, A. Oceanic primary production: 2. Estimation at global scale from satellite. coastal zone color scanner) chlorophyll. Glob. Biogeochem. Cycles 1996, 10, 57–69. [Google Scholar] [CrossRef]
  16. Lawrence, C.R.; Neff, J.C. The contemporary physical and chemical flux of aeolian dust: A synthesis of direct measurements of dust deposition. Chem. Geol. 2009, 267, 46–63. [Google Scholar] [CrossRef]
  17. Torfstein, A.; Teutsch, N.; Tirosh, O.; Shaked, Y.; Rivlin, T.; Zipori, A.; Stein, M.; Lazar, B.; Erel, Y. Chemical characterization of atmospheric dust from a weekly time series in the north Red Sea between 2006 and 2010. Geochim. Cosmochim. Acta 2017, 211, 373–393. [Google Scholar] [CrossRef]
  18. Chen, Y.; Mills, S.; Street, J.; Golan, D.; Post, A.; Jacobson, M.; Paytan, A. Estimates of atmospheric dry deposition and associated input of nutrients to Gulf of Aqaba. J. Geophys. Res. 2007, 112, 04309. [Google Scholar] [CrossRef]
  19. Guieu, C.; Aumont, O.; Paytan, A.; Bopp, L.; Law, C.S.; Mahowald, N.; Achterberg, E.P.; Marañón, E.; Salihoglu, B.; Crise, A.; et al. Global biogeochemical cycles deposition to Low Nutrient Low Chlorophyll regions. Glob. Biogeochem. Cycles 2014, 28, 1179–1198. [Google Scholar] [CrossRef]
  20. Paytan, A.; Mackey, K.R.M.; Chen, Y.; Lima, I.D.; Doney, S.C.; Mahowald, N.; Labiosa, R.; Post, A.F. Toxicity of atmospheric aerosols on marine phytoplankton. Proc. Natl. Acad. Sci. USA 2009, 106, 4601–4605. [Google Scholar] [CrossRef] [Green Version]
  21. Katra, I.; Arotsker, L.; Krasnov, H.; Zaritsky, A.; Kushmaro, A.; Ben-Dov, E. Richness and diversity in dust stormborne biomes at the southeast Mediterranean. Sci. Rep. 2014, 4, 5265. [Google Scholar] [CrossRef]
  22. Gat, D.; Mazar, Y.; Cytryn, E.; Rudich, Y. Origin-dependent variations in the atmospheric microbiome community in Eastern Mediterranean dust storms. Environ. Sci. Technol. 2017, 51, 6709–6718. [Google Scholar] [CrossRef]
  23. Foster, R.A.; Paytan, A.; Zehr, J.P. Seasonality of N2 fixation and nifH gene diversity in the Gulf of Aqaba. Red Sea. Limnol. Oceanogr. 2009, 54, 219–233. [Google Scholar] [CrossRef]
  24. Chen, Y.; Paytan, A.; Chase, Z.; Measures, C.; Beck, A.J.; Sañudo-Wilhelmy, S.A.; Post, A.F. Sources and fluxes of atmospheric trace elements to the Gulf of Aqaba, Red Sea. J. Geophys. Res. 2008, 113, 1–13. [Google Scholar] [CrossRef]
  25. Jish Prakash, P.; Stenchikov, G.; Kalenderski, S.; Osipov, S.; Bangalath, H. The impact of dust storms on the Arabian Peninsula and the Red Sea. Atmos. Chem. Phys. 2015, 15, 199–222. [Google Scholar] [CrossRef] [Green Version]
  26. Simon, M.; Alldredge, A.; Azam, F. Bacterial carbon dynamics on marine snow. Mar. Ecol. Prog. 1990, 65, 205–211. [Google Scholar] [CrossRef]
  27. Simon, M.; Alldredge, A.; Azam, F. Protein-content and protein-synthesis rates of planktonic marine-bacteria. Mar. Ecol. Prog. 1989, 51, 201–213. [Google Scholar] [CrossRef]
  28. Steemann-Nielsen, E. On the determination of the activity for measuring primary production. J. Cons. Int. Explor. Mer. 1952, 18, 117–140. [Google Scholar]
  29. Welschmeyer, N.A. Fluorometric analysis of chlorophyll a in the presence of chlorophyll b and pheopigments. Limnol. Oceanogr. 1994, 39, 1985–1992. [Google Scholar] [CrossRef]
  30. Hoppe, H.G. Significance of exoenzymatic activities in the ecology of brackish water: Measurements by means of methyl umbelliferyl substrates. Mar. Ecol. Prog. Ser. 1983, 11, 299–308. [Google Scholar] [CrossRef]
  31. Thingstad, T.F.; Mantoura, R. Titrating excess nitrogen content of phosphorous-deficient eastern Mediterranean surface water using alkaline phosphatase activity as a bio-indicator. Limnol. Oceanogr. Methods 2005, 3, 94–100. [Google Scholar] [CrossRef]
  32. Massana, R.; Murray, A.E.; Preston, C.M.; Delong, E. Vertical distribution and phylogenetic characterization of marine planktonic Archaea in the Santa Barbara Channel. Appl. Environ. Microbiol. 1997, 63, 50–56. [Google Scholar] [Green Version]
  33. Bolyen, E.; Rideout, J.R.; Dillon, M.R.; Bokulich, N.A.; Abnet, C.; Al-Ghalith, G.A.; Alexander, H.; Alm, E.J.; Arumugam, M.; Asnicar, F. QIIME 2: Reproducible, interactive, scalable, and extensible microbiome data science. Peer J. Prepr. 2018. [Google Scholar] [CrossRef]
  34. Callahan, B.J.; McMurdie, P.J.; Rosen, M.J.; Han, A.W.; Johnson, A.J.; Holmes, S.P. DADA2: High-resolution sample inference from Illumina amplicon data. Nat. Methods 2016, 13, 581–583. [Google Scholar] [CrossRef] [Green Version]
  35. Pedregosa, F.; Varoquaux, G.; Gramfort, A.; Michel, V.; Thirion, B.; Grisel, O.; Blondel, M.; Prettenhofer, P.; Weiss, R.; Dubourg, V.; et al. Scikit-learn: Machine Learning in Python. J. Mach. Learn. Res. 2011, 12, 2825–2830. [Google Scholar]
  36. DeSantis, T.Z.; Hugenholtz, P.; Larsen, N.; Rojas, M.; Brodie, E.L.; Keller, K.; Huber, T.; Dalevi, D.; Hu, P.; Andersen, G.L. Greengenes, a chimera-checked 16S rRNA gene database and workbench compatible with ARB. Appl. Environ. Microbiol. 2006, 72, 5069–5072. [Google Scholar] [CrossRef]
  37. Quast, C.; Pruesse, E.; Yilmaz, P.; Gerken, J.; Schweer, T.; Yarza, P.; Peplies, J.; Glöckner, F.O. The SILVA ribosomal RNA gene database project: Improved data processing and web-based tools. Nucleic Acids Res. 2013, 41, D590–D596. [Google Scholar] [CrossRef]
  38. Bokulich, N.A.; Kaehler, B.D.; Rideout, J.R.; Dillon, M.; Bolyen, E.; Knight, R.; Huttley, G.A.; Caporaso, G.J. Optimizing taxonomic classification of marker-gene amplicon sequences with QIIME 2’s q2-feature-classifier plugin. Microbiome 2018, 6, 90. [Google Scholar] [CrossRef]
  39. Chase, Z.; Paytan, A.; Johnson, K.S.; Street, J.; Chen, Y. Input and cycling of iron in the Gulf of Aqaba, Red Sea. Glob. Biogeochem. Cycles 2016, 20, GB3017. [Google Scholar] [CrossRef]
  40. Chase, Z.; Paytan, A.; Beck, A.; Biller, D.; Bruland, K.; Measures, C.; Sañudo-Wilhelmy, S. Evaluating the impact of atmospheric deposition on dissolved trace-metals in the Gulf of Aqaba, Red Sea. Mar. Chem. 2011, 126, 256–268. [Google Scholar] [CrossRef]
  41. Lindell, D.; Post, A.F. Ultraphytoplankton succession is triggered by deep winter mixing in the Gulf of Aqaba (Eilat), Red Sea. Limnol. Oceanogr. 1995, 40, 1130–1141. [Google Scholar] [CrossRef]
  42. Lighthart, B.; Shaffer, B.T. Survey of culturable airborne bacteria at four diverse locations in Oregon: Urban, rural, forest, and coastal. Microb. Ecol. 1997, 34, 167–177. [Google Scholar]
  43. Pearce, D.A.; Bridge, P.D.; Hughes, K.A.; Sattler, B.; Psenner, R.; Russell, N.J. Microorganisms in the atmosphere over Antarctica. FEMS Microbiol. Ecol. 2009, 69, 143–157. [Google Scholar] [CrossRef] [Green Version]
  44. Polymenakou, P.N. Atmosphere: A source of pathogenic or beneficial microbes? Atmosphere 2012, 3, 87–102. [Google Scholar] [CrossRef]
  45. Mills, M.M.; Ridame, C.; Davey, M.; La Roche, J.; Geider, R.J. Iron and phosphorus co-limit nitrogen fixation in the eastern tropical North Atlantic. Nature 2004, 429, 292–294. [Google Scholar] [CrossRef]
  46. Herut, B.; Zohary, T.; Krom, M.D.; Mantoura, R.F.C.; Pitta, P.; Psarra, S.; Rassoulzadegan, F.; Tanaka, T.; Frede Thingstad, T. Response of East Mediterranean surface water to Saharan dust: On-board microcosm experiment and field observations, Deep. Res. Part II Top. Stud. Oceanogr. 2005, 52, 3024–3040. [Google Scholar] [CrossRef]
  47. Bonnet, S.; Guieu, C.; Chiaverini, J.; Ras, J.; Stock, A. Effect of atmospheric nutrients on the autotrophic communities in a low nutrient, low chlorophyll system. Limnol. Oceanogr. 2005, 50, 1810–1819. [Google Scholar] [CrossRef] [Green Version]
  48. Marañén, E.; Fernández, A.; Mouriño-Carballido, B.; MartÍnez-GarcÍa, S.; Teira, E.; Cermeño, P.; Chouciño, P.; Huete-Ortega, M.; Fernández, E.; Calvo-Díaz, A.; et al. Degree of oligotrophy controls the response of microbial plankton to Saharan dust. Limnol. Oceanogr. 2010, 55, 2339–2352. [Google Scholar] [CrossRef]
  49. Ternon, E.; Guieu, C.; Ridame, C.; L’Helguen, S.; Catala, P. Longitudinal variability of the biogeochemical role of Mediterranean aerosols in the Mediterranean Sea. Biogeosciences 2011, 8, 1067–1080. [Google Scholar] [CrossRef] [Green Version]
  50. Ridame, C.; Guieu, C.; L’Helguen, S. Strong stimulation of N2 fixation to contrasted Saharan dust events in a Low Nutrient-Low Chlorophyll environment: Results from dust addition in large mesocosms. Biogeosciences 2013, 10, 7333–7346. [Google Scholar] [CrossRef]
  51. Blain, S.; Guieu, C.; Claustre, H.; Leblanc, K.; Moutin, T.; Quéguiner, B.; Sarthou, G. Availability of iron for phytoplankton in the north-east Atlantic Ocean. Limnol. Oceanogr. 2004, 49, 2095–2104. [Google Scholar] [CrossRef]
  52. Mackey, K.R.M.; Roberts, K.; Lomas, M.W.; Saito, M.A.; Post, A.F.; Paytan, A. Enhanced Solubility and Ecological Impact of Atmospheric Phosphorus Deposition upon Extended Seawater Exposure. Environ. Sci. Technol. 2012, 46, 10438–10446. [Google Scholar] [CrossRef]
  53. Chien, C.-T.; Mackey, K.R.M.; Dutkiewicz, S.; Mahowald, N.M.; Prospero, J.M.; Paytan, A. Effects of African dust deposition on phytoplankton in the western tropical Atlantic Ocean off Barbados. Glob. Biogeochem. Cycles 2016, 30, 716–734. [Google Scholar] [CrossRef] [Green Version]
  54. Partensky, F.; Blanchot, J.; Vaulot, D. Differential distribution and ecology of Prochlorococcus and Synechococcus in oceanic waters: A review. Bull. Inst. Oceanogr. Monaco Numero Spec. 1999, 19, 431–449. [Google Scholar]
  55. Jardillier, L.; Zubkov, M.V.; Pearman, J.; Scanlan, D.J. Significant CO2 fixation by small prymnesiophytes in the subtropical and tropical northeast Atlantic Ocean. ISME J. 2010, 4, 1180–1192. [Google Scholar] [CrossRef]
  56. Flombaum, P.; Gallegos, J.L.; Gordillo, R.A.; Rincón, J.; Zabala, L.L.; Jiao, N.; Karl, D.M.; Li, W.K.W.; Lomas, M.W.; Veneziano, D.; et al. Present and future global distributions of the marine cyanobacteria Prochlorococcus and Synechococcus. Proc. Natl. Acad. Sci. USA 2013, 1–6. [Google Scholar] [CrossRef]
  57. Pearman, J.; Ellis, J.; Irigoien, X.; Sarma, Y.V.B.; Jones, B.H.; Carvalho, S. Microbial planktonic communities in the Red Sea: High levels of spatial and temporal variability shaped by nutrient availability and turbulence. Sci. Rep. 2017, 7. [Google Scholar] [CrossRef]
  58. DuRand, M.D.; Olson, R.J.; Chisholm, S.W. Phytoplankton population dynamics at the Bermuda Atlantic Time-series station in the Sargasso Sea. Deep Sea Res. 2001, 48, 8–9. [Google Scholar] [CrossRef]
  59. Grossowicz, M.; Roth-Rosenberg, D.; Aharonovich, D.; Silverman, J.; Follows, M.J.; Sher, D. Prochlorococcus in the lab and in silico: The importance of representing exudation. Limnol. Oceanogr. 2017, 62, 818–835. [Google Scholar] [CrossRef]
  60. Chénard, C.; Suttle, C.A. Phylogenetic diversity of sequences of cyanophage photosynthetic gene psbA in marine and freshwaters. Appl. Environ. Microbiol. 2008, 74, 5317–5324. [Google Scholar] [CrossRef]
  61. Cotner, J.; Biddanda, B. Small Players, Large Role: Microbial Influence on Biogeochemical Processes in Pelagic Aquatic Ecosystems. Ecosystems 2002, 5, 105. [Google Scholar] [CrossRef]
  62. Joint, I.; Henriksen, P.; Fonnes, G.A.; Bourne, D.; Thingstad, T.F.; Riemann, B. Competition for inorganic nutrients between phytoplankton and bacterioplankton in nutrient manipulated mesocosms. Aquat. Microb. Ecol. 2002, 29, 145–159. [Google Scholar] [CrossRef]
  63. Reche, I.; D’Orta, G.; Mladenov, N.; Winget, D.M.; Suttle, C.A. Deposition rates of viruses and bacteria above the atmospheric boundary layer. ISME J. 2018, 12, 1154–1162. [Google Scholar] [CrossRef] [Green Version]
  64. Gonzalez-Martin, C.; Teigell-Perez, N.; Lyles, M.; Valladares, B.; Griffin, D.W. Epifluorescent direct counts of bacteria and viruses from topsoil of various desert dust storm regions. Res. Microbiol. 2013, 164, 17–21. [Google Scholar] [CrossRef]
  65. Griffin, D.W.; Garrison, V.H.; Herman, J.R.; Shinn, E.A. African desert dust in the Caribbean atmosphere: Microbiology and public health. Aerobiologia 2001, 17, 203–213. [Google Scholar] [CrossRef]
  66. Lewis, G.M.; Austin, P.H.; Szczodrak, M. Spatial statistics of marine boundary layer clouds. J. Geophys. Res. 2004, 109, D04104. [Google Scholar] [CrossRef]
  67. Sullivan, M.B.; Coleman, M.L.; Weigele, P.; Rohwer, F.; Chisholm, S.W. Three Prochlorococcus cyanophage genomes: Signature features and ecological interpretations. PLoS Biol. 2005, 3, 790–806. [Google Scholar] [CrossRef]
  68. Reche, I.; Ortega-Retuerta, E.; Romera, O.; Pulido-Villena, E.; Morales-Baquero, R.; Casamayor, E.O. Effect of Saharan dust inputs on bacterial activity and community composition in Mediterranean lakes and reservoirs. Limnol. Oceanogr. 2009, 54, 869–879. [Google Scholar] [CrossRef] [Green Version]
  69. Raveh, O.; David, N.; Rilov, G.; Rahav, E. The temporal dynamics of coastal phytoplankton and bacterioplankton in the Eastern Mediterranean Sea. PLoS ONE 2015, 10, 1–23. [Google Scholar] [CrossRef]
  70. Chróst, R.J. Microbial Ectoenzymes in Aquatic Environments. In Aquatic Microbial Ecology; Overbeck, J., Chróst, R.J., Eds.; Brock/Springer Series in Contemporary Bioscience; Springer: New York, NY, USA, 1990. [Google Scholar]
  71. Krom, M.D.; Shi, Z.; Stockdale, A.; Berman-Frank, I.; Giannakourou, A.; Herut, B.; Lagaria, A.; Papageorgiou, N.; Pitta, P.; Psarra, S.; et al. Response of the Eastern Mediterranean microbial ecosystem to dust and dust a affected by acid processing in the atmosphere. Front. Mar. Sci. 2016, 3. [Google Scholar] [CrossRef]
  72. Marín, I.; Nunes, S.; Sánchez-Pérez, E.D.; Txurruka, E.; Antequera, C.; Sala, M.M.; Marrasé, C.; Peters, F. Coastal Bacterioplankton Metabolism Is Stimulated Stronger by Anthropogenic Aerosols than Saharan Dust. Front. Microbiol. 2017, 8, 2215. [Google Scholar] [CrossRef]
  73. Münster, U.; Nurminen, J.; Einiö, P.; Overbeck, J. Extracellular enzymes in a small polyhumic lake: Origin, distribution and activities. Hydrobiologia 1992, 243, 47. [Google Scholar] [CrossRef]
  74. Zaccone, R.; Caruso, G.; Calì, C. Heterotrophic bacteria in the northern Adriatic Sea: Seasonal changes and ectoenzyme profile. Mar. Environ. Res. 2002, 54, 1–19. [Google Scholar] [CrossRef]
  75. Obayashi, Y.; Suzuki, S. Occurrence of exo- and endopeptidases in dissolved and particulate fractions of coastal seawater. Aquat. Microb. Ecol. 2008, 50, 231–237. [Google Scholar] [CrossRef] [Green Version]
  76. Zaccone, R.; Caruso, G. Microbial hydrolysis of polysaccharides and organic phosphates in the Northern Adriatic Sea. Chem. Ecol. 2002, 18, 85–94. [Google Scholar] [CrossRef]
  77. Zaccone, R.; Caroppo, C.; La Ferla, R.; Zampino, D.; Caruso, G.; Leonardi, M.; Maimone, G.; Azzaro, M.; Sitran, R. Deep-chlorophyll maximum time series in the Augusta Gulf (Ionian Sea): Microbial community structures and functions. Chem. Ecol. 2004, 20 (Suppl. 1), 267–284. [Google Scholar] [CrossRef]
  78. Mackey, K.R.M.; Labiosa, R.L.; Calhoun, M.; Street, J.H.; Post, A.F.; Paytan, A. Phosphorus availability, phytoplankton community dynamics, and taxon-specific phosphorus status in the Gulf of Aqaba, Red Sea. Limnol. Oceanogr. 2007, 52, 873–885. [Google Scholar] [CrossRef] [Green Version]
  79. Herut, B.; Krom, M.D.D.; Pan, G.; Mortimer, R. Atmospheric input of nitrogen and phosphorus to the Southeast Mediterranean: Sources, fluxes, and possible impact. Limnol. Oceanogr. 1999, 44, 1683–1692. [Google Scholar] [CrossRef] [Green Version]
  80. Krom, M.D.; Herut, B.; Mantoura, R.F.C. Nutrient budget for the Eastern Mediterranean: Implications for phosphorus limitation. Limnol. Oceanogr. 2004, 49, 1582–1592. [Google Scholar] [CrossRef]
Figure 1. An illustration of the experimental mesocosm used in this study. Treatments included unamended controls, live dust and UV-treated dust run in triplicate 300 L transparent bags.
Atmosphere 10 00358 g001
Figure 2. Temporal variability in Chl-a (A), Prochlorococcus (B), Synechococcus (C), picoeukaryotes (D), and heterotrophic bacteria (E) following 0.8 mg L−1 of “live dust” (circle), “UV-treated dust” (triangle) or unamended controls (square). Data shown are the average ± SD (n = 3).
Atmosphere 10 00358 g002
Figure 3. Temporal variability in primary production (PP) (A), bacterial production (BP) (B), beta-glucosidase (β-Glu) (C), leu-aminopeptidase (AMA) (D), and alkaline phosphatase activity (APA) (E) following 0.8 mg L−1 of “live dust” (circle), “UV-treated dust” (triangle) or unamended controls (square). Data shown are the average ± SD (n = 3).
Atmosphere 10 00358 g003
Figure 4. Relative abundance of prokaryotes (A) and eukaryotes (B) in the aerosols collected during the dust storm. The last row in both legends is the sum of all rare taxa (constituting <5% of relative abundance). In (A), A and B in the first column of the legend corresponds to archaea and bacteria, respectively. In (B), column names 2–5 represent taxonomic levels.
Atmosphere 10 00358 g004
Figure 5. Relative abundance of prokaryotes (A) and eukaryotes (B) in the NRS surface water before amendment (T0) and 44 h after amendment for control, live dust, and UV-treated dust treatments. Data shown are the sum of triplicates. The last row in both legends is the sum of all rare taxa (constituting <5% of relative abundance). In (A), A and B in the first column of the legend corresponds to archaea and bacteria, respectively. In (B), column names 2–5 represent taxonomic levels.
Atmosphere 10 00358 g005aAtmosphere 10 00358 g005b
Figure 6. Diversity indices of prokaryotes, (A) Shannon’s diversity indices at 20 h (B) Faith’s phylogenetic diversity indices at 20 h, (C) Shannon’s diversity indices at 44 h (D) Faith’s phylogenetic diversity indices at 44 h, and diversity indices of eukaryotes, (E) Shannon’s diversity indices at 20 h (F) Faith’s phylogenetic diversity indices at 20 h, (G) Shannon’s diversity indices at 44 h (H) Faith’s phylogenetic diversity indices at 44 h, for control, live dust, and UV-treated dust treatments. The ends of the box are the upper and lower quartiles, so the box spans the interquartile range. The median for each treatment of three replicates is marked by a horizontal line inside the box. The whiskers are the two lines outside the box that extend to the highest and lowest observations.
Atmosphere 10 00358 g006
Table 1. The net response triggered by airborne microbes in the northern Red Sea (NRS) seawater 24–48 h post addition. Values were calculated as the difference between the “live dust” and “UV-treated dust”. Statistically significant differences are highlighted in bold (p < 0.05).
VariableT20 hT48 h
Chl-a (µg L−1)−0.13−0.06
Prochlorococcus (Cells mL−1)−2140−1920
Synechococcus (Cells mL−1)−7300−9100
Picoeukaryotes (Cells mL−1)−120−10
Heterotrophic bacteria (Cells mL−1)−82,000−3000
PP (µg C L−1 h−1)−0.08−0.52
BP (µg C L−1 h−1)−0.320.83
β-Glu (nmol L−1 h−1)1.491.24
APA (nmol L−1 h−1)0.200.46
AMA (nmol L−1 h−1)0.480.69

