Article

Assessing the Potential Highest Storm Tide Hazard in Taiwan Based on 40-Year Historical Typhoon Surge Hindcasting

1
National Science and Technology Center for Disaster Reduction, New Taipei City 23143, Taiwan
2
Department of Geosciences, National Taiwan University, Taipei City 10617, Taiwan
3
Department of Hydraulic and Ocean Engineering, National Cheng Kung University, Tainan City 70101, Taiwan
*
Author to whom correspondence should be addressed.
Atmosphere 2019, 10(6), 346; https://doi.org/10.3390/atmos10060346
Submission received: 29 May 2019 / Revised: 18 June 2019 / Accepted: 22 June 2019 / Published: 25 June 2019
(This article belongs to the Special Issue Storm Surge Modeling – Capturing the Wind)

Abstract

:
Typhoon-induced storm surges are catastrophic disasters in coastal areas worldwide, although typhoon surges are not extremely high in Taiwan. However, the rising water level around an estuary could be a block that obstructs the flow of water away from the estuary and indirectly forms an overflow in the middle or lower reaches of a river if the occurrence of the highest storm surge (HSS) coincides with the highest astronomical tide (HAT). Therefore, assessing the highest storm tide (HST, a combination of the HSS and HAT) hazard level along the coast of Taiwan is particularly important to an early warning of riverine inundation. This study hindcasted the storm surges of 122 historical typhoon events from 1979 to 2018 using a high-resolution, unstructured-grid, surge-wave fully coupled model and a hybrid typhoon wind model. The long-term recording measurements at 28 tide-measuring stations around Taiwan were used to analyze the HAT characteristics. The hindcasted HSSs of each typhoon category (the Central Weather Bureau of Taiwan classified typhoon events into nine categories according to the typhoon’s track) were extracted and superposed on the HATs to produce the individual potential HST hazard maps. Each map was classified into six hazard levels (I to VI). Finally, a comprehensive potential HST hazard map was created based on the superposition of the HSSs from 122 typhoon events and HATs.

1. Introduction

Typhoons (also known as tropical cyclones or hurricanes) are deemed the most dangerous natural disasters and cause extensive and devastating damage, economic losses, and deaths around the world every year because of their most destructive impacts, such as heavy rainfall, violent winds, storm waves, and storm surges. A storm surge is a typhoon-induced tsunami-like phenomenon that can produce flooding in coastal regions. It is also a measure of the rise of water levels (or water volumes) above what would be expected by the normal movement related to tides. A long wind fetch spiraling inward toward the center of a typhoon, and a low-pressure-induced storm dome under and trailing the center of a typhoon, are two primary factors that contribute to a storm surge. The severity of a storm surge-caused inundation is mainly dominated by the shallowness of coastal waters, the orientation of the water body and the timing of tides.
Severe marine weather events, e.g., storm surges and storm waves, are increasing threats to human life and property in lower-lying coastal zones worldwide because of higher population densities in the areas of typhoon landfall and climate change impacts [1,2,3]. For example, the storm surge of Super Typhoon Haiyan (2013) was considered to be a major cause of the severe damage and loss of life in the Philippines. The hindcasting storm surge induced by Super Typhoon Haiyan could reach 2.5 m at Talcoban in Leyte Gulf [4], and the greatest estimated storm surge height was approximately 3.9 m in Batad, Iloilo [5]. Moreover, the seiche oscillation amplified the water surface elevations (storm tides) inside the Leyte Gulf in addition to the strong winds of Super Typhoon Haiyan [6].
Torrential rains can affect mountain areas during the passage of a typhoon and increase river flows and stages, and river outflows in an estuary can be blocked by high incoming astronomical tides and storm surges and consequently create floods in the surrounding areas of the cities close to a delta river, although typhoon-driven storm surges are not extremely high in Taiwan. Many unstructured-grid, tide-surge-wave coupled models, e.g., FVCOM-SWAVE (Finite Volume Community Ocean Model and unstructured-grid Surface WAVE model) [7], SELFE-WWM-II (Semi-implicit Eulerian-Lagrangian Finite Element model and Wind Wave Model-II) [8] and SWAN+ADCIRC (Simulating WAves Nearshore model and ADvanced CIRCulation model) [9], have been successfully applied to predict and hindcast typhoon-generated coastal storm surges, and assess the storm surge hazard for the small islands [10,11]. Chen et al. [12] studied the contribution of nonlinear interactions to storm tide simulations in the southern coast of Taiwan for Super Typhoon Meranti in 2016. Their research found that waves were the most significant element for the storm surge simulation, more so than tides.
The aim of this paper is to assess and better understand the natural features of astronomical tides and storm surges, as well as the combinations of astronomical tides and storm surges (i.e., storm tides) by employing a surge-wave coupled model and meteorological conditions from a hybrid typhoon model. The data and models used in the present study are described in the following section, and the results of the data analysis and model simulations are given in Section 3. In Section 4, the discussions are shown, followed by conclusions and a summary in Section 5.

2. Data and Models

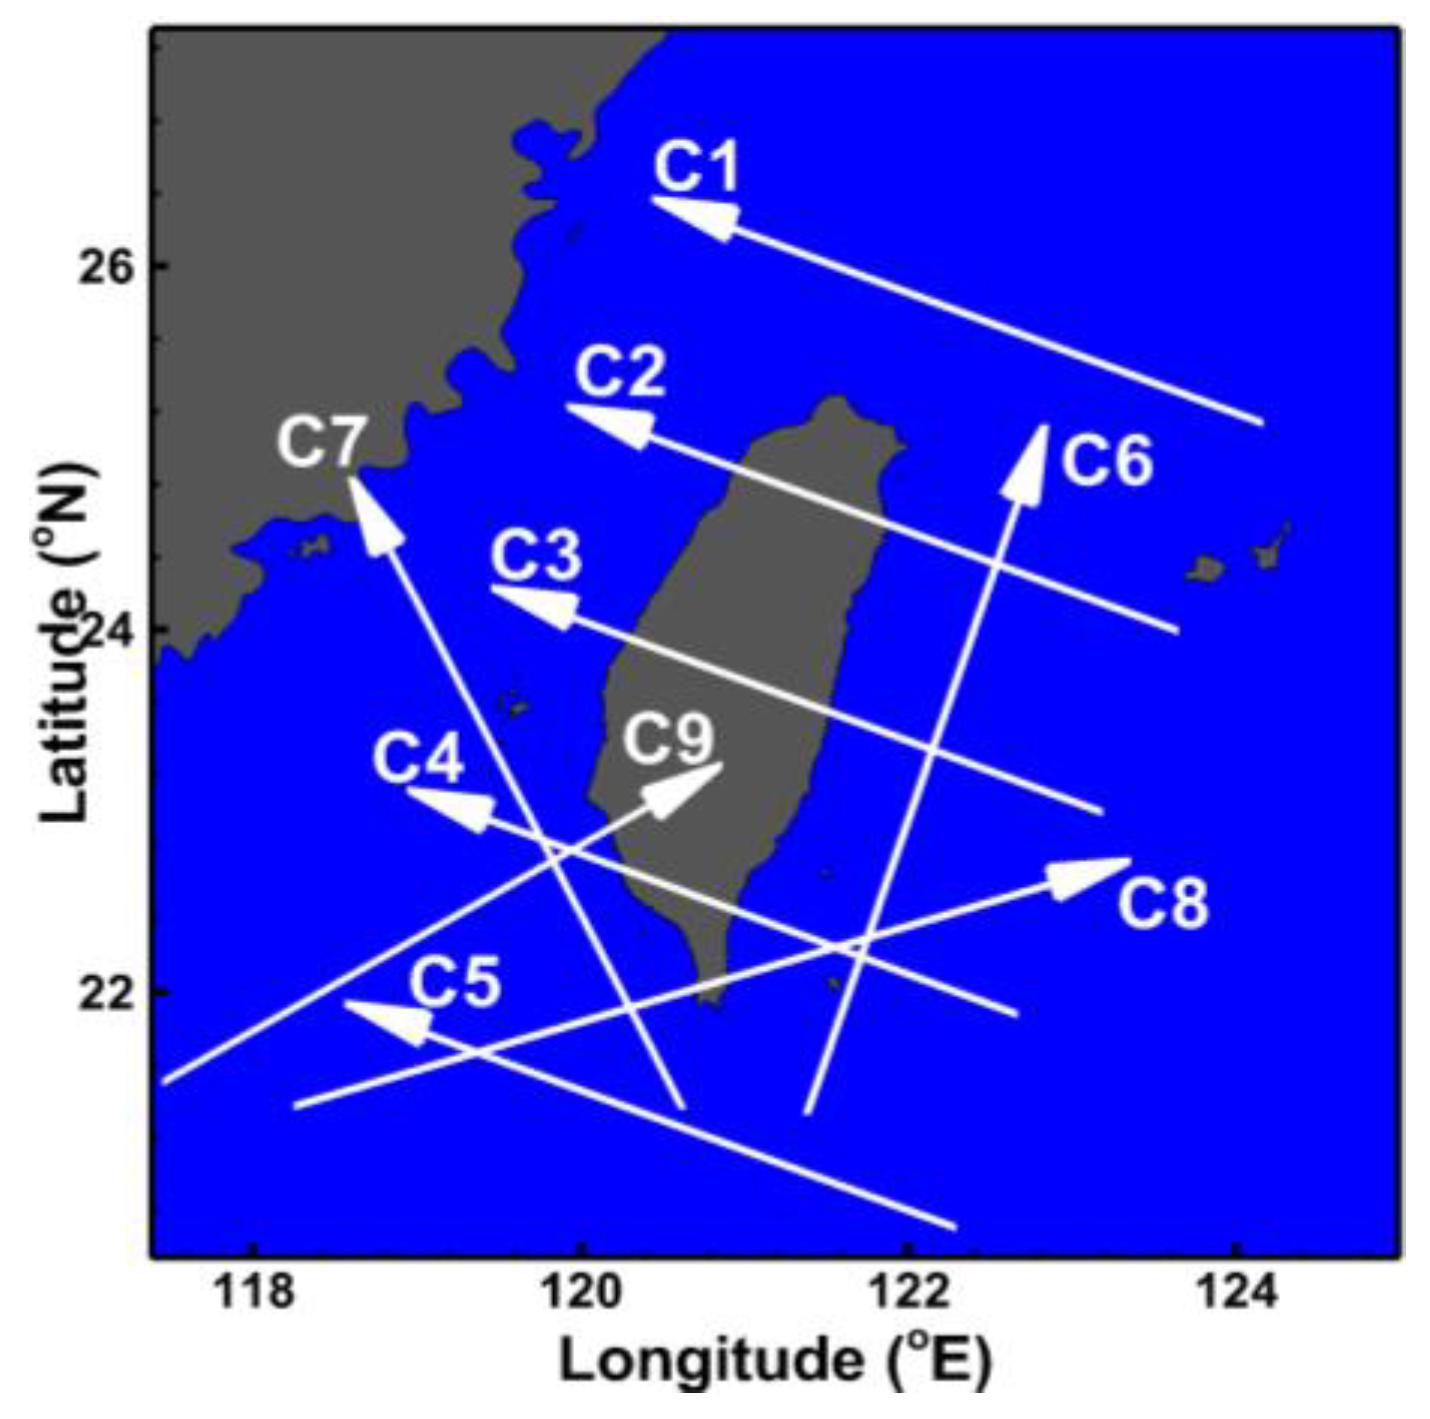
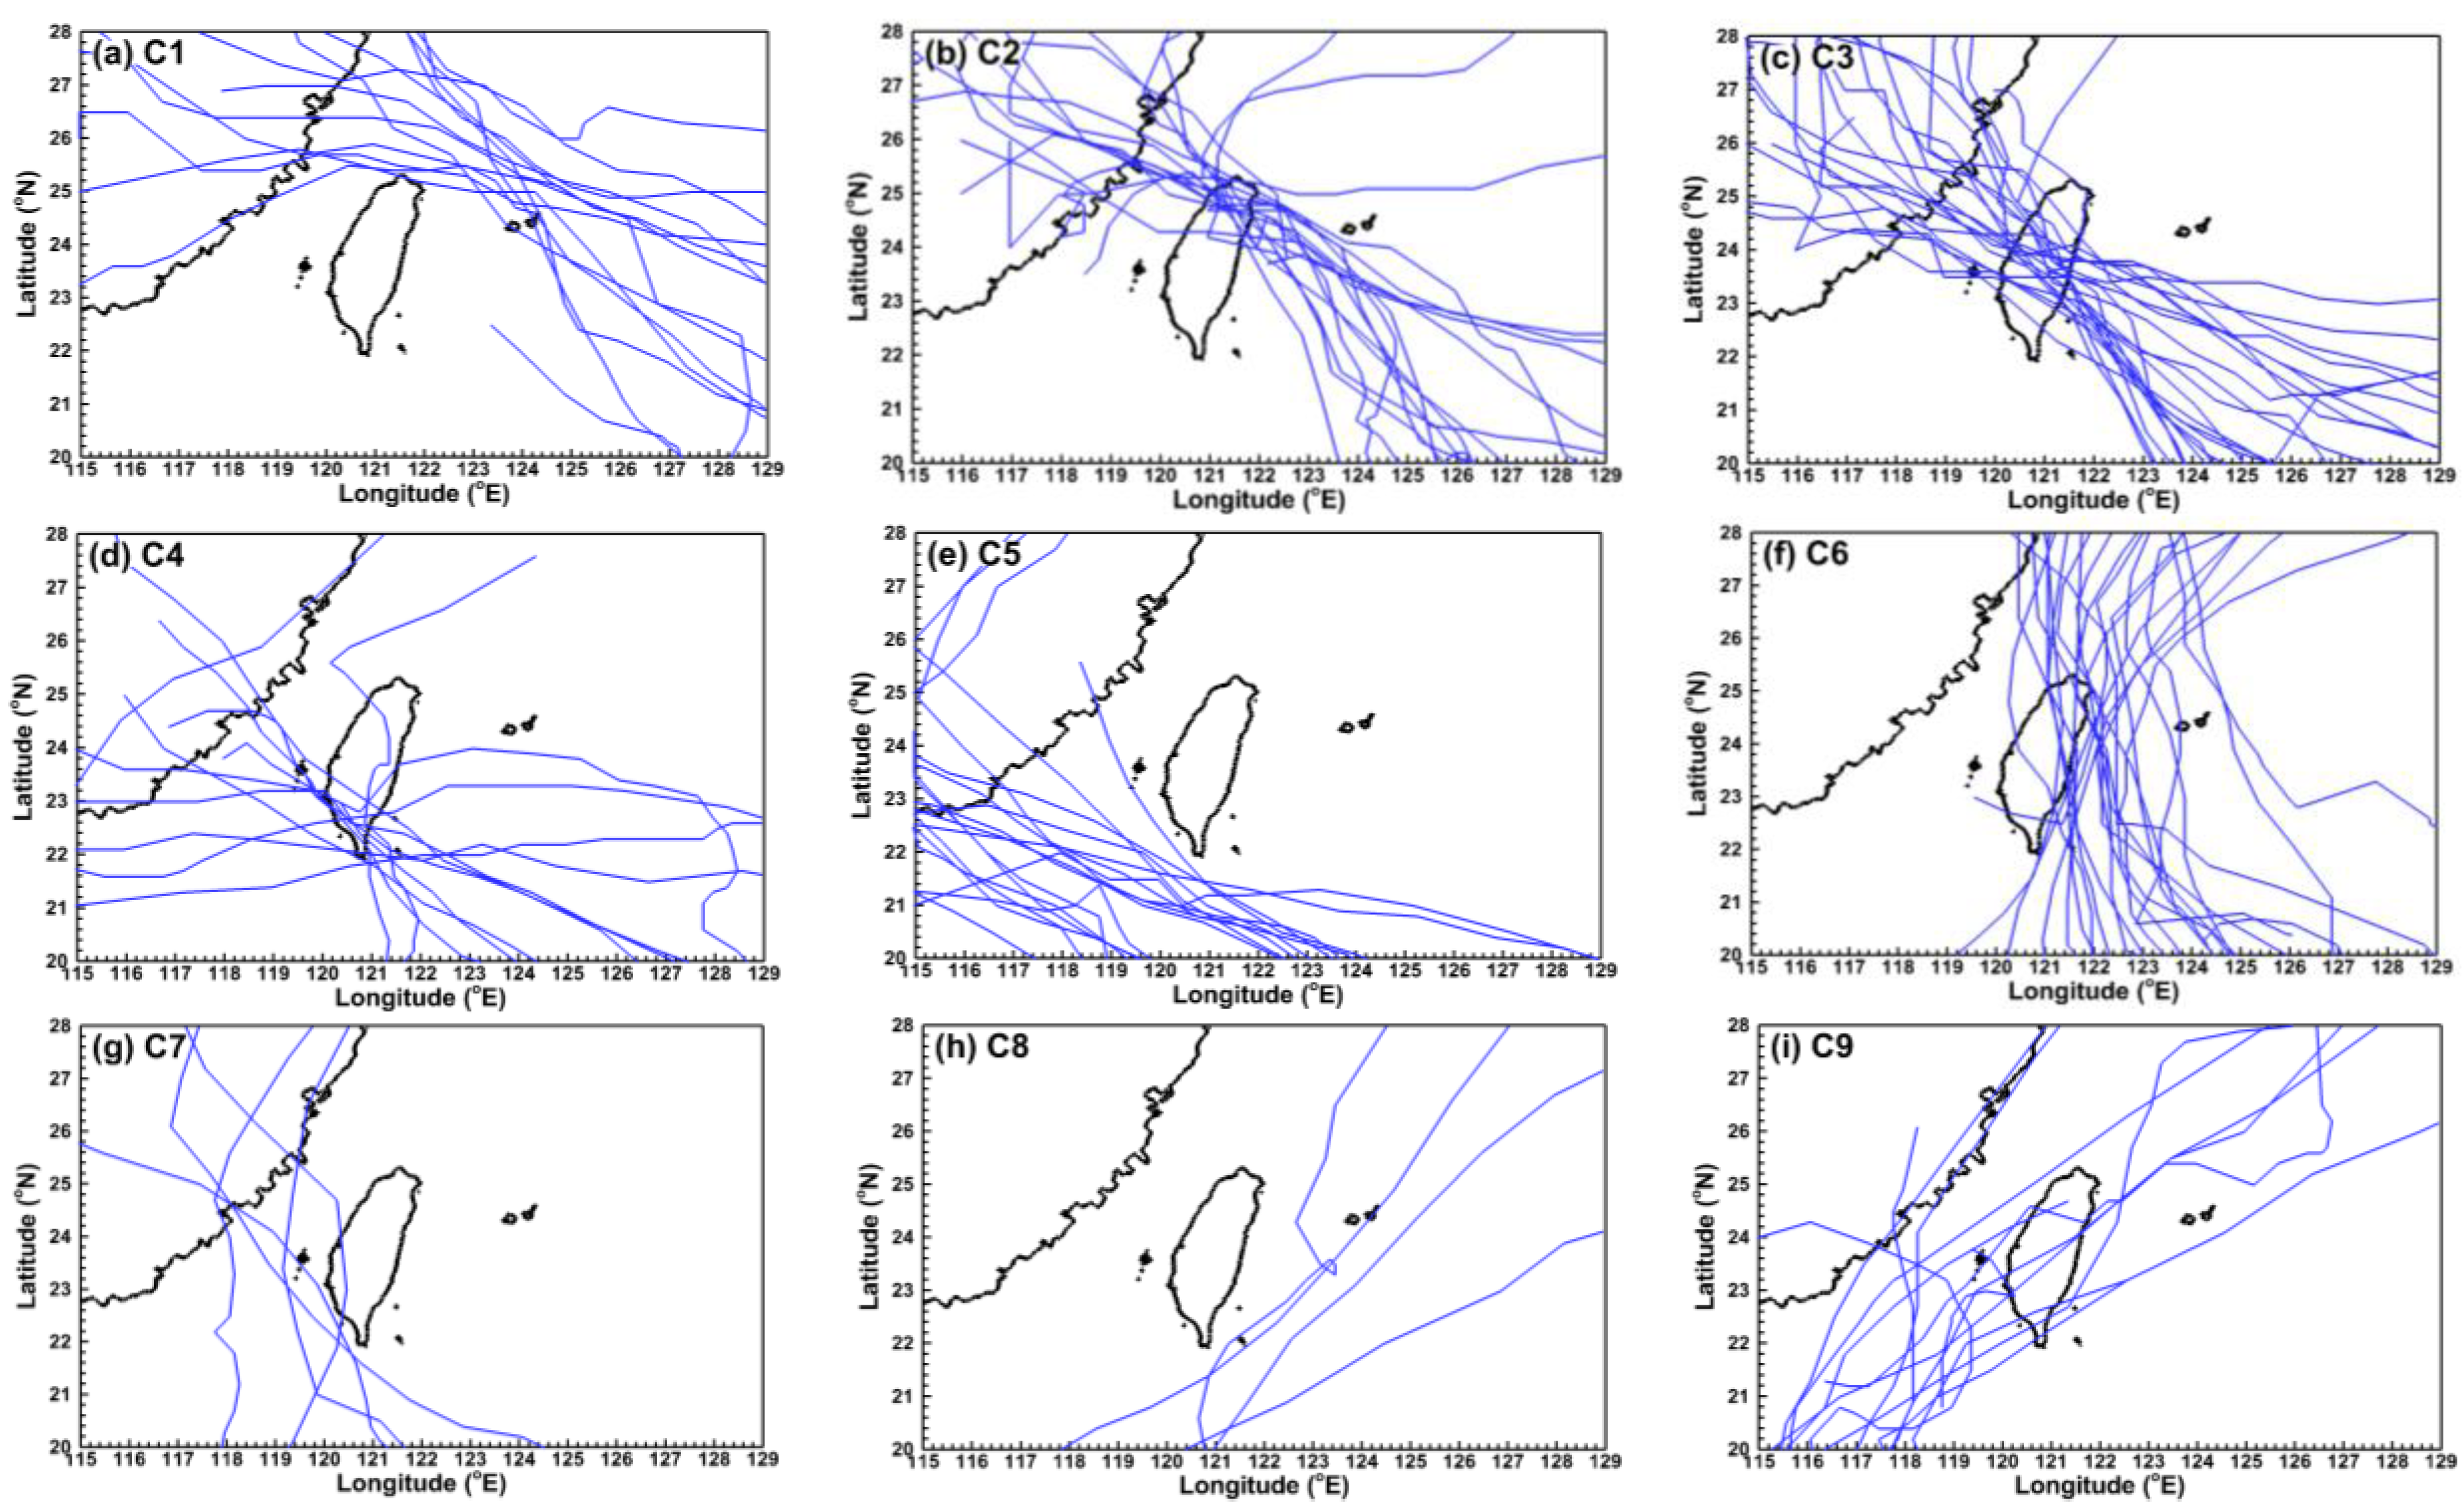
2.1. Historical Typhoon Events

The Central Weather Bureau (CWB) of Taiwan classified typhoon events into nine categories (hereinafter called C1, C2, C3, C4, C5, C6, C7, C8, and C9, as shown in Figure 1) on the basis of the typhoons’ tracks. For example, a typhoon event would be classified as C1 if its track passed the northern waters of Taiwan and then moved to the west or the northwest without making landfall in Taiwan. The tracks of C2 typhoon events are similar to those of C1 except in a southerly direction, i.e., a C2 typhoon is expected to make landfall in the northeastern coast of Taiwan. The CWB will issue the land or sea warning for a typhoon once it has the possibility of impacting Taiwan. During the past 40 years (1979 to 2018), land or sea warnings were issued for a total of 122 historical typhoon events; these were selected for hindcasting typhoon-induced storm surges in the present study. The tracks of the 122 typhoons are illustrated in Figure 2, in which Figure 2a–i correspond to C1–C9, respectively.

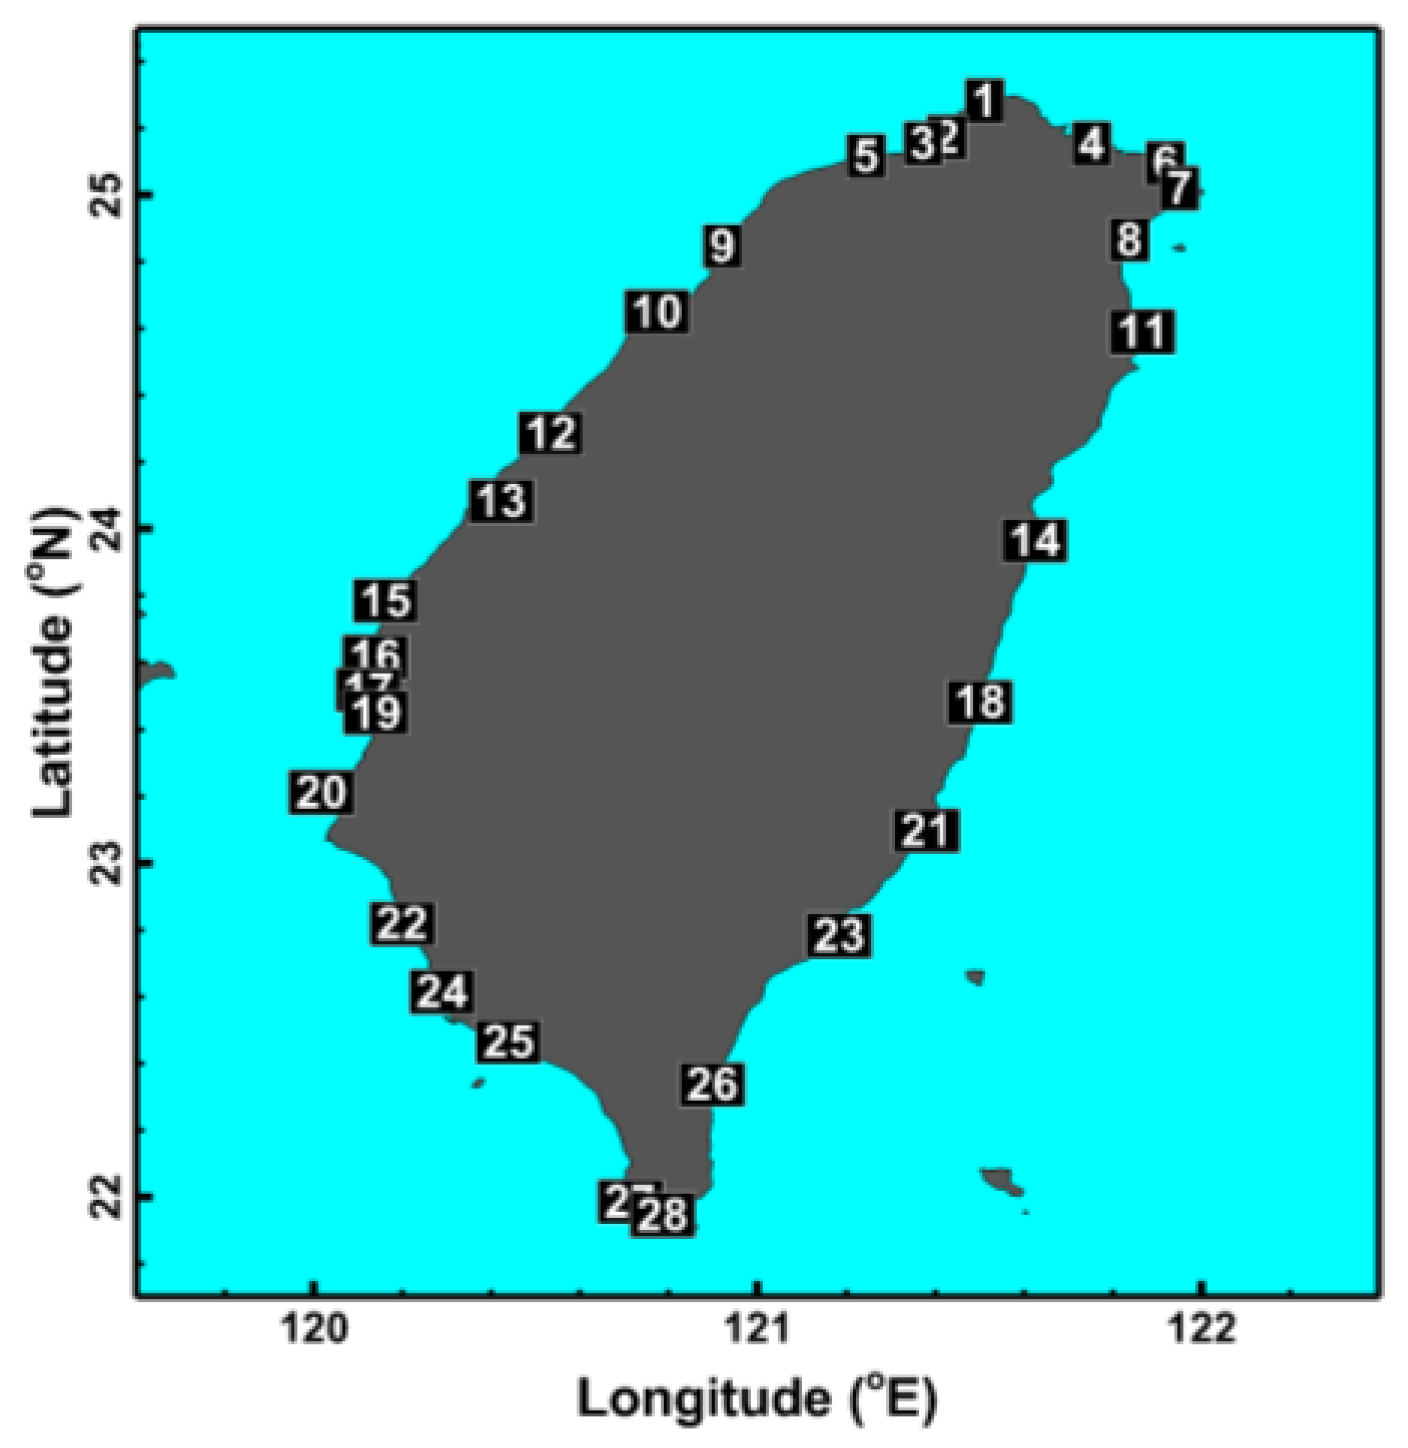
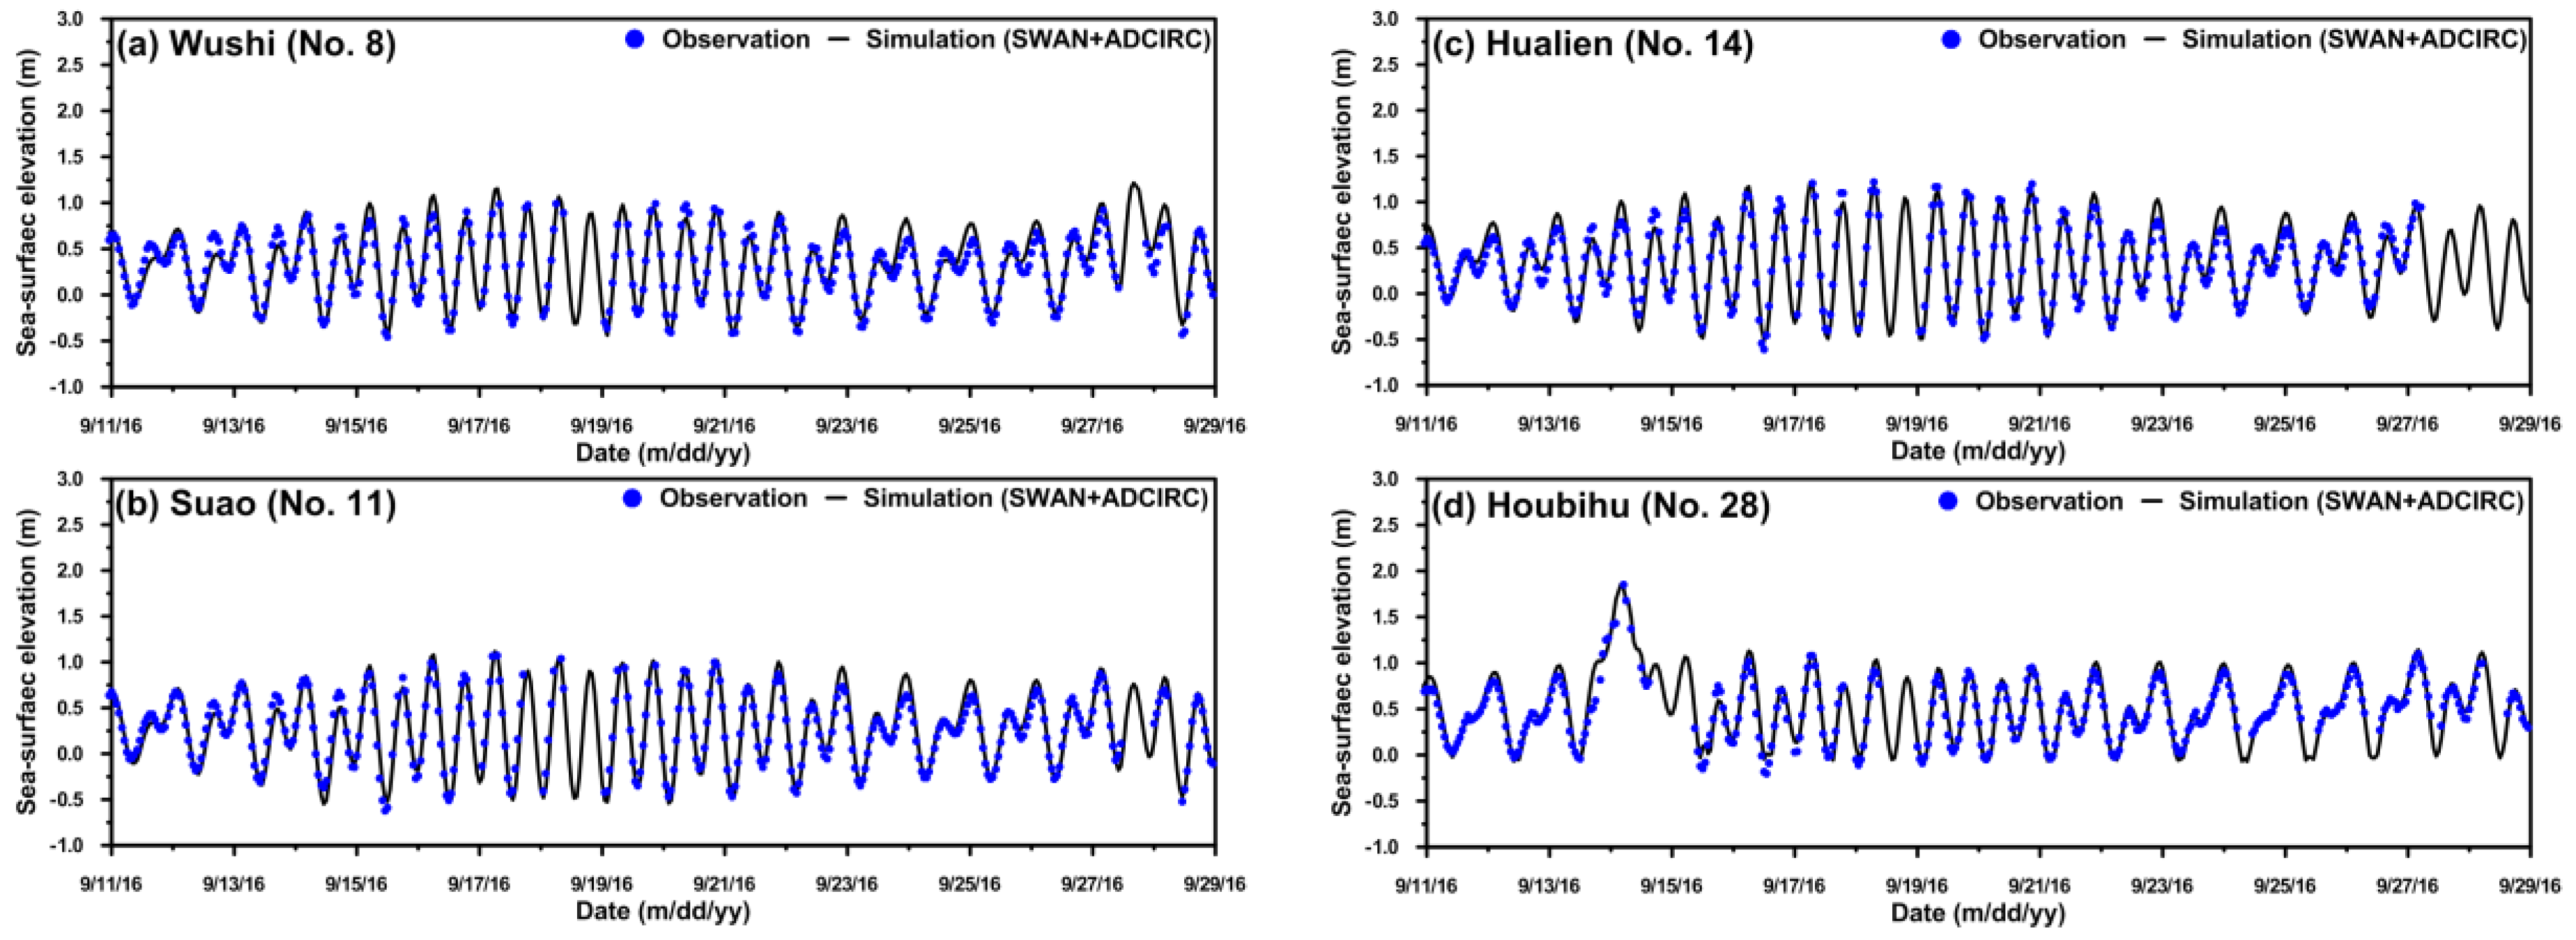
2.2. Tide-Measuring Stations

The CWB and Water Resource Agency (WRA) deployed 28 tide-measuring stations for the long-term monitoring of the sea-surface elevations along the coastal waters of Taiwan. The distributions, locations, and the number of the 28 tide-measuring stations are shown in Figure 3. The names, coordinates (longitude and latitude) and the highest astronomical tides (HATs) corresponding to Figure 3 are listed in Table 1. The HAT for each tide-measuring station has been calibrated with respect to the Taiwan Vertical Datum 2001 (TWVD2001, the vertical geodetic datum applied in Taiwan, [13]). The maximum HAT is 2.63 m for Taichung Harbor (number 12 in Figure 3), whereas the minimum HAT is only 0.57 m in Keelung (number 4 in Figure 3).

2.3. Surge-Wave Coupled Model
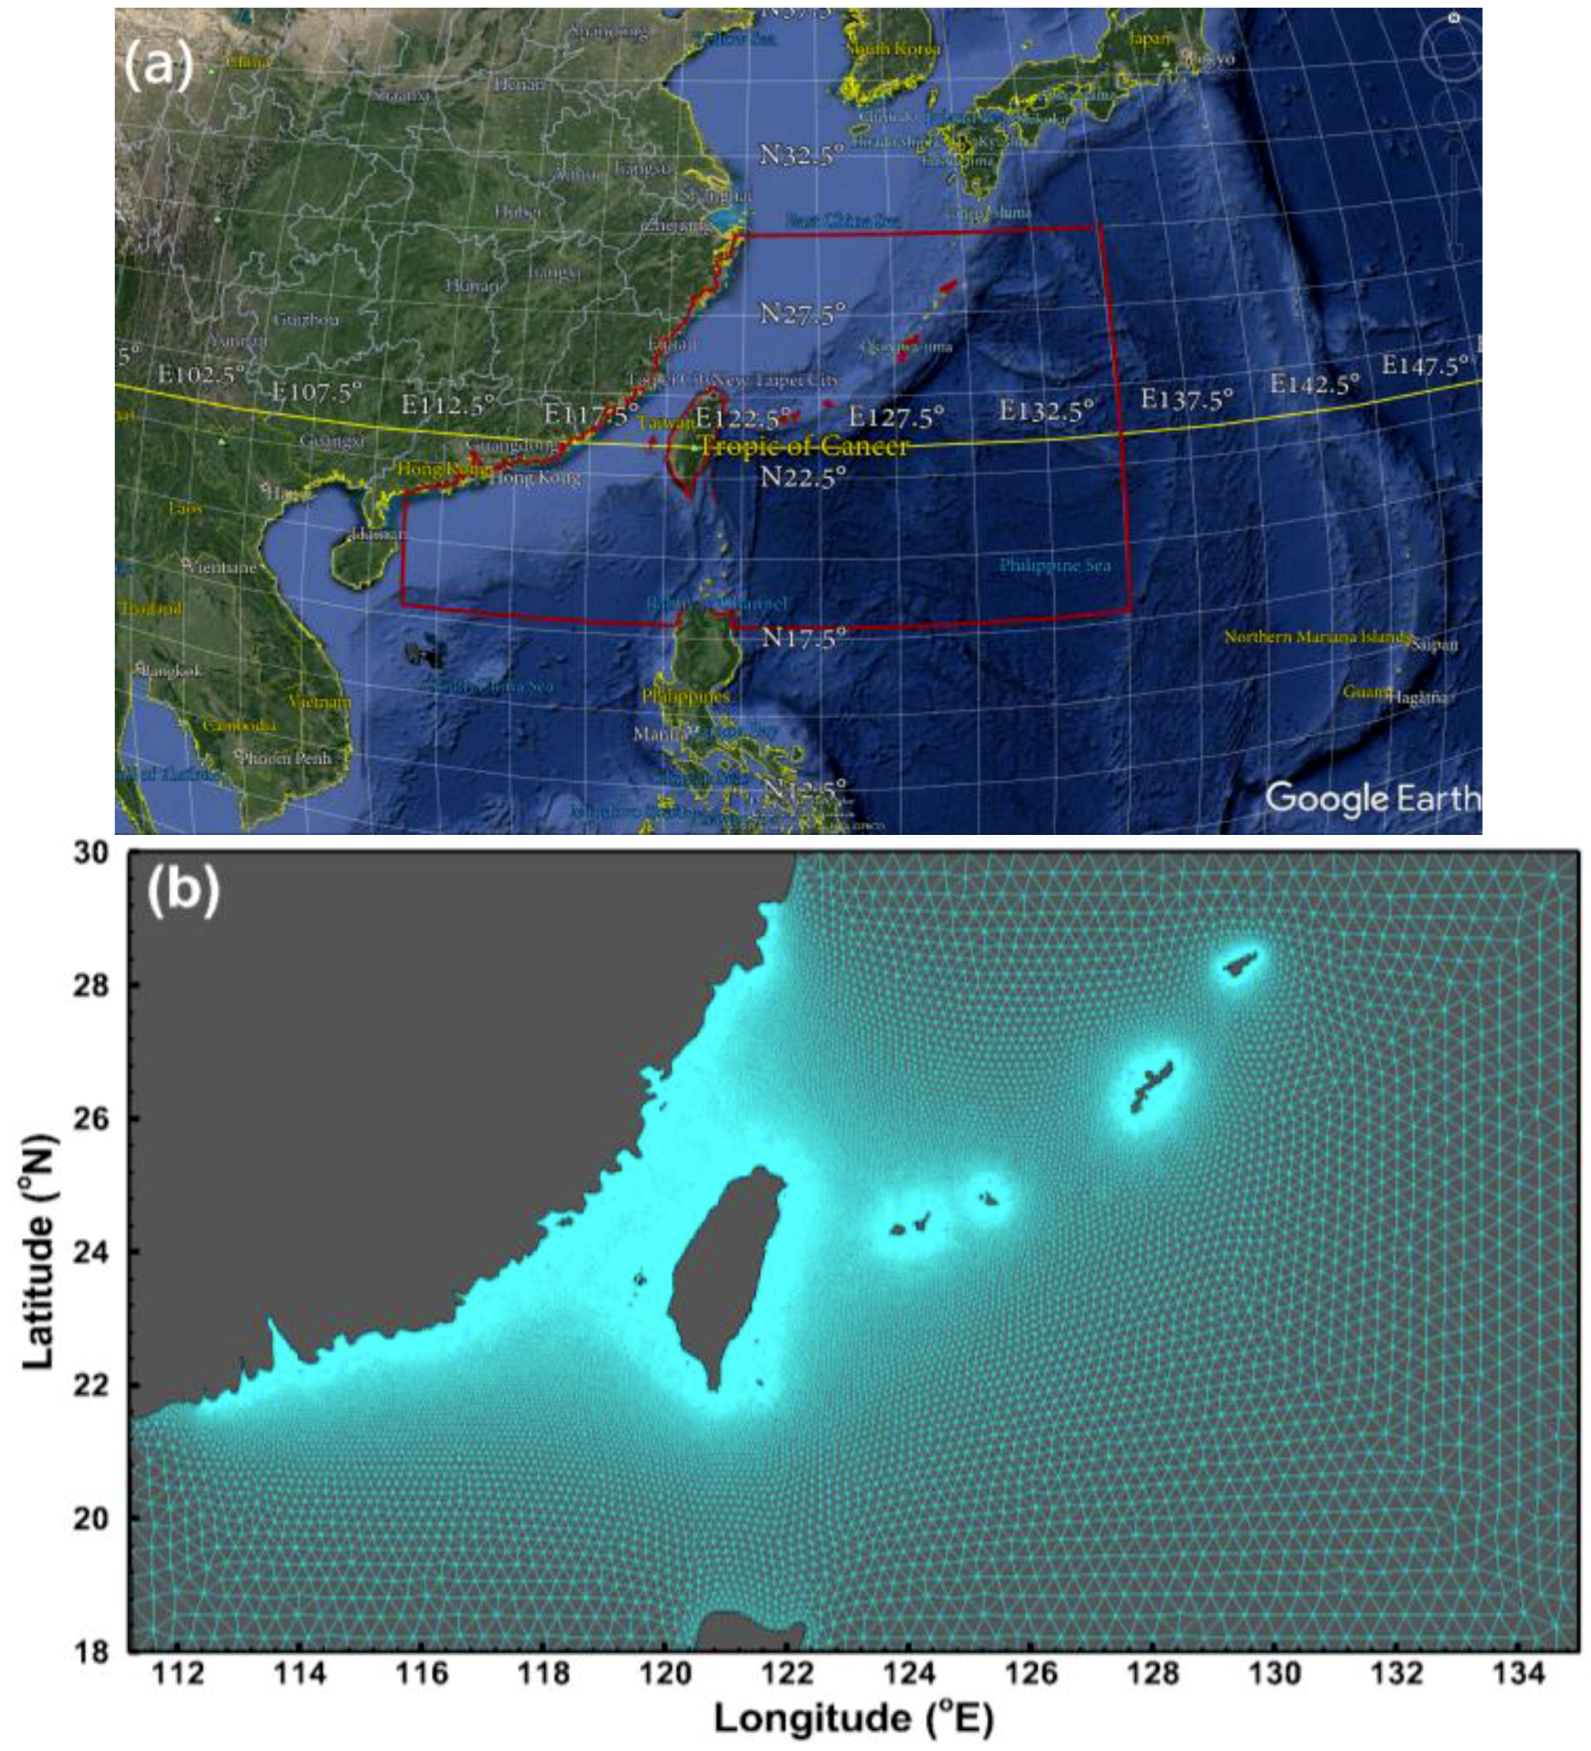
ADCIRC (ADvanced CIRCulation) is a finite-element, time-dependent, long-wave, ocean-circulation numerical model for simulating the water-surface elevation and current over an unstructured gridded domain in an either three-dimensional or two-dimensional depth-integrated form with Cartesian or spherical coordinates, originally developed by Luettich and Westerink [14,15] and further improved and applied by [16,17]. A two-dimensional, depth-integrated version of ADCIRC (ADCIRC-2DDI) was employed in the present study. ADCIRC-2DDI solves the shallow-water equations in their full nonlinear form (solving the continuity equation with the form of the Generalized Wave Continuity Equation (GWCE), and the momentum equations with advective, Coriolis, eddy viscosity, and surface stress terms) and includes the nonlinear convective terms, the finite amplitude terms and the standard quadratic parameterization of the bottom friction terms, in addition to a spatially variable eddy viscosity term. ADCIRC-2DDI can be forced with elevation boundary conditions, zero normal boundary fluxes, variable spatial and temporal free surface stress, and atmospheric pressure forcing functions, in addition to Coriolis and tidal potential forcing terms. ADCIRC-2DDI is able to apply several different bottom friction formulations, including Manning’s n-based bottom drag, due to changes in the land coverage, such as forests, urban areas, and the seafloor composition, and it can use atmospheric forcing data, e.g., wind stress and atmospheric pressure, from several sources [17,18]. The model is also able to incorporate the effects of boundary fluxes from rivers or other sources, the tidal potential, and subgrid scale features such as levees. ADCIRC-2DDI can be executed either in serial mode (e.g., on a personal computer) or in parallel mode on supercomputers via the Message Passing Interface (MPI). To facilitate the rapid computation of large-scale, complex problems, the model has been optimized to be highly parallelized [19,20]. ADCIRC-2DDI is frequently coupled to a wind wave model (e.g., STeady state spectral WAVE, STWAVE, [21], Simulating WAves Nearshore, SWAN, [22], or WAVEWATCH III, WW3, [23]), especially in storm surge modeling applications where the wave radiation stress (wave setup) is more significant. The model is capable of taking advantage of tight coupling with a wave model to obtain accurate calculations [16,17]. A Manning’s n formulation was adopted to compute the bottom friction coefficient (Cb):
C b = g n 2 H 1 / 3 ,
where g is the gravitational acceleration, n is the Manning coefficient and H is the total water depth. Manning n was assigned a value of 0.025 in ADCIRC-2DDI according to the type of sea bottom material in Taiwan. A sea-surface stress was applied to transfer the momentum from the wind, using the wind drag coefficient (Cs) from Garratt [24], with a cap of 0.0035:
C s = 10 3 ( 0.75 + 0.067 × U 10 )
where U10 is the wind speed at 10 m above the sea surface. Acquiring Cs via Equation (2) has been widely used for storm surge modeling [16,17,18].
Phase-averaged spectral wave numerical models are efficient in sea state simulations for realistic applications [25]; therefore, a third-generation spectral wave model in its unstructured-grid version, UnSWAN [26], using a vertex-based, fully implicit, finite difference algorithm, was used in the present study. UnSWAN solves the wave action balance equation for the wave spectra of random short-crested, wind-generated waves and swells based on winds, bathymetries, tides and currents in coastal regions and inland waters [22,27]. Several shallow water wave processes, for example triad-wave interaction, depth-induced wave breaking, and bottom friction dissipation, are contained in UnSWAN, and the model is thus particularly applicable in coastal waters [28]. The UnSWAN model was run with prescribed spectrum frequencies over a range of 0.031–1.42 Hz and was discretized into 40 bins on a logarithmic scale, which was found to provide the best simulations when compared with the measurements [29]. The wave spectrum was solved in 360° with a directional resolution of 10°, and the bottom friction-induced wave dissipation was modeled using the formulation from the JONSWAP project (Joint North Sea Wave Project, [30]). Quadruplet wave-wave interactions are dealt with using a Discrete Interaction Approximation (DIA), proposed by Hasselmann et al. [31] and adopted in WW3 for typhoon wave simulations [32].
The UnSWAN and ADCIRC-2DDI models were integrated via the information exchange between the two model components by running on the same unstructured mesh. The two-way coupled model (SWAN + ADCIRC) accounts for all nonlinear wave-current-tide-surge interactions, including the wave radiation stress, current refraction and water depth modulation of waves. ADCIRC solves the GWCE for the sea-surface elevation and depth-integrated currents considering the wind field at 10 m above the ocean surface and the sea-level pressure on each node and then passes the wind stress, water level and current to SWAN. SWAN computes the wave radiation stress by solving the wave action balance equation and sends it back to ADCIRC to calculate the water level and currents. More details about the coupling processes of the SWAN + ADCIRC modeling system can be found in [9].

2.4. Model Setup

A large computational domain is indispensable to capture the physical responses of a typhoon and could simplify the boundary conditions of the numerical model [33,34], although it can be time-consuming and computationally expensive. The problem can be overcome by using unstructured-grid models. A large domain with locally refined grids to resolve the bathymetry in shallow-water areas, steep sea-floor gradients and the complex shoreline of islands, and with coarser grids arranged far away from coastal zones, can be achieved if unstructured-grid ocean circulation and wind wave models are chosen [35]. Although this paper mainly focuses on the maximum typhoon-induced surge along the coast of Taiwan, a large modeling domain was created that incorporates the entirety of Taiwan and its main offshore islands, and that extends its coverage from 111° E to 135° E and from 18° N to 30° N, to minimize the influence of open boundary conditions on the simulations. The major part of the open boundary is located in the deep ocean, i.e., the impacts of nonlinear interactions are weaker. The current model domain has been found to be sufficiently wide to simulate the storm surges induced by typhoons that are traveling long distances from the Pacific Ocean to the Taiwan Strait (Figure 4a). A total of 318,449 triangular elements and 163,957 nonoverlapping unstructured grids were used to construct the model meshes. Figure 4b shows that the mesh resolution varies from 40 km to 200 m at open ocean boundaries, and along the coastline of Taiwan and its small offshore islands, respectively, which provides a sufficient resolution for the surge propagation at the coast without compromising the computational efficiency. A global gridded bathymetry dataset was obtained from the General Bathymetric Chart of the Oceans (GEBCO) with a resolution of 30 arc-seconds, and a local gridded bathymetry dataset was provided by the Department of Land Administration and the Ministry of the Interior in Taiwan, with a resolution of 200 m. The local dataset was merged with GEBCO to provide bathymetric data on each model grid (Figure 4c)
The time step of ADCIRC-2DDI was set to 1 s to ensure computational stability. A relatively large time step of 600 s was adopted for the UnSWAN model because of its unconditional stability. The coupling interval between ADCIRC-2DDI and UnSWAN was taken to be identical with the time step of UnSWAN, i.e., the two models will exchange information every 600 s.

2.5. Hybrid Typhoon Wind Model

The wind field at 10 m above the ocean surface and the sea-level pressure are indispensable inputs for the coupled SWAN + ADCIRC to accomplish the storm surge modeling. The reanalysis wind product is superior in the areas away from the center of the typhoon but inferior around the center. In contrast, the parametric typhoon wind model generally creates a highly accurate wind field near the center of a typhoon, but the accuracy decreases as the distance from the center increases [36]. The combination of a parametric typhoon model and a reanalysis wind product, i.e., the hybrid typhoon wind model, is believed to generate better wind fields for an entire typhoon [37]. The ERA5 reanalysis wind field data, acquired from the public datasets of the European Center for Medium-Range Weather Forecasts (ECMWF), was employed to superpose the modified Rankine vortex model (MRV, [38]) onto a hybrid typhoon wind model to reconstruct the historical typhoon winds. ERA5 is a fifth-generation ECMWF atmospheric reanalysis of the global climate covering the Earth on a 0.25° (approximately 30 km) grid. Compared with ERA-Interim, the hourly output resolution of ERA5 is an improvement and provides a more detailed evolution of severe weather events. The center of a typhoon in the reanalysis data might not always accord with that in the parametric typhoon model [39]; therefore, an approach proposed by Shao et al. [40] was adopted to smooth out the transition zone between the two wind products:
U H = U M R V r < 2 R max α 0.70 α 0.06 U M R V + 1 α 0.72 1 α 0.28 U E R A 5 2 R max r 7 R max U E R A 5 r > 7 R max
where UH is the hybrid typhoon wind, UH is the parametric typhoon wind, UERA5 is the ERA5 reanalysis wind, r is the radial distance from the typhoon’s center to an arbitrary point, Rmax is the radius of the maximum wind speed and α = (7 − r/Rmax)/5.

3. Results

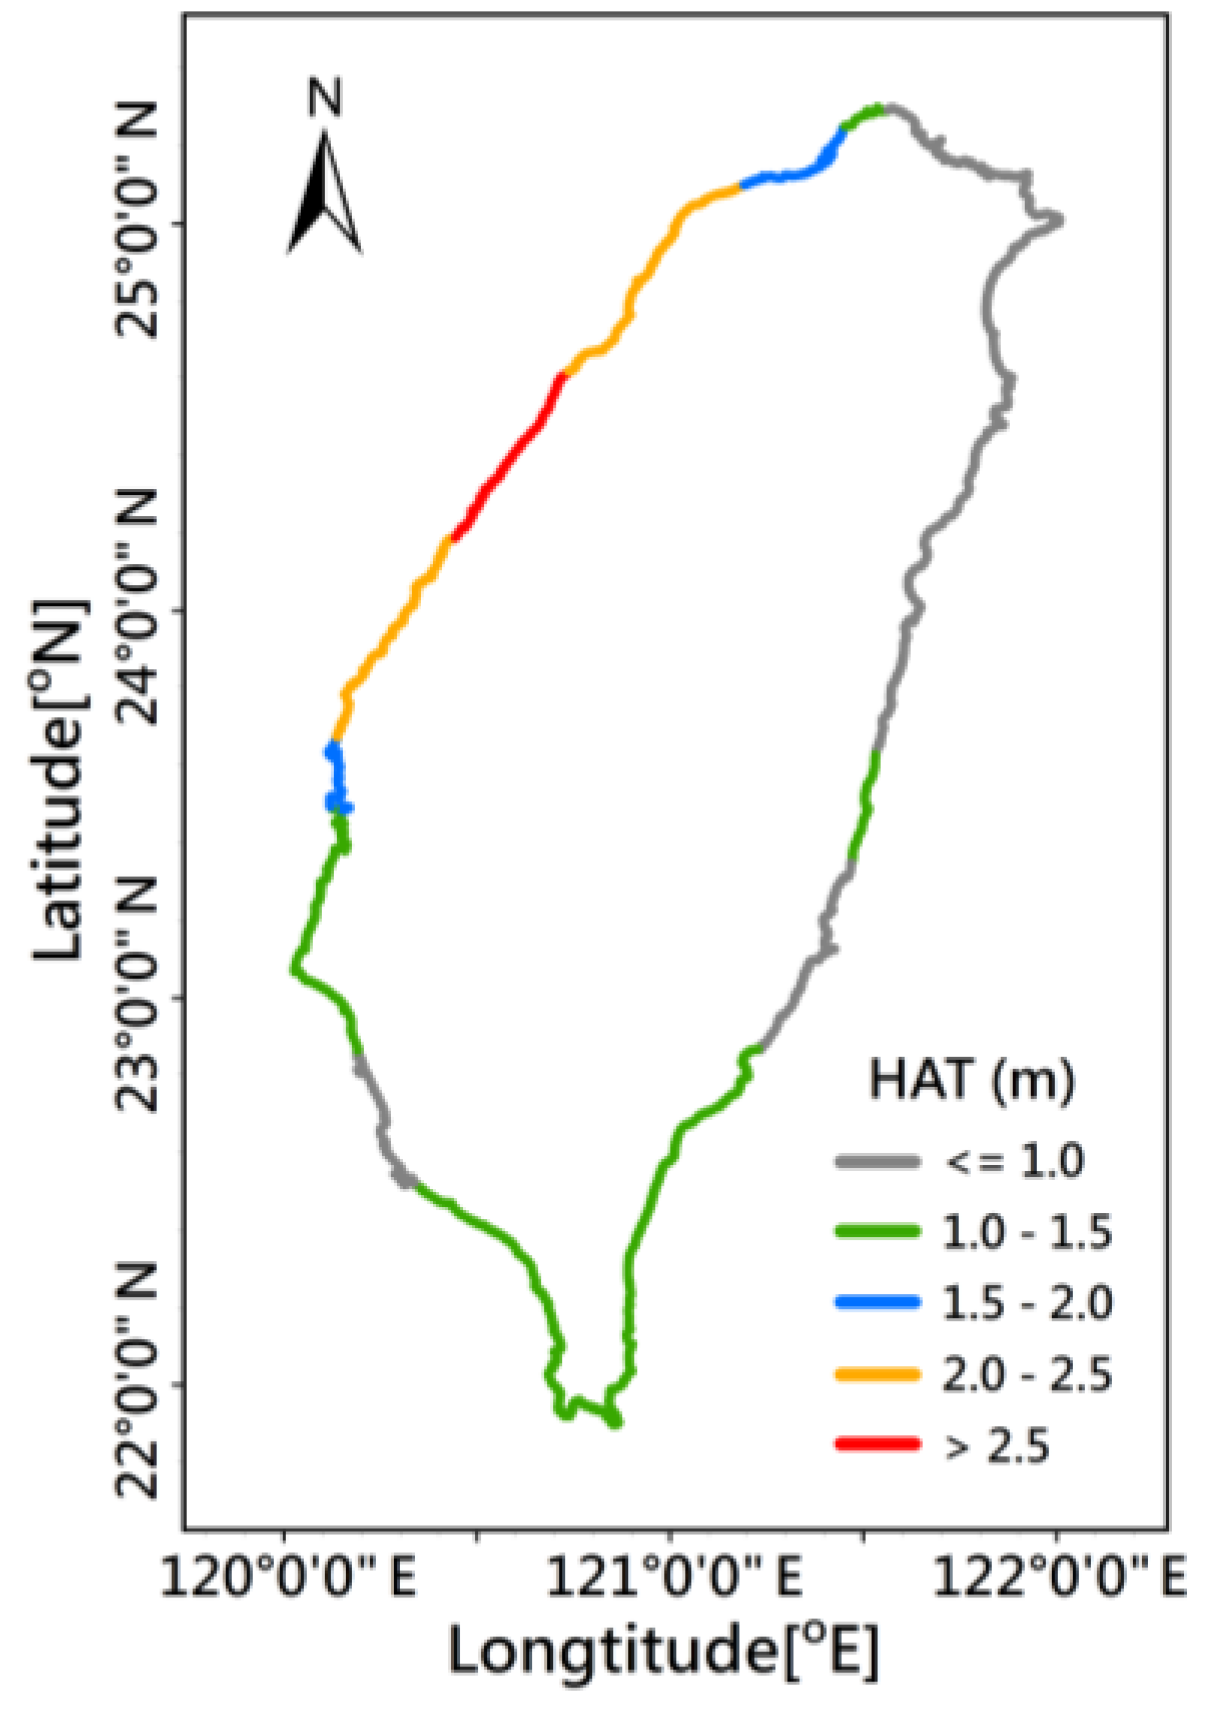
3.1. Characteristics of the Highest Astronomical Tides

The tidal characteristics vary from one site to another in the coastal areas and shallow continental shelves because the local tides are affected by the bathymetry and shoreline geometry [41]. Accordingly, a long-term measurement of the sea-surface elevation in the nearshore waters is valuable for planning coastal hazard prevention and mitigation. The HAT statistics are also helpful to identify locations where high water levels trends exist. A total of 28 tide-measuring stations have been deployed around Taiwanese waters. The statistical tide gauge observations from 28 stations based on TWVD2001 were used to estimate and analyze the characteristic of the HAT for the local high water levels. Figure 5 depicts that the maximal HAT, which exceeds 2.5 m, is located in the middle of the western coast and gradually decreases in both the southerly and northerly directions. The HATs lie between 1.0 and 1.5 m for the southern and southeastern coast, whereas the minimal HATs, less than or equal to 1.0 m, occupy most of the eastern and northeastern coast.

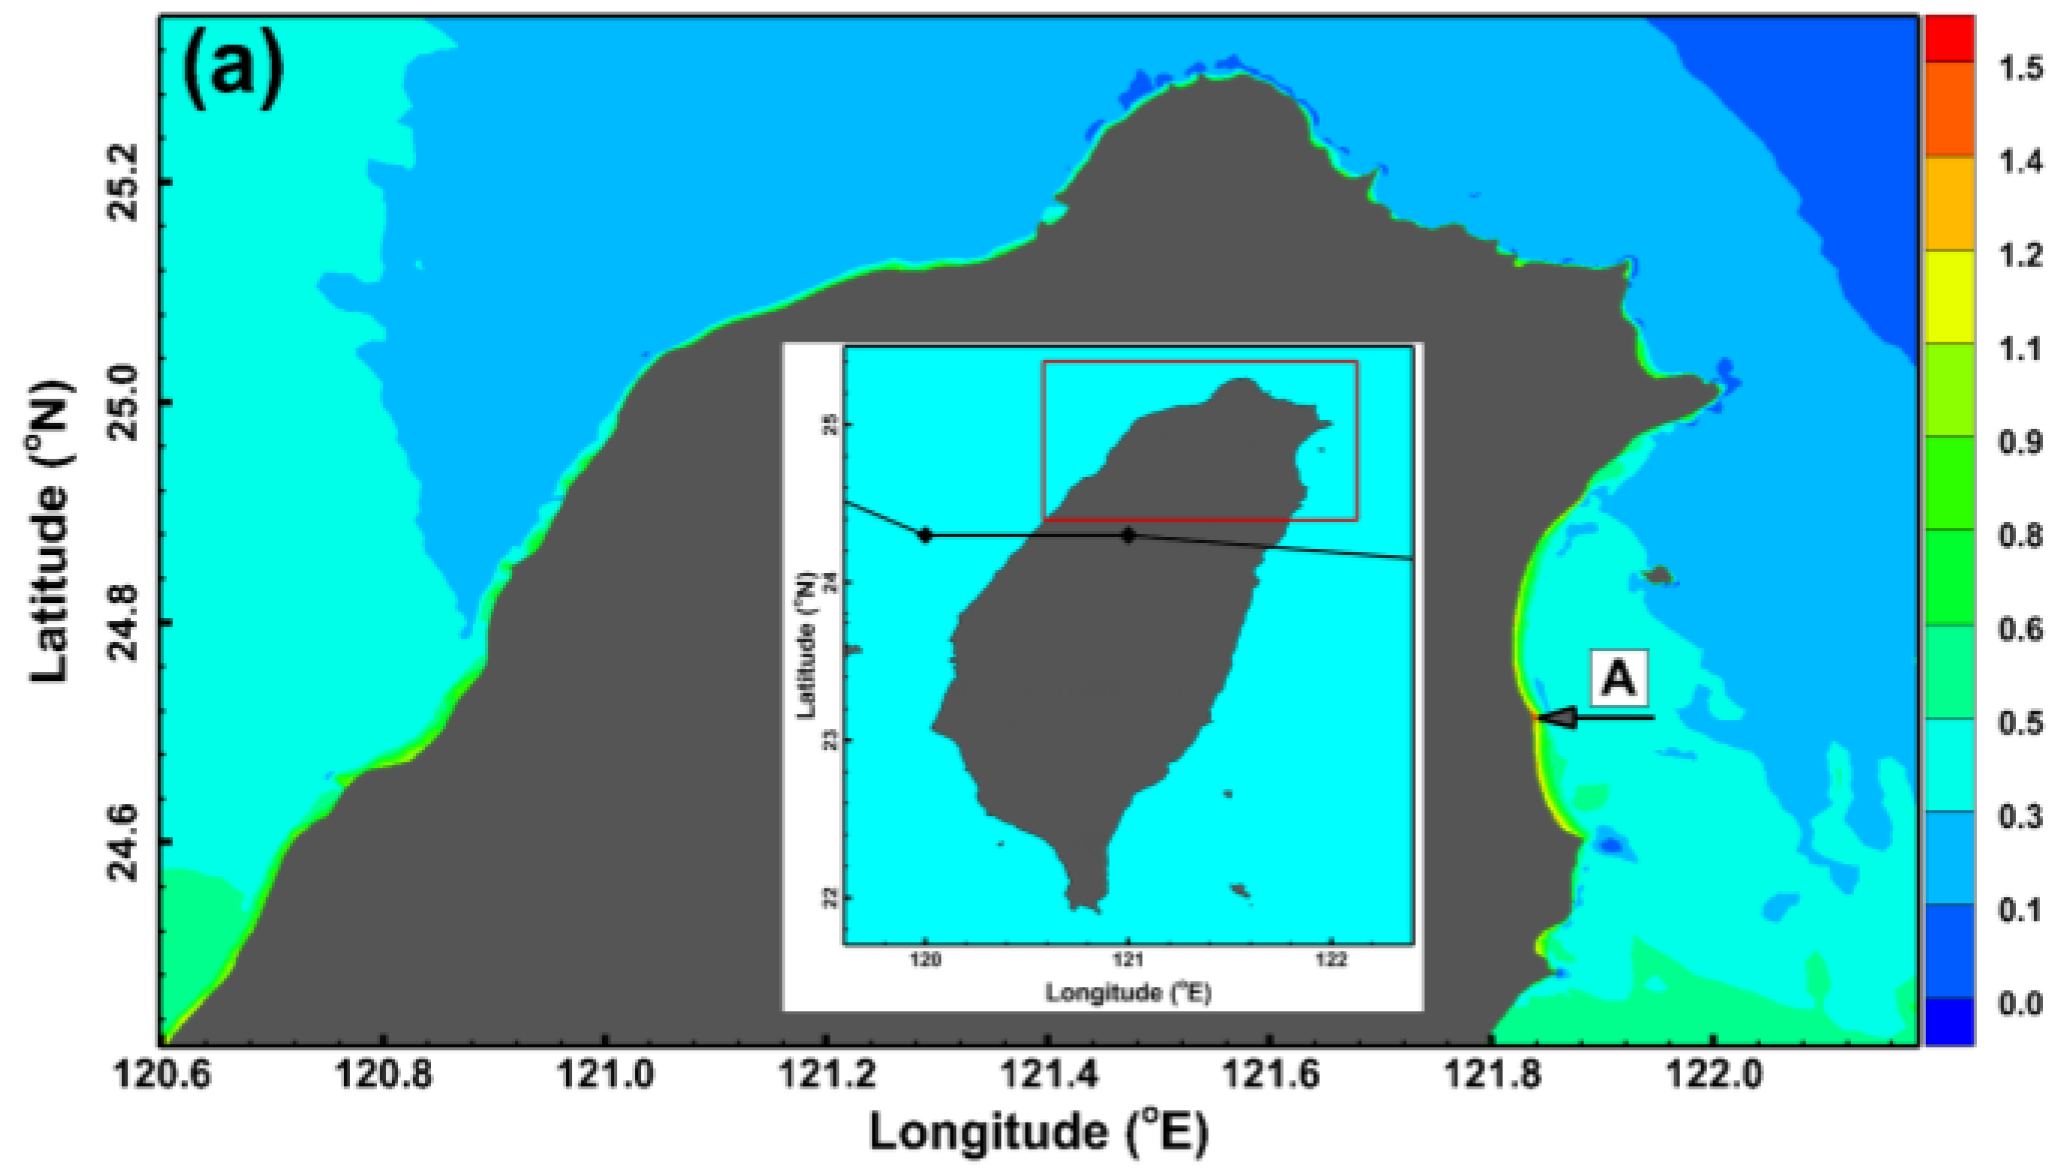
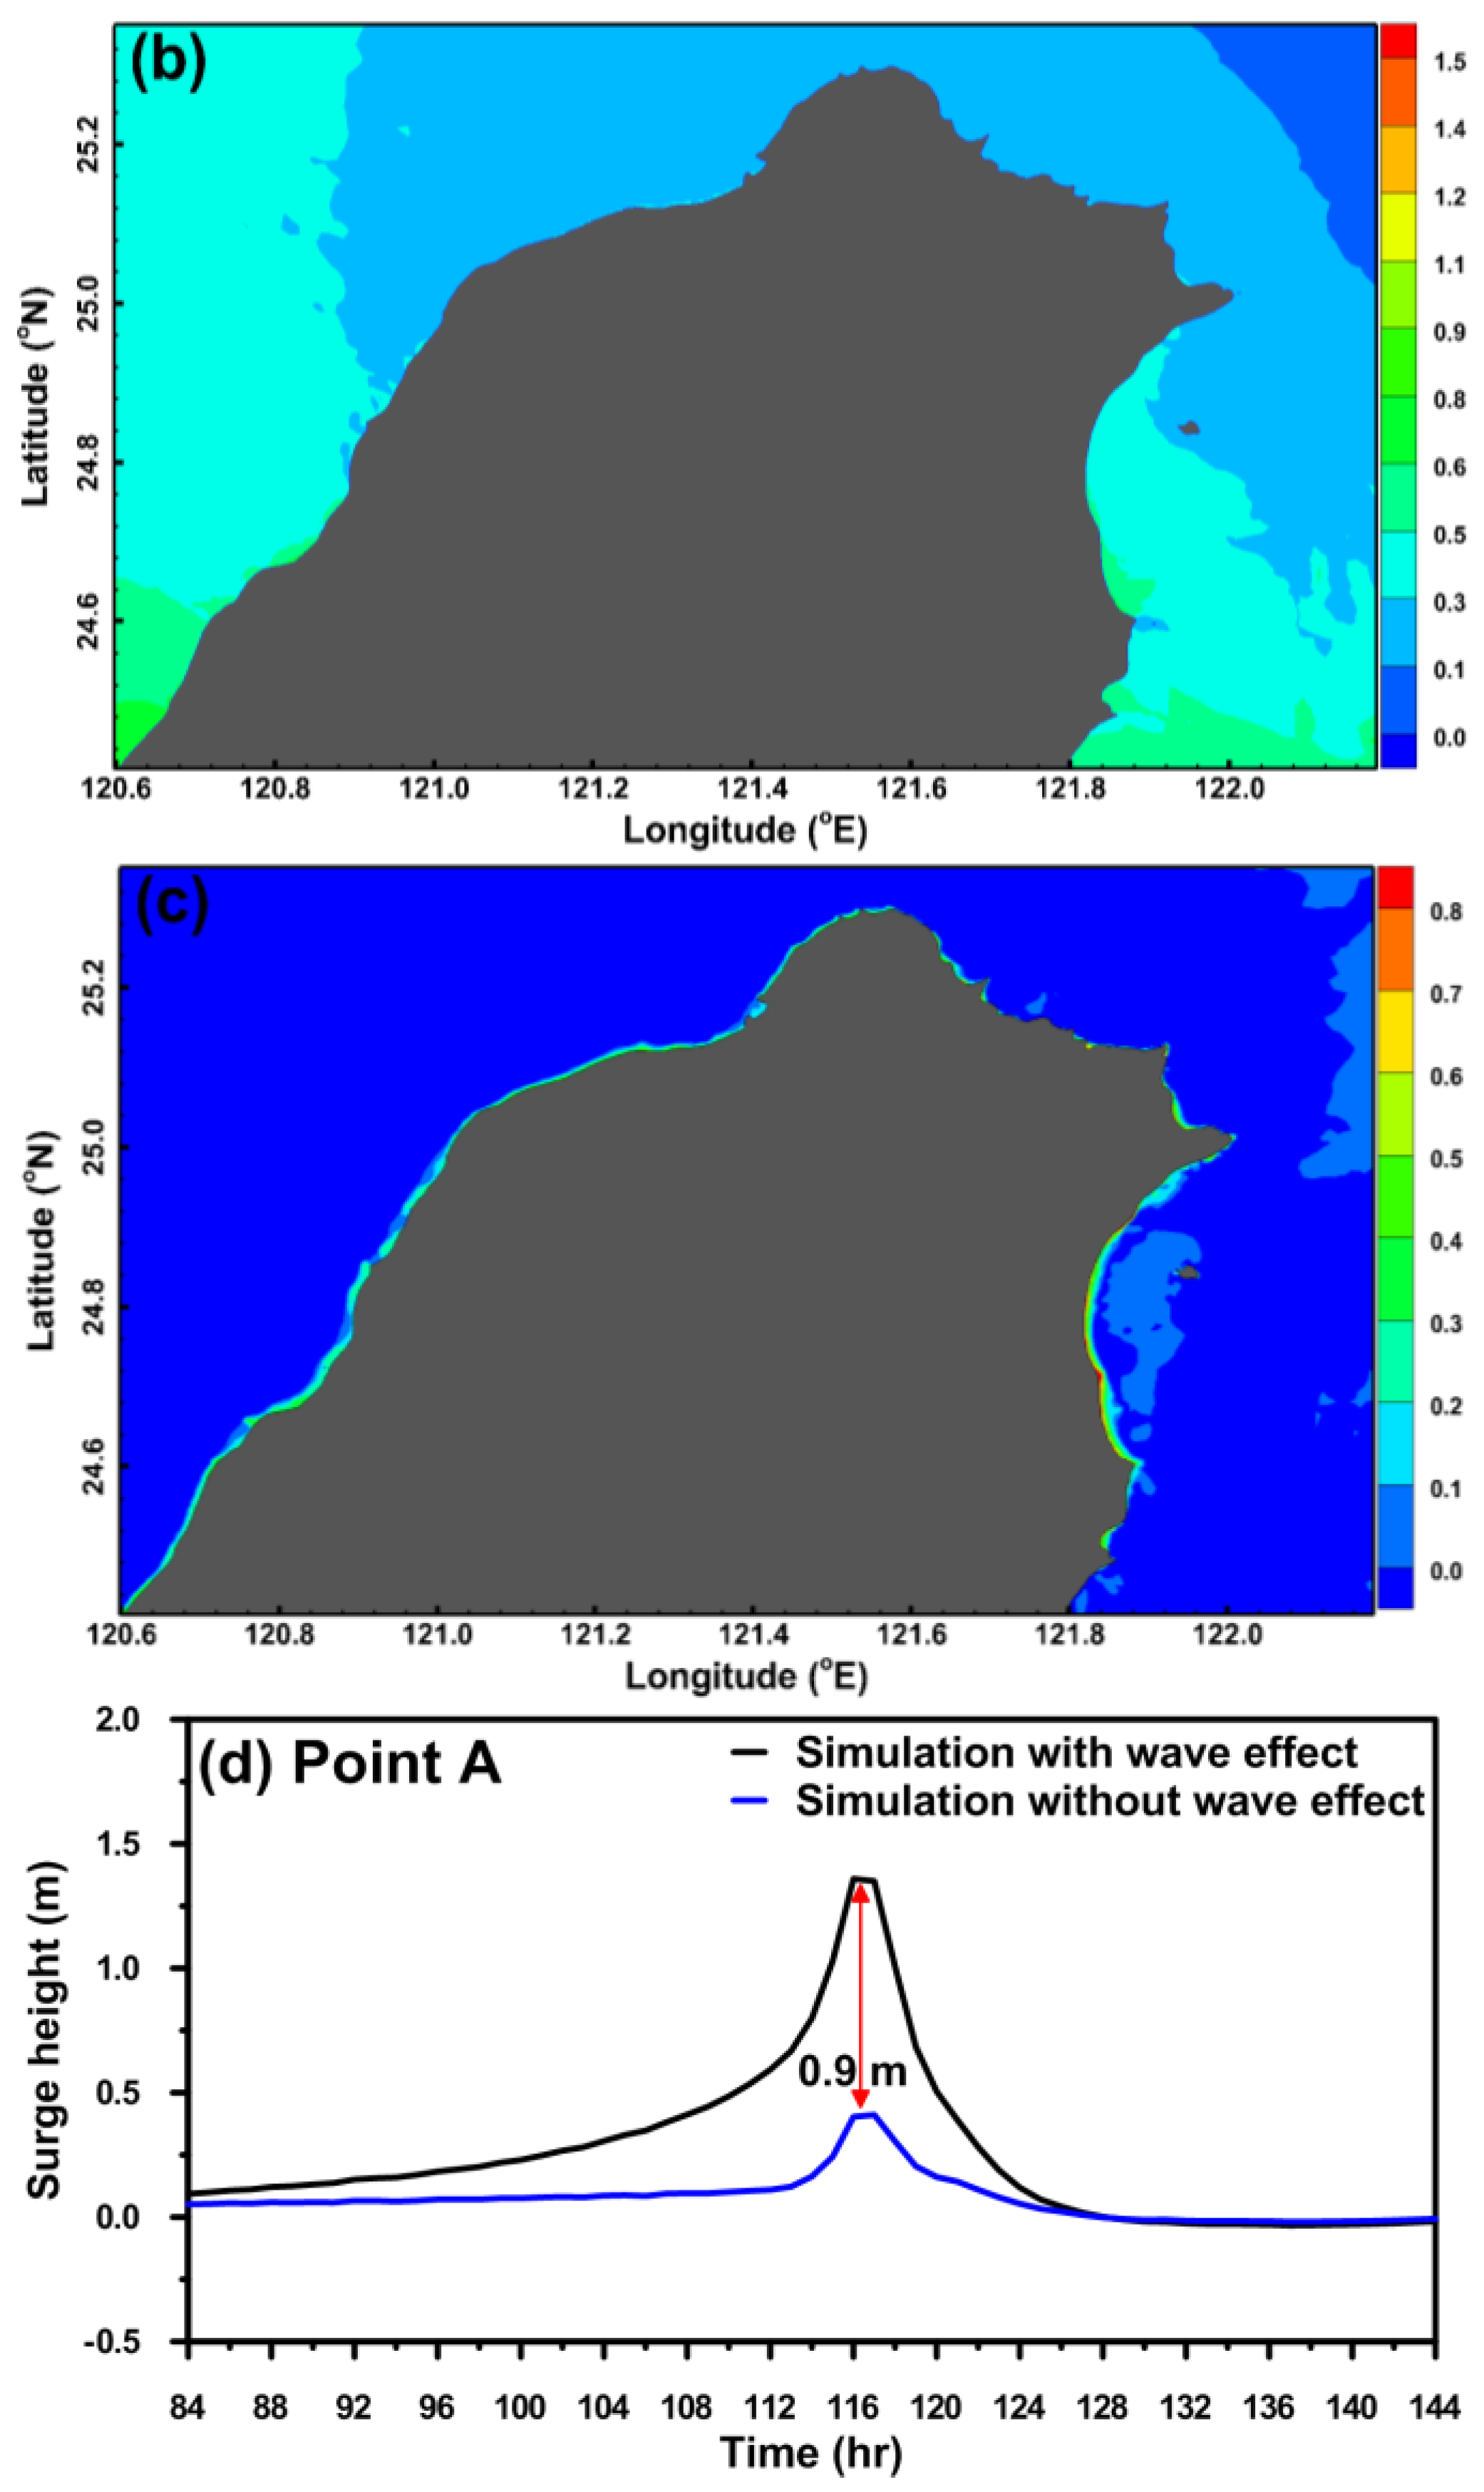
3.2. Importance of Waves to Storm Surge

Waves make the dominant contribution to the total surge in coastal areas with steep slopes, such as the eastern waters of Taiwan, but wave contributions could still be significant, even in shallow-gradient continental shelves, e.g., the Gulf Coast of the United States. For example, wave-induced surge, i.e., caused by a wave setup, reached up to 0.5–1.0 m along the northeastern coast of Taiwan during Typhoon Soudelor in 2015 [42]; however, waves added approximately 0.6–1.2 m to the surges in the coast of Louisiana, USA, during Hurricane Katrina in 2005 [43]. The storm surges were hindcasted using the coupled (SWAN + ADCIRC) and decoupled (ADCIRC only) models for Typhoon Dujuan in 2015 to quantify the wave setup contribution. Typhoon Dujuan was the second most intense tropical cyclone of the Northwest Pacific Ocean in 2015 and made landfall over Taiwan. The tracks of Typhoon Dujuan and its induced storm surge with and without a wave effect are shown in Figure 6. The storm surges ranged between 0.5 to 1.4 m along the northern coast of Taiwan when waves were considered (Figure 6a); however, they were reduced to 0.3–0.6 m if waves were absent (Figure 6b). The wave setups (the storm surge differences of the coupled minus decoupled model) of Typhoon Dujuan could exceed 50% compared with the storm surges from the decoupled model (Figure 6c). The comparison in the time series of the storm surge simulation at point A (the location can be found in Figure 6a) was delineated in Figure 6d. The maximum wave setup was quite considerable and approached 0.9 m. The results from Figure 6 manifest that the wave effect should not be excluded from storm surge hindcasting.

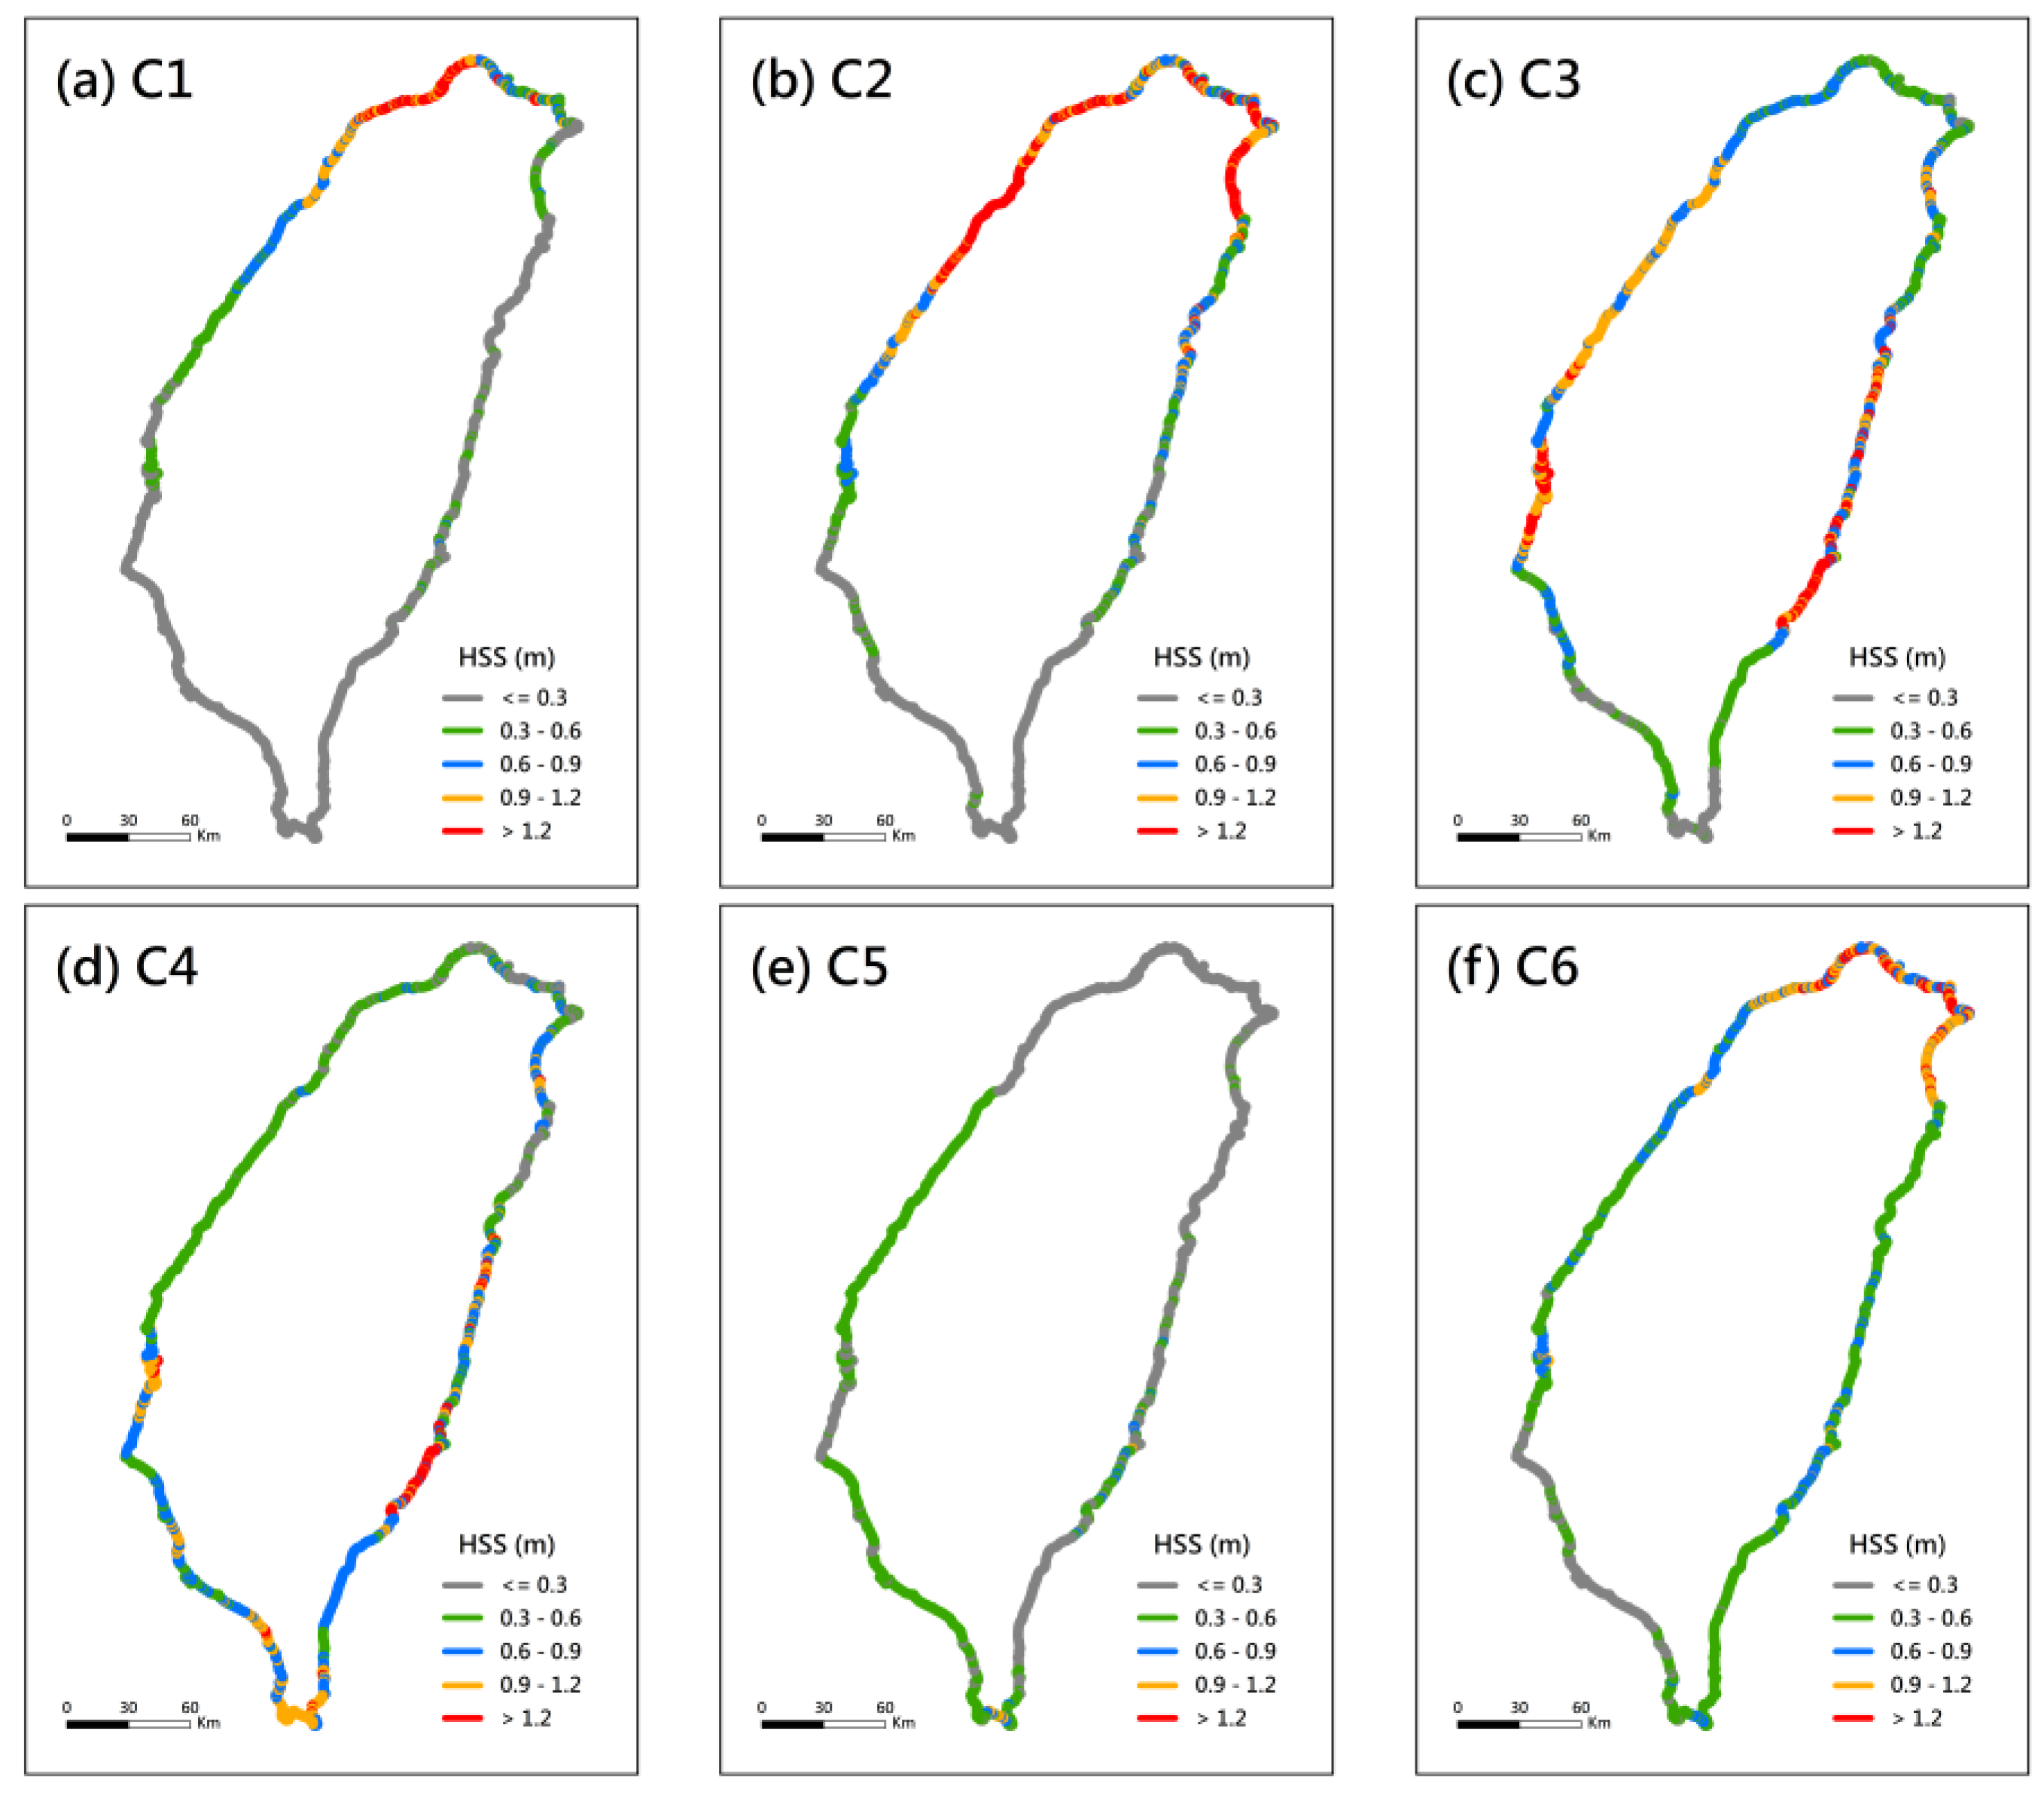
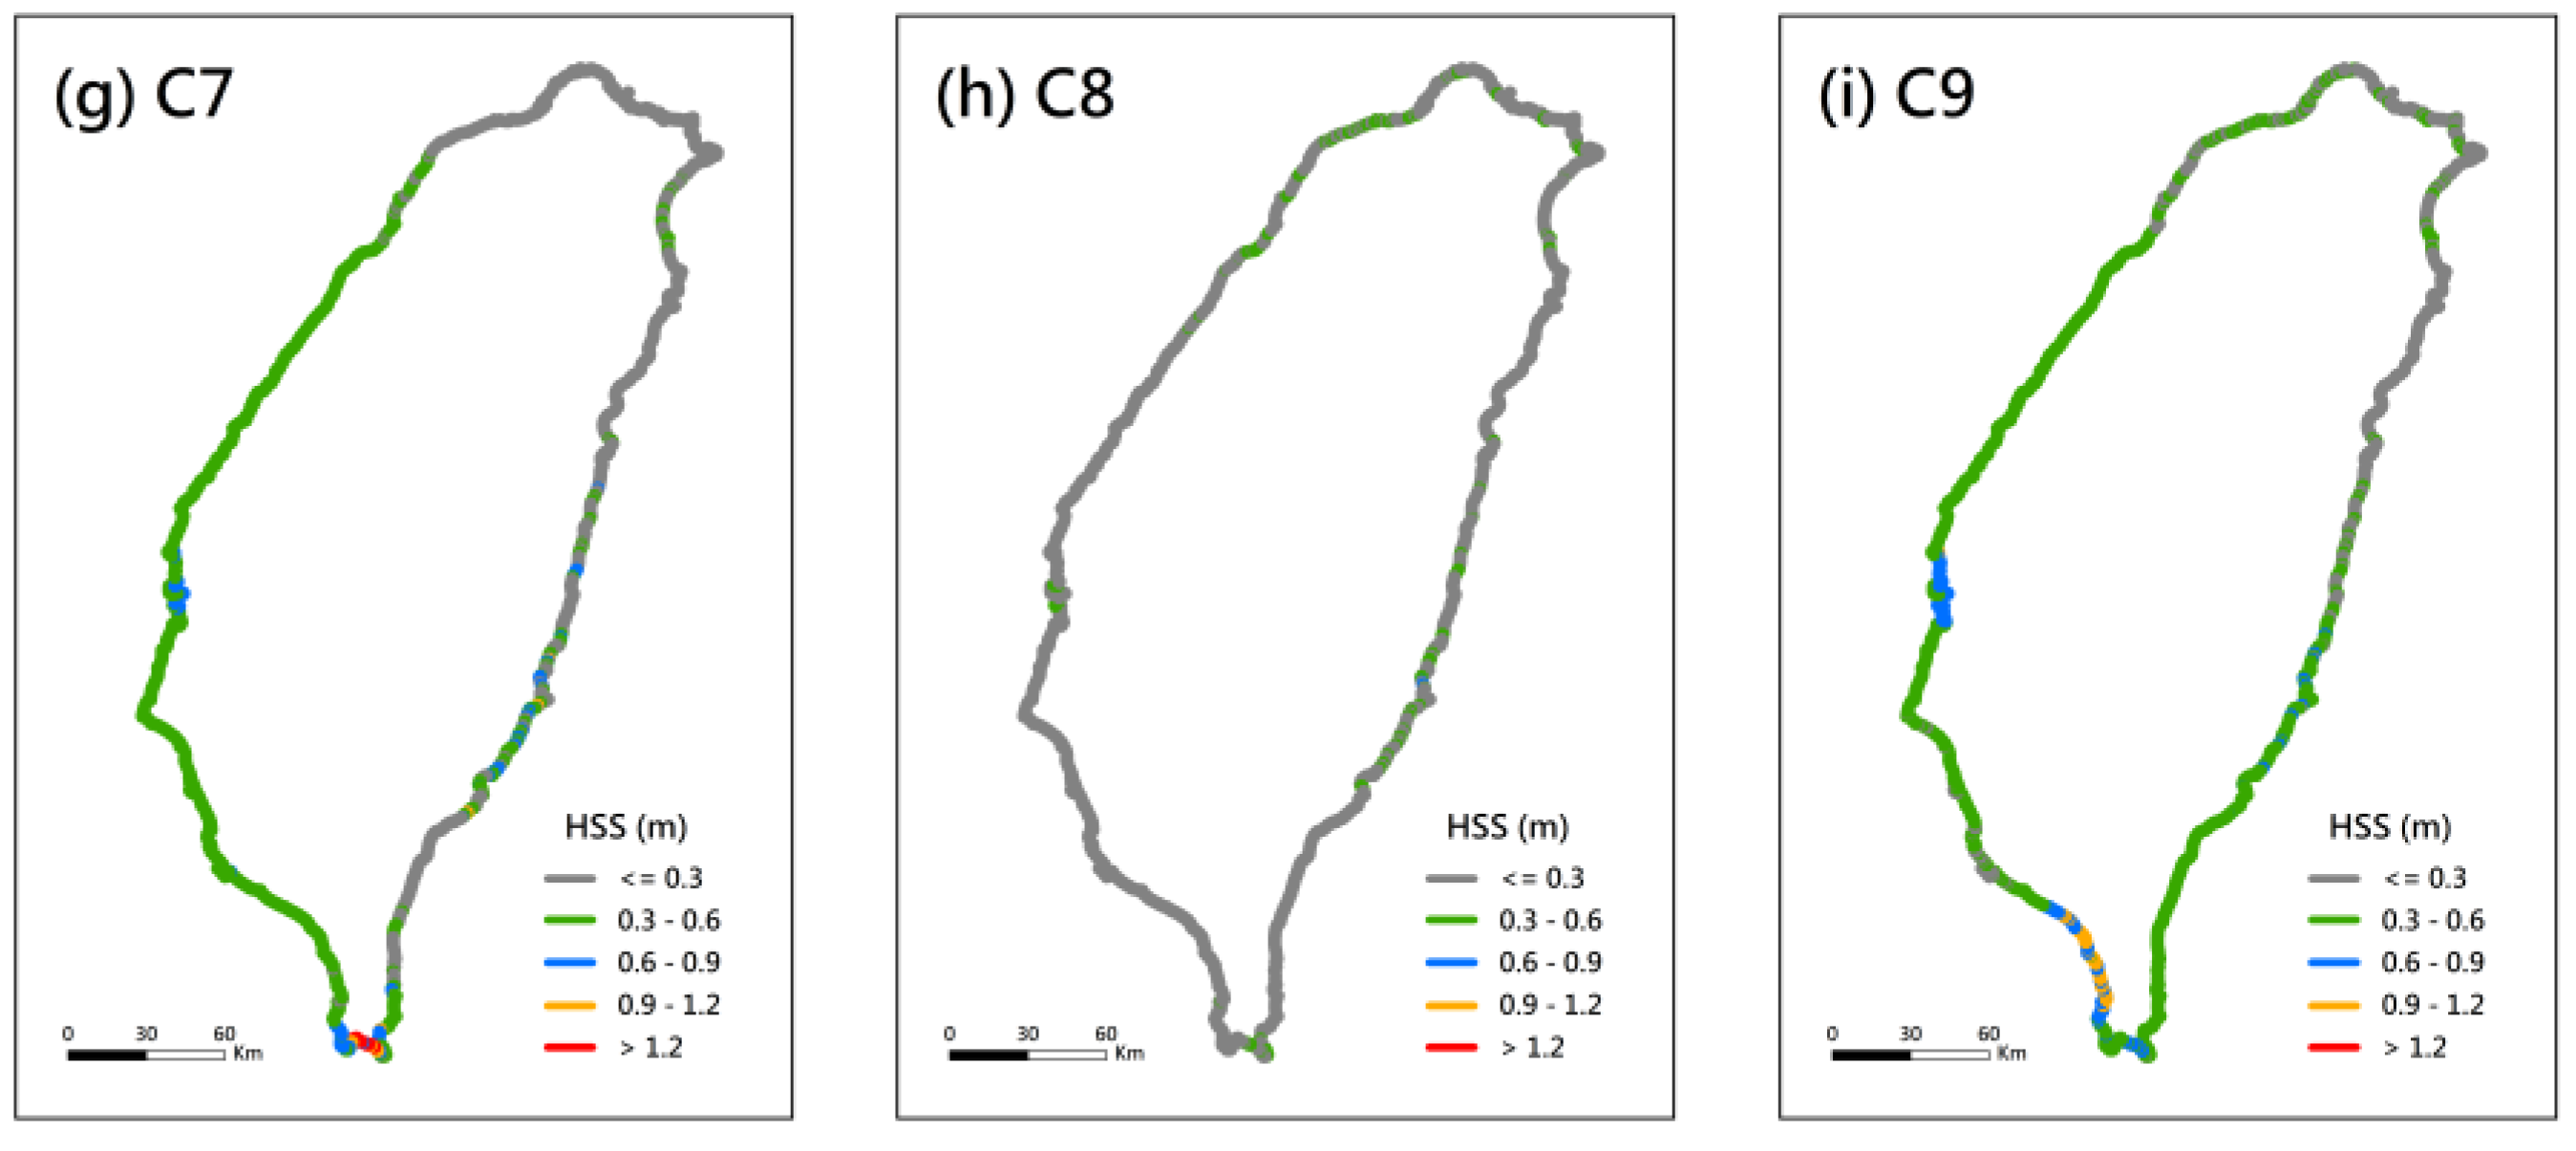
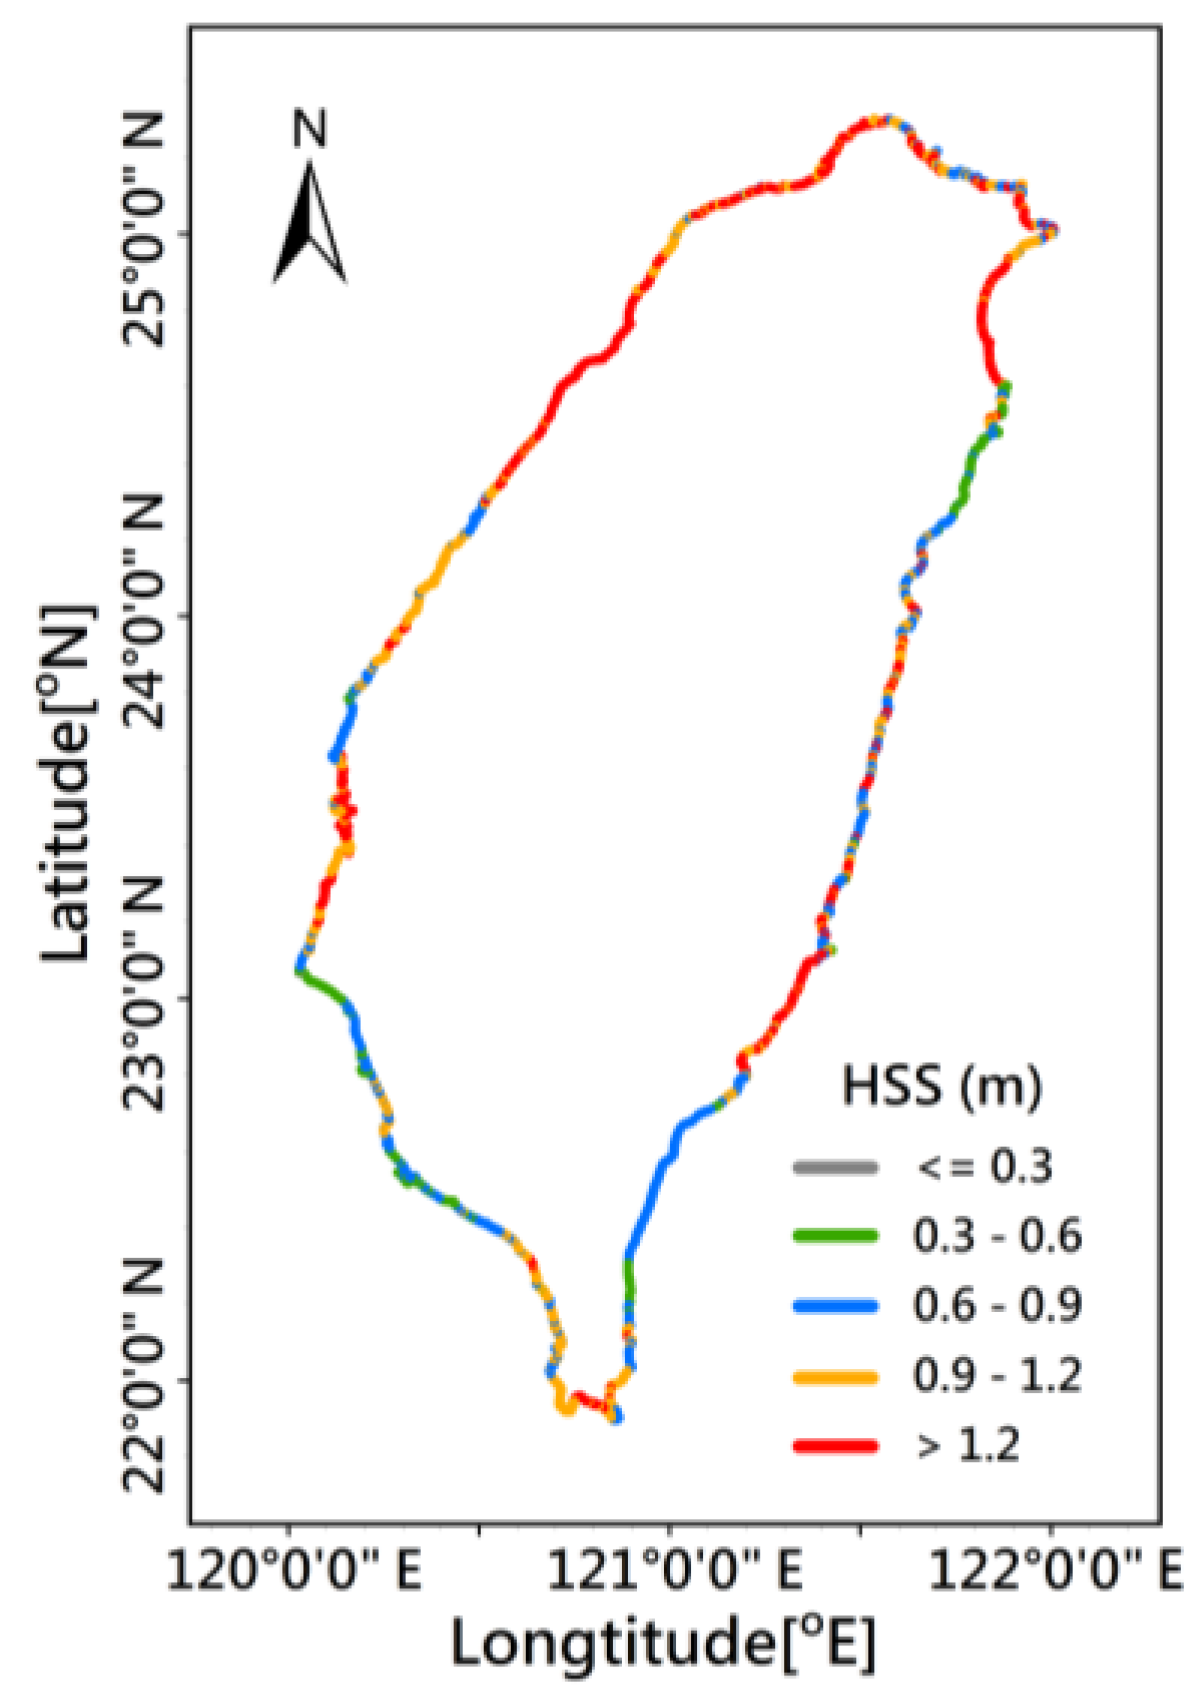
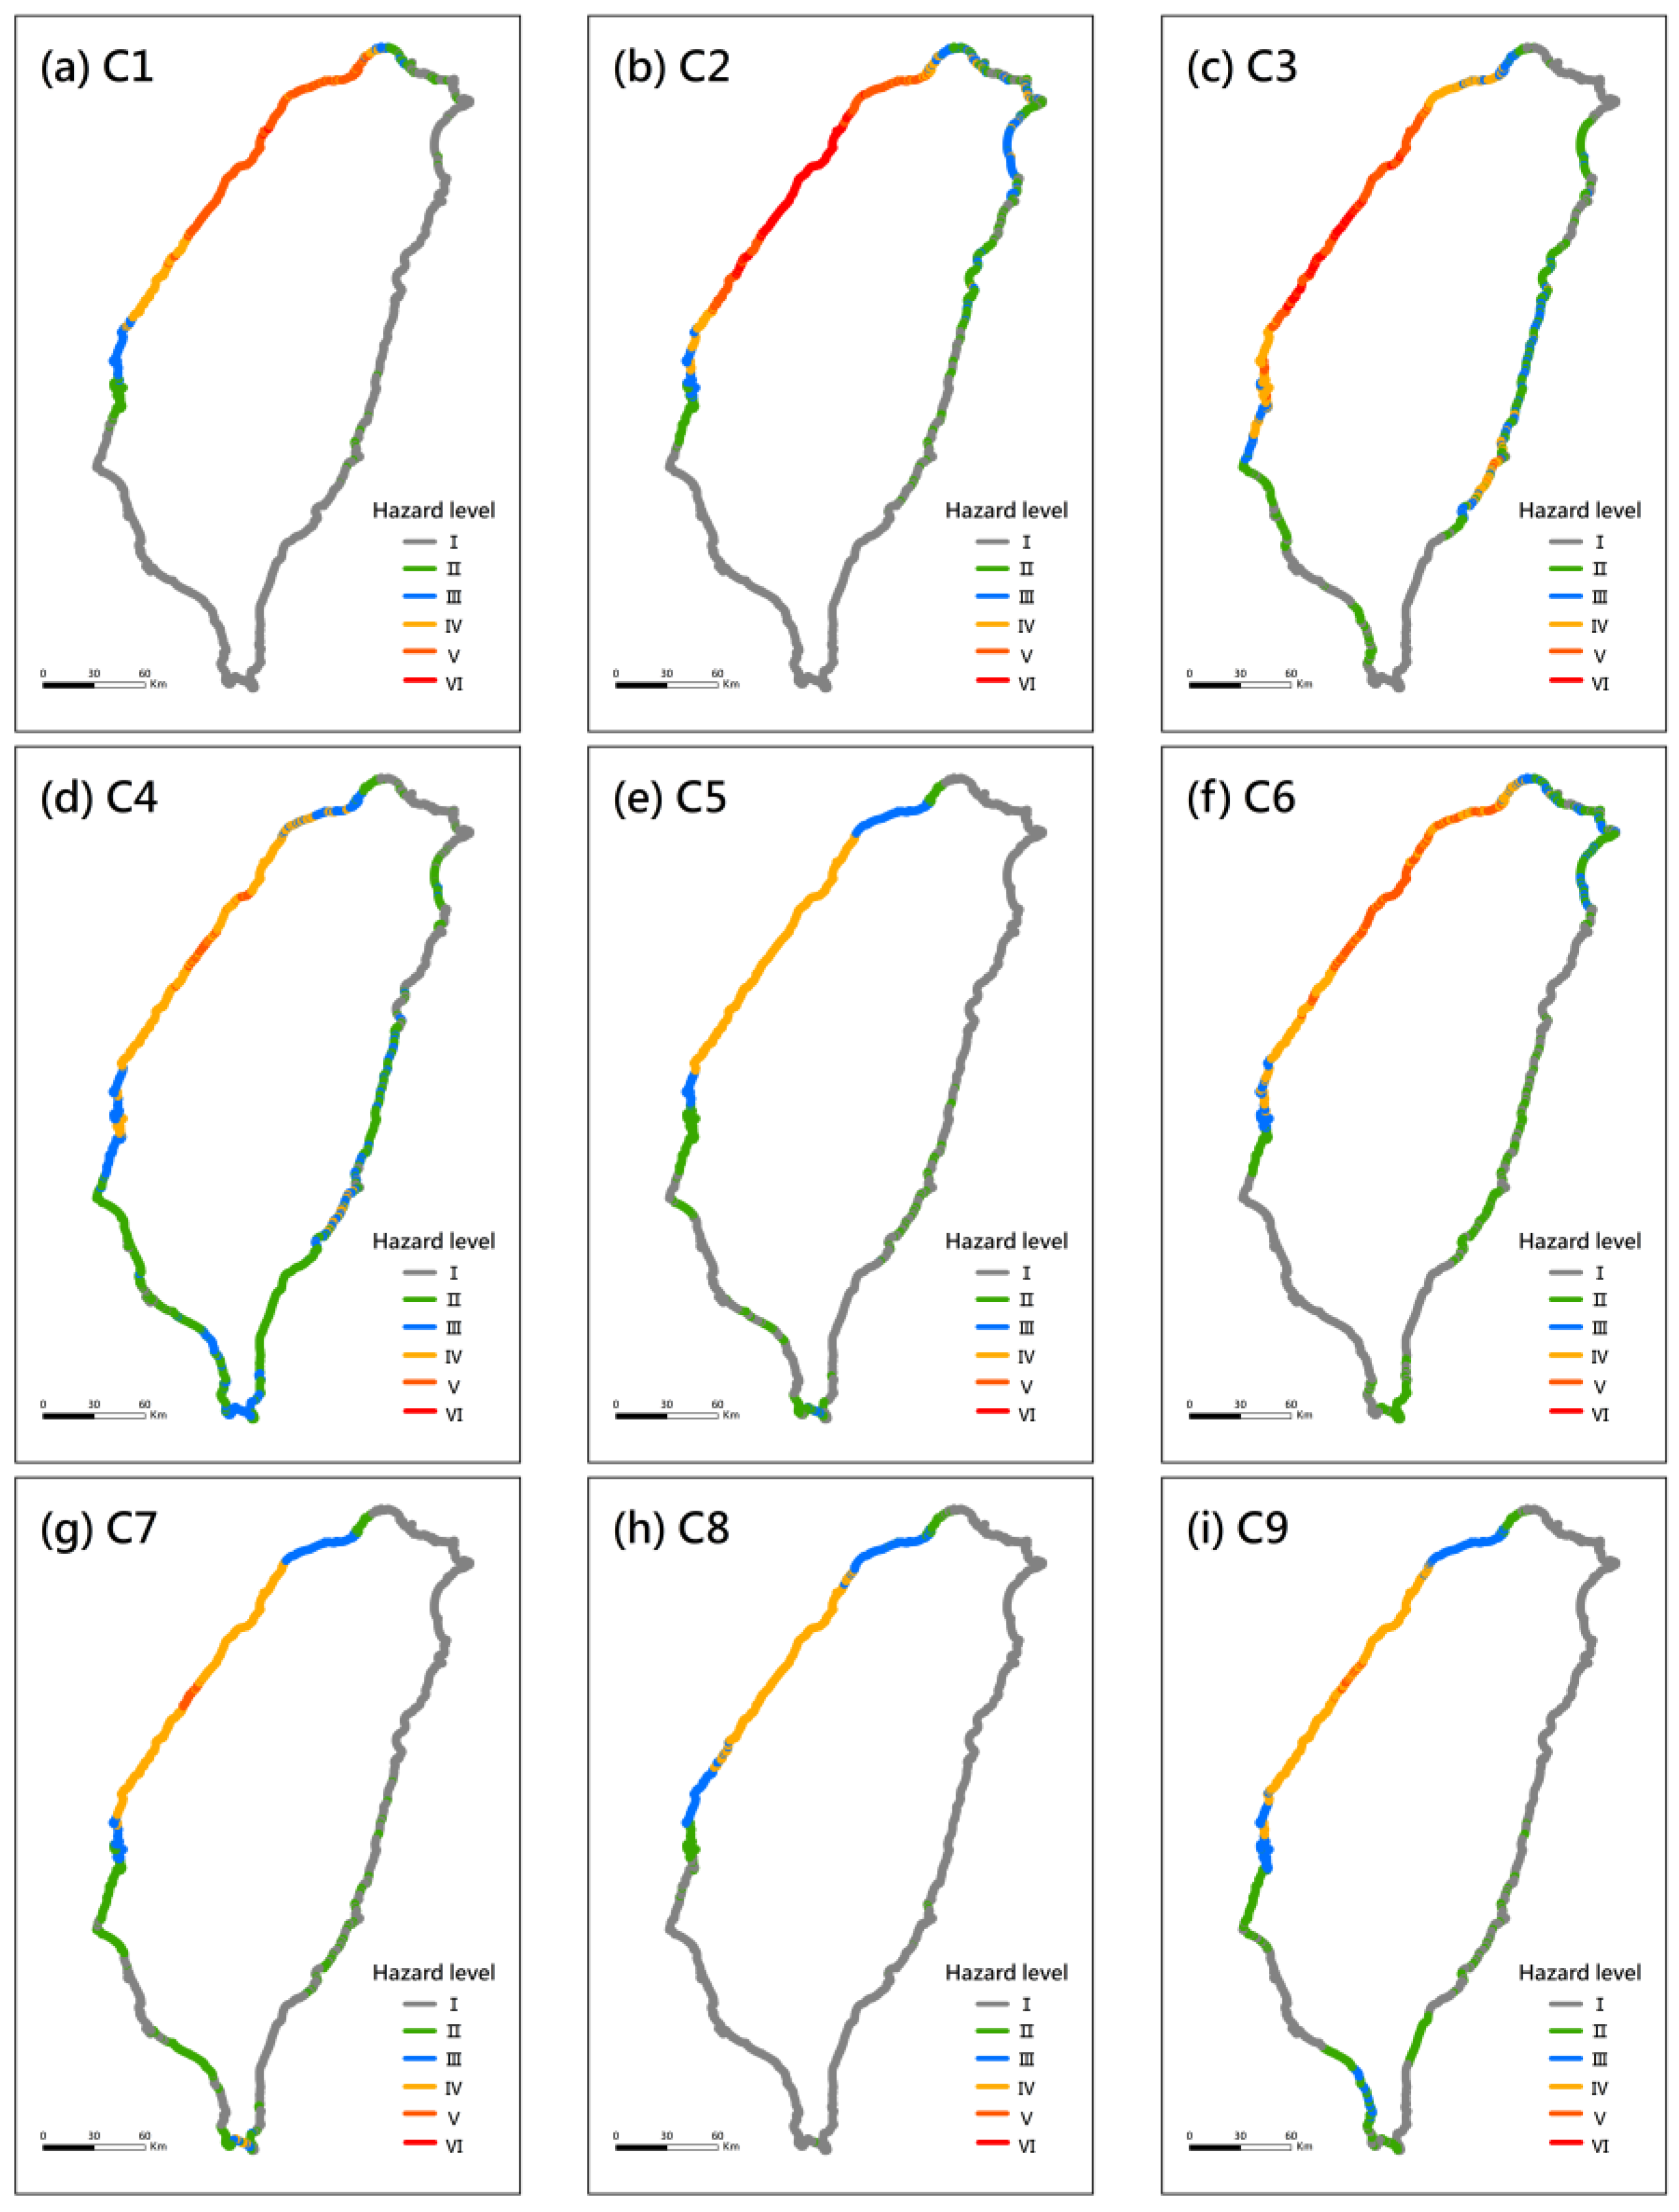
3.3. Distribution of the Highest Storm Surge

The storm surges of historical typhoon events for C1–C9 from 1979 to 2018 were hindcasted employing the coupled SWAN + ADCIRC (the wave effect was included) model and the hybrid typhoon wind model. As shown in Figure 2, C3 is the most frequent typhoon category (22 occurrences); the second is C6 (21 occurrences), and the next are C5 (17 occurrences) and C2 (15 occurrences). C1 has the same number of typhoons as C9 (13 occurrences). There are 12 and 5 occurrences for C4 and C7, respectively, and C8 is the least frequent typhoon event, with only 4 occurrences during the past 40 years. Even though Chang et al. [37] described all the details of the coupled SWAN + ADCIRC performance for the surrounding waters of Taiwan, a model-data comparison for the sea-surface elevation at four tide-measuring stations during typhoon events in 2016 were demonstrated in Figure 7a–d. The coupled model faithfully captured the typhoon-induced storm tides, especially at the Houbihu (Figure 7d) for Typhoon Meranti. Figure 7 also indicates that SWAN + ADCIRC are reliable and can be further applied for storm surge hindcasting.
The highest storm surge (HSS) was extracted from each typhoon event. Figure 8a–i illustrates the HSS distributions for C1–C9. The magnitude and distribution of HSSs are highly dependent on the typhoon’s track and intensity, as well as the local bathymetry. HSSs above 1.2 m are observed in C1 (Figure 8a), C2 (Figure 8b), C3 (Figure 8c), C4 (Figure 8d), C6 (Figure 8f) and C7 (Figure 8g), and the HSSs driven by C5 (Figure 8e), C8 (Figure 8h) and C9 (Figure 8i) are relatively weaker at only 0.3–0.9 m. The HSSs among C1–C9 were extracted, and a comprehensive HSS distribution map of the nine categories was produced (Figure 9). In general, a fraction of the eastern coast, as well as the southeastern and southwestern coast, had an HSS range of 0.3–0.9 m. The northern, northeastern, northwestern and part of the eastern coast are obviously occupied by HSSs of 0.9–1.2 m or HSSs higher than 1.2 m.

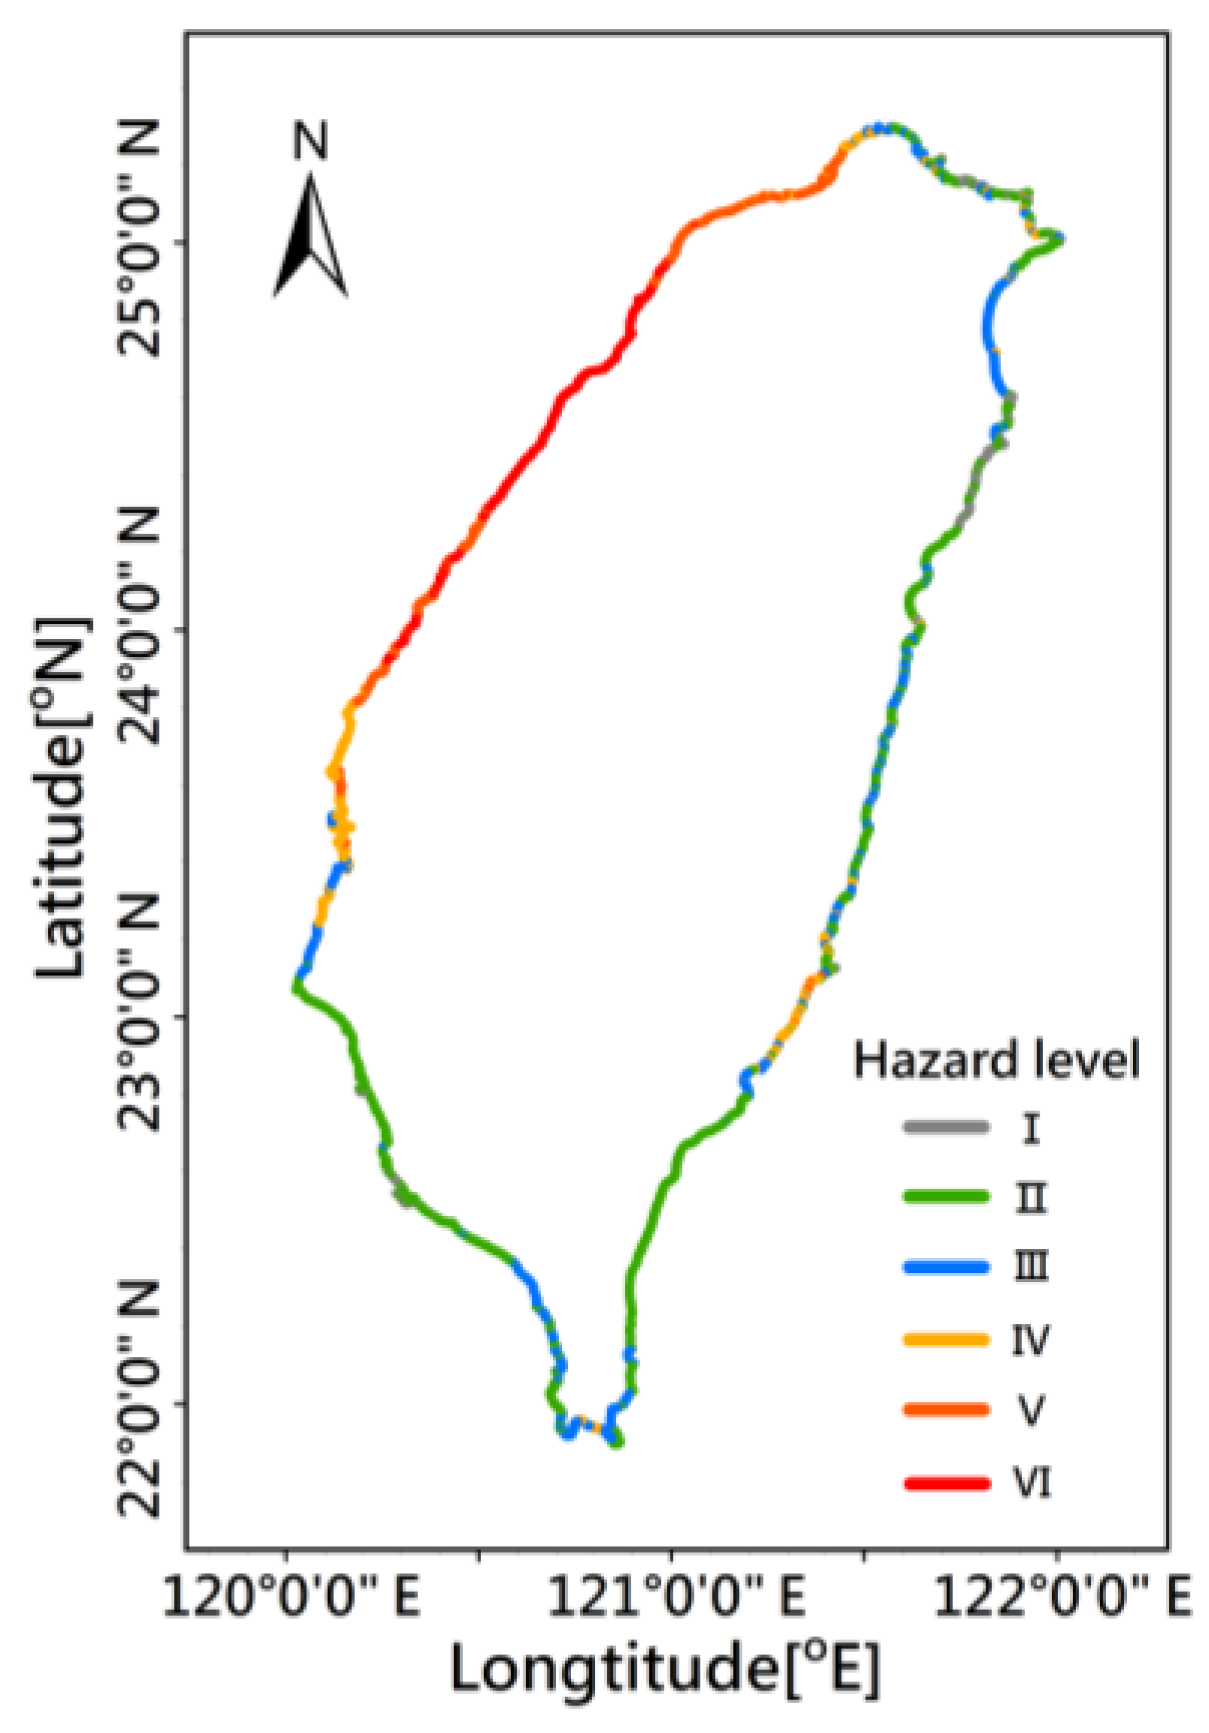
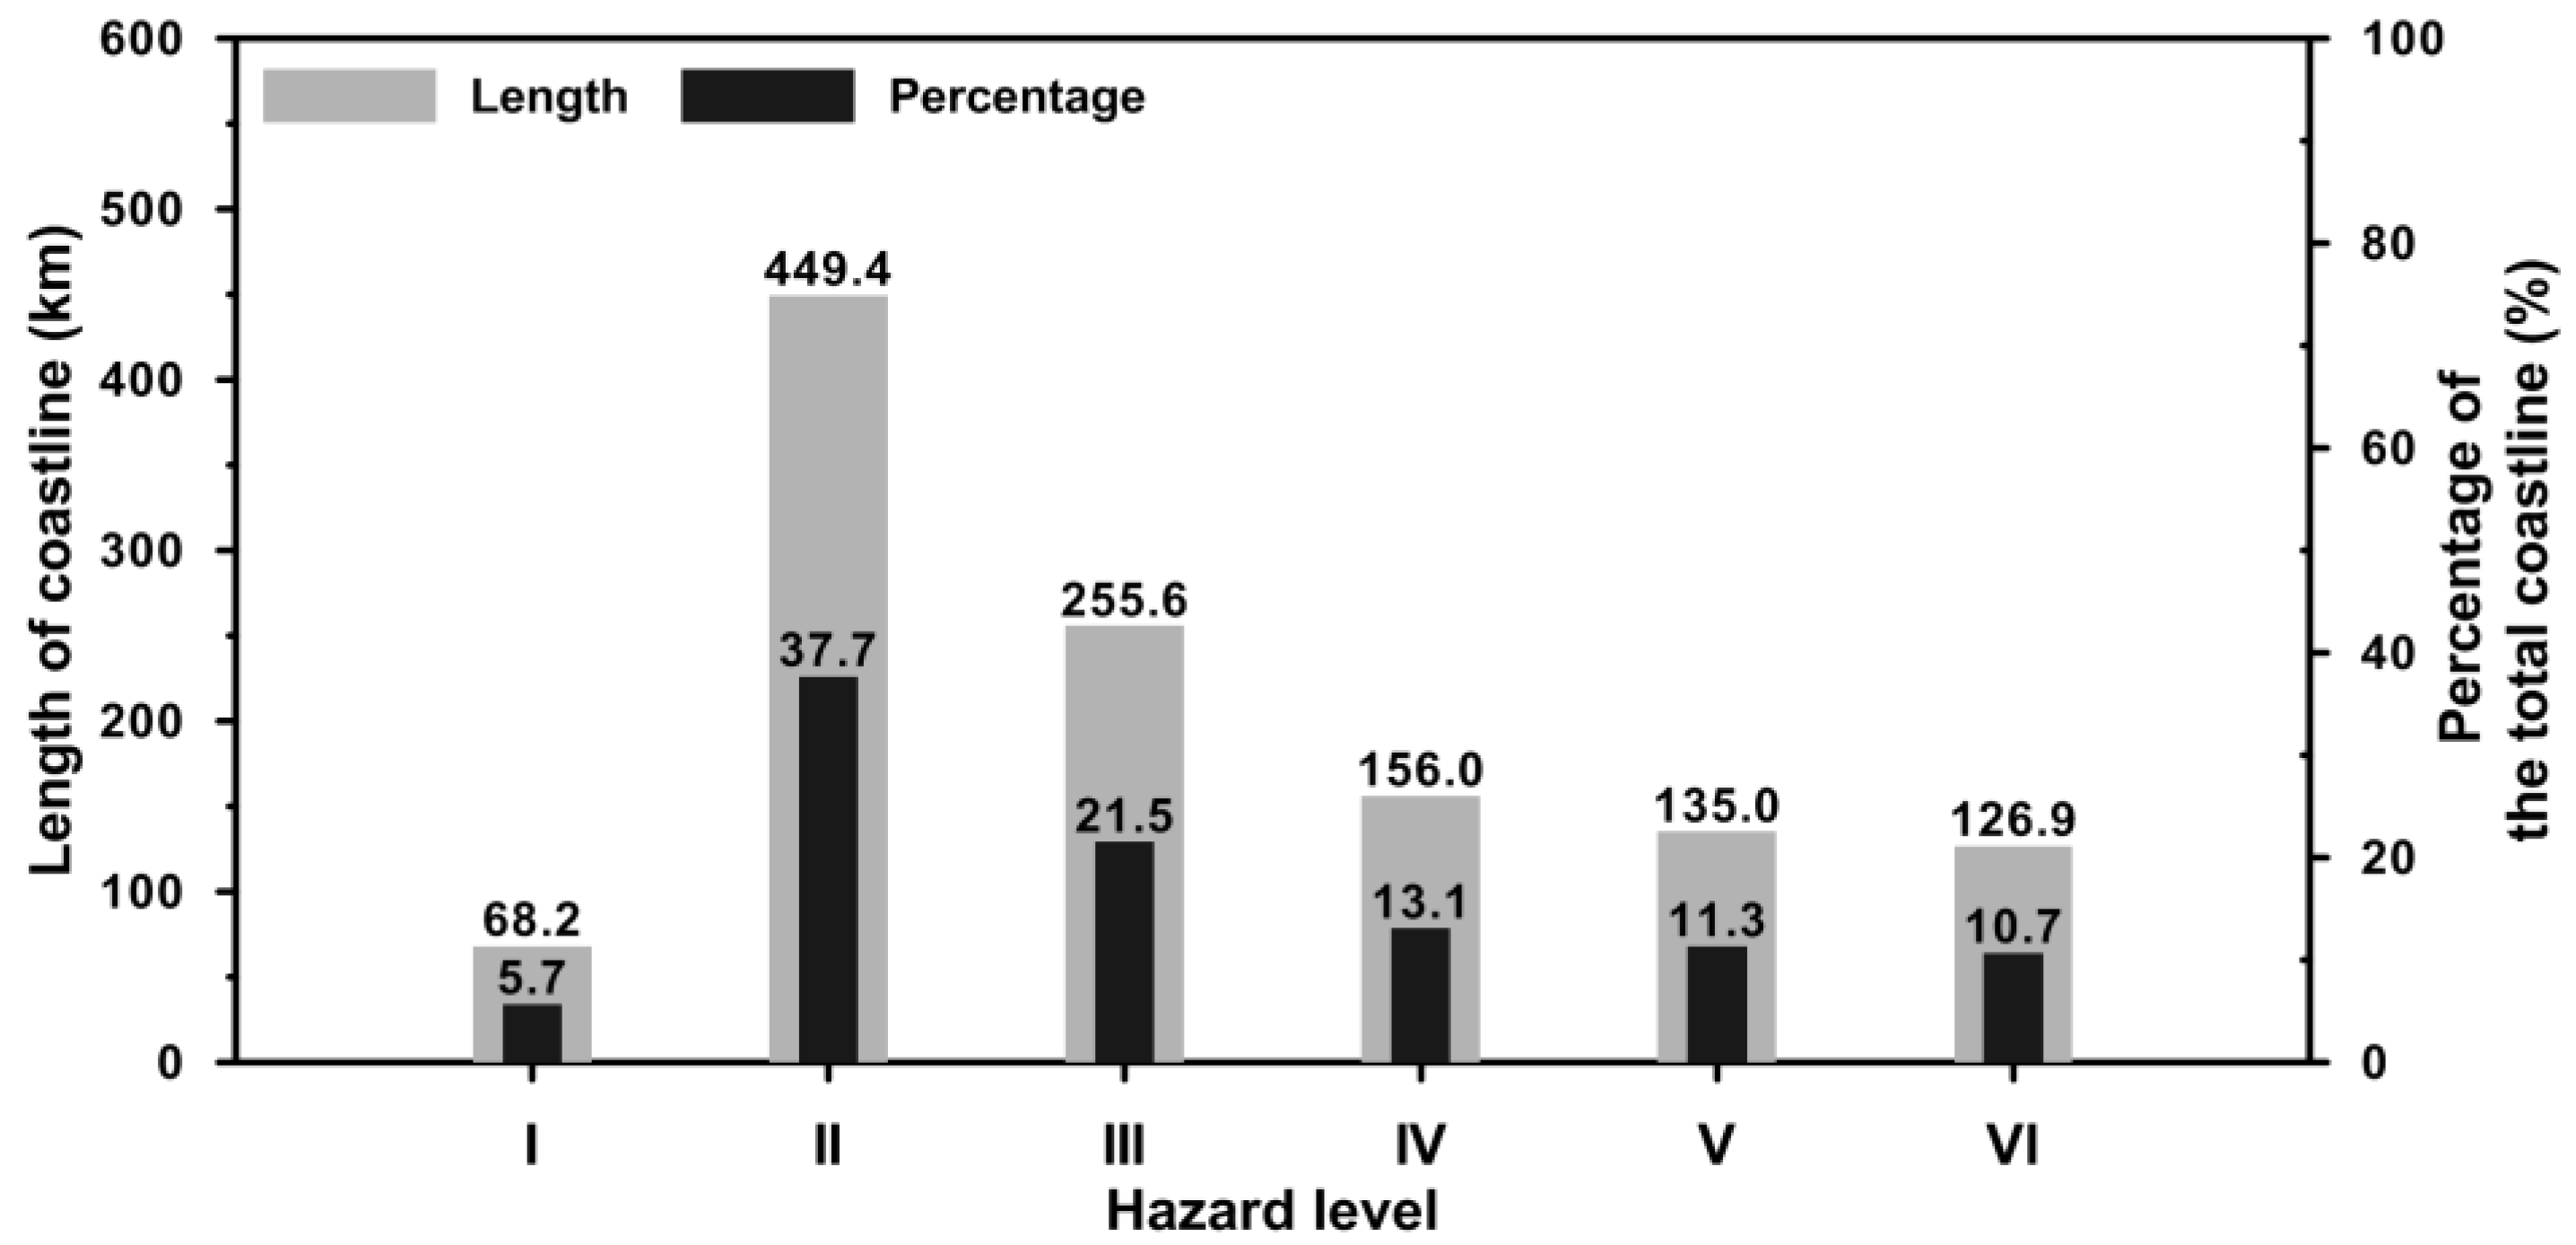
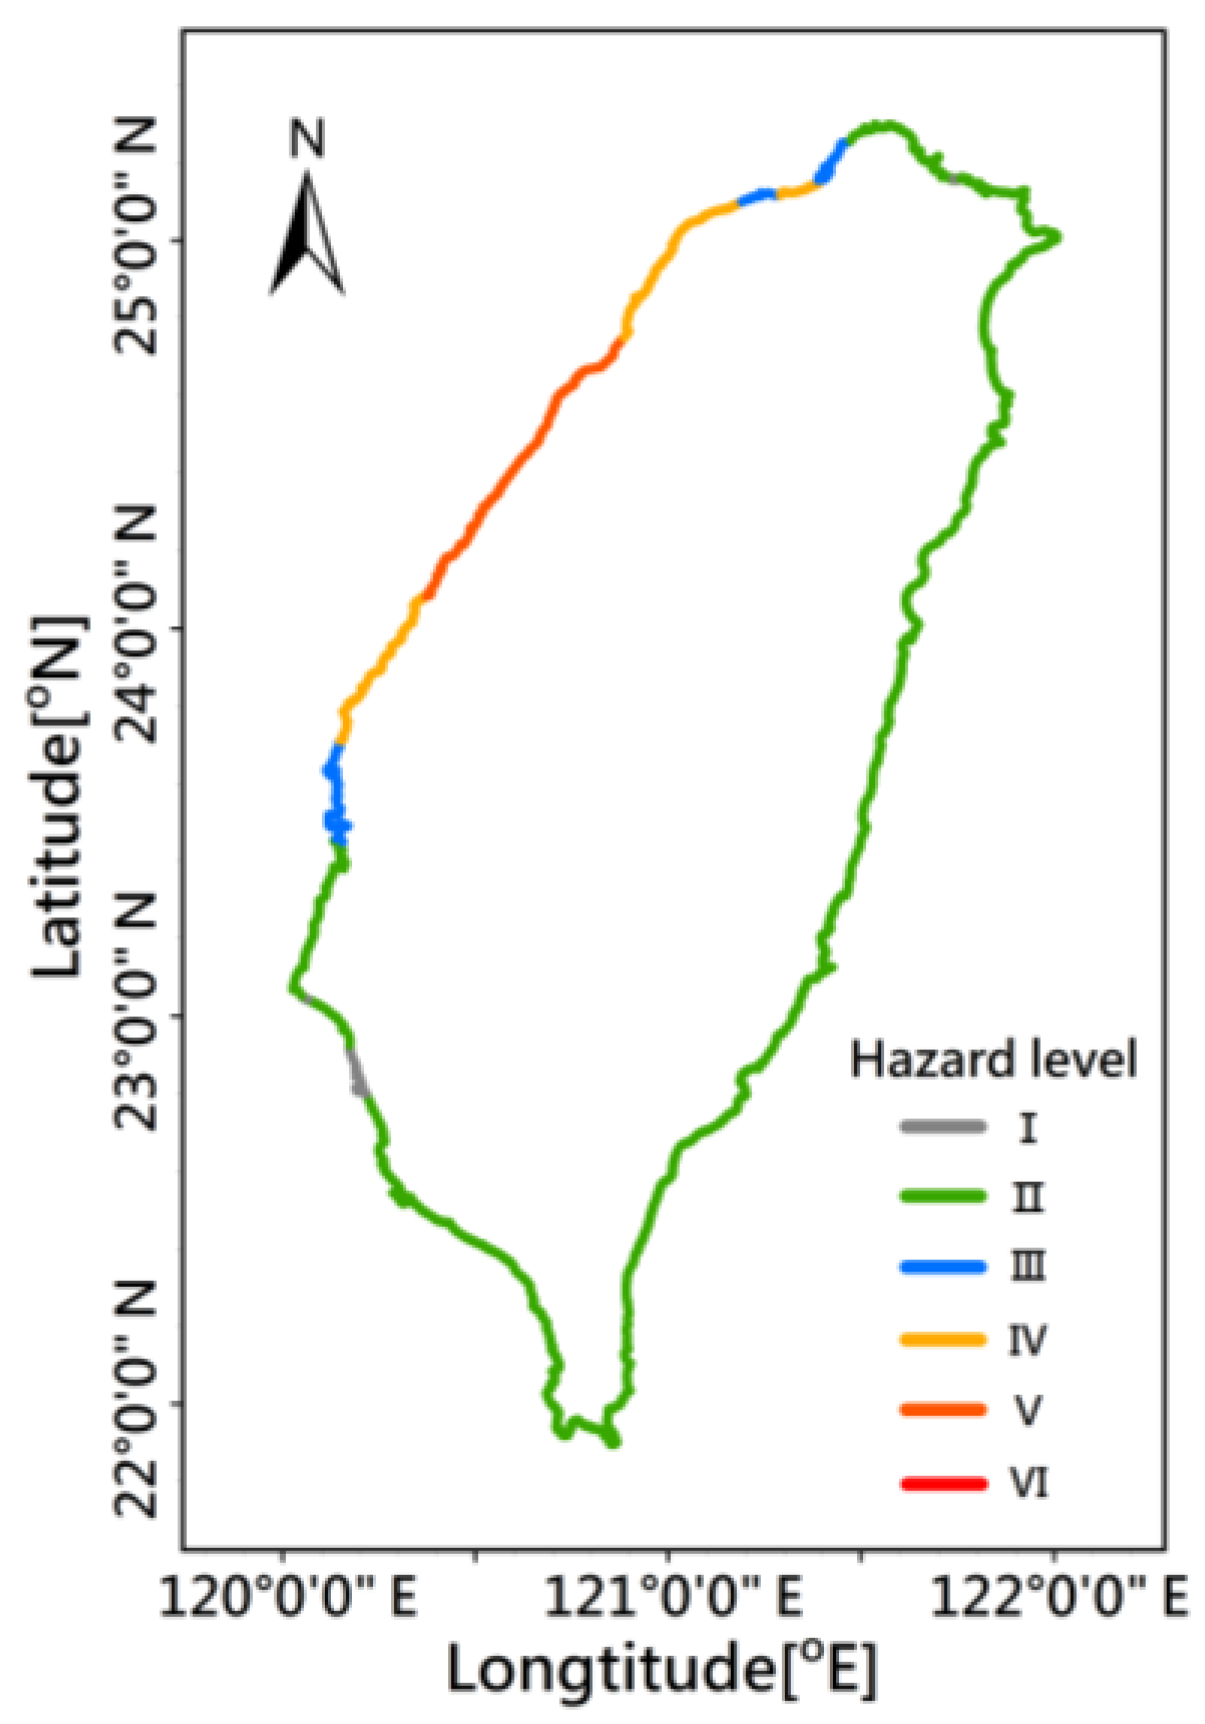
3.4. Assessment of Potential Highest Storm Tide Hazard

The HATs based on the TWVD2001 vertical datum (Figure 5) were superposed on the HSSs of each typhoon category (Figure 8a–i) to assess the potential highest storm tide (HST) hazard and to generate the potential HST hazard maps for the coast of Taiwan. Figure 10a–i illustrates the individual potential HAT hazard maps for C1–C9 (Figure 10a for C1, Figure 10b for C2, Figure 10c for C3, Figure 10d for C4, Figure 10e for C5, Figure 10f for C6, Figure 10g for C7, Figure 10h for C8, and Figure 10i for C9). Each of the potential HST hazard maps was classified into six hazard levels (I to VI). Gray, green, blue, yellow, orange and red colors represent the hazard level I, hazard level II, hazard level III, hazard level IV, hazard level V and hazard level VI, respectively. A hazard is regarded as level I if it has a potential HST under or equal to 1.5 m; the potential HST that lies between 1.5–2.0 m is considered a level II hazard; the hazard belongs to level III when the potential HST ranges from 2.0–2.5 m; the potential HST within 2.5–3.0 m is considered a level IV; a hazard is thought to belong to level IV if the potential HST range is 3.0–3.5 m; and a potential HST larger than 3.5 m is deemed to be a level VI hazard. Table 2 lists the classification of the hazard levels, the potential HSTs, and their corresponding descriptions. As shown in Figure 10a–c (C1–C3), the hazard level VI moves from the northwest to west-northwest because the tracks of the C1, C2 and C3 typhoons shifted in a southerly direction. A fraction of the western and northwestern coast is threatened by the hazard level V in the C4, C6, C7 and C9 typhoons (Figure 10d,f,g,i, respectively), whereas the hazard level IV only threatens the northern part of the western coast for the C5 and C8 typhoons (Figure 10e,h, respectively). The same technique for producing the potential HST hazard maps of C1–C9 was adopted to evaluate the comprehensive potential HST hazards in Taiwan; the HATs (Figure 5) were superposed on the comprehensive HSS map (Figure 9) and then classified into the same six hazard levels as the individual potential HST hazard maps. Figure 11 displays a comprehensive potential HST hazard map constructed by the present study. In general, when typhoons are present, the complete western and northwestern coasts of Taiwan are potentially threatened by high and very high HST hazards (hazard levels V and VI), whereas the northern, eastern, southern and southeastern coasts are generally impacted by very low and low HST hazards (hazard levels II and III).

4. Discussion

In addition to a qualitative analysis, a quantitative analysis is also necessary to assess the coastal hazards, and quantifying the potential HAT hazard for the coast of Taiwan was thus accomplished by calculating the coastline lengths, as well as the percentages of the total coastline, corresponding to each hazard level for the comprehensive potential HST hazard map (Figure 12). The longest coastline (449.4 km) can be found for the hazard level II, which accounts for 37.7% of the total coastline. The second-, third-, fourth- and fifth-longest coastlines are present in the hazard levels III, IV, V and VI, with coastline lengths of 255.6 (21.5%), 156.0 (13.1%), 135.0 (11.3%) and 126.9 (10.7%) km, respectively, whereas the shortest one, for the hazard level I, is only 68.2 (5.7%) km long. The quantitative results reveal that the HST is a relatively minor hazard compared with the storm wave hazard for the coastal waters of Taiwan [37,44].
Effective floodplain management depends on accurate surveying: all measurements must use the same vertical datum throughout the survey. Therefore, a consistent starting point to compare flood and ground elevations is important for field measurements. The present study evaluated the potential HST hazard level for the Taiwanese coast by adopting a superposition of the long-term measured HATs from 28 tide-measuring stations based on the vertical geodetic datum of TWVD2001 and the hindcasted HSSs from a surge-wave coupled model. This approach takes advantage of both consistency and high resolution.
Compared with the other categories, the typhoon occurrences are only 5 and 4 for C7 and C8 (Figure 2g,h), respectively, and a few typhoon events seem insufficient for assessing the potential HST hazard and creating the potential HST hazard maps. However, the occurrences of the C7 and C8 typhoons are only 6.8% and 3.4%, respectively, from 1911–2017, according to the statistical data from the CWB. In other words, the typhoon occurrences for C7 and C8 are essentially few because of the climatological conditions in Taiwan. The potential HST hazard levels were analyzed using the historical typhoon events, and the potential HST hazard maps of C7 and C8 produced in the present study thus remain representative, although the occurrences are relatively rare.
In order to support the reliability of the comprehensive potential HST hazard map in Figure 11, the long-term recorded highest storm tides (sea-surface elevations during typhoons) of each tide-measuring station were acquired and utilized to produce the measured HST map along the coast of Taiwan (as shown in Figure 13). A similar pattern can be detected in both Figure 11 and Figure 13; the western and northwestern coasts are threatened by a higher HST hazard. The measured HST hazards are overall lower by 1–2 levels, i.e., 0.5–1.0 m, than that of the comprehensive potential HST (compared with Figure 11 and Figure 13). This phenomenon is mainly due to the low spatial and temporal resolution of the observational HST. The astronomical tide varies gradually with the time and location, and the hourly measurements from 28 tide-measuring stations are therefore sufficient to represent the characteristics of HAT along the coast of Taiwan; however, the number and sampling rate of the tide-measuring station are inadequate for the HSS. Hence the HSSs hindcasted by a high-resolution surge-wave coupled model in the present study are more reliable for assessing the HST hazard.

5. Conclusions and Summary

This study assessed the potential highest storm tide (HST) hazard along the coast of Taiwan using an unstructured-grid, high-resolution, surge-wave coupled model, SWAN + ADCIRC. The SWAN + ADCIRC model was driven by a combination of the parametric typhoon model (modified Rankine vortex, MRV) and the atmospheric reanalysis product from the European Center for Medium-Range Weather Forecasts (ECMWF). The long-term monitoring, statistically-highest astronomical tide (HAT) data based on the Taiwan Vertical Datum 2001 (TWVD2001) and the vertical geodetic datum applied in Taiwan from 28 tidal-measuring stations were first employed to analyze the local high water level characteristics. HATs that exceeded 2.0 m were distributed in the northwestern coast of Taiwan because the HATs were only under or equal to 1.0 m for most of the eastern and northeastern coast of Taiwan. The storm surges induced by 122 historical typhoon events during the past 40 years (from 1979 to 2018) were hindcasted, and the highest storm surge (HSS) of each typhoon event was extracted. The higher HSSs (0.9–1.2 m or higher than 1.2 m) are present in the northern, northeastern, northwestern coasts and in part of the eastern coast, whereas the southwestern coast is occupied by HSSs under 0.9 m. A comprehensive potential highest storm tide (HST) hazard map was finally generated by the superposition of the HATs and the HSSs for the coast of Taiwan. The results of the present study reveal that the northwestern coast is potentially influenced by the HST hazard level VI (HSTs higher than 3.5 m). The coast affected by the HST hazard level V (HSTs ranging from 3.0–3.5 m) is located in the northwest. The HST hazard level IV (HSTs ranging from 2.5–3.0 m) appears in a portion of the western and eastern coasts. The most eastern, southern and southwestern coasts are obviously occupied by the hazard levels III and II (HSTs ranging from 2.0–2.5 m and 1.5–2.0 m, respectively), whereas level I of the HST hazard (HSTs under or equal to 1.5 m) is only found in a fraction of the southern and the southeastern coasts.
The typhoon-induced HSS might coincide with the HAT; therefore, the highest total water level, i.e., the HST, would obstruct the water flow away from the coast and indirectly form an inundation in the middle or lower reaches of a river. Although the HST hazard is relatively minor compared with the storm wave hazard for the coastal areas of Taiwan, the HST hazard maps created in the present study are still helpful for early warnings of riverine flooding when a typhoon approaches Taiwan. Additionally, the hazard maps could also be used for the design and construction of infrastructures, e.g., estuarine and riverside embankments, in Taiwan.

Author Contributions

Y.-C.Y., H.C., H.-J.S., C.-H.C., S.-C.H., W.-B.C., Y.-M.C., W.-R.S. and L.-Y.L. conceived the study and collected observations; and W.-B.C. performed the model simulations. The final manuscript has been read and approved by all authors.

Funding

This research was funded by the Ministry of Science and Technology (MOST), Taiwan, grant number MOST 107-2625-M-865-001.

Acknowledgments

The authors would like to thank the Central Weather Bureau, Department of Land Administration, Ministry of the Interior of Taiwan and the development group of SWAN + ADCIRC for providing the observational data and kindly sharing their experiences of using the numerical model.

Conflicts of Interest

The authors declare no conflict of interest.

References

  1. Neumann, B.; Vafeidis, A.T.; Zimmermann, J.; Nicholls, R.J. Future coastal population growth and exposure to sea-rise and coastal flooding—A global assessment. PLoS ONE 2015, 10, e0131375. [Google Scholar] [CrossRef] [PubMed]
  2. Smith, L. Environmental Hazards: Assessment Risk and Reducing Disaster, 2nd ed.; Routledge: London, UK, 1996. [Google Scholar]
  3. Nicholls, R.J.; Wong, P.P.; Burkett, V.R.; Codignotto, J.O.; Hay, J.E.; McLean, R.F.; Ragoonaden, S.; Woodroffe, C.D. Coastal Systems and Low-Lying Areas. Climate Change 2007: Impacts, Adaptation and Vulnerability; Contribution of Working Group II to the Fourth Assessment Report of the Intergovernmental Panel on Climate, Change; Parry, M.L., Canziani, O.F., Palutikof, J.P., van der Linden, P.J., Hanson, C.E., Eds.; Cambridge University Press: Cambridge, UK, 2007; pp. 315–356. [Google Scholar]
  4. Lee, H.S.; Kim, K.O. Storm surge and storm waves modelling due to Typhoon Haiyan in November 2013 with improved dynamic meteorological conditions. Procedia Eng. 2015, 116, 699–706. [Google Scholar] [CrossRef]
  5. Dasallas, L.; Lee, S. Topographical Analysis of the 2013 Typhoon Haiyan Storm Surge Flooding by Combining the JMA Storm Surge Model and the FLO-2D Flood Inundation Model. Water 2019, 11, 144. [Google Scholar] [CrossRef]
  6. Mori, N.; Kato, M.; Kim, S.; Mase, H.; Shibutani, Y.; Takemi, T.; Tsuboki, K.; Yasuda, T. Local amplification of storm surge by Super Typhoon Haiyan in Leyte Gulf. Geophys. Res. Lett. 2014, 41, 5106–5113. [Google Scholar] [CrossRef] [PubMed] [Green Version]
  7. Qi, J.H.; Chen, C.S.; Beardsley, R.C. An unstructured-grid finite-volume surface wave model (FVCOMSWAVE): Implementation, validations and applications. Ocean Model. 2009, 28, 153–166. [Google Scholar] [CrossRef]
  8. Roland, A.; Zhang, Y.J.; Wang, H.V.; Meng, Y.; Teng, Y.-C.; Maderich, V.; Brovchenko, I.; Dutour-Sikiric, M.; Zanke, U. A fully coupled 3D wave-current interaction model on unstructured grids. J. Geophys. Res. 2012, 117, C00J33. [Google Scholar] [CrossRef]
  9. Dietrich, J.C.; Zijlema, M.; Westerink, J.J.; Holthuijsen, L.H.; Dawson, C.N.; Luettich, R.A., Jr.; Jensen, R.E.; Smith, J.M.; Stelling, G.S.; Stone, G.W. Modeling hurricane waves and storm surge using integrally-coupled, scalable computations. Coast. Eng. 2011, 58, 45–65. [Google Scholar] [CrossRef]
  10. Krien, Y.; Dudon, B.; Roger, J.; Zahibo, N. Probabilistic hurricane-induced storm surge hazard assessment in Guadeloupe, Lesser Antilles. Nat. Hazards Earth Syst. Sci. 2015, 15, 1711–1720. [Google Scholar] [CrossRef] [Green Version]
  11. Krien, Y.; Dudon, B.; Roger, J.; Arnaud, G.; Zahibo, N.P. Assessing storm surge hazard and impact of sea level rise in the Lesser Antilles case study of Martinique. Nat. Hazards Earth Syst. Sci. 2017, 17, 1559–1571. [Google Scholar] [CrossRef] [Green Version]
  12. Chen, W.-B.; Chen, H.; Chang, C.-H.; Hsiao, S.-C.; Su, W.-R.; Yu, Y.-C.; Chen, Y.-M.; Lin, L.-Y. Quantifying the Contribution of Nonlinear Interactions to Storm Tide Simulations during a Super Typhoon Event. Ocean Eng. 2019. Submitted. [Google Scholar]
  13. Yang, M.; Chen, K.-H. A new height reference network in Taiwan. Surv. Rev. 2003, 37, 260–268. [Google Scholar] [CrossRef]
  14. Luettich, R.A.; Westerink, J.J.; Scheffner, N.W. ADCIRC: An Advanced Three-Dimensional Circulation Model for Shelves Coasts and Estuaries, Report 1: Theory and Methodology of ADCIRC-2DDI and ADCIRC-3DL; Dredging Research Program Technical Report DRP-92-6; U.S. Army Engineers Waterways Experiment Station: Vicksburg, MS, USA, 1992; 137p. [Google Scholar]
  15. Westerink, J.J.; Luettich, R.A.; Muccino, J.C. Modelling tides in the western north Atlantic using unstructured graded grids. Tellus 1994, 46, 178–199. [Google Scholar] [CrossRef]
  16. Bunya, S.; Dietrich, J.C.; Westerink, J.J.; Ebersole, B.A.; Smith, J.M.; Atkinson, J.H.; Jensen, R.; Resio, D.T.; Luettich, R.A.; Dawson, C.; et al. A high-resolution coupled riverine flow, tide, wind, wind wave, and storm surge model for southern Louisiana and Mississippi. Part I: Model development and validation. Mon. Weather Rev. 2010, 138, 345–377. [Google Scholar] [CrossRef]
  17. Dietrich, J.C.; Bunya, S.; Westerink, J.J.; Ebersole, B.A.; Smith, J.M.; Atkinson, J.H.; Jensen, R.; Resio, D.T.; Luettich, R.A.; Dawson, C.; et al. A high-resolution coupled riverine flow, tide, wind, wind wave, and storm surge model for southern Louisiana and Mississippi. Part II: Synoptic description and analysis of Hurricanes Katrina and Rita. Mon. Weather Rev. 2010, 138, 378–404. [Google Scholar] [CrossRef]
  18. Westerink, J.J.; Luettich, R.A.; Feyen, J.C.; Atkinson, J.H.; Dawson, C.; Roberts, H.J. A basin to channel scale unstructured grid hurricane storm surge model applied to southern Louisiana. Mon. Weather Rev. 2008, 136, 833–864. [Google Scholar] [CrossRef]
  19. Tanaka, S.; Bunya, S.; Westerink, J.J.; Dawson, C.; Luettich, R.A. Scalability of an Unstructured Grid Continuous Galerkin Based Hurricane Storm Surge Model. J. Sci. Comput. 2010, 46, 329–358. [Google Scholar] [CrossRef]
  20. Kerr, P.C.; Donahue, A.S.; Westerink, J.J.; Luettich, R.A.; Zheng, L.Y.; Weisberg, R.H.; Huang, Y.; Wang, H.V.; Teng, Y.; Forrest, D.R.; et al. U.S. IOOS coastal and ocean modeling testbed: Inter-model evaluation of tides, waves, and hurricane surge in the Gulf of Mexico. J. Geophys. Res. Oceans 2013, 118, 5129–5172. [Google Scholar] [CrossRef] [Green Version]
  21. Smith, J.; Sherlock, A.; Resio, D. STWAVE: Steady-State Spectral Wave Model. User’s Manual for STWAVE, Version 3.0; Coastal and Hydraulics Laboratory, Engineer Research and Development Center, US Army Corps of Engineers: Washington, DC, USA, 2001. [Google Scholar]
  22. Booij, N.; Ris, R.C.; Holthuijsen, L.H. A third-generation wave model for coastal regions, Part I, model description and validation. J. Geophys. Res. 1999, 104, 7649–7666. [Google Scholar] [CrossRef]
  23. Tolman, H.L. User Manual and System Documentation of WAVEWATCH III. Technical Note 166; NOAA/NWS/NCEP/OMB: Washington, DC, USA, 1999. [Google Scholar]
  24. Garratt, J.R. Review of drag coefficients over oceans and continents. Mon. Weather Rev. 1977, 105, 915–929. [Google Scholar] [CrossRef]
  25. Komen, G.J.; Cavaleri, L.; Donelan, M.; Hasselmann, K.; Hasselmann, S.; Janssen, P.A. Dynamics and Modelling of Ocean Waves; Cambridge University Press: Cambridge, UK, 1994; 532p. [Google Scholar]
  26. Zijlema, M. Computation of wind–wave spectra in coastal waters with SWAN on unstructured grids. Coast. Eng. 2010, 57, 267–277. [Google Scholar] [CrossRef]
  27. Ris, R.C.; Holthuijsen, L.H.; Booij, N. A third-generation wave model for coastal regions: 2. Verification. J. Geophys. Res. Oceans 1999, 104, 7649–7666. [Google Scholar] [CrossRef]
  28. Xie, D.; Zou, Q.-P.; Mognone, A.; MacRae, J.D. Coastal flooding from wave overtopping and sea level rise adaptation in the northeastern USA. Coast. Eng. 2019, 150, 39–58. [Google Scholar] [CrossRef]
  29. Zou, Q.P.; Xie, D.M. Tide-surge and wave interaction in the Gulf of Maine during an extratropical storm. Ocean Dyn. 2016, 66, 1715–1732. [Google Scholar] [CrossRef]
  30. Hasselmann, K.; Barnett, T.P.; Bouws, E.; Carlson, H.; Cartwright, D.E.; Enke, K.; Ewing, J.A.; Gienapp, H.; Hasselmann, D.E.; Kruseman, P.; et al. Measurements of Wind-Wave Growth and Swell Decay during the Joint North Sea Wave Project (JONSWAP); Deutsches Hydrographisches Institut: Hamburg, Germany, 1973. [Google Scholar]
  31. Hasselmann, S.; Hasselmann, K.; Allender, J.H.; Barnett, T.P. Computations and parameterizations of the non-linear energy transfer in a gravity-wave spectrum, Part 2: Parameterizations of the non-linear energy transfer for application in wave models. J. Phys. Oceanogr. 1985, 15, 1378–1391. [Google Scholar] [CrossRef]
  32. Shao, W.; Sheng, Y.; Li, H.; Shi, J.; Ji, Q.; Tan, W.; Zuo, J. Analysis of Wave Distribution Simulated by WAVEWATCH-III Model in Typhoons Passing Beibu Gulf, China. Atmosphere 2018, 9, 265. [Google Scholar] [CrossRef]
  33. Blain, C.A.; Westerink, J.J.; Luettich, R.A. The influence of domain size on the response characteristics of a hurricane storm surge model. J. Geophys. Res. Oceans 1994, 99, 18467–18479. [Google Scholar] [CrossRef] [Green Version]
  34. Westerink, J.J.; Blain, C.A.; Luettich, R.A.; Scheffner, N.W. ADCIRC: An Advanced Three-Dimensional Circulation Model for Shelves Coasts and Estuaries, Report 2: User’s Manual for ADCIRC-2DDI; Dredging Research Program Technical Report DRP-92-6; U.S. Army Engineers Waterways Experiment Station: Vicksburg, MS, USA, 1994; 156p. [Google Scholar]
  35. Hagen, S.; Westerink, J.; Kolar, R.; Horstmann, O. Two-dimensional, unstructured mesh generation for tidal models. Int. J. Numer. Methods Fluids 2001, 35, 669–686. [Google Scholar] [CrossRef]
  36. Pan, Y.; Chen, Y.P.; Li, J.X.; Ding, X.L. Improvement of wind field hindcasts for tropical cyclones. Water Sci. Eng. 2016, 9, 58–66. [Google Scholar] [CrossRef] [Green Version]
  37. Chang, C.-H.; Shih, H.-J.; Chen, W.-B.; Su, W.-R.; Lin, L.-W.; Yu, Y.-C.; Jang, J.-H. Hazard Assessment of Typhoon-Driven Storm Waves in the Nearshore Waters of Taiwan. Water 2018, 10, 926. [Google Scholar] [CrossRef]
  38. Phadke, A.C.; Martino, C.D.; Cheung, K.F.; Houston, S.H. Modeling of tropical cyclone winds and waves for emergency management. Ocean Eng. 2003, 30, 553–578. [Google Scholar] [CrossRef]
  39. Jourdain, N.C.; Barnier, B.; Ferry, N.; Vialard, J.; Menkes, C.E.; Lengaigne, M.; Parent, L. Tropical cyclones in two atmospheric (re) analyses and their response in two oceanic reanalyses. Ocean Model. 2014, 73, 108–122. [Google Scholar] [CrossRef]
  40. Shao, Z.; Liang, B.; Li, H.; Wu, G.; Wu, Z. Blended wind fields for wave modeling of tropical cyclones in the South China Sea and East China Sea. Appl. Ocean Res. 2018, 71, 20–33. [Google Scholar] [CrossRef]
  41. Peng, D.; Hill, E.M.; Meltzner, A.J.; Switzer, A.D. Tide Gauge Records Show That the 18.61-Year Nodal Tidal Cycle Can Change High Water Levels by up to 30 cm. J. Geophys. Res. Oceans 2019, 124, 736–749. [Google Scholar] [CrossRef]
  42. Chen, W.-B.; Lin, L.-Y.; Jang, J.H.; Chang, C.-H. Simulation of Typhoon-Induced Storm Tides and Wind Waves for the Northeastern Coast of Taiwan Using a Tide–Surge–Wave Coupled Model. Water 2017, 9, 549. [Google Scholar] [CrossRef]
  43. Resio, D.T.; Westerink, J.J. Modeling the physics of storm surges. Phys. Today 2008, 61, 33–38. [Google Scholar] [CrossRef] [Green Version]
  44. Shih, H.-J.; Chen, H.; Liang, T.-Y.; Fu, H.-S.; Chang, C.-H.; Chen, W.B.; Su, W.-R.; Lin, Y.-Y. Generating potential risk maps for typhoon-induced waves along the coast of Taiwan. Ocean Eng. 2018, 163, 1–14. [Google Scholar] [CrossRef]
Figure 1. Nine categories classified by the Central Weather Bureau of Taiwan based on typhoon tracks.
Atmosphere 10 00346 g001
Figure 2. Tracks of historical typhoon events (blue lines) for each category during the period from 1979 to 2018. (a) category 1, (b) category 2, (c) category 3, (d) category 4, (e) category 5, (f) category 6, (g) category 7, (h) category 8 and (i) category 9.
Atmosphere 10 00346 g002
Figure 3. Distribution of the tide-measuring stations along the coastal waters of Taiwan.
Atmosphere 10 00346 g003
Figure 4. (a) Location, (b) unstructured grid and (c) bathymetry of the computational domain.
Atmosphere 10 00346 g004aAtmosphere 10 00346 g004b
Figure 5. The distribution of the highest astronomical tides (HATs) along the coast of Taiwan.
Atmosphere 10 00346 g005
Figure 6. Storm surge and track of Typhoon Dujuan (2015) (a) with and (b) without a wave effect; (c) the wave setup distribution and (d) the comparison in the time series of the storm surge with and without a wave effect at point A (as shown in Figure 6a).
Atmosphere 10 00346 g006aAtmosphere 10 00346 g006b
Figure 7. Model-data comparison for the sea-surface elevation at the (a) Wushi (No. 8), (b) Suao (No. 11), (c) Hualien (No. 14) and (d) Houbihu (No. 28) tide-measuring stations during Typhoons Meranti (Sep. 12–15), Malakas (Sep. 15–18) and Megi (Sep. 25–28) in 2016(d).
Atmosphere 10 00346 g007
Figure 8. The highest storm surge (HSS) distributions for C1–C9. (a) category 1, (b) category 2, (c) category 3, (d) category 4, (e) category 5, (f) category 6, (g) category 7, (h) category 8 and (i) category 9.
Atmosphere 10 00346 g008aAtmosphere 10 00346 g008b
Figure 9. A comprehensive highest storm surge (HSS) distribution.
Atmosphere 10 00346 g009
Figure 10. The potential highest storm tide (HST) hazard maps for C1–C9. (a) category 1, (b) category 2, (c) category 3, (d) category 4, (e) category 5, (f) category 6, (g) category 7, (h) category 8 and (i) category 9.
Atmosphere 10 00346 g010
Figure 11. A comprehensive potential highest storm tide (HST) hazard map.
Atmosphere 10 00346 g011
Figure 12. Length of the coastline and percentage of the total coastline corresponding to each hazard level for the comprehensive potential highest storm tide (HST) hazard map.
Atmosphere 10 00346 g012
Figure 13. Measured highest storm tides (HST) hazard map.
Atmosphere 10 00346 g013
Table 1. Information for each tide-measuring station along the coastal waters of Taiwan.
NumberNameLongitude (°)Latitude (°)HAT
(Highest Astronomical Tide, m)
1Linshanbi121.5125.281.29
2Tamsui121.4225.171.76
3Tapei Harbor121.3725.162.31
4Keelung121.7525.160.57
5Zhuwei121.2425.121.82
6Longdong121.9225.100.71
7Fulong121.9525.020.66
8Wushi121.8424.870.90
9Hsinchu120.9224.852.51
10Waipu120.7724.652.47
11Suao121.8724.590.98
12Taichung Harbor120.5324.292.63
13Lukang120.4224.082.44
14Hualien121.6223.970.92
15Mailiao120.1623.792.25
16Boziliao120.1423.622.18
17Wengang120.1223.521.21
18Shiti121.5023.481.16
19Dongshi120.1423.451.43
20Jiangjun120.0223.211.22
21Chenggong121.3823.100.93
22Yongan120.2022.820.96
23Taitung121.1822.781.03
24Kaohsiung120.2922.610.85
25Donggang120.4422.471.15
26Dawu120.9022.341.08
27Xunguangzui120.7121.990.99
28Houbihu120.7521.951.18
Table 2. The classification of hazard levels corresponding to the ranges of the potential highest storm tides (HSTs).
Hazard levelHST (m)Description
I<= 1.5No hazard
II[1.5–2.0)Very low
III[2.0–2.5)Low
IV[2.5–3.0)Medium
V[3.0–3.5)High
VI>3.5Very high
Note: the classifications are from the Central Weather Bureau of Taiwan and were modified by the present study.

