Article

SST Indexes in the Tropical South Atlantic for Forecasting Rainy Seasons in Northeast Brazil

by
Gbèkpo Aubains Hounsou-Gbo
1,2,3,*,
Jacques Servain
1,4,
Moacyr Araujo
3,5,
Guy Caniaux
6,
Bernard Bourlès
2,7,
Diogenes Fontenele
1 and
Eduardo Sávio P. R. Martins
1
1
Research Institute for Meteorology and Water Resources (FUNCEME), Av. Rui Barbosa, 1246, Fortaleza-CE 60115-221, Brazil
2
International Chair in Mathematical Physics and Applications (ICMPA-Unesco Chair), UAC, 072 P.O. Box 50, Cotonou, Bénin
3
Brazilian Research Network on Global Climate Change–Rede CLIMA, Av. dos Astronautas 1758, São José dos Campos-SP 12227-010, Brazil
4
Institut de Recherche pour le Développement (IRD), LOCEAN, 75005 Paris, France
5
Laboratório de Oceanografia Física Estuarina e Costeira (LOFEC), Department of Oceanography–DOCEAN, Federal University of Pernambuco–UFPE, Av. Arquitetura s/n, Recife-PE 50740-550, Brazil
6
CNRM UMR 3589, Météo-France/CNRS, 42 av. G. Coriolis, 31057 Toulouse Cedex 01, France
7
Institut de Recherche pour le Développement (IRD), IMAGO, 29280 Plouzané, France
*
Author to whom correspondence should be addressed.
Atmosphere 2019, 10(6), 335; https://doi.org/10.3390/atmos10060335
Submission received: 14 May 2019 / Revised: 5 June 2019 / Accepted: 17 June 2019 / Published: 19 June 2019
(This article belongs to the Special Issue Tropical Atlantic Variability)

Abstract

:
May-to-July and February-to-April represent peak rainy seasons in two sub-regions of Northeast Brazil (NEB): Eastern NEB and Northern NEB respectively. In this paper, we identify key oceanic indexes in the tropical South Atlantic for driving these two rainy seasons. In Eastern NEB, the May-to-July rainfall anomalies present a positive relationship with the previous boreal winter sea surface temperature anomalies (SSTA) in the southeast tropical Atlantic (20°–10° S; 10° W–5° E). This positive relationship, which spread westward along the southern branch of the South Equatorial Current, is associated with northwesterly surface wind anomalies. A warmer sea surface temperature in the southwestern Atlantic warm pool increases the moisture flux convergence, as well as its ascending motion and, hence, the rainfall along the adjacent coastal region. For the Northern NEB, another positive relationship is observed between the February-to-April rainfall anomalies and the SSTA of the previous boreal summer in the Atlantic Niño region (3° S–3° N; 20° W–0°). The negative remote relationship noticeable between the Northern NEB rainfall and the concomitant Pacific Niño/Niña follows cold/warm events occurring during the previous boreal summer in the eastern equatorial Atlantic. The southeastern tropical Atlantic and Atlantic Niño SSTA indexes may, then, be useful to predict seasonal rainfall over the Eastern and Northern NEB, respectively, for about a 6 month leading period. The ability of both southeastern tropical Atlantic and Atlantic Niño SSTA indexes to forecast the Eastern and Northern NEB rainfall, with about a 6 month lead time, is improved when these indexes are respectively combined with the Niño3 (5° S–5° N; 150°–90° W) and the northeast subtropical Atlantic (20° N–35° N, 45° W–20° W), mainly from the 1970’s climate shift.

1. Introduction

The precipitation regime over Northeast Brazil (NEB) is known to be related to climatic variability in the tropical Atlantic [1,2,3,4,5,6,7,8,9,10,11,12]. The peak seasonal rainfall in Northern NEB (see black box in Figure 1a) is concomitant with the southernmost position of the intertropical convergence zone (ITCZ), which remains near the equator during February-March-April (FMA) (Figure 1a,c). The year-to-year variability of the seasonal rainfall in Northern NEB is affected by the inter-hemispheric mode of sea surface temperature (SST) in the tropical Atlantic, which is associated with the anomalous latitudinal displacement of the ITCZ [5,7,8,13] between February and May.
Several studies have also highlighted remote influence of the El Niño Southern Oscillation (ENSO) phenomena in the Pacific Ocean on the rainfall variability in NEB [14,15,16,17,18,19,20,21,22]. The ENSO phenomena, which reaches its mature phase during the boreal winter, and the inter-hemispheric mode of the tropical Atlantic are generally used to forecast the Northern NEB rainy season with a few months leading time (~1–2 months) [4,6,23].
Other studies have evidenced a teleconnection between Atlantic and Pacific Niños from the late 1970’s [5,24,25,26,27]. During the positive phase of the Atlantic Niño (warm equatorial Atlantic mode events), the boreal summer SST affects the Walker circulation with an ascending branch over the Atlantic and a descending branch over the central Pacific, which drives the westward wind anomalies over the equatorial Pacific [26,28]. Such change in the atmospheric circulation favors negative SST anomalies (SSTA) (i.e., La Niña conditions) in the eastern equatorial Pacific by increasing the east-west thermocline slope [26,28]. According to [26], this connection has been especially evident since the 1970’s climate shift [29,30,31]. Accordingly, the lagged teleconnection between the Atlantic and Pacific Niños from the 1970’s could have an impact on the climate predictability of some tropical regions such as the NEB.
In Eastern NEB (see black box in Figure 1b), the rainy season, which peaks in austral winter from May to July (MJJ), is mainly linked to events occurring in the tropical South Atlantic, such as easterly disturbance activities [32,33,34]. The seasonal establishment of the southern ITCZ (hereafter referred to as SITCZ; red box in Figure 1b) [35] also coincides with the peak in seasonal rainfall in Eastern NEB. In MJJ, when the ITCZ is shifting to the north, i.e., broadly located in the northern hemisphere, a longitudinal band of surface wind convergence is observed south of the equator (Figure 1b,c) [36]. Such a convergence is associated with atmospheric convection and rainfall over warm water in the Southwestern Atlantic warm pool, around June–July [35]. At an interannual timescale, a positive relationship has also been indicated between the SSTA in the tropical South Atlantic and rainfall anomalies over the coastal portion of the Eastern NEB for 2–4 months, with warmer/colder SSTs leading to more/less rainfall [37,38]. According to [33], most of the easterly disturbance activities occur during the positive SSTA over the tropical South Atlantic.
In this paper, we specifically focus on the variability of the seasonal rainfall over (i) the Eastern NEB (limited to its coastal strip; black box in Figure 1b), and (ii) the Northern NEB, which includes the coastal strip as well as a large portion of the semi-arid region (black box in Figure 1a). Eastern and Northern NEB sub-regions have been geographically delimited based on their peak rainy seasons and the mechanisms that influence their variabilities. Similar delimitations have also been used in the Eastern NEB and/or Northern NEB by other authors [9,37,39,40].
The several month predictability of the rainfall in the NEB, a largely semi-arid region, is fundamental for the water resources decision-making, on which several millions of people depend. Thus, our main objective in this work is to differentiate how earlier (nearly 6 month leading time) oceanic-atmospheric conditions in the tropical South Atlantic, directly or indirectly, influenced the climate of both Eastern and Northern NEB. The present study goes beyond the analysis in [38], which investigated the influence of tropical Atlantic oceanic–atmospheric variables on the Recife (located in Eastern NEB) and Fortaleza (located in Northern NEB) rainfall anomalies for a 2–4 month lag time during the period 1974–2008. Unlike [38], we enlarged the present study to the global ocean (50° S to 50° N) for the extended period of 1960–2015 and analyzed the seasonal rainfall over all of NEB (Eastern and Northern NEB), with expanded attention on the nearly 6 month predictability of the seasonal rainfall over Eastern and Northern NEB. Another new aspect is the nearly 6 month leading influence of the Atlantic Niño on the NEB rainfall discussed here. Additional elements of the likely oceanic–atmospheric mechanisms that relate the early tropical South Atlantic conditions to rainfall anomalies in NEB are also provided. In this context, we define two oceanic indexes in the tropical South Atlantic, the southeastern tropical Atlantic (SETA) and the Atlantic Niño (ATL3) SSTA indexes, which can be used to forecast events of seasonal rainfall over both Eastern and Northern NEB about 6 months in advance. We also discuss the increase of the lagged relationship between the tropical South Atlantic indexes and the NEB rainfall anomalies for the period 1980–2015 (i.e., from the 1970’s climate shift). This reduced period corresponds to the period of highly significant relationship between the Atlantic and Pacific Niños [24,26] but also to better observational data quality. Our study is primarily based on the simple statistical relationships between selected key variables of the oceanic–atmospheric interactions at seasonal and interannual timescales.
The data and methods are detailed in the following section. Section 3 specifies the early spatial-temporal signals of surface oceanic variables in the tropical South Atlantic that are linked to the climatic variability in Eastern and Northern NEB and the ability of the oceanic indexes to forecast the rainfall. A summary and conclusion are presented Section 4.

2. Data and Methods

Observed and reanalyzed data of meteorological and oceanic variables (e.g., precipitation, SST, wind, specific humidity, velocity potential, stream function and vertical velocity/omega) are used for the period from 1960 to 2015 (or 2000 to 2015 for Quick Scatterometer (QuikSCAT) + Advanced Scatterometer (ASCAT) winds). Information on these data is summarized in Table 1.
The vertically integrated moisture flux convergence (MFC, in kg m−2 s−1) is calculated as follows:
M F C = 1 g P 1 P s q V d p
where g is the gravitational acceleration (m s−2), Ps is the surface pressure (hPa), P1 = 300 hPa, q is the specific humidity (g kg−1), V is the horizontal wind vector (m s−1), and dp is the change in pressure [51,52,53].
Monthly anomalies are estimated by removing the monthly climatology (1960–2015) from the monthly quantities.
We consider the three consecutive months that correspond to the occurrence of the highest seasonal rainfall over Northern and Eastern NEB, i.e., February-March-April (FMA) and May-June-July (MJJ), respectively, to define the peak of the rainy season in these regions. Limiting the rainy seasons to FMA and MJJ, in Northern NEB and Eastern NEB respectively, allows us to consider two seasons with completely distinct months. These two regions present a clear year-to-year variability in rainfall with selected long periods of wet and dry events [38].
The normalized rainfall anomalies in Northern and Eastern NEB are split into three different groups using the threshold of ±0.5 std. From the 56 year period (i.e., 1960–2015), the normalized rainfall anomalies greater than +0.5 std are considered WET events in FMA and MJJ over Northern and Eastern NEB, respectively (Table 2). In contrast, those with anomalies less than −0.5 std are considered DRY events. The other years with values close to the climatological (seasonal) mean are considered neutral events. Using these criteria, 15 WET events and 19 DRY events are selected for Eastern NEB, and 19 WET events and 20 DRY events are selected for Northern NEB (Table 2). The composites used in this study are based on the years of WET and DRY events selected above.
Lagged linear relationships (spatial and temporal) are identified between anomalies of different climatic fields (e.g., SST, surface wind), and the rainfall anomalies in MJJ over Eastern NEB and in FMA over the Northern NEB. For the lagged relationships, the seasons (three consecutive months) corresponding to the year preceding the rainy season in Eastern NEB and Northern NEB are indicated by (−1), e.g., July-August-September(-1) (JAS(−1)), and those of the current year (related to the rainy season) are indicated by (0), e.g., May-June-July(0) (MJJ(0)).

3. Results

In this section, we investigate the most consistent spatial–temporal relationship between the oceanic climate variables and rainfall variability over Eastern NEB in MJJ and Northern NEB in FMA.

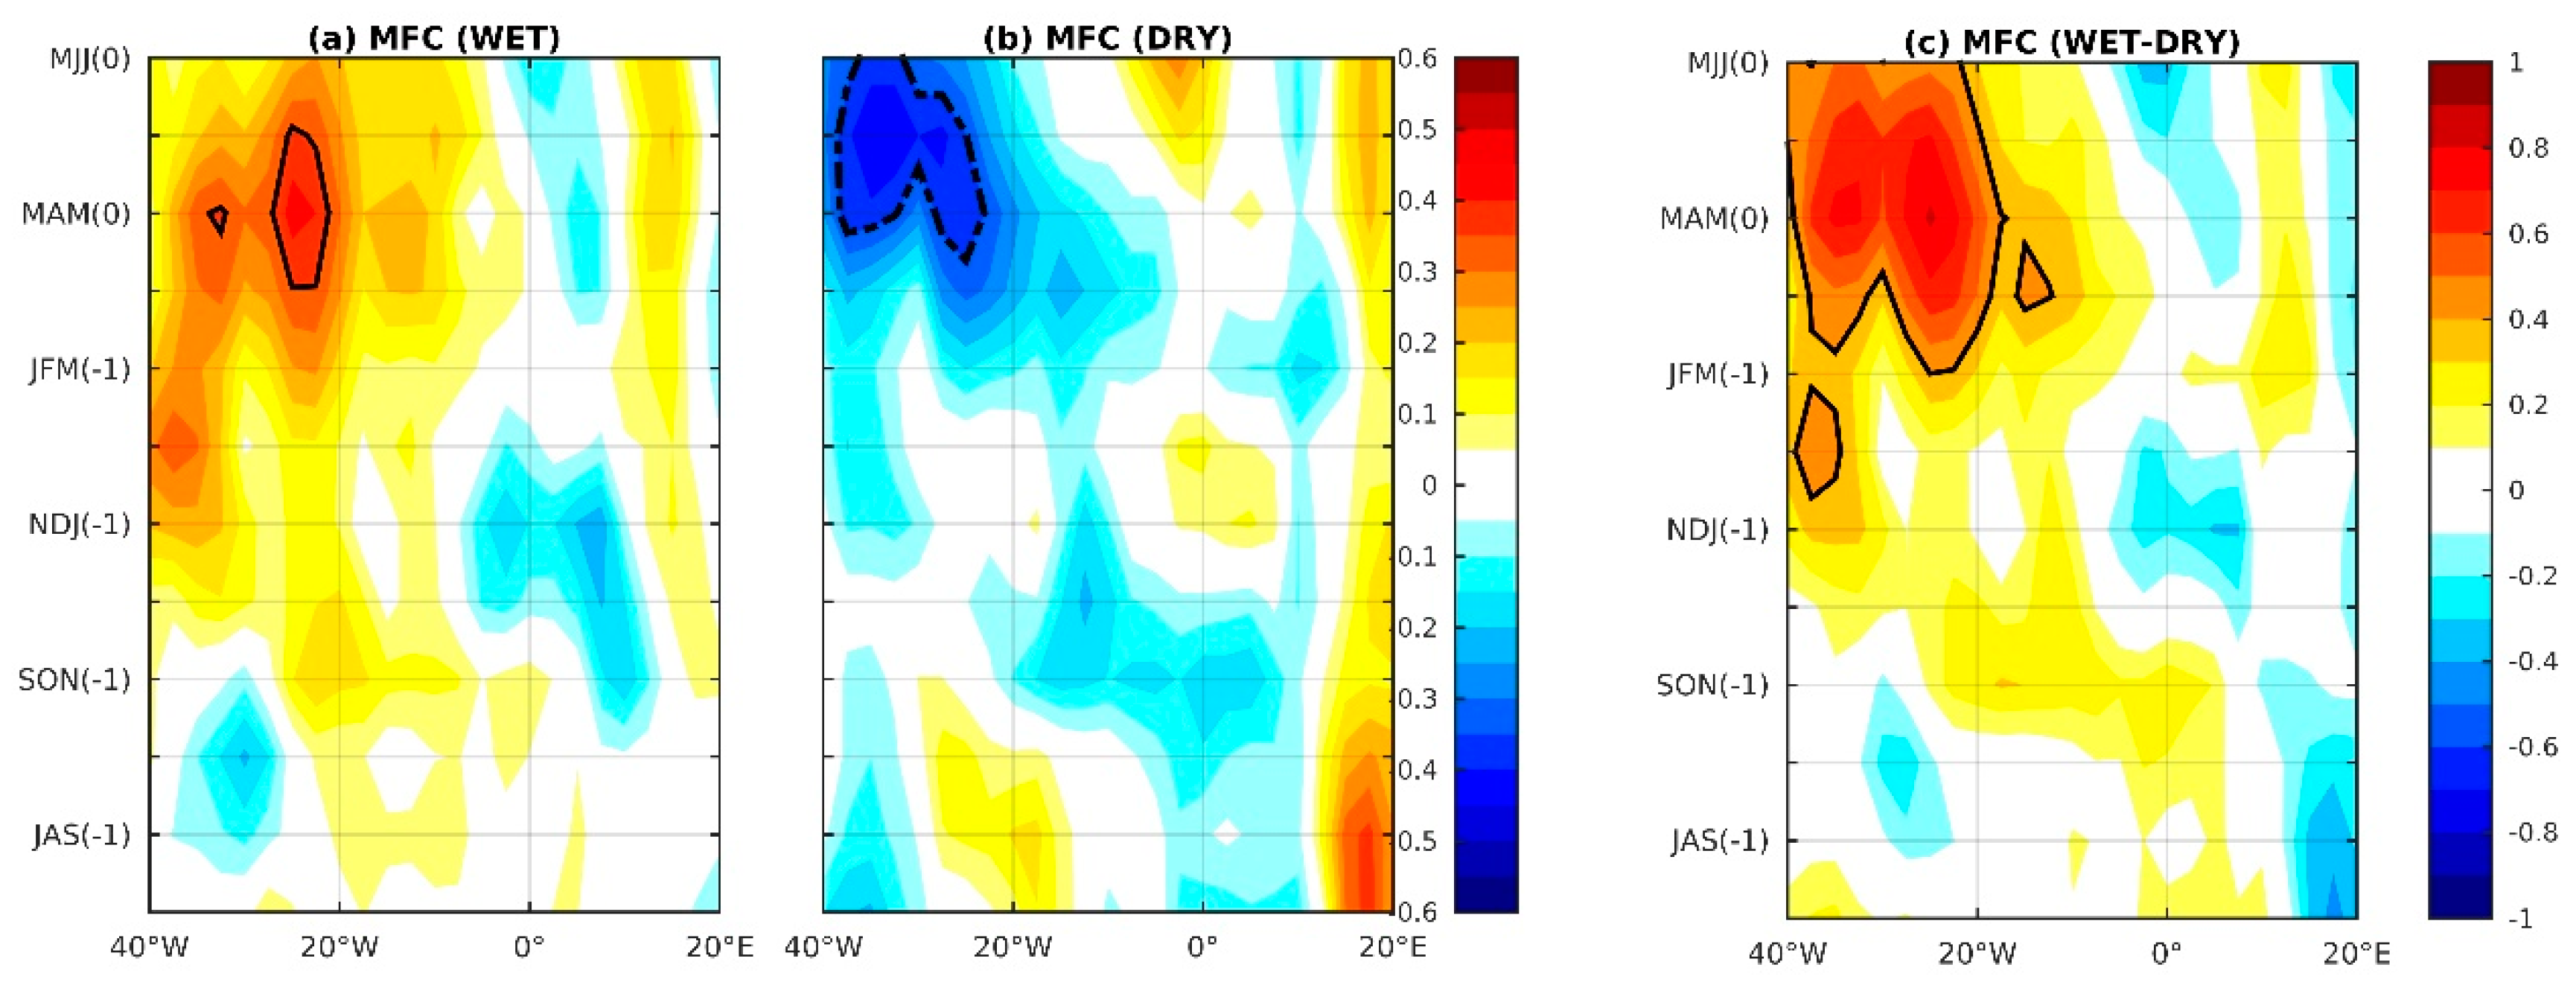
3.1. Results for Eastern NEB

Figure 2a illustrates the lagged linear regression coefficient between the gridded SST and surface wind anomalies in November-December-January(−1) (NDJ(−1)) and the MJJ(0) Eastern NEB rainfall anomalies for the period 1960–2015. The correlation/regression is shown for NDJ because our preliminary study indicated that this season corresponds to the highest lagged correlation between tropical South Atlantic SSTA and MJJ rainfall anomalies in the Eastern NEB. An area with a significant positive regression coefficient between the NDJ(−1) SSTA and the MJJ(0) Eastern NEB rainfall anomalies is clearly identifiable in the eastern portion of the tropical south Atlantic, with a value greater than 60 mm month−1/°C (correlation coefficient higher than +0.5). A northwesterly wind anomaly signal, significantly related to Eastern NEB rainfall, is noted over the area of positive significant coefficients observed with the SSTA. No significant relationship is noticeable between the tropical North Atlantic surface climatic variables (i.e., the SST and surface wind) and MJJ rainfall in Eastern NEB. These results suggest that there is a several month (about 6 month) leading influence of the SST–wind interactions of the tropical South Atlantic on the variability of seasonal rainfall in Eastern NEB.
The significant positive relationship between the tropical South Atlantic SSTA and the MJJ Eastern NEB rainfall moves westward from NDJ and concentrates only near the NEB coast just before or during the rainy season (Figure 2b). This observation is consistent with results in [38]. The westward displacement of the SSTA relationship is confirmed in Figure 2c,d, in which we show the longitude-time diagram of the WET and DRY composites of standardized SSTA along the diagonal band indicated in Figure 2a. However, the largest values of the positive and negative SSTA linked to WET and DRY events, respectively, in Eastern NEB are not symmetric during the westward propagation. The high positive SSTA linked to WET events in Eastern NEB start early in the eastern portion of the basin and reach the western portion earlier than the strong negative anomalies. The vertical black lines at 35° W in Figure 2c–e represent the eastern limit of the Eastern NEB. This result is mainly due to the seasonality of the amplitude of variability of the positive and negative SSTA used for the composites. Indeed, the difference between the standard deviations of the positive and negative SSTA presents high positive values from November to March and negative values from April to August in the southeastern tropical Atlantic (not shown). This means that from November to March, positive SSTA in the tropical South Atlantic exhibit higher interannual variability than negative SSTA for the study period. Contrarily, negative SSTA present higher variability than positive SSTA from April to August. Figure 2e shows the longitude-time diagrams of the differences between composites (WET–DRY) of standardized SST anomalies, corresponding to rainfall events in Eastern NEB. The difference between composites of SSTA is positive during a long period of the year (Figure 2e). As noted previously, a positive SST signal propagates westward from the African coast to the western part of the basin. The positive values of the WET–DRY difference start in the eastern part of the basin during the boreal fall of the year preceding the Eastern NEB rainfall events; they reach the western part at the beginning of the next year and then remain there until MJJ(0). The strongest values for the differences between SSTA composites are centered near 10° W in DJF(0).
To illustrate how the variability of the surface oceanic–atmospheric conditions in the tropical South Atlantic can be linked to the rainfall in Eastern NEB, we perform a longitude–time diagram of the MFC anomalies (Figure 3). Positive anomalies of MFC are observed near the coast for the composite of WET years from MAM to MJJ (Figure 3a). For the composite of the DRY years, large negative anomalies of the MFC are marked from MAM to MJJ, with the highest values observed in MJJ (Figure 3b). The amplitude of the negative MFC anomalies is stronger than that of the positive MFC anomalies near the Eastern NEB coast during the period corresponding to the peak of the rainy season. This suggests that the deficit of the MJJ Eastern NEB rainfall is highly associated with negative MFC anomalies over the oceanic region near the coast. The large negative MFC anomalies observed near the NEB coast in MJJ during the DRY years are certainly linked to the negative SSTA, which are high during the peak of the rainy season (Figure 2c). In the same way, the relatively weak positive MFC anomalies noted near the NEB coast in MJJ during the WET years are linked to weak positive SSTA observed during MJJ. The difference between the WET and DRY composites of anomalies of MFC is positive and high from MAM to MJJ in the western part of the tropical South Atlantic (Figure 3c).
To define an oceanic index (i.e., SSTA) that could be used for forecasting the rainy season in Eastern NEB for a nearly 6 month leading time, we considered the oceanic zone and the season corresponding to the largest relationship with the SSTA (correlation coefficient > +0.5; Figure 2). Therefore, we chose the SETA limited oceanic region (10° S–20° S, 10° W–5° E) and the season NDJ (see Figure 2).
To understand how the dynamic link between the SSTA in the SETA and subsequent rainfall events in Eastern NEB develop, we first analyzed the distribution of the lagged linear regression (°C/°C) of the SSTA in SETA during NDJ(−1), with the gridded SST and surface wind anomalies in MJJ(0) during 1960–2015 (Figure 4a). This analysis highlights the link between the SSTA in SETA in NDJ(−1) and the gridded SST and surface wind anomalies over the entire tropical Atlantic basin in MJJ(0). It appears that this positive relationship passes through the oceanic portion near the eastern coast of Brazil, i.e., in the southwestern Atlantic warm pool [34,54,55], where the SITCZ signal is large (see Figure 1b). This observation supports the idea that a portion of the NDJ SSTA in SETA is transported westward to the coast of NEB. The interannual variability of the SITCZ should, then, be related to the westward propagating SSTA from the eastern part of the tropical South Atlantic. The NDJ SETA SSTA is also associated with an anomalous cyclonic surface atmospheric circulation (i.e., a convergence of surface winds) near the coast in MJJ. When located in the western part of the basin, the positive SSTA are also associated with anomalously low surface pressure and an upward vertical velocity at 500 hPa (Figure 4b).

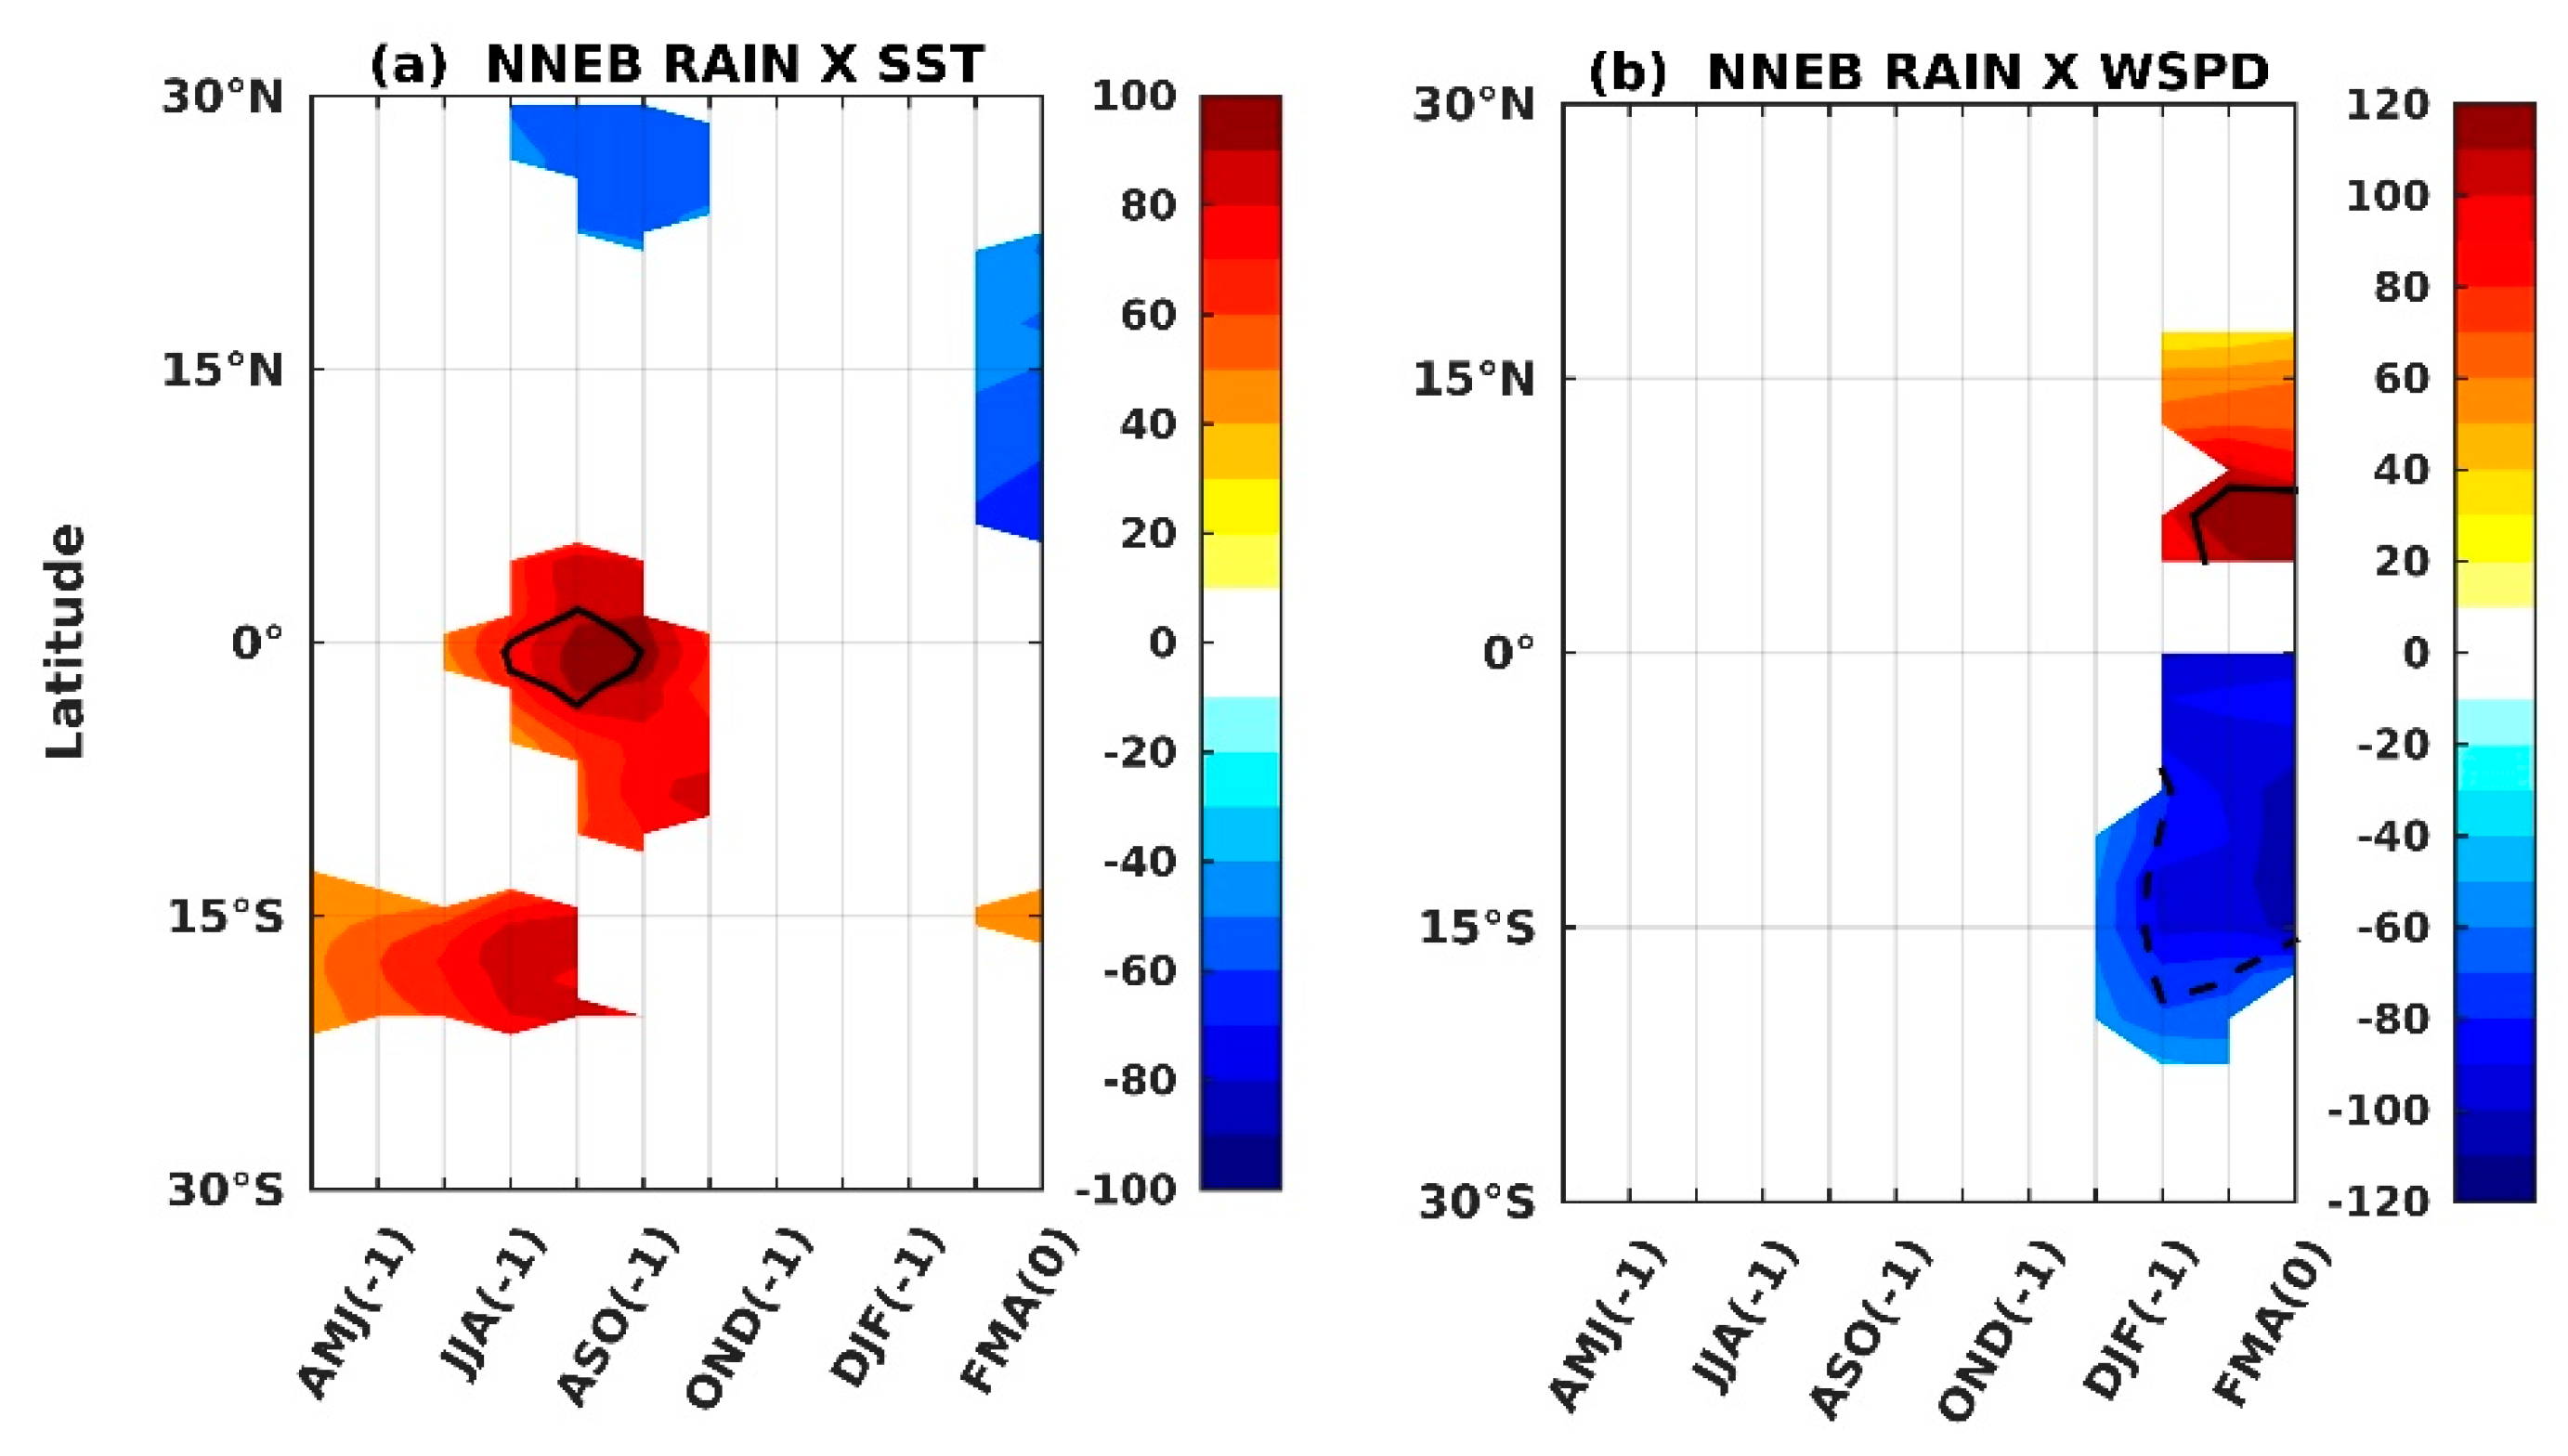
3.2. Results for Northern NEB

Figure 5a presents the linear regression/correlation coefficients (with lags) between the surface wind and SSTA in July-August-September(-1) (JAS(−1)) and Northern NEB rainfall anomalies in FMA(0) for the period 1960–2015. We show the JAS(−1) correlation/regression because our preliminary analysis indicated the highest lagged relationship between SSTA in the tropical Atlantic and FMA Northern NEB rainfall anomalies for this season. A significant positive relationship between the SST and the rainfall anomalies is observed in the tropical South Atlantic several months before the rainy season in Northern NEB. This positive relationship is located mainly in the equatorial and the eastern portions of the tropical South Atlantic (Figure 5a). For this period, the largest positive regression coefficient (~ +100 mm month−1/°C) is centered near 20° S, off the Angola-Namibia coast. However, the highest correlation coefficient (>+0.5) is marked in the eastern equatorial Atlantic and along the eastern coast of the basin. A relatively weak negative, but significant, relationship between the JAS(−1) SSTA and the FMA(0) Northern NEB rainfall anomalies is observed in the eastern equatorial Pacific. Other weak negative, but significant, relationships are observed between the JAS(−1) SSTA in the subtropical North Atlantic, the South Atlantic, and the Indian Ocean. Another region with a positive relationship is in the southeastern Pacific (near 50° S). The significant relationship noted in the different tropical basins suggests their potential link with Northern NEB rainfall variability. No clear relationship is observed between the JAS(−1) surface wind over the study region and the FMA(0) Northern NEB rainfall.
During the Northern NEB rainy season, i.e., FMA(0), the positive relationship in the tropical South Atlantic is moved to the center of the basin immediately south of the equator, and the inter-hemispheric mode is established with a large negative relationship in the tropical North Atlantic in FMA(0) (Figure 5b). This SST meridional mode in FMA is associated with a strong meridional gradient of surface wind, namely, the northeasterly (northwesterly) signal in the northern (southern) hemisphere. The negative coefficient of the SSTA and the associated anomalous southeasterly surface wind are also increased in the equatorial Pacific during Northern NEB’s rainy season. We also note a weak negative relationship for SSTA, which is associated with an abnormal westward surface wind in the equatorial Pacific during this season. Therefore, the well-known influence of the negative/positive phase of the tropical Atlantic inter-hemispheric mode and/or the La Niña/El Niño in the equatorial Pacific on the positive/negative anomalies of Northern NEB rainfall [5,7,8,10,12,13] is clearly visible, with the strongest signal occurring during the first months of the year (Figure 5b). Furthermore, a negative signal is also observed with the SSTA in the Indian Ocean.
Because the Northern NEB rainfall variability is also associated with the inter-hemispheric mode in the tropical Atlantic, we constructed a time–latitude diagram of the WET and DRY composites of the west-east (60° W–15 °E) averaged standardized SSTA, as illustrated in Figure 5c,d. For the WET composite, significant positive SSTA are noted in the tropical South Atlantic from FMA(−1) to the FMA(0), with the largest values in the equatorial Atlantic in MJJ–JAS (Figure 5c). Another considerable positive value is located in the tropical South Atlantic from DJF(−1) to FMA(0), i.e., just before and during the peak rainy season in Northern NEB. During the Northern NEB rainy season, large negative SSTA are also observed in the tropical North Atlantic, indicating a negative phase of the tropical Atlantic inter-hemispheric mode. Part of the negative SSTA observed in the tropical North Atlantic during the Northern NEB rainy season originates from the subtropical North Atlantic (between 20°–30° N) in JAS(−1) through an equatorward propagation (Figure 5c). Although the negative SSTA identified in the subtropical North Atlantic do not present significant values in JAS(−1), they correspond to the negative relationship noted between the Northern NEB rainfall anomalies and SSTA in the northeastern tropical Atlantic (Figure 5a). In the composite of the DRY events, negative SSTA are present in the tropical South Atlantic for several months, but significant negative SSTA are only observed in the equatorial Atlantic from JJA(−1) to NDJ(−1) (Figure 5d). During the peak rainy season in Northern NEB, significant positive SSTA are observed in the tropical North Atlantic, which illustrates a positive phase of the tropical Atlantic inter-hemispheric mode. However, as in Eastern NEB, the positive and negative SSTA in the tropical South Atlantic, linked to positive and negative anomalies of Northern NEB, respectively, are not symmetric. Positive SSTA in the tropical South Atlantic associated with positive rainfall anomalies are higher than negative SSTA associated with negative rainfall anomalies in Northern NEB. Part of the positive SSTA marked in the tropical North Atlantic during the first month of the calendar year also originates from the subtropical North Atlantic in JAS(−1) through an equatorward propagation in the composite of DRY events (Figure 5d). The difference between WET and DRY composites of SSTA corresponding to Northern NEB rainy season has the same evolution, with significant positive SSTA noted in the WET composite (Figure 5e). This reinforces the observation that positive SSTA in the tropical South Atlantic linked to positive anomalies of Northern NEB’s rainfall are larger than negative SSTA associated with negative anomalies of rainfall. The equatorward displacement of SSTA from the subtropical North Atlantic is also observed in the difference between the WET and DRY composites.
Using the same investigative methodology as in the Eastern NEB scenario, we now consider the most suitable oceanic zone and period to select an oceanic index (i.e., SSTA) that can help in forecasting the subsequent rainy season in Northern NEB. Based mainly on the SST vs. rainfall correlation/regression coefficient shown in Figure 5a, we consider the equatorial SSTA index during JAS(-1). For convenience and to connect our results with other historical studies, we chose the ATL3 region (3° N–3° S, 20°–0° W), which shows the highest lagged correlation coefficient with Northern NEB rainfall. This ATL3 region was previously defined in [56] and has been used by several other authors [26,57].
For the complete series of 1960–2015, the correlation between the JAS(−1) SSTA in the ATL3 and the FMA(0) rainfall anomalies in Northern NEB (i.e., the SSTA time series leads the rainfall anomaly time series by more than 6 months) is +0.42. Considering the period in the 1980’s (1980–2015), which corresponds to the period of the strengthening of the relationship between the boreal summer Atlantic Niño/Niña and the following boreal winter Pacific Niña/Niño [26], the correlation between the JAS(−1) ATL3/SSTA and the FMA(0) rainfall in Northern NEB reaches +0.60. No significant relationship is observed between the JAS(−1) ATL3/SSTA and the FMA(0) rainfall anomalies in Northern NEB for the period of 1960–1980. Figure 5f displays the 25 y (centered) running correlation between the JAS(−1) ATL3 SSTA and the FMA(0) rainfall anomalies in Northern NEB for the period 1960–2015. Although the correlation is significant along the study period, except the first point (period 1960–1984) where the correlation is not significant, a clear increase of the correlation can be observed from the 1980’s to recent years. This increase in correlation could be linked to the 1970’s climate shift discussed earlier. Therefore, the strengthening of the relationship between the summer equatorial Atlantic SSTA and the FMA rainfall anomalies in Northern NEB potentially emerges from the change in the Atlantic–Pacific Niño connection during recent decades. The increase in this relationship could also come from the better quality of the observations from the 1970’s. This change in the relationship between oceanic–atmospheric variables and the rainfall anomalies, according to the study period, is also observed for the Eastern NEB case (not shown). Indeed, the spatial distribution of the correlation coefficient between the MJJ(0) Eastern NEB rainfall anomalies and the NDJ(−1) gridded SSTA exhibits high significant positive values (>0.5) in a wide part of the tropical South Atlantic, including the SETA and the ATL3, for the period 1980–2015 (not shown). A weak significant negative relationship is also observed between the Eastern NEB rainfall and SSTA in the eastern equatorial Pacific for the period 1980–2015. However, the likely physical mechanism that links the tropical South Atlantic SSTA to the Eastern NEB rainfall anomalies is the same for the reduced (1980–2015) and entire (1960–2015) study periods.
We also analyze the physical processes that link the JAS(−1) ATL3/SSTA to the FMA(0) Northern NEB rainfall anomalies for the entire study period of 1960–2015. The correlation between the JAS(−1) ATL3/SSTA and the FMA(0) gridded SSTA in the global ocean indicates a persistence of a significant positive relationship in the equatorial South Atlantic from JAS(−1) to FMA(0) (not shown). Positive relationships are also observed in the western tropical Pacific, as well as a weak negative correlation with the Pacific Niño for the entire period of 1960–2015. The correlation between the JAS(−1) ATL3/SSTA and the FMA(0) surface wind anomalies presents equatorward surface wind anomalies in the tropical North Atlantic. However, no clear physical processes that link the JAS(−1) ATL3/SSTA and the FMA(0) tropical North Atlantic surface winds with the Northern NEB rainfall in FMA(0) are determined for the entire period of 1960–2015.
Accordingly, we now focus on the analysis of the Northern NEB case for all years of the period 1980–2015 that presents a highly positive relationship between JAS(−1) ATL3/SSTA and the FMA(0) rainfall anomalies in Northern NEB.
Figure 6a is the latitude–time diagram of the linear correlation/regression of the west-east (60° W–15° E) averaged SSTA with FMA(0) rainfall anomalies in Northern NEB for the period 1980–2015. This figure displays a positive coefficient inside the tropical South Atlantic from MAM(−1) to SON(−1), i.e., more than 6 months before the FMA(0) rainy season in Northern NEB. Two regions with the strongest positive relationships (>+80 mm month−1/°C) are noticeable during this period: the first one is in the 15°–20° S latitude band in JJA(−1), which is associated with the Benguela Niño, and the second one is in the equatorial band in JAS(−1), which is associated with the Atlantic equatorial mode (see Figure 5a). Previous studies have reported a connection between these two regions [57,58,59]. One of the principal mechanisms that connect these two regions are Kelvin waves, which are excited by zonal wind anomalies in the equatorial west Atlantic and propagate along the equator and the African coast [59,60]. The time lag between these regions with the largest positive relationships agrees with the results in [57,59], which indicated that the Benguela Niño precedes the equatorial Atlantic mode by an average of one to three months. During the first months of the following year, an inter-hemispheric mode pattern, negative coefficient in the northern hemisphere, and positive coefficient in the southern hemisphere, are observed, although with a small area of positive coefficients in the tropical South Atlantic that is centered approximately at 15° S. These results, once again, suggest that the positive/negative SSTA in the tropical South Atlantic during the previous boreal summer were followed by positive/negative rainfall anomalies during the FMA(0) in Northern NEB.
For the time–latitude diagram of the regression of west-east (60° W–15° E) averaged surface wind speed anomalies with FMA(0) rainfall anomalies in Northern NEB, an inter-hemispheric mode pattern is also observed, with positive values in the Northern Hemisphere and negative values in the Southern Hemisphere during the boreal winter of the year(0) (Figure 6b). No significant relationship is observed with the surface wind in the tropical south Atlantic, i.e., in the equatorial and Benguela Niños regions, during the last 6 months of the previous calendar year, as was noted for the SSTA.
Like for the scenario in the Eastern NEB, we investigated the dynamical link between the SSTA in the ATL3 and the rainfall anomaly events in Northern NEB for the period 1980–2015.
The spatial distribution of the lagged linear correlation/regression between the gridded SST (°C/°C) and surface wind (u and v, m s−1/°C) anomalies over the global ocean in FMA(0), and the SSTA inside ATL3 in JAS(−1), for the period 1980–2015 is presented in Figure 7a. This figure displays the link between the JAS(−1) SSTA in the ATL3 and the gridded SST and surface wind anomalies over the global ocean during the peak of the rainy season in Northern NEB. The signal of SSTA regression is largely negative throughout the central and eastern equatorial Pacific, indicating a high link between the JAS(−1) Atlantic Niño and the FMA(0) Pacific Niña. This observation is consistent with previous results by [26], who suggested a relationship between the boreal summer ATL3 and the boreal winter Pacific Niño for the period 1979–2001. No significant relationship is observed in the tropical Atlantic from SSTA, suggesting that the positive anomalies of the ATL3/SSTA in JAS(−1) is not generally linked to the SSTA in the tropical Atlantic during the following FMA. With respect to the response of surface atmospheric circulation, northeasterly wind anomalies are especially marked in the tropical North Atlantic. The signal observed with the surface winds suggests that the response of the tropical North Atlantic to the boreal summer ATL3/SSTA is more significant through the surface atmospheric circulation than through the SSTA. This indicates that the SST inter-hemispheric mode associated with Northern NEB rainfall variability in FMA(0) is not significantly related to the JAS(−1) ATL3 SSTA. The weak (no significant) relationship observed between the JAS(−1) ATL3/SSTA and the FMA(0) SST inter-hemispheric mode in the tropical Atlantic, mainly in the tropical North Atlantic, indirectly suggests a weak relationship between the FMA ENSO and the FMA tropical North Atlantic SSTA, at least for the period 1980–2015. The analysis of the correlation between the FMA(0) Niño3 (5° S–5° N; 150° W–90° W) SSTA and the FMA(0) gridded SST and surface winds anomalies also indicates a weak significant positive correlation value (less than +0.5) with SSTA. However, a high significant northward surface wind relationship is observed in the tropical North Atlantic (not shown). Note that no significant correlation is observed between the FMA(0) Niño3 SSTA and the FMA(0) tropical South Atlantic SSTA. Accordingly, the ENSO influence in the tropical North Atlantic is more significant on the surface atmospheric circulation than on the SSTA for the period 1980–2015. The weak positive relationship between the ENSO and the tropical North Atlantic SSTA could be associated with the early conditions of SSTA in the tropical Atlantic. These results are coherent with previous results [5,24,61], who indicated a preconditioning role of tropical Atlantic variability on the development of the ENSO teleconnection. Additionally, a recent study in [62] indicated that the positive relationship between the El Niño and the tropical North Atlantic SSTA is not stationary and depends on the Atlantic multi-decadal oscillation.
The distribution of the lagged linear regression between the JAS(−1) ATL3/SSTA and the gridded velocity potential and stream function anomalies at 200 hPa over the global ocean in FMA(0) exhibits two cyclonic motions on both sides of the equator and convergent motion over the tropical Pacific (Figure 7b). In the Atlantic, a convergent motion is observed at 200 hPa over the Northern Hemisphere with two anticyclonic motions on both sides of the equator at 200 hPa. These results support a teleconnection between the JAS(−1) Atlantic Niño and the FMA(0) Pacific Niña by affecting the Walker circulation [26,28], which, in turn, significantly influences the northern hemisphere’s atmospheric circulation in the Atlantic. Although no significant relationship has been observed between the JAS(−1) ATL3/SSTA and the FMA(0) tropical Atlantic SSTA (or the inter-hemispheric mode), the atmospheric circulation in the tropical North Atlantic induces anomalous latitudinal displacement of the ITCZ. This agrees with the results in [17], who suggested that a part of the seasonal rainfall over Northern NEB is directly influenced by the Walker circulation anomalies induced in the eastern tropical Pacific by modulating the ITCZ position in the tropical Atlantic.

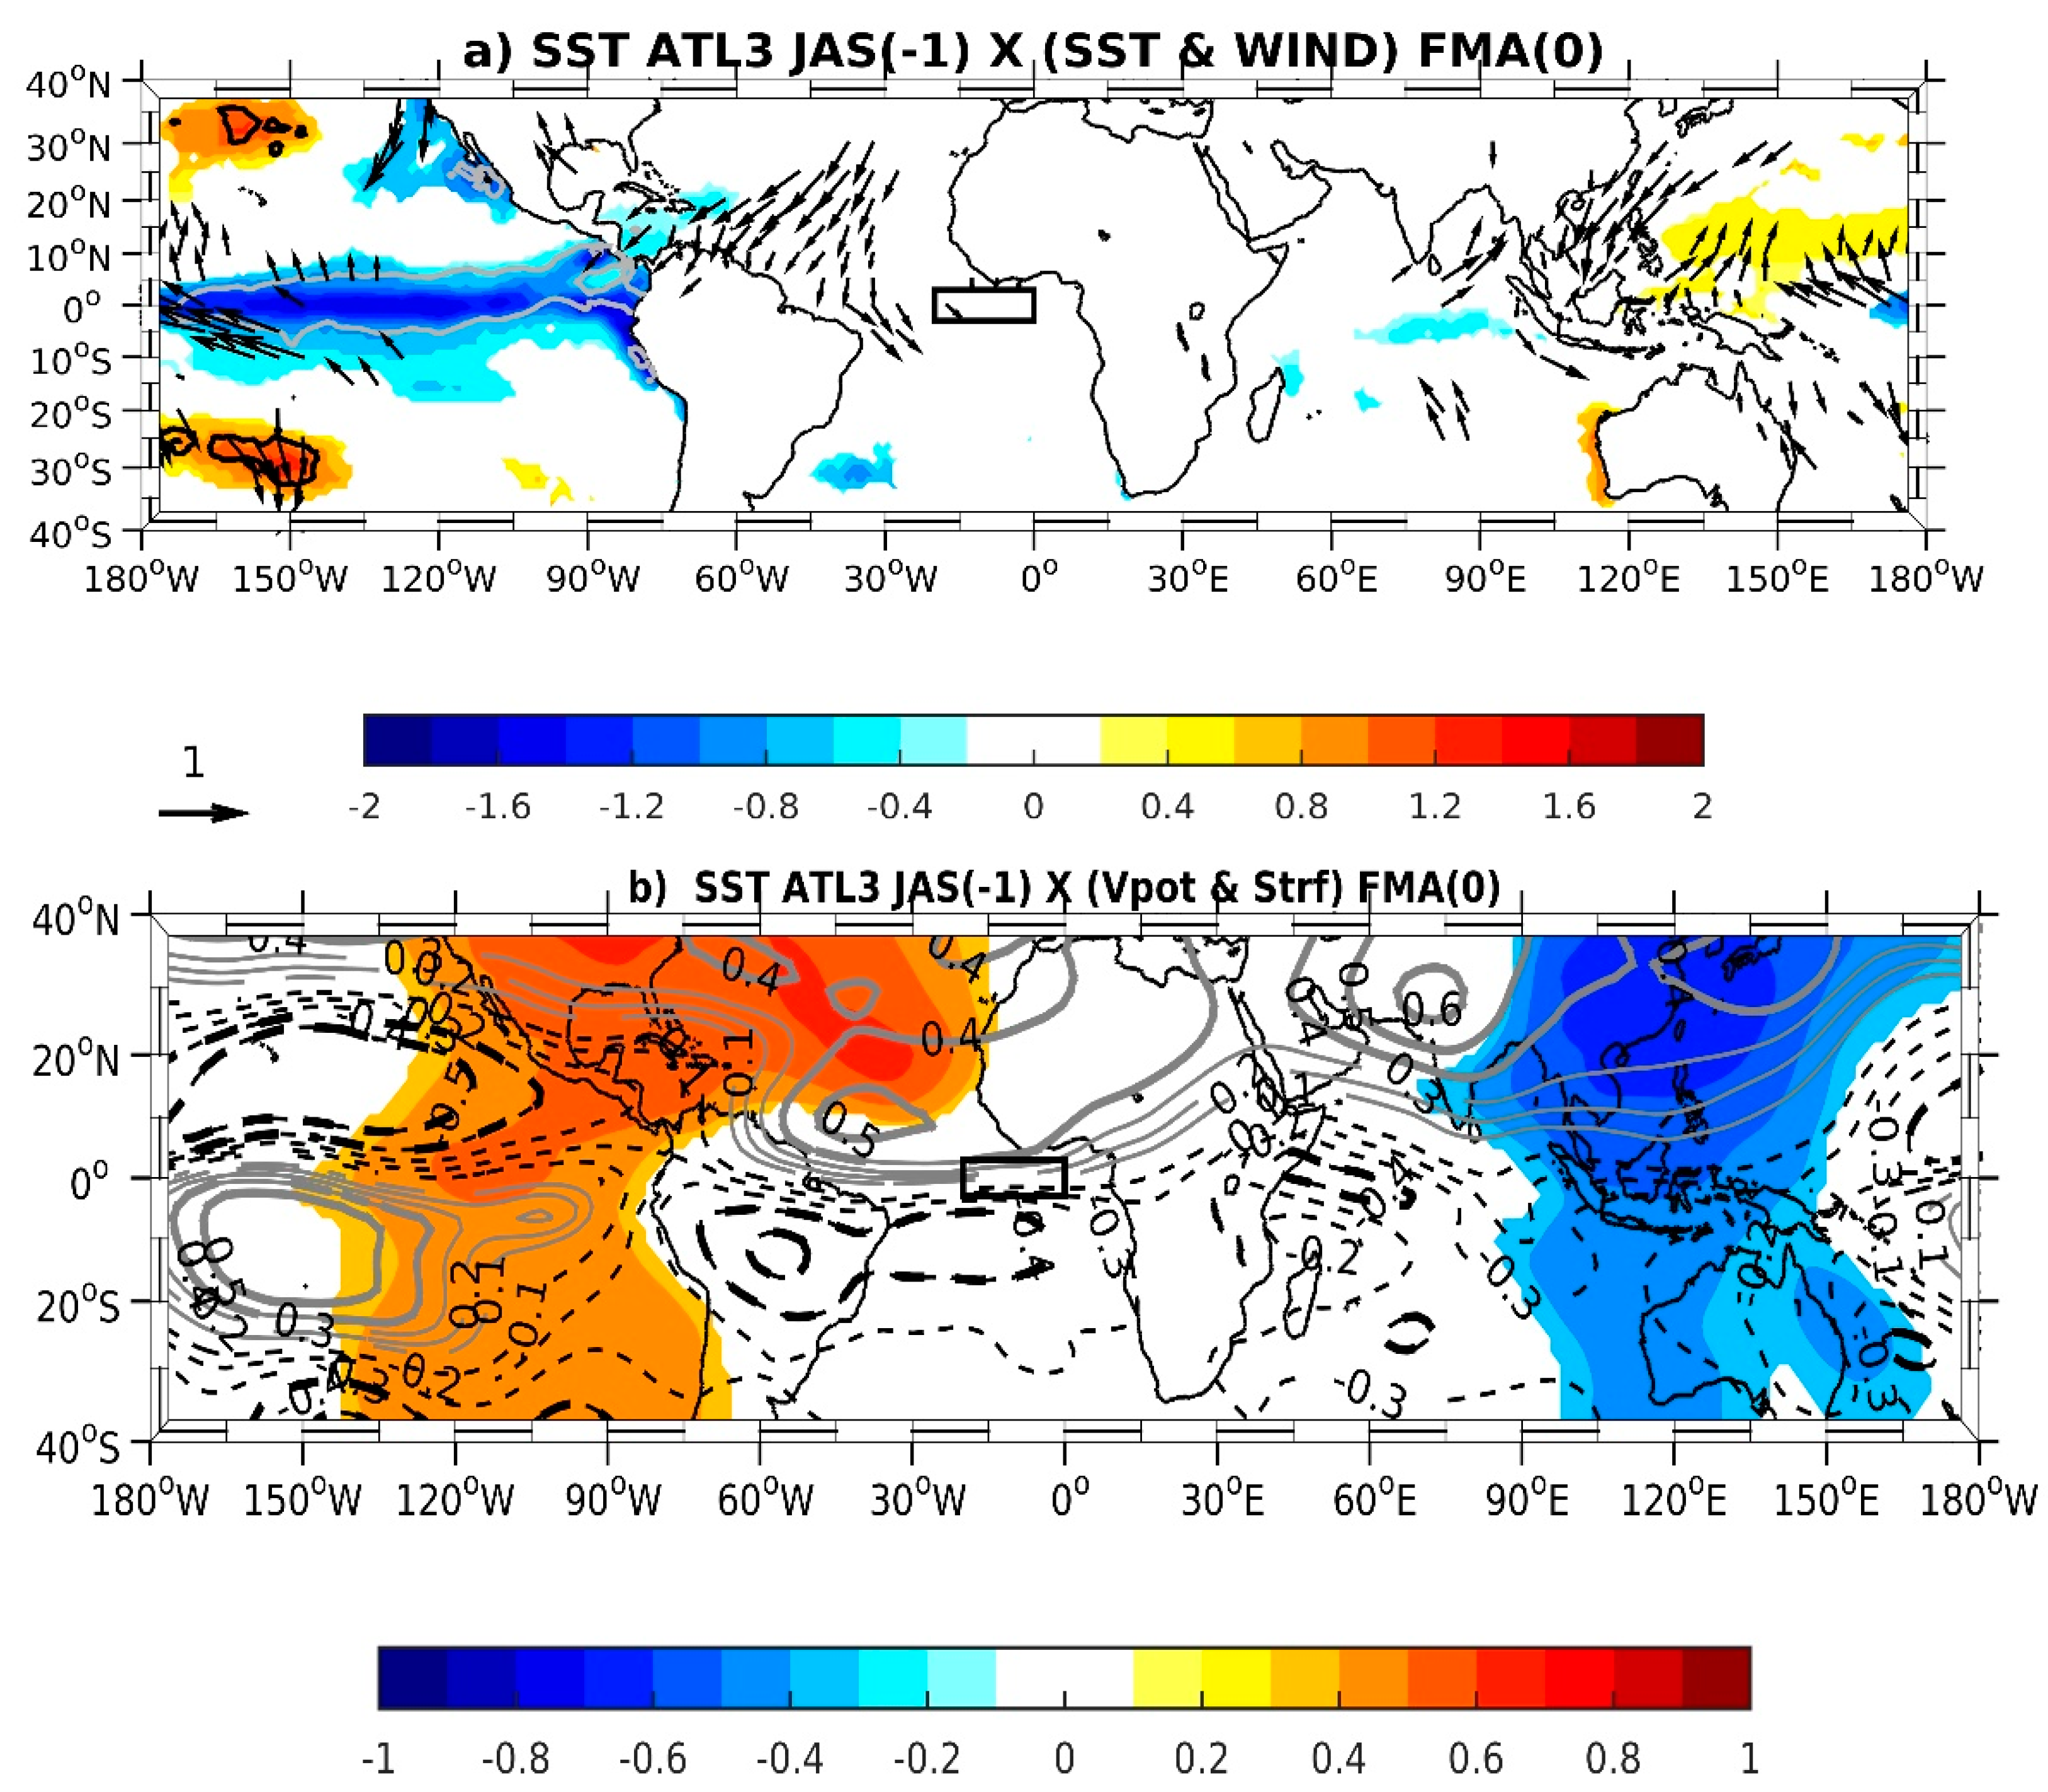
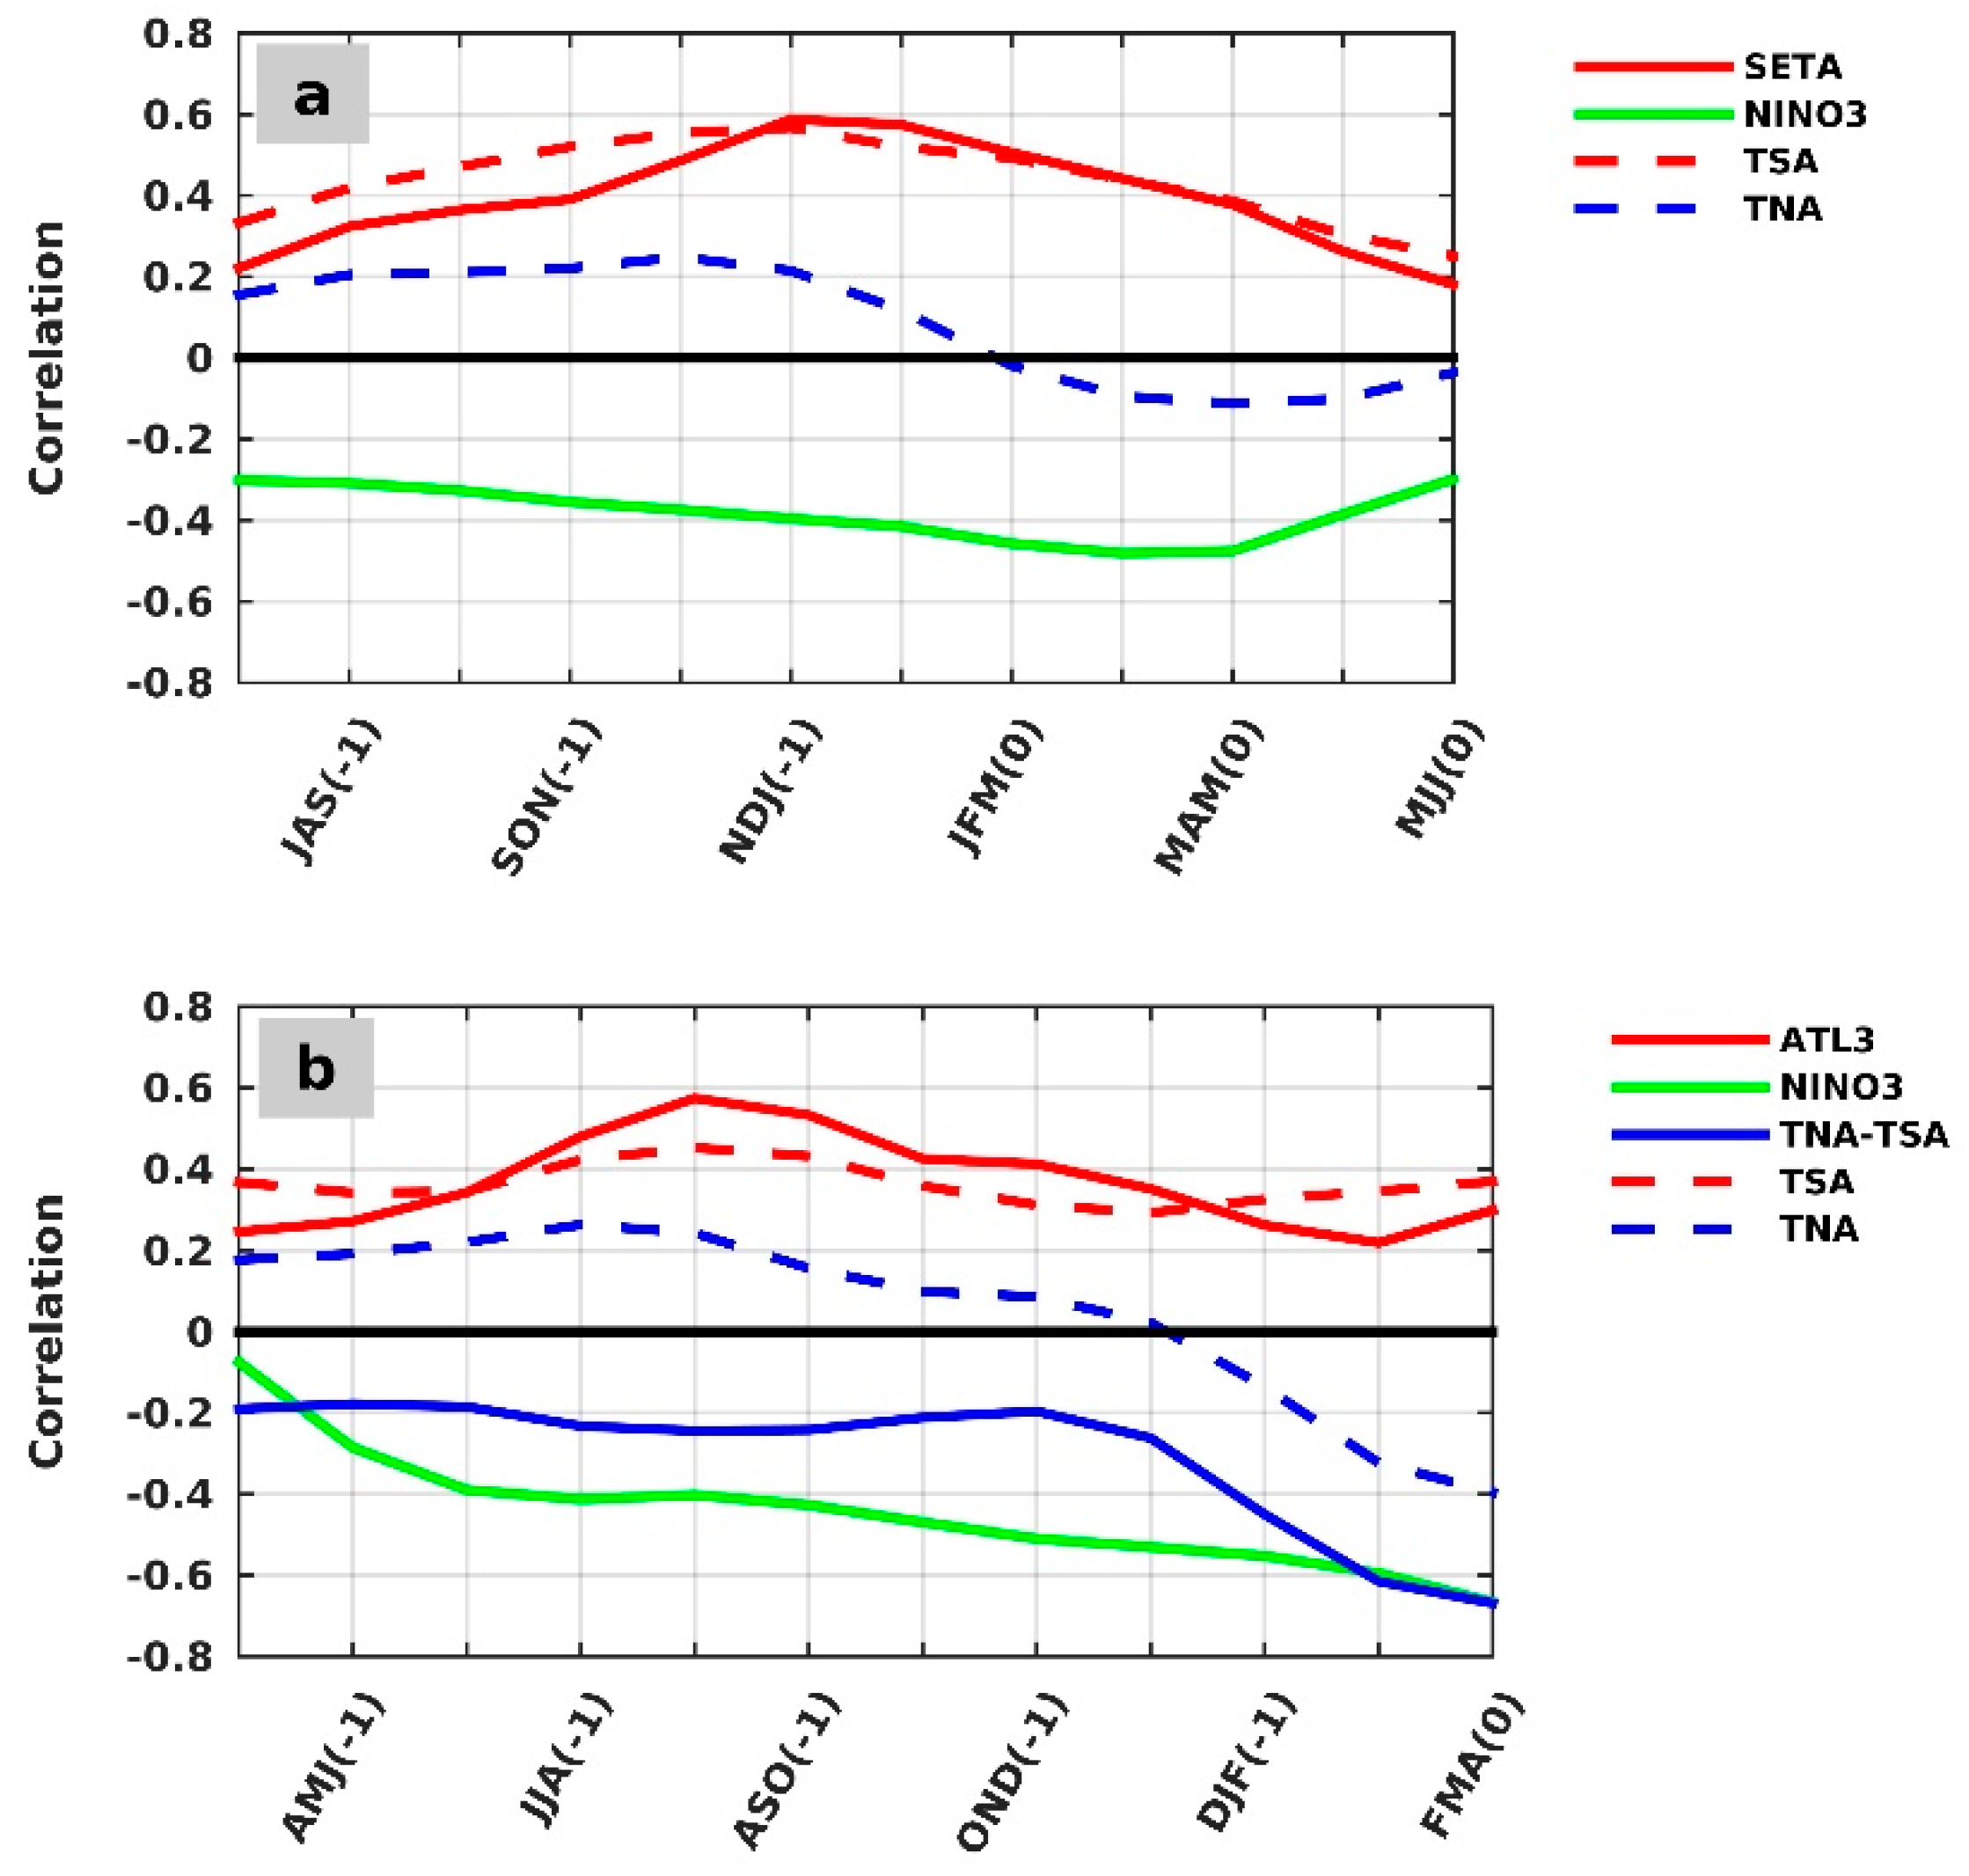
3.3. Forecast Ability of the Southeastern Tropical Atlantic and Atlantic Niño Indexes

In this section, we test the ability of the southeastern tropical Atlantic (SETA; 10° S–20° S, 10° W–5° E) and the Atlantic Niño (ATL3; 3° N–3° S, 20° W–0°) indexes to forecast, respectively, the Eastern and Northern NEB rainfall with a 6 month lead time using cross-validation for the period 1980–2015. The cross-validation method consists in calculating the amount of rainfall using the linear regression coefficients obtained after excluding from the series the year for which the rainfall is predicted.
For the Eastern NEB, the correlation between the MJJ rainfall predicted from the NDJ SETA and the observed MJJ rainfall is 0.51, with a root mean square error (rmse) of 109 mm (Table 3). We also evaluate the forecast ability of the NDJ NINO3 (5° N–5° S, 150° W–90° W) index that shows a significant weak negative relationship with the MJJ Eastern NEB rainfall for the period 1980–2015. The correlation between the MJJ Eastern NEB rainfall predicted from NDJ NINO3 and the observed MJJ rainfall is weak (0.29). However, when we combine the SETA and NINO3 indexes (multiple linear regression), the prediction skill is significantly increased with a correlation of 0.76 and a rmse of 83 mm. The correlation between the NDJ SETA and the NDJ NINO3 indexes is 0.23 (not significant at 95% confidence level), i.e., these two indexes can be considered independent.
For the Northern NEB case, we use the JAS ATL3, the JAS NINO3 and the JAS northeastern subtropical Atlantic (NESTA; 20° N–35° N, 45° W–20° W) indexes because the three regions are significantly (at 95% confidence level) correlated with the FMA Northern NEB rainfall. The correlation between JAS ATL3 and JAS NINO3 indexes is −0.32 and the correlation between JAS ATL3 and JAS NESTA indexes is 0.14 (not significant at a 95% confidence level). The FMA Northern NEB rainfall predicted from the JAS ATL3 and the FMA observed rainfall present a correlation of 0.52 with a rmse of 137 mm. The correlation of the JAS NINO3 prediction of the FMA rainfall with the observed FMA rainfall is 0.27, and the rmse is 154 mm. When combining the ATL3 and NINO3 indexes, the prediction skill is not different from the skill obtained using the ATL3 index alone. However, the combination of the JAS ATL3 and JAS NESTA improves the prediction skill of the FMA Northern NEB rainfall. The correlation coefficient is 0.65 and the rmse is 121 mm.
Therefore, a very high skill is reached when the NDJ SETA and NDJ NINO3 are combined to predict the MJJ Eastern NEB, although the NDJ SETA alone already shows a good result for the period 1980–2015. For the prediction of the FMA Northern NEB rainfall, the highest skill is achieved when we combine ATL3 and the NESTA, though ATL3 alone also presents a good skill.

4. Summary and Conclusions

The tropical South Atlantic is a key region that fully contributes to the seasonal and interannual variability of the rainy seasons over Northeast Brazil. The climatic impact of the tropical South Atlantic on Eastern NEB is a determining factor related to abnormal episodes during the rainfall season, i.e., in MJJ. Several months before this rainy season, and particularly during the previous austral summer, SSTA appeared in the southeastern tropical Atlantic near the African coast. Then they propagated northwestward (associated with a coherent modulation of the trade winds), modifying the convective system above the southwestern Atlantic warm pool near the Northeast Brazilian coast and contributing to abnormal episodes during the subsequent rainy season in Eastern NEB. The relationship with SSTA is positive, i.e., a warm/cold SST event is associated with wet/dry episodes in Eastern NEB. Interestingly, positive and negative SSTA that were linked to the WET and DRY episodes, respectively, are not symmetric in terms of the westward propagation of the anomalies. The high positive SSTA start during the last six months (boreal summer and fall) of their previous calendar year in the eastern portion of the basin and reached the western portion during the first months of the following year. Moreover, the negative anomalies spread from east to west during the boreal winter and spring of the calendar year. The convective activities over the southwestern Atlantic warm pool, which are maintained by the seasonal development of the southern ITCZ during the rainy season in Eastern NEB, appear to be the predominant component linked to the seasonal rainfall. This scenario between the SSTA in the tropical South Atlantic and the rainfall anomalies in Eastern NEB is essentially confined to these two regions, even if a weak negative relationship exists with ENSO events. Figure 8a displays the seasonal evolution of the linear correlation between MJJ rainfall anomalies in Eastern NEB and the SETA, moving SSTA from JJA(−1) to MJJ(0) for the period 1980–2015. This Figure illustrate that the highest significant positive correlation (~ +0.6) is observed in NDJ. The positive relationship is also significant in NDJ when we consider the entire tropical South Atlantic SSTA. However, the tropical North Atlantic does not present any significant relationship with the MJJ rainfall anomalies in Eastern NEB. Therefore, the SSTA index in the southeastern tropical Atlantic appears as a valuable index that should be used by climate centers for forecasting the MJJ seasonal rainfall in Eastern NEB with about a 6 month lead time (Figure 8a). Interestingly, the combination of the southeastern tropical Atlantic SSTA index with the Niño3 index clearly improves the nearly 6 month forecast of Eastern NEB, especially since the 1970’s climate shift.
The Northern NEB scenario is different from that of Eastern NEB, although relevant similarities exist. Indeed, for both regions, strong SSTA occur in the center and eastern portions of the tropical South Atlantic during the boreal summer and fall of the previous calendar year. The Northern NEB scenario is positive (i.e., warm/cold SST associated with more/less rainfall). Here, again, the amplitudes of the composites of warm and cold SSTA are not symmetric. Warm events in the ATL3 in JAS are more marked than cold events. This suggests that positive ATL3 SSTA are better associated with more Northern NEB rainfall than negative ATL3 SSTA are associated with less rainfall. Furthermore, a progressive establishment of the wind/SST gradient over the entire tropical Atlantic was observed (during its positive phase) with a warm SST/relaxation of the southeasterly winds and a cold SST/intensification of the northeasterly winds. The inverse occurs during the negative phase. These dynamics respond to the wind/SST mechanism throughout the tropical Atlantic. This inter-hemispheric mode (already well known for its impact on rainfall in NEB) is directly linked to the meridional displacement of the ITCZ, i.e., an abnormal southward (northward) displacement that favors strong (weak) rainfall in NEB, particularly in Northern NEB. Our results support the idea that both ATL3 (or the tropical South Atlantic) and the inter-hemispheric mode in the tropical Atlantic (highest negative correlation coefficient in FMA(0)) are valuable for the predictability of seasonal rainfall in Northern NEB. However, the predictive skill, more than 6 months in advance, comes mainly from tropical South Atlantic (or ATL3) SSTA, whereas shorter lead time predictions may better benefit from the Atlantic SST inter-hemispheric mode (Figure 8b). The highest relationship between the inter-hemispheric mode and the Northern NEB rainfall, noticed for shorter lead time, is mainly associated with SSTA in the tropical North Atlantic (Figure 8b). It is shown that the July–September ATL3 and the December–March inter-hemispheric mode are not significantly correlated. Therefore, these two indexes will be of great importance in predicting Northern NEB rainfall. Moreover, the present study confirms that the climate variability in Northern NEB is strongly linked to ENSO events. Although the Niño3 index is negatively correlated with the Northern NEB rainfall from a long leading time, the largest negative relationship is observed just before and during the rainy season (Figure 8b). These observations agree with the results of earlier studies [5,13,24], which showed a negative relationship between the SSTA in the tropical South Atlantic and the opposite phase of ENSO events in the Pacific several months later. However, the teleconnection between the boreal summer Atlantic Niño and the boreal winter Pacific Niño and their influence on the rainfall in Northern NEB is remarkably high since the recent 1970’s climate shift. Significant weak negative relationship is also noted between the FMA(0) Northern NEB rainfall and the JAS(−1) SSTA in the northeast subtropical Atlantic, suggesting a potential leading influence of this region on the rainfall. The combination of the JAS Atlantic Niño SSTA index with the JAS northeast subtropical Atlantic SSTA enlarges the 6 month forecast ability of the Northern NEB rainfall. It is important to note that our study does not show significant relationship between the SSTA in the Atlantic Cold Tongue region (i.e., ATL3) during the boreal summer and the inter-hemispheric mode of SST in the following boreal spring. Nonetheless, the relationship, which transits through the central-eastern tropical Pacific, is significant for the surface and high level (200 hPa) atmospheric circulation in the tropical North Atlantic.
Currently, several climate forecast centers are already using the Pacific Niño indexes and the Atlantic “dipole” index to forecast the seasonal rainfall in NEB (mainly in Northern NEB), but this prediction is provided for shorter lead time, i.e., just before and/or during the rainy season. Therefore, the surface conditions in the tropical South Atlantic, and especially SSTA near the African coast and in the eastern equatorial region, are potential candidates that may help predict precipitation anomalies in NEB several months in advance. It should be noted that a combination of the tropical South Atlantic indexes with the Niño3 and the northeast subtropical Atlantic could clearly improve the 6 month forecast ability of the NEB rainfall. It thus suggests that in situ measurements and long-term monitoring systems would be very relevant in this poorly documented area, that could be achieved, e.g., through an extension of the “Prediction and Research Moored Array in the Tropical Atlantic” PIRATA network [63,64,65]. Due to the complexity of the relationships between oceanic-atmospheric variables linked to rainfall, a set of basin-scale dedicated coupled model experiments could help to improve the dynamical understanding of these geophysical mechanisms.

Author Contributions

Conceptualization, G.A.H.-G., J.S. and M.A.; Formal analysis, G.A.H.-G.; Funding acquisition, M.A. and E.S.P.R.M.; Investigation, G.A.H.-G., J.S., M.A., G.C., B.B., D.F. and E.S.P.R.M.; Methodology, G.A.H.-G., J.S. and G.C.; Project administration, M.A. and E.S.P.R.M.; Supervision, J.S., G.C. and B.B.; Writing—original draft, G.A.H.-G. and J.S.; Writing—review & editing, G.A.H.-G., J.S., G.C., B.B., D.F. and E.S.P.R.M.

Acknowledgments

This work represents collaboration by the INCT AmbTropic, the Brazilian National Institute of Science and Technology for Tropical Marine Environments, CNPq/FAPESB (grants 565054/2010-4 and 8936/2011) and the Brazilian Research Network on Global Climate Change FINEP/Rede CLIMA (grants 01.13.0353-00). This study is also a component of the project “Elaboração de Estudos de Suporte ao Planejamento e à Gestão de Sistemas Hídricos no Nordeste, com foco no Abastecimento Urbano e na Operação de Infraestruturas Hídricas de Uso Múltiplo”, Edital 01/2018 - FUNCEME. J. S. thanks FUNCEME (Edital 01/2016) for its support. at Fortaleza, CE, Brazil. This paper is also a component of the Project Pólo de Interação para o Desenvolvimento de Estudos conjuntos em Oceanografia do Atlântico Tropical (PILOTE), CNPq-IRD grant 490289/2013-4. Part of this work and this publication was funded by the EU FP7/2007-2013 under Grant 603521, PREFACE. The authors are grateful to the anonymous reviewers for their useful comments and suggestions. We acknowledge the WHOI OAFlux project (http://oaflux.whoi.edu) funded by the NOAA Climate Observations and Monitoring (COM) program. NCEP Reanalysis data were provided by the NOAA/OAR/ESRL PSD, Boulder, Colorado, USA, and are available at http://www.esrl.noaa.gov/psd/. The QuikSCAT and ASCAT data were supplied by CERSAT, Ifremer and are available at ftp://ftp.ifremer.fr/ifremer/cersat/. GPCC Precipitation data are provided by the NOAA/OAR/ESRL PSD, Boulder, Colorado, USA, from their Web site at https://www.esrl.noaa.gov/psd/.

Conflicts of Interest

The authors declare that there is no conflict of interest regarding the publication of this paper.

References

  1. Hastenrath, S.; Heller, L. Dynamics of climatic hazards in Northeast Brazil. Q. J. R. Meteorol. Soc. 1977, 103, 77–92. [Google Scholar] [CrossRef]
  2. Moura, A.D.; Shukla, J. On the dynamics of droughts in northeast Brazil: Observations, theory and numerical experiments with a general circulation model. J. Atmos. Sci. 1981, 38, 2653–2675. [Google Scholar] [CrossRef]
  3. Servain, J.; Séva, M. On relationship between tropical Atlantic sea surface temperature, wind stress and regional precipitation indices: 1964–1984. Ocean-Air Interact. 1987, 1, 183–190. [Google Scholar]
  4. Hastenrath, S. Prediction of Northeast Brazil Rainfall Anomalies. J. Clim. 1990, 3, 893–904. [Google Scholar] [CrossRef] [Green Version]
  5. Servain, J. Simple climatic indices for the tropical Atlantic Ocean and some applications. J. Geophys. Res. 1991, 96, 15137–15146. [Google Scholar] [CrossRef]
  6. Ward, M.N.; Folland, C.K. Prediction of seasonal rainfall in the North Nordeste of Brazil using eigenvectors of Sea Surface Temperature. Int. J. Climatol. 1990, 11, 711–743. [Google Scholar] [CrossRef]
  7. Hastenrath, S.; Greischar, L. Circulation mechanisms related to Northeast Brazil rainfall anomalies. J. Geophys. Res. Atmos. 1993, 98, 5093–5102. [Google Scholar] [CrossRef]
  8. Hastenrath, S.; Greischar, L. Further work on the prediction of Northeast Brazil rainfall anomalies. J. Clim. 1993, 6, 743–758. [Google Scholar] [CrossRef]
  9. Nobre, P.; Shukla, J. Variation of sea surface temperature, wind stress, and rainfall over the tropical Atlantic and South America. J. Clim. 1996, 9, 2464–2479. [Google Scholar] [CrossRef]
  10. Chang, P.; Ji, L.; Li, H. A Decadal Climate Variation in the Tropical Atlantic Ocean from Thermodynamic Air-Sea Interactions. Nature 1997, 385, 516–518. [Google Scholar] [CrossRef]
  11. Hastenrath, S. Exploring the climate problems of Brazil’s Nordeste: A review. Clim. Chang. 2012, 112, 243–251. [Google Scholar] [CrossRef]
  12. Marengo, J.A.; Torres, R.R.; Alves, L.M. Drought in Northeast Brazil-past, present, and future. Theor. Appl. Climatol. 2017, 129, 1189–1200. [Google Scholar] [CrossRef]
  13. Nobre, P.; Marengo, J.A.; Cavalcanti, I.F.A.; Obregon, G.; Barros, V.; Camilloni, I.; Campos, N.; Ferreira, A.G. Seasonal-to-decadal predictability and prediction of South American Climate. J. Clim. 2006, 19, 5988–6004. [Google Scholar] [CrossRef]
  14. Uvo, C.R.B.; Repelli, C.A.; Zebiak, S.E.; Kushnir, Y. The relationships between tropical Pacific and Atlantic SST and northeast Brazil monthly precipitation. J. Clim. 1998, 11, 551–562. [Google Scholar] [CrossRef]
  15. Saravanan, R.; Chang, P. Interaction between Tropical Atlantic Variability and El Niño-Southern Oscillation. J. Clim. 2000, 13, 2177–2194. [Google Scholar] [CrossRef]
  16. Chiang, J.C.H.; Kushnir, Y.; Zebiak, S.E. Interdecadal changes in eastern Pacific ITCZ variability and its influence on the Atlantic ITCZ. Geophys. Res. Lett. 2000, 27, 3687–3690. [Google Scholar] [CrossRef] [Green Version]
  17. Chiang, J.C.H.; Kushnir, Y.; Giannini, A. Deconstructing Atlantic ITCZ variability: Influence of the local cross-equatorial SST gradient, and remote forcing from the eastern equatorial Pacific. J. Geophys. Res. 2002, 107, 1–19. [Google Scholar] [CrossRef]
  18. Giannini, A.; Chiang, J.C.H.; Cane, M.A.; Kushnir, Y.; Seager, R. The ENSO Teleconnection to the Tropical Atlantic Ocean: Contributions of the Remote and Local SSTs to Rainfall Variability in the Tropical Americas. J. Clim. 2001, 14, 4530–4544. [Google Scholar] [CrossRef]
  19. Rodrigues, R.R.; McPhaden, M.J. Why did the 2011–2012 La Niña cause a severe drought in the Brazilian Northeast? Geophys. Res. Lett. 2014, 41, 1012–1018. [Google Scholar] [CrossRef]
  20. Kayano, M.T.; Andreoli, R.V. Relationships between rainfall anomalies over northeastern Brazil and the El Niño–Southern Oscillation. J. Geophys. Res. 2006, 111, D13101. [Google Scholar] [CrossRef]
  21. Kayano, M.T.; Andreoli, R.V.; Souza, R.A.F. Evolving anomalous SST patterns leading to ENSO extremes: Relations between the tropical Pacific and Atlantic Oceans and the influence on the South American rainfall. Int. J. Clim. 2011, 31, 1119–1134. [Google Scholar] [CrossRef]
  22. Marengo, J.A.; Alves, L.M.; Alvala, R.C.S.; Cunha, A.P.; Brito, S.; Moraes, O.L.L. Climatic characteristics of the 2010–2016 drought in the semiarid Northeast Brazil region. Ann. Braz. Acad. Sci. 2017, 90, 1973–1985. [Google Scholar] [CrossRef]
  23. Sun, L.; Moncunill, D.F.; Li, H.; Moura, A.D.; Filho, F.D.A.D.S.; Zebiak, S.E. An operational dynamical downscaling prediction system for Nordeste Brazil and the 2002–04 real-time forecast evaluation. J. Clim. 2006, 19, 1990–2007. [Google Scholar] [CrossRef]
  24. Mélice, J.L.; Servain, J. The tropical Atlantic meridional SST gradient index and its relationships with the SOI, NAO and Southern Ocean. Clim. Dyn. 2003, 20, 447–464. [Google Scholar] [CrossRef]
  25. Keenlyside, N.S.; Latif, M. Understanding Equatorial Atlantic Interannual Variability. J. Clim. 2007, 20, 131–142. [Google Scholar] [CrossRef] [Green Version]
  26. Rodríguez-Fonseca, B.; Polo, I.; Garcia-Serrano, J.; Losada, T.; Mohino, E.; Mechoso, C.R.; Kucharski, F. Are Atlantic Niños enhancing Pacific ENSO events in recent decades? Geophys. Res. Lett. 2009, 36, L20705. [Google Scholar] [CrossRef]
  27. Keenlyside, N.S.; Ding, H.; Latif, M. Potential of equatorial Atlantic variability to enhance El Niño prediction. Geophys. Res. Lett. 2013, 40, 2278–2283. [Google Scholar] [CrossRef]
  28. Ding, H.; Keenlyside, N.S.; Latif, M. Impact of the Equatorial Atlantic on the El Niño Southern Oscillation. Clim. Dyn. 2012, 38, 1965–1972. [Google Scholar] [CrossRef]
  29. Kumar, K.K.; Rajagopalan, B.; Cane, M.A. On the Weakening Relationship Between the Indian Monsoon and ENSO. Science 1999, 284, 2156–2159. [Google Scholar] [CrossRef] [Green Version]
  30. Kucharski, F.; Bracco, A.; Yoo, J.H.; Molteni, F. Low-Frequency Variability of the Indian Monsoon-ENSO Relationship and the Tropical Atlantic: The “Weakening” of the 1980s and 1990s. J. Clim. 2007, 20, 4255–4266. [Google Scholar] [CrossRef]
  31. Servain, J.; Caniaux, G.; Kouadio, Y.K.; McPhaden, M.J.; Araujo, M. Recent climatic trends in the tropical Atlantic. Clim. Dyn. 2014, 43, 3071–3089. [Google Scholar] [CrossRef]
  32. Diedhiou, A.; Machado, L.A.T.; Laurent, H. Mean kinematic characteristics of synoptic easterly disturbances over the Atlantic. Adv. Atmos. Sci. 2010, 27, 483–499. [Google Scholar] [CrossRef]
  33. Kouadio, Y.K.; Servain, J.; Machado, L.A.T.; Lentini, C.A.D. Heavy Rainfall Episodes in the Eastern Northeast Brazil Linked to Large-Scale Ocean-Atmosphere Conditions in the Tropical Atlantic. Adv. Meteorol. 2012, 2012, 369567. [Google Scholar] [CrossRef]
  34. Silva, T.; Veleda, D.; Araujo, M.; Tyaquiçã, P. Ocean-atmosphere feedback during extreme rainfall events in eastern Northeast Brazil. J. Appl. Meteorol. Climatol. 2018. [Google Scholar] [CrossRef]
  35. Grodsky, S.E.; Carton, J.A. The intertropical convergence zone in the south Atlantic and the equatorial cold tongue. J. Clim. 2003, 16, 723–733. [Google Scholar] [CrossRef]
  36. Liu, W.T.; Xie, X. Double intertropical convergence zones—A new look using scatterometer. Geophys. Res. Lett. 2002, 29, 2072. [Google Scholar] [CrossRef]
  37. Rao, V.B.; Lima, M.C.D.; Franchito, S.H. Seasonal and interannual variations of rainfall over eastern northeast Brazil. J. Clim. 1993, 6, 1754–1763. [Google Scholar]
  38. Hounsou-Gbo, G.A.; Araujo, M.; Bourlès, B.; Veleda, D.; Servain, J. Tropical Atlantic Contributions to Strong Rainfall Variability along the Northeast Brazilian Coast. Adv. Meteorol. 2015, 2015, 902084. [Google Scholar] [CrossRef]
  39. Yamazaki, Y.; Rao, V.B. Tropical cloudiness over the South Atlantic Ocean. J. Meteorol. Soc. Jpn. 1977, 55, 205–207. [Google Scholar] [CrossRef]
  40. Lucena, D.B.; Servain, J.; Gomes Filho, M.F. Rainfall response in Northeast Brazil from ocean climate variability during the second half of the 20th Century. J. Clim. 2011, 24, 6174–6184. [Google Scholar] [CrossRef]
  41. Schneider, U.; Becker, A.; Finger, P.; Meyer-Christoffer, A.; Ziese, M.; Rudolf, B. GPCC’s new land surface precipitation climatology based on quality-controlled in situ data and its role in quantifying the global water cycle. Theoretical and Applied Climatology. Appl. Clim. 2013, 115, 15–40. [Google Scholar] [CrossRef]
  42. GPCC Global Precipitation Climatology Centre. Available online: https://www.esrl.noaa.gov/psd/data/gridded/data.gpcc.html (accessed on 25 March 2019).
  43. Yu, L.; Weller, R.A. Objectively Analyzed Air-Sea Heat Fluxes for the Global Ice-Free Oceans (1981–2005). Bull. Am. Meteorol. Soc. 2007, 88, 527–539. [Google Scholar] [CrossRef]
  44. Yu, L.; Weller, R.A.; Sun, B. Improving latent and sensible heat flux estimates for the Atlantic Ocean (1988–1999) by a synthesis approach. J. Clim. 2004, 17, 373–393. [Google Scholar] [CrossRef]
  45. Yu, L.; Jin, X.; Weller, R.A. Multidecade Global Flux Datasets from the Objectively Analyzed Air-Sea Fluxes (OAFlux) Project: Latent and Sensible Heat Fluxes, Ocean Evaporation, and Related Surface Meteorological Variables; OAFlux Project Technical Report (OA-2008-01); Woods Hole Oceanographic Institution: Falmouth, MA, USA, 2008; 64p. [Google Scholar]
  46. WHOI OAFlux Project. Available online: oaflux.whoi.edu (accessed on 25 March 2019).
  47. Kalnay, E.; Kanamitsu, M.; Kistler, R.; Collins, W.; Deaven, D.; Gandin, L.; Iredell, M.; Saha, S.; White, G.; Woollen, J.; et al. The NCEP/NCAR 40-Year Reanalysis Project. Bull. Am. Meteorol. Soc. 1996, 77, 437–471. [Google Scholar] [CrossRef] [Green Version]
  48. NCEP/NCAR Reanalysis. Available online: https://www.esrl.noaa.gov/psd/data/gridded/data.ncep.reanalysis.html (accessed on 26 March 2019).
  49. Graf, J.; Sasaki, C.; Winn, C.; Liu, W.T.; Tsai, W.; Freilich, M.; Long, D. NASA Scatterometer Experiment. Acta Astronaut. 1998, 43, 397–407. [Google Scholar] [CrossRef]
  50. CERSAT Ifremer. Available online: ftp://ftp.ifremer.fr/ifremer/cersat (accessed on 26 March 2019).
  51. Howarth, D.A. Seasonal variations in the vertically integrated water vapor transport fields over the southern hemisphere. Mon. Weather Rev. 1983, 111, 1259–1272. [Google Scholar] [CrossRef]
  52. Peixóto, J.P.; Oort, A.H. Physics of Climate. Rev. Mod. Phys. 1984, 56, 365–431. [Google Scholar] [CrossRef]
  53. Rao, V.B.; Cavalcanti, I.F.A.; Hada, K. Annual variation of rainfall over Brazil and water vapor characteristics over South America. J. Geophys. Res. 1996, 101, 26539–26551. [Google Scholar] [CrossRef] [Green Version]
  54. Cintra, M.; Lentini, C.A.D.; Servain, J.; Araújo, M.; Marone, E. Physical processes that drive the seasonal evolution of the southwestern tropical Atlantic warm pool. Dyn. Atmos. Ocean. 2015, 7, 1–11. [Google Scholar] [CrossRef]
  55. Silva, M.; Araujo, M.; Servain, J.; Penven, P.; Lentini, C.A.D. High-resolution regional ocean dynamics simulation in the southwestern tropical Atlantic. Ocean Model. 2009, 30, 256–269. [Google Scholar] [CrossRef]
  56. Zebiak, S.E. Air-sea interaction in the equatorial Atlantic region. J. Clim. 1993, 6, 1567–1586. [Google Scholar] [CrossRef]
  57. Lübbecke, J.F.; Böning, C.W.; Keenlyside, N.S.; Xie, S.-P. On the connection between Benguela and equatorial Atlantic Niños and the role of the South Atlantic Anticyclone. J. Geophys. Res. 2010, 115, C09015. [Google Scholar] [CrossRef]
  58. Rouault, M.; Servain, J.; Reason, C.J.C.; Bourlès, B.; Rouault, M.J.; Fauchereau, N. Extension of PIRATA in the tropical south-east Atlantic: An initial one-year experiment. Afr. J. Mar. Sci. 2009, 31, 63–71. [Google Scholar] [CrossRef]
  59. Imbol Koungue, R.A.; Illig, S.; Rouault, M. Role of interannual Kelvin wave propagations in the equatorial Atlantic on the Angola Benguela Current system. J. Geophys. Res. Ocean. 2017, 122, 4685–4703. [Google Scholar] [CrossRef]
  60. Herbert, G.; Bourlès, B. Impact of intraseasonal wind bursts on sea surface temperature variability in the far Eastern tropical Atlantic Ocean during boreal spring 2005 and 2006: Focus on the mid-May 2005 event. Ocean Sci. 2018, 14, 849–869. [Google Scholar] [CrossRef]
  61. Giannini, A.; Saranavan, R.; Chang, P. The Preconditioning Role of Tropical Atlantic Variability in the Development of the ENSO Teleconnection: Implications for the Prediction of Nordeste Rainfall. Clim. Dyn. 2004, 22, 839–855. [Google Scholar] [CrossRef]
  62. Park, J.-H.; Li, T. Interdecadal modulation of El Niño-tropical North Atlantic teleconnection by the Atlantic multi-decadal oscillation. Clim. Dyn. 2019, 52, 5345–5360. [Google Scholar] [CrossRef]
  63. Servain, J.; Busalacchi, A.J.; Moura, A.; McPhaden, M.; Reverdin, G.; Vianna, M.; Zebiak, S. A Pilot Research Moored Array in the Tropical Atlantic “PIRATA”. Bull. Am. Meteorol. Soc. 1998, 79, 2019–2031. [Google Scholar] [CrossRef]
  64. Bourlès, B.; Lumpkin, R.; McPhaden, M.J.; Hernandez, F.; Nobre, P.; Campos, E.; Yu, L.; Planton, S.; Busalacchi, A.; Moura, A.D.; et al. The PIRATA Program: History, Accomplishments, and Future Directions. Bull. Am. Meteorol. Soc. 2008, 89, 1111–1125. [Google Scholar] [CrossRef]
  65. Bourlès, B.; Araujo, M.; McPhaden, M.J.; Brandt, P.; Foltz, G.R.; Lumpkin, R.; Giordani, H.; Hernandez, F.; Lefèvre, N.; Nobre, P.; et al. PIRATA: A Sustained Observing System for Tropical Atlantic Climate Research and Forecasting. Earth Space Sci. 2019, 6, 577–616. [Google Scholar] [CrossRef]
Figure 1. Climatologies (2000–2015) of surface wind convergence (from Quick Scatterometer (QuikSCAT) and Advanced Scatterometer (ASCAT), 10−6 s−1, shaded) and sea surface temperature (SST; from Objectively Analyzed Air-Sea Fluxes Project- OAFlux, °C, contour) in (a) February-to-April (FMA) and (b) May-to-July (MJJ), which respectively, correspond to the Northern Northeast Brazil (Northern NEB; black box in (a)) and Eastern Northeast Brazil (Eastern NEB; black box in (b)) rainy seasons. The oceanic red box in (b) corresponds to the region used to define the southern intertropical convergence zone (SITCZ) index. (c) Climatological evolution of Northern NEB (red line; 2°–8° S; 37°–50° W) and Eastern NEB (blue line; 5°–11° S; 34.5°–37° W) rainfall (from Global Precipitation Climatology Centre (GPCC), mm month−1); ITCZ position at 30° W (2° S–12° N; red dotted line) and SITCZ index (10−6 s−1; blue dotted line; 3°–10° S; 25°–35° W) for the period of 2000-2015. ITCZ position and SITCZ have been estimated using the high horizontal resolution (0.25 °) QuikSCAT and ASCAT winds data.
Atmosphere 10 00335 g001
Figure 2. Distributions of the lagged linear correlation/regression (mm month−1/°C) of the gridded SST (from OAFlux) anomalies in (a) November-December-January(−1) (NDJ(−1)) and (b) MJJ(0) with the rainfall anomalies in Eastern NEB (magenta box) during MJJ(0) for the period 1960–2015. The vectors represent the linear regression (mm month−1/m s−1) of the surface wind vectors (u and v; from NCEP) anomalies, with the rainfall anomalies in Eastern NEB. The correlations that are significant at the 95% confidence level, according to the t-test, are plotted for both SST and wind. Contours indicate regions of correlation higher than +0.5 (solid black line) for SSTA. The diagonal band in Figure 2a indicates the pathway of the northwestward propagation of SSTA. Longitude–time diagrams of the composites of standardized SSTA for: (c) WET years, (d) DRY years and (e) difference WET–DRY years for the period 1960–2015. The SSTA are averaged along the latitude of the diagonal band in Figure 2a. Contours represent values significant at a 95% confidence level using the t-test. The vertical black lines (at 35° W) in (bd) indicate the eastern limit of the Eastern NEB.
Atmosphere 10 00335 g002
Figure 3. (ac) the Same as in Figure 2 (ce), but for the gridded vertically integrated moisture flux convergence (MFC) anomalies (mm month−1/106 kg m−2 s−1).
Atmosphere 10 00335 g003
Figure 4. Distribution of the lagged linear correlation/regression of the gridded (a) SST (shaded; °C/°C) and surface wind (vectors; m s−1/°C) anomalies (b) 500 hPa vertical velocity (shaded; Pa s−1/°C; negative values indicate upward motion) and the sea level pressure (contours, significant correlation only) anomalies within the entire tropical Atlantic in MJJ with SSTA inside southeastern tropical Atlantic (SETA; 10° S–20° S, 10° W–5° E; oceanic black box) in NDJ for all the years (56 years) from 1960 to 2015. Only the correlations that are significant at a 95% confidence level, according to the t-test, are plotted for all variables. Contours in (a) indicate regions of correlation higher than +0.5 for SSTA.
Atmosphere 10 00335 g004
Figure 5. Distributions of lagged linear correlation/regression (mm month−1/°C) of the gridded SSTA in: (a) JAS(−1) and (b) FMA(0) with rainfall anomalies in Northern NEB (red box) during FMA(0) for the period 1960–2015. The vectors represent the linear regression (mm month−1/m s−1) of the gridded surface wind vectors (u and v) with rainfall anomalies in Northern NEB. The significant correlations at a 95% confidence level, according to the t-test, are plotted for both SST and wind. Contours indicate regions of correlation higher than +0.5 (solid black line) and lower than −0.5 (solid gray line). Longitude–time diagrams of the composites of standardized SSTA for: (c) WET years, (d) DRY years, and (e) difference WET–DRY years for the period 1960–2015. The SSTA are averaged between 60° W–15° E. Values in Figure 5d are shown where the difference is significant at a 95% confidence level using the t-test. (f) Running correlation of 25 year (centered) windows between JAS(−1) Atlantic Niño (ATL3) SSTA and FMA(0) Northern NEB rainfall anomalies. Dots indicate correlation significant at a 95% confidence level according to the t-test.
Atmosphere 10 00335 g005
Figure 6. Latitude–time diagram of lagged linear correlation/regression between the rainfall anomalies in Northern NEB during FMA(0) and (a) SSTA (mm month−1/°C) (b) surface wind speed anomalies (mm month−1/m s−1) for the period 1980–2015. The SST and wind speed anomalies are averaged between 60° W–15° E. Values shown are significant at the 95% confidence level using the t-test. Contours indicate regions of correlation higher than +0.5 (solid line) and lower than −0.5 (dotted line) for (a,b).
Atmosphere 10 00335 g006
Figure 7. Distribution of the lagged linear correlation/regression of the gridded (a) SST (°C/°C, shaded) and surface wind (u and v, m s−1/°C, vectors) anomalies (b) velocity potential at 200 hPa (shaded) and stream function at 200 hPa (contours) anomalies over the global ocean in FMA(0) with SSTA inside ATL3 (oceanic black box) in JAS(−1) for all the years (36 years) during 1980–2015. The correlations that are significant at a 95% confidence level, according to the t-test, are plotted for both SST and wind. Contours indicate regions of correlation higher than +0.5 for SST (a). The continental black box indicates the Northern NEB region.
Atmosphere 10 00335 g007
Figure 8. Seasonal evolution of the lagged linear correlation coefficient between (a) MJJ rainfall anomalies in Eastern NEB and the SETA (red line), the NINO3 (green line), the tropical South Atlantic (TSA, 20° S–0°; 40° W–15° E, red dashed line), and the tropical North Atlantic (TNA, 0°–20° N; 60°–15° W, blue dashed line) SSTA for the period 1980–2015, (b) FMA rainfall anomalies in Northern NEB and the ATL3 (red line), the NINO3 (green line), the Atlantic dipole (blue line; tropical North Atlantic—tropical South Atlantic (TNA-TSA)), the TSA (red dashed line), and the TNA (blue dashed line) SSTA for the period 1980–2015. Correlations higher than ± 0.32 are significant at a 95% confidence level, according to the t-test, for (a,b).
Atmosphere 10 00335 g008
Table 1. Information about the different products used in this study.
ProductDescriptionSpatial and Temporal ResolutionsData Availability
Land area precipitationFrom the Global Precipitation Climatology Centre (GPCC). GPCC supplies the global land area precipitation calculated by objective analysis from dozens of thousands of rain gauge stations [41]. The full data reanalysis combined with monitoring (from 2014) version 7 is used in this work.Monthly gridded data with 1° × 1° spatial resolutionFrom 1901 to present and available at [42]
Sea surface temperature (SST)From the Objectively Analyzed Air-Sea Fluxes Project–OAFlux of Woods Hole Oceanographic Institution (WHOI). The OAFlux product is synthesized using National Centers for Environmental Prediction (NCEP1, NCEP2), European Centre for Medium-Range Weather Forecasts
(ECMWF) ERA40, and ERA-interim
Re-analysis [43,44,45]
Monthly data with 1° × 1° horizontal resolutionAvailable from 1958 to present at [46]
Reanalyzed Wind vectors, specific humidity, stream function, velocity potential and omegaFrom the National Centers for Environmental Prediction/National Center for Atmospheric Research-NCEP/NCAR [47] Monthly data with regular horizontal grid of 2.5° × 2.5° and 17 pressure levels (mb)From 1948 to present at [48]
Surface sea windCombination of Quick Scatterometer (QuikSCAT) and Advanced Scatterometer (ASCAT) satellite measurements [49] Monthly data with 0.25° × 0.25° regular horizontal grid QuikSCAT data are available from July 1999 to November 2009 and ASCAT data from May 2007 to present. These data are supplied by CERSAT, Ifremer and are available at [50]
Table 2. Years corresponding to the selected positive (WET; bold italic) and negative (DRY; bold) GPCC rainfall anomalies in Eastern NEB (5° S–11° S, 34° W–37° W) during MJJ and in Northern NEB (2° S–8° S, 37° W–50° W) during FMA.
Eastern NEBNorthern NEB
1960198819601988
1961198919611989
1962199019621990
1963199119631991
1964199219641992
1965199319651993
1966199419661994
1967199519671995
1968199619681996
1969199719691997
1970199819701998
1971199919711999
1972200019722000
1973200119732001
1974200219742002
1975200319752003
1976200419762004
1977200519772005
1978200619782006
1979200719792007
1980200819802008
1981200919812009
1982201019822010
1983201119832011
1984201219842012
1985201319852013
1986201419862014
1987201519872015
Table 3. Skill of the linear regression forecast of Eastern and Northern NEB rainfall using some oceanic indexes. The indexes used for the May–July Eastern NEB rainfalls are the southeastern tropical Atlantic (SETA; 10° S–20° S, 10° W–5° E) and NINO3 (5° N–5° S, 150° W–90° W) in NDJ. For the February–May Northern NEB rainfall, Atlantic Niño (ATL3; 3° S–3° N, 20° W–0°), NINO3 and the northeastern subtropical Atlantic (NESTA; 20° N–35° N, 45° W–20° W) indexes are used. For Eastern NEB, the correlation values correspond to the correlation between the observed MJJ rainfall and the MJJ rainfall predicted by the indexes in November–January (NDJ). In the same way, for the Northern NEB case the correlation values are the correlation between the observed FMA rainfall and the FMA rainfall predicted by indexes in July–September (JAS). The root mean square error (rmse) of the different predictions are also indicated. Bold indicates correlations significant at a 95% confidence level.
Eastern NEBNorthern NEB
NDJ SETANDJ NINO3NDJ SETA+NINO3JAS ATL3JAS NINO3JAS ATL3+NESTAJAS ATL3+NINO3
Correlation0.510.290.760.520.270.650.53
Rmse (mm)10912283137154121135

