Article

Global Distribution of Persistence of Total Electron Content Anomaly

1
Hubei Subsurface Multi-scale Imaging Key Laboratory, Institute of Geophysics and Geomatics, China University of Geosciences, Wuhan 430074, China
2
Graduate Institute of Space Science, National Central University, Taoyuan 32001, Taiwan
3
Center for Astronautical Physics and Engineering, National Central University, Taoyuan 32001, Taiwan
4
Center for Space and Remote Sensing Research, National Central University, Taoyuan 32001, Taiwan
*
Author to whom correspondence should be addressed.
Atmosphere 2019, 10(6), 297; https://doi.org/10.3390/atmos10060297
Submission received: 21 April 2019 / Revised: 16 May 2019 / Accepted: 23 May 2019 / Published: 1 June 2019
(This article belongs to the Special Issue Lithosphere–Atmosphere–Ionosphere Coupling (LAIC) Models)

Abstract

:
To better understand the ionospheric morphology response to lithospheric activities, we study the global location preference of the positive and negative total electron content (TEC) anomalies persisting continuously for longer than 24 h at middle and low latitudes (within ±60° N geomagnetic latitudes). The TEC is obtained from the global ionospheric map (GIM) of Center for Orbit Determination in Europe (CODE) under the geomagnetic quiet condition of Kp ≤ 3o during the period of 2005 to 2018. There are a few (less than 4%) TEC anomalies that can persist over 24 h. The conjugate phenomenon is most significant in the eastern Asia to Australia longitudinal sector. The result shows the persistence of the positive TEC anomaly along the ring of fire on the western edge of the Pacific Ocean. The high persistence of the TEC anomalies at midlatitudes suggests that thermospheric neutral wind contributes to the anomaly formation.

1. Introduction

It has been known that ionospheric structures are highly variable under both geomagnetic disturbed and quiet conditions because the drivers, such as electric field, neutral wind, pressure gradient, and gravity, can easily transport the ionospheric plasma [1]. Solar activity can disturb the ionosphere globally and induce ionospheric weather phenomena that transit rapidly through a large area [2,3].
On the other hand, lithospheric activities that occurred near the surface can possibly induce the anomaly of ionospheric plasma over a certain location. Liu et al. [4,5,6,7] reported that the ionospheric total electron content (TEC) anomaly persists over and near the epicenters of the 2008 Mw8.0 Wenchuan, 2004 Mw9.3 Sumatra–Andaman, 2010 Mw7.0 Haiti, and 2011 Mw9.0 Tohoku earthquakes. The TEC anomalies may have a geographical preference if the lithospheric activity is capable of maintaining a TEC anomaly above a certain area. The tectonic plates often slide past, collide with, and divergent away from each other at various areas of the Earth, therefore the lithospheric activities, such as earthquake ruptures and volcano eruptions, nonuniformly distribute all over the world. Better knowing the global distribution of persistence of TEC anomalies makes the connection between lithospheric activity and ionospheric morphology at different places of the world beneficial.
The global TEC measurements were archived since 1998 (ftp://cddis.gsfc.nasa.gov/pub/gps/products/ionex). Liu et al. [4,5,6,7] have proposed a spatial analysis method for efficiently detecting persistence of the TEC anomalies. The above facts motivate us to study the geographical preference of the TEC anomalies.

2. Data and Methodology

The global ionospheric map (GIM) is designed for monitoring, nowcasting, and even forecasting the rapidly changing ionospheric weather that critically impacts high accuracy positioning, navigation, and communication applications [8]. The TEC in the GIM derived from the Global Navigation Satellite System (GNSS: GPS, GLONASS, Galileo, and Beidou systems) are ideally utilized for discriminating regional anomalies from global-scale structures. The TEC is defined as the integration of the electron density between a ground-based receiver and its associated GNSS satellite. The GIM TEC is published by the Center for Orbit Determination in Europe (CODE) every 1 or 2 hours with a spatial resolution of 2.5° geographic latitude (71 grid points) and 5° geographic longitude (73 grid points) [9]. The temporal resolutions of the GODE GIM are 2 and 1 hours before and after 2014. In this study, the GIM TEC was downsampled to 2 h after 2014 to achieve correspondence to the temporal resolution of data before 2014.
We study the TEC anomaly from 2005 to 2018 because the number of ground-based GNSS receivers is less than and the solar activity is higher than that before 2005. To avoid the possible contamination of geomagnetic disturbances, the data under the condition of Kp > 3o (13.4%) are excluded from the archive. The data beyond ±60° N geomagnetic latitudes are also excluded to avoid effects from high-latitude.
A spatial analysis with the quartile-based process [4,5,6,7] is performed to detect anomalous signals of the GIM TEC variation. At each timestep, we compute the lower and upper bounds (LB and UB) from every consecutive 30 days of the TEC and find the deviation between that observed on the 31st day. Note that assuming a normal distribution with median, M, and standard deviation, σ, for TEC, the lower quartile (LQ) and upper quartile (UQ) are defined as LQ = M − Kσ and UQ = M + Kσ, respectively. The LB and UB are, respectively, defined as LB = M − K(M − LQ) and UB = M + K(UQ – M). The expected K is 1.34 [10]. To make the criterion stringent, here we set K = 3 which is strict with detecting the TEC anomaly. The negative and positive anomalies are the departures of the TEC from the associated LB and UB (i.e., TEC − LB and TEC − UB), respectively.
The probability of the anomaly continuously appearing at one certain lattice among the global lattices of 5183 (71 × 73) longer than one day corresponding to the 30 days’ LB or UB is less than 3.3% (=1 day/30 day). Therefore, Liu et al. [4,5,6,7] applied the spatial analysis with the quartile-based process to detect the persistence of the TEC anomalies induced by regional effects.

3. Results

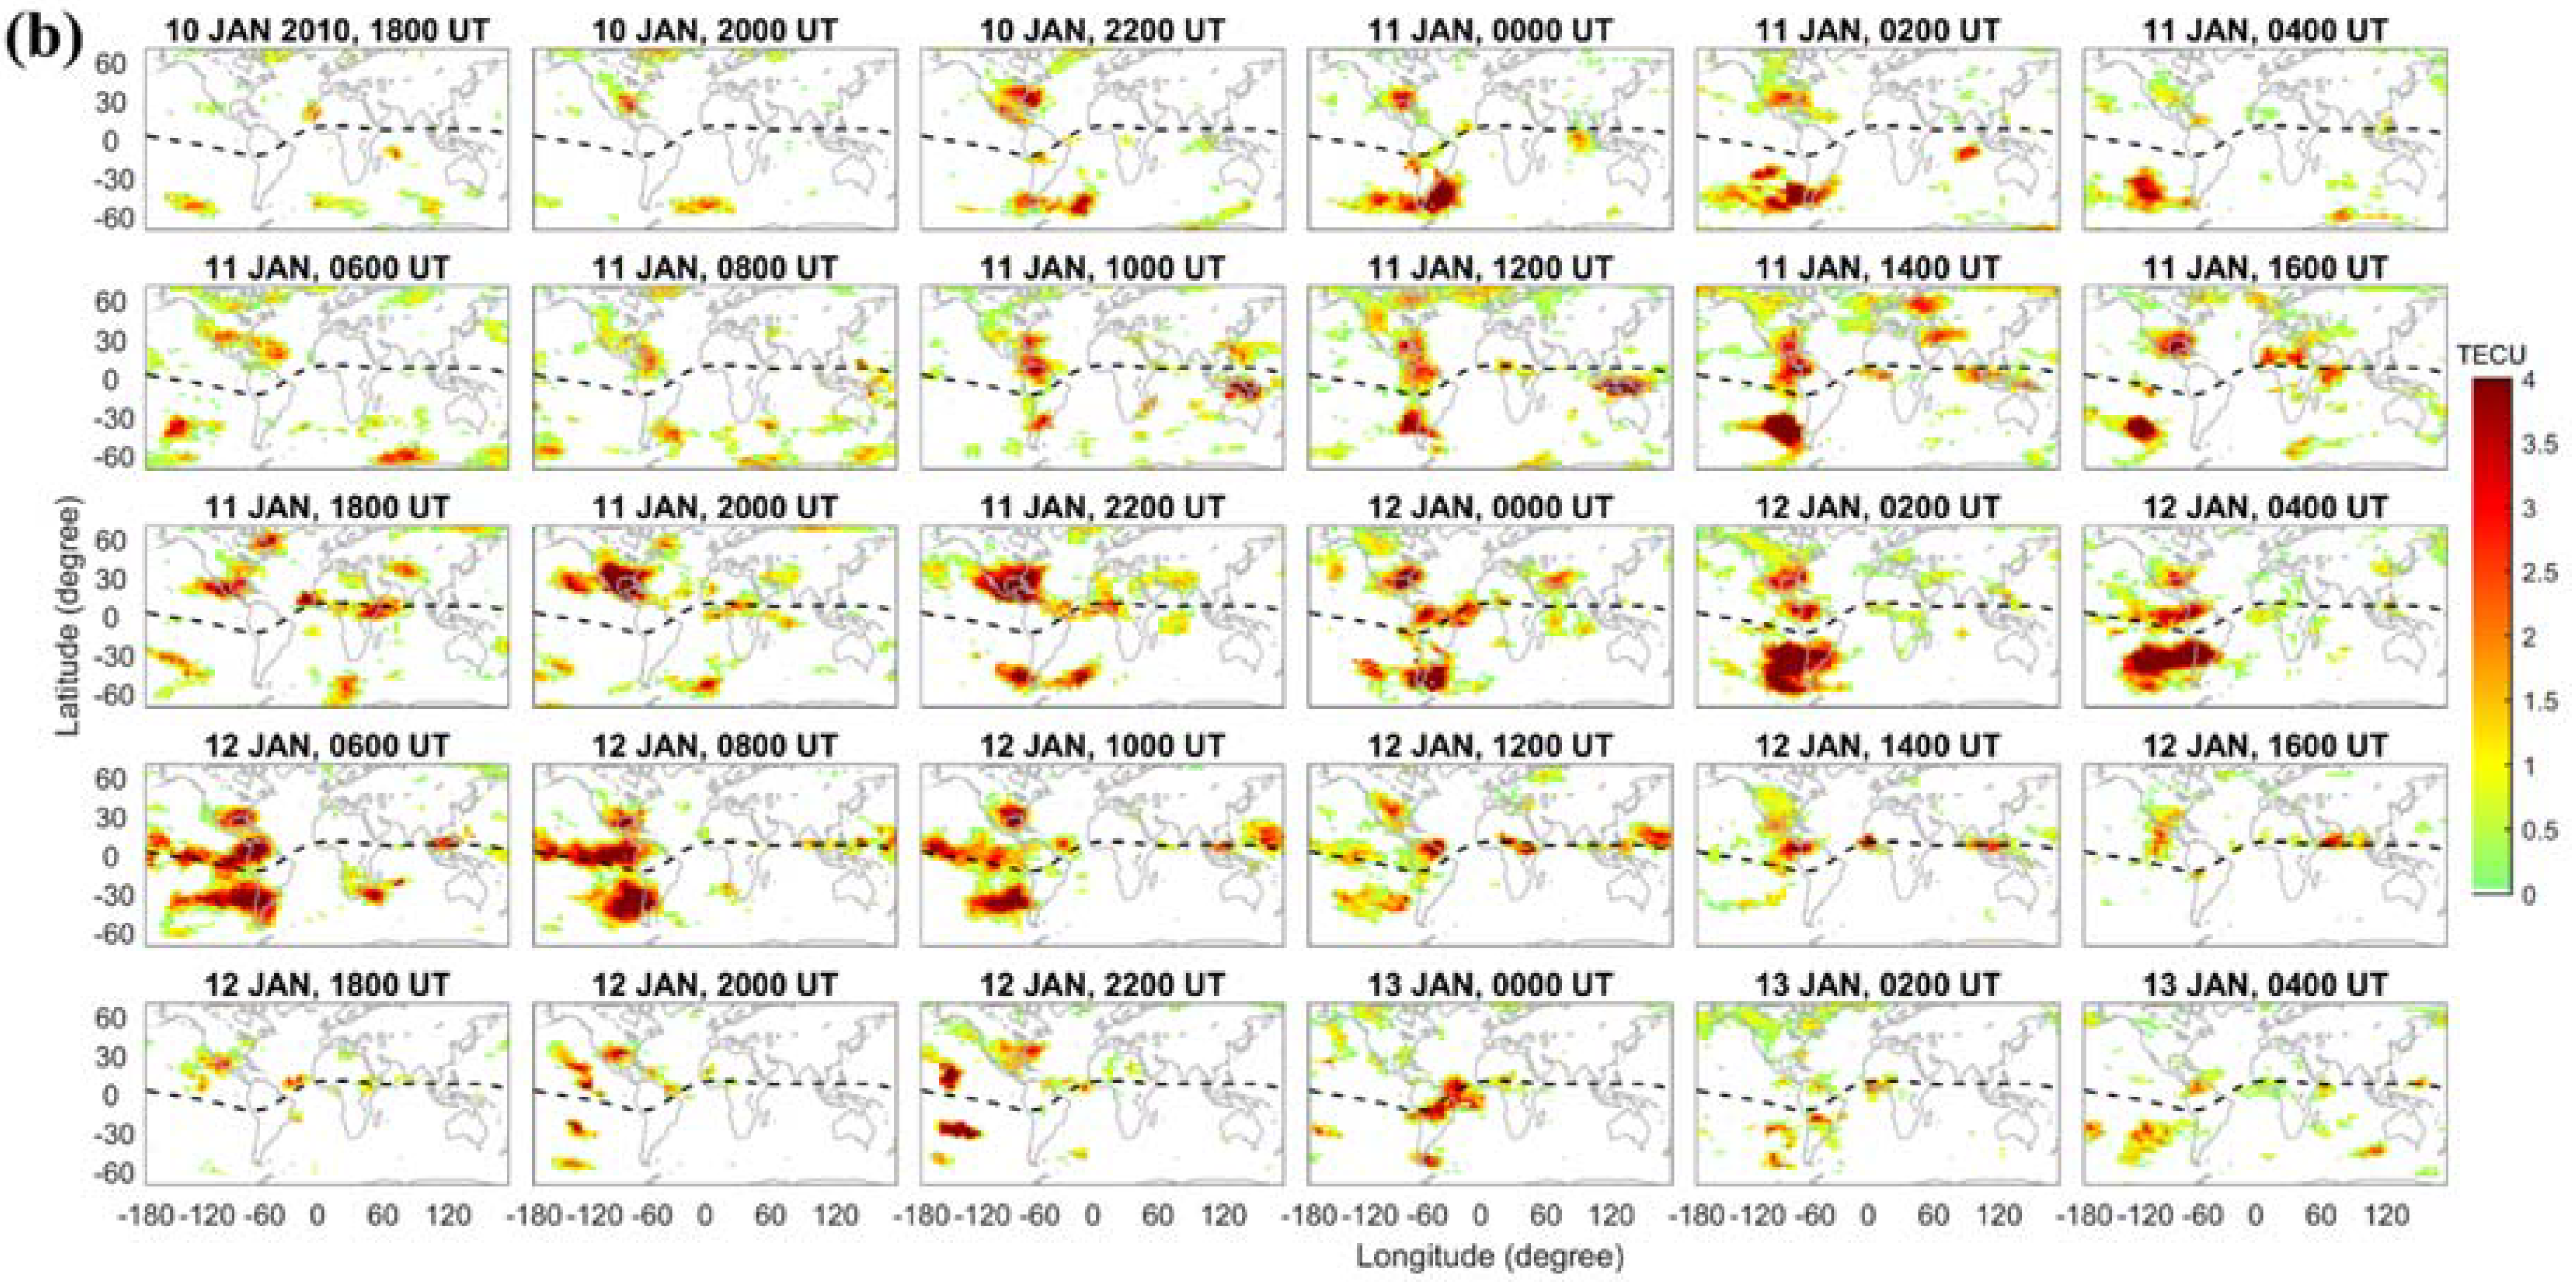
Figure 1 and Figure 2 show an event of a TEC anomaly continuously appearing over a certain location for more than one day. In Figure 1a, the day-to-day variability in TEC that is higher than its UB at a location of 25° N, 90° W from 11 to 12 January 2010. The geomagnetic condition is quiet during that period [6]. Figure 1b displays that the positive anomaly appears worldwide at various timesteps during the period of 10 to 13 January.
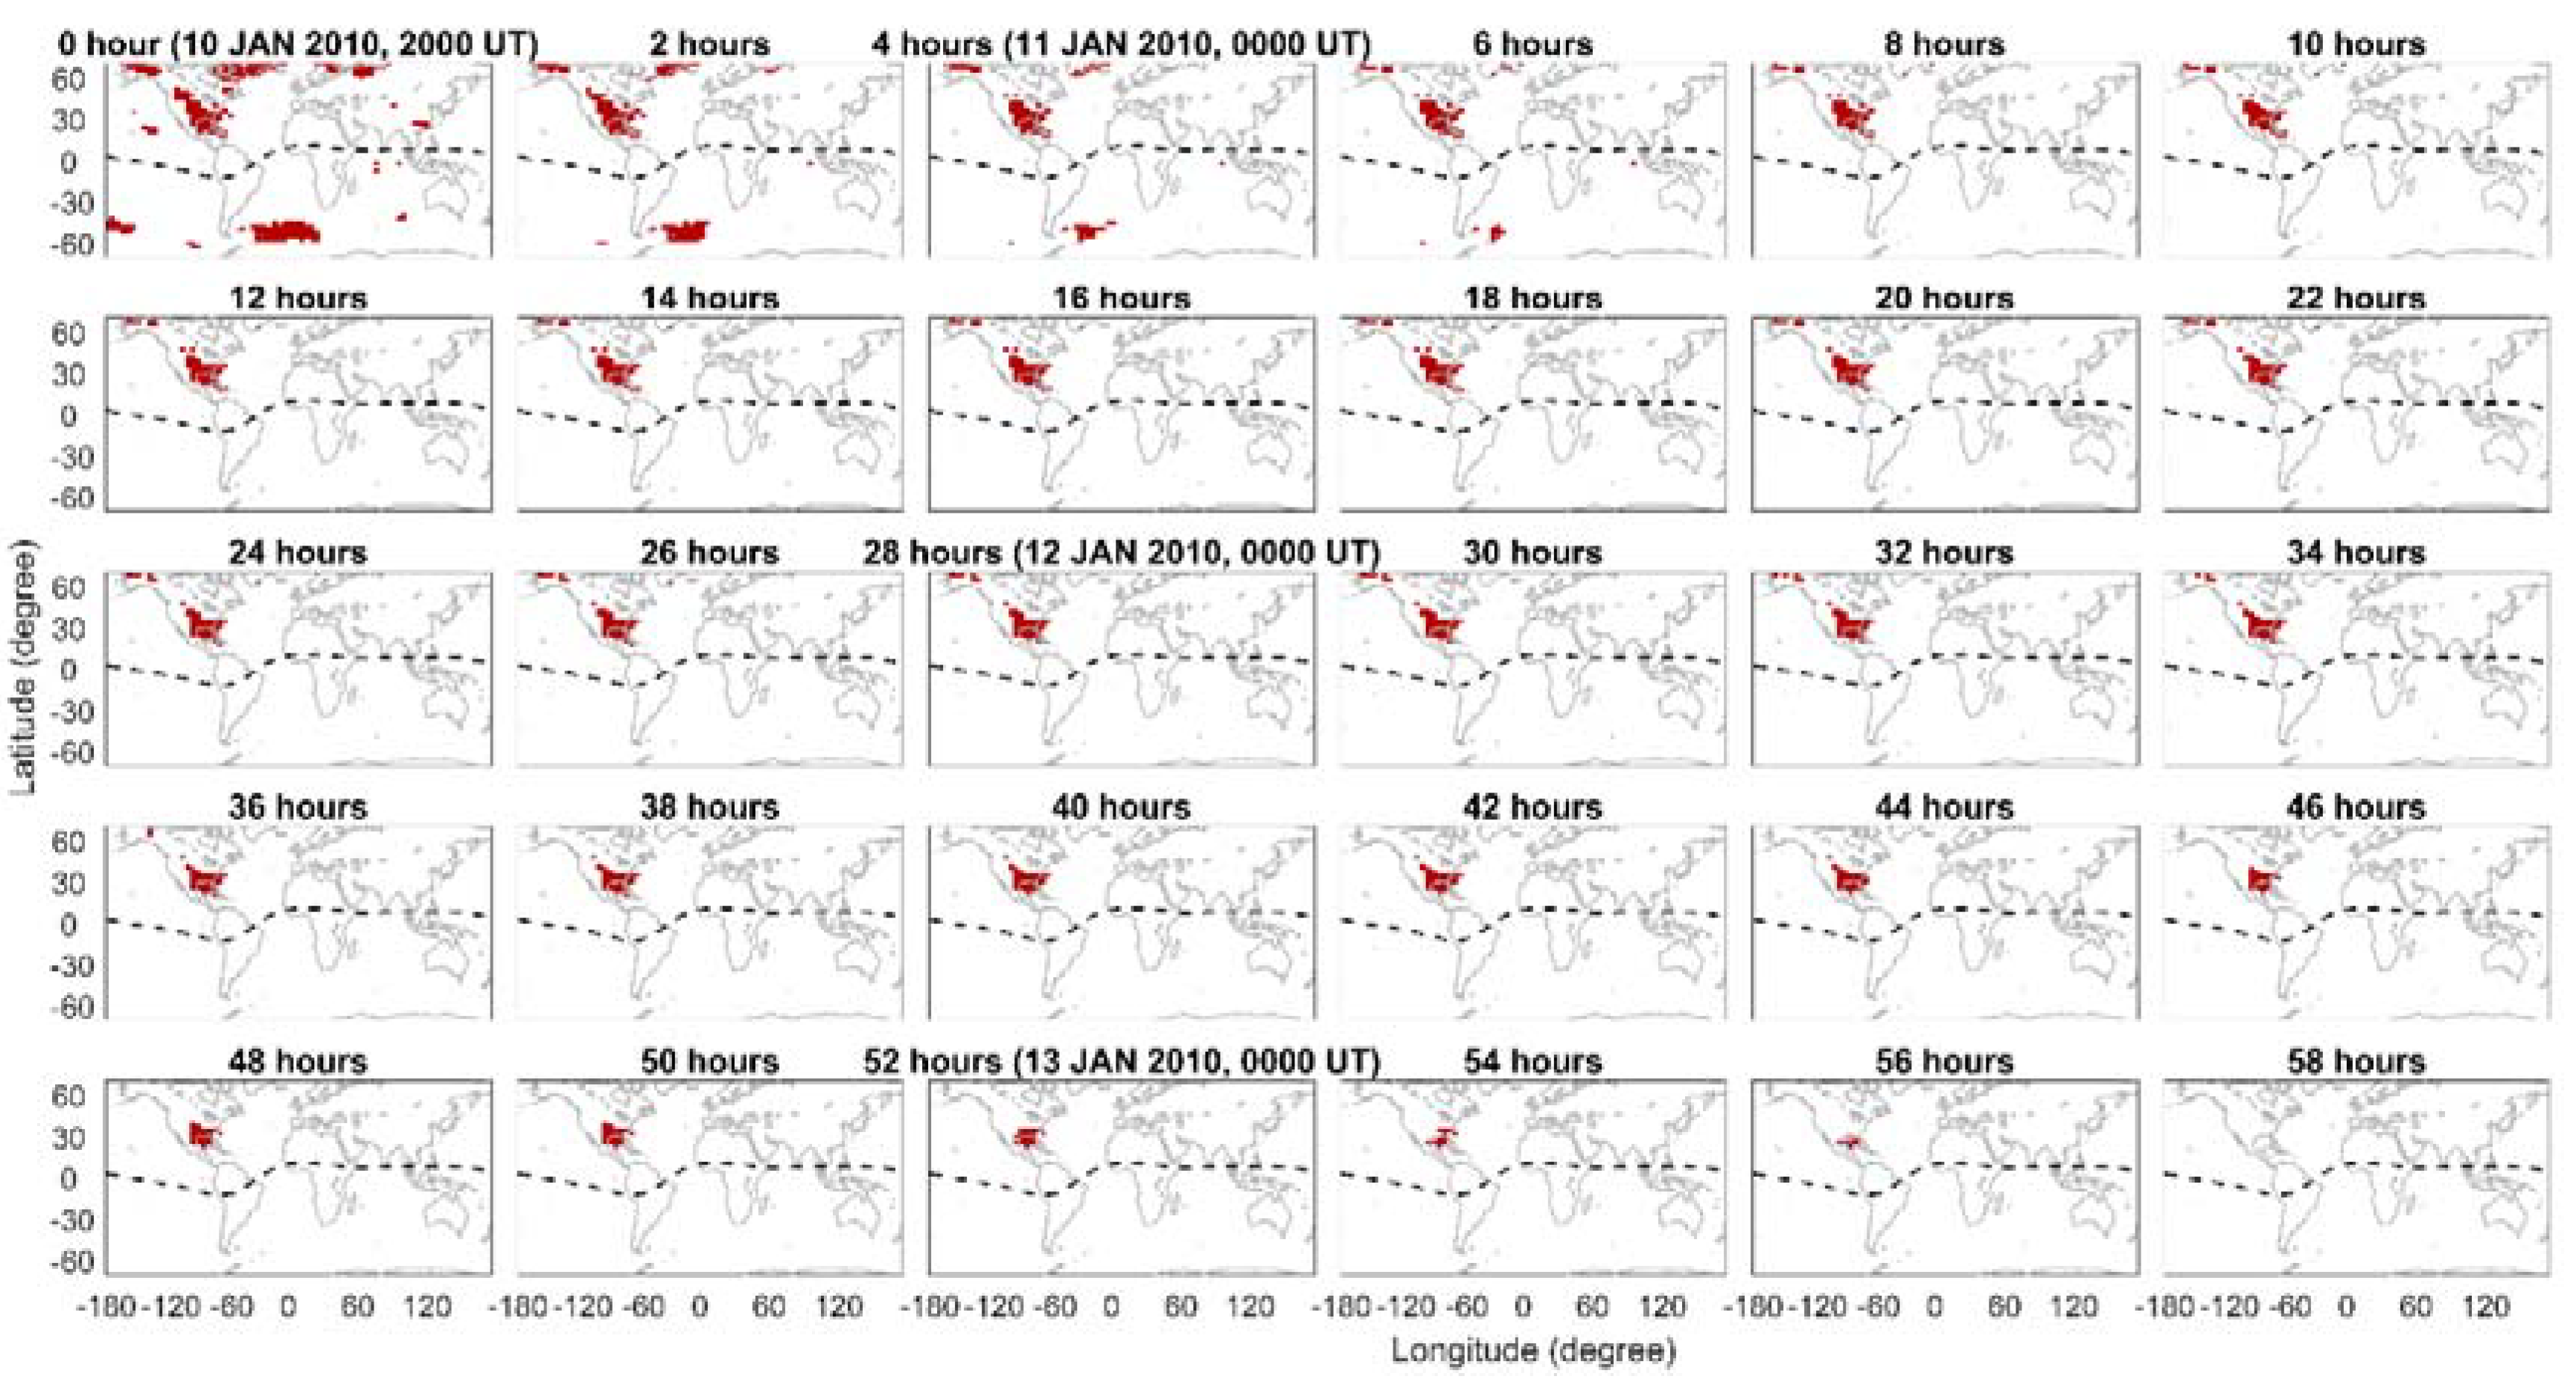
Figure 2 shows an example of estimating the persistent duration of the anomaly since the timestep of 2000 UT on 10 January 2010. The positive TEC anomalies appear worldwide during the 6 hours from 2000 UT on 10 January to 0200 UT on 11 January, following that the anomaly continuously repeats for 50 h more in the Northern Hemisphere, and surviving around 25° N, 90° W eventually. Liu et al. [6] attributed the long-persistent positive TEC anomaly to the Mw7 Haiti earthquake that occurred on 12 January 2010. In this study, we treat the value of the persistent duration as 56 h at the timestep of 2000 UT on 10 January 2010.
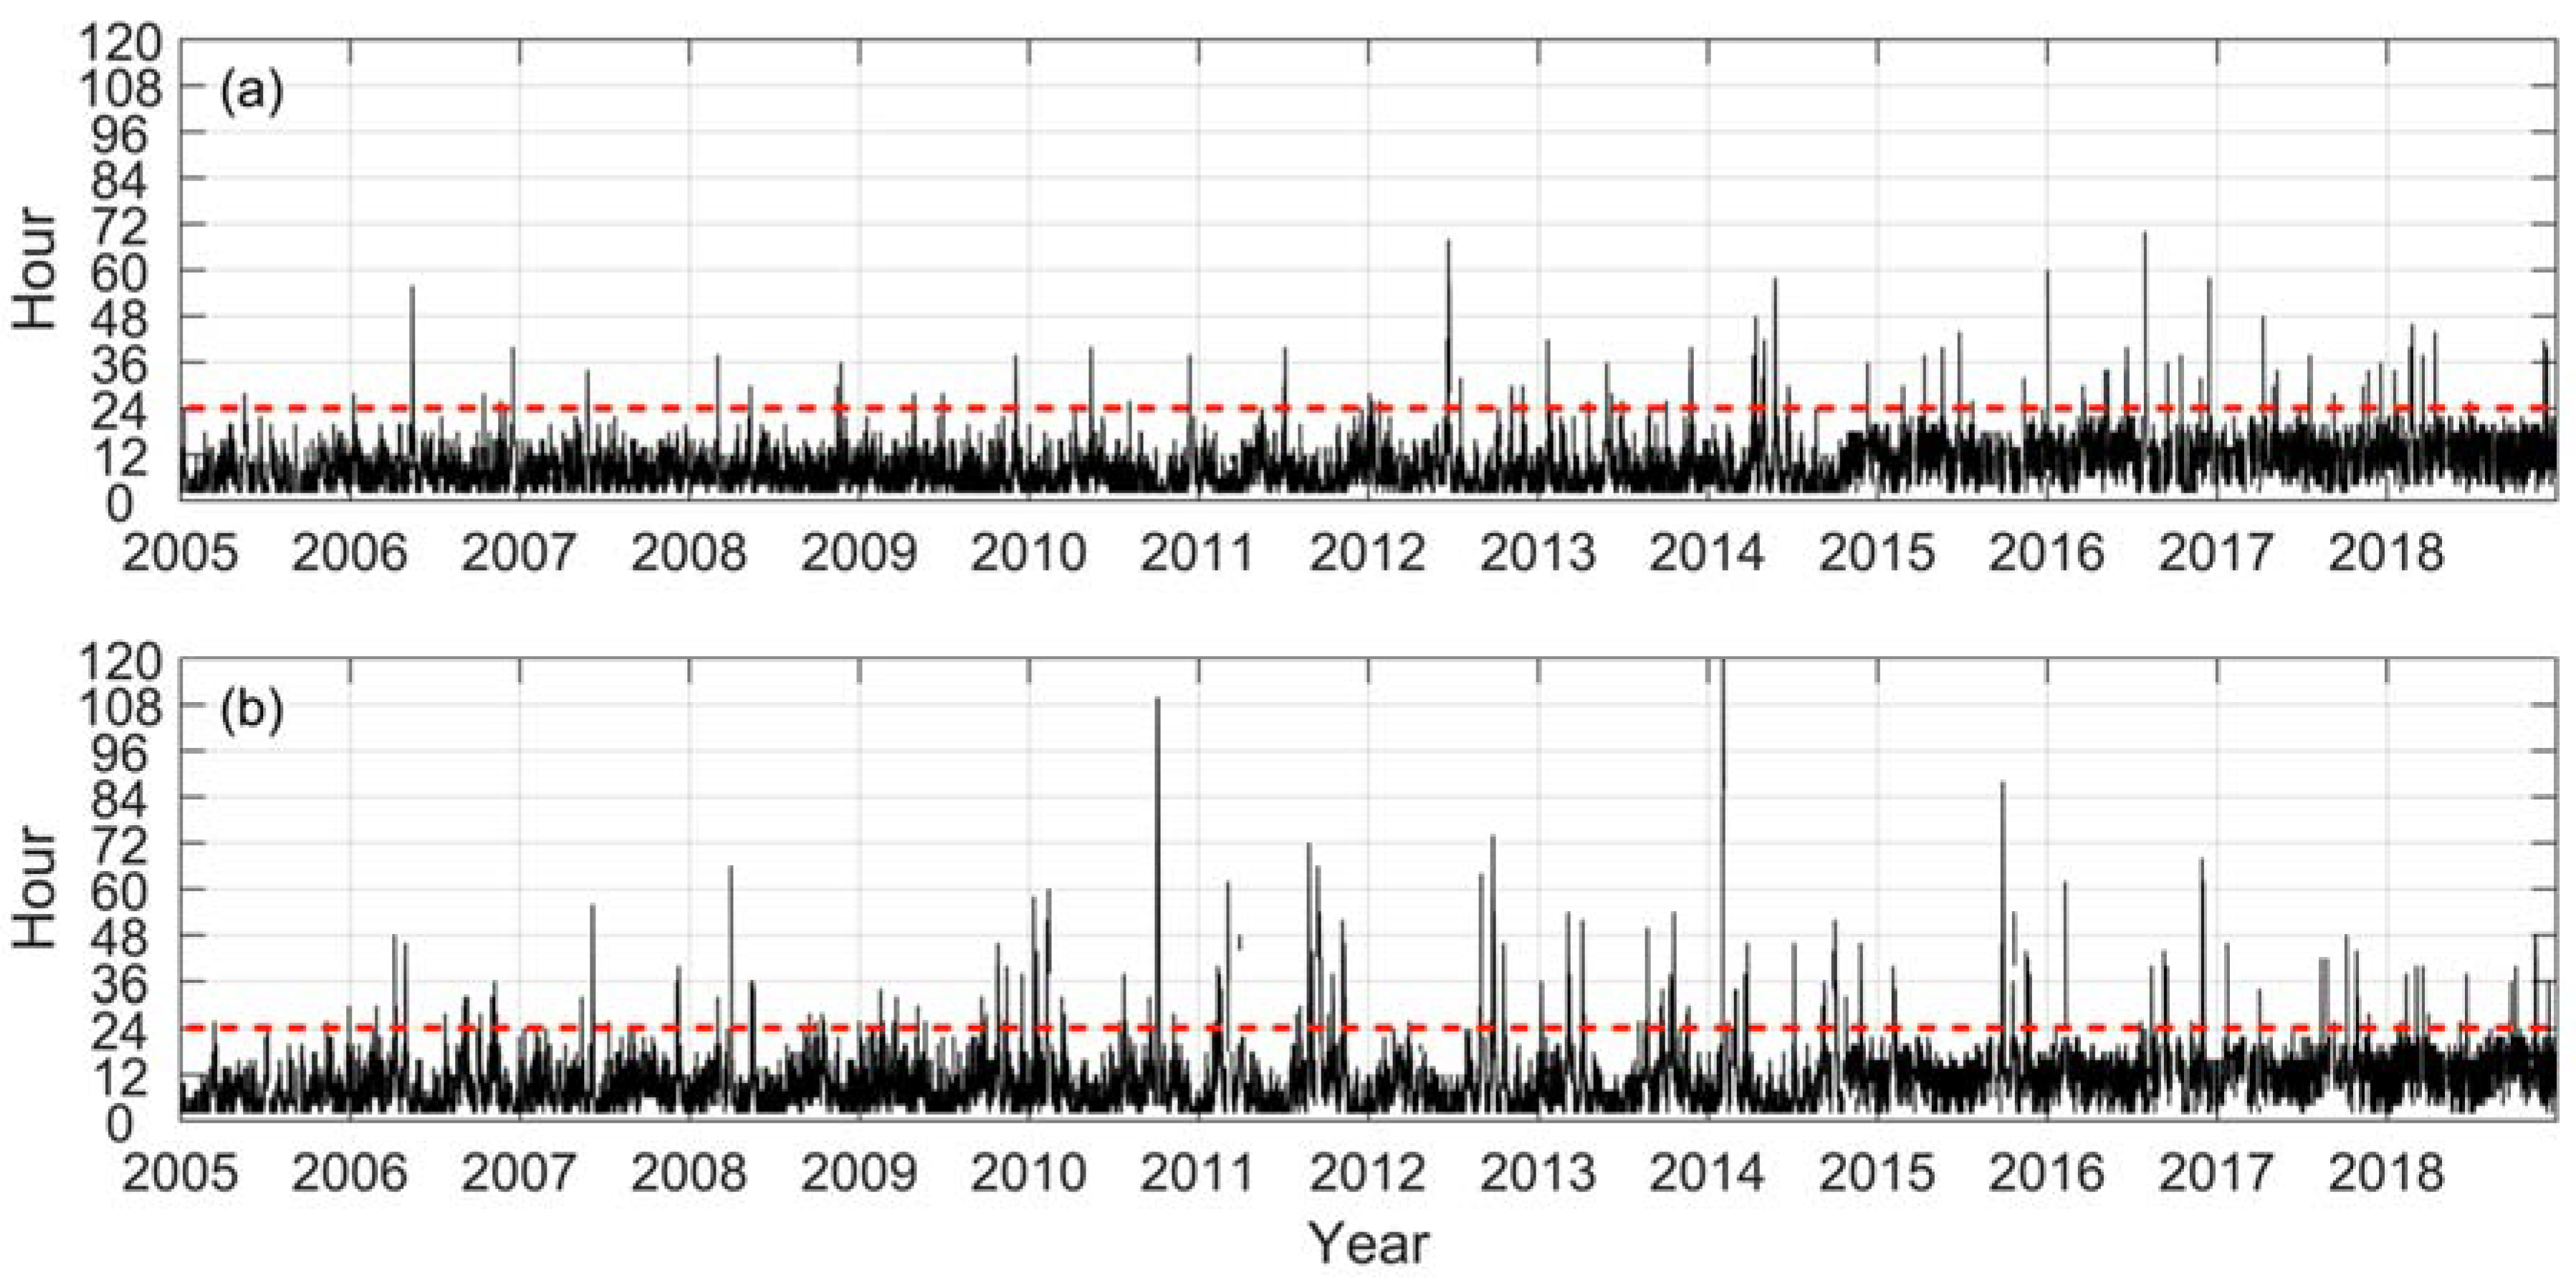
Figure 3 displays the time series of the persistent duration for all the timesteps (2-h resolution) during the entire period of 2005 to 2018. The median values for both the negative and positive anomaly are 8 h. Only 1.45% (670 timesteps) of the negative anomaly and 3.78% (1675 timesteps) of the positive anomaly persist (continuously appear) longer than 24 h. To make the anomaly stringent, we next show the global preference of the TEC anomalies with persistency duration greater than the criterion of 24 h.
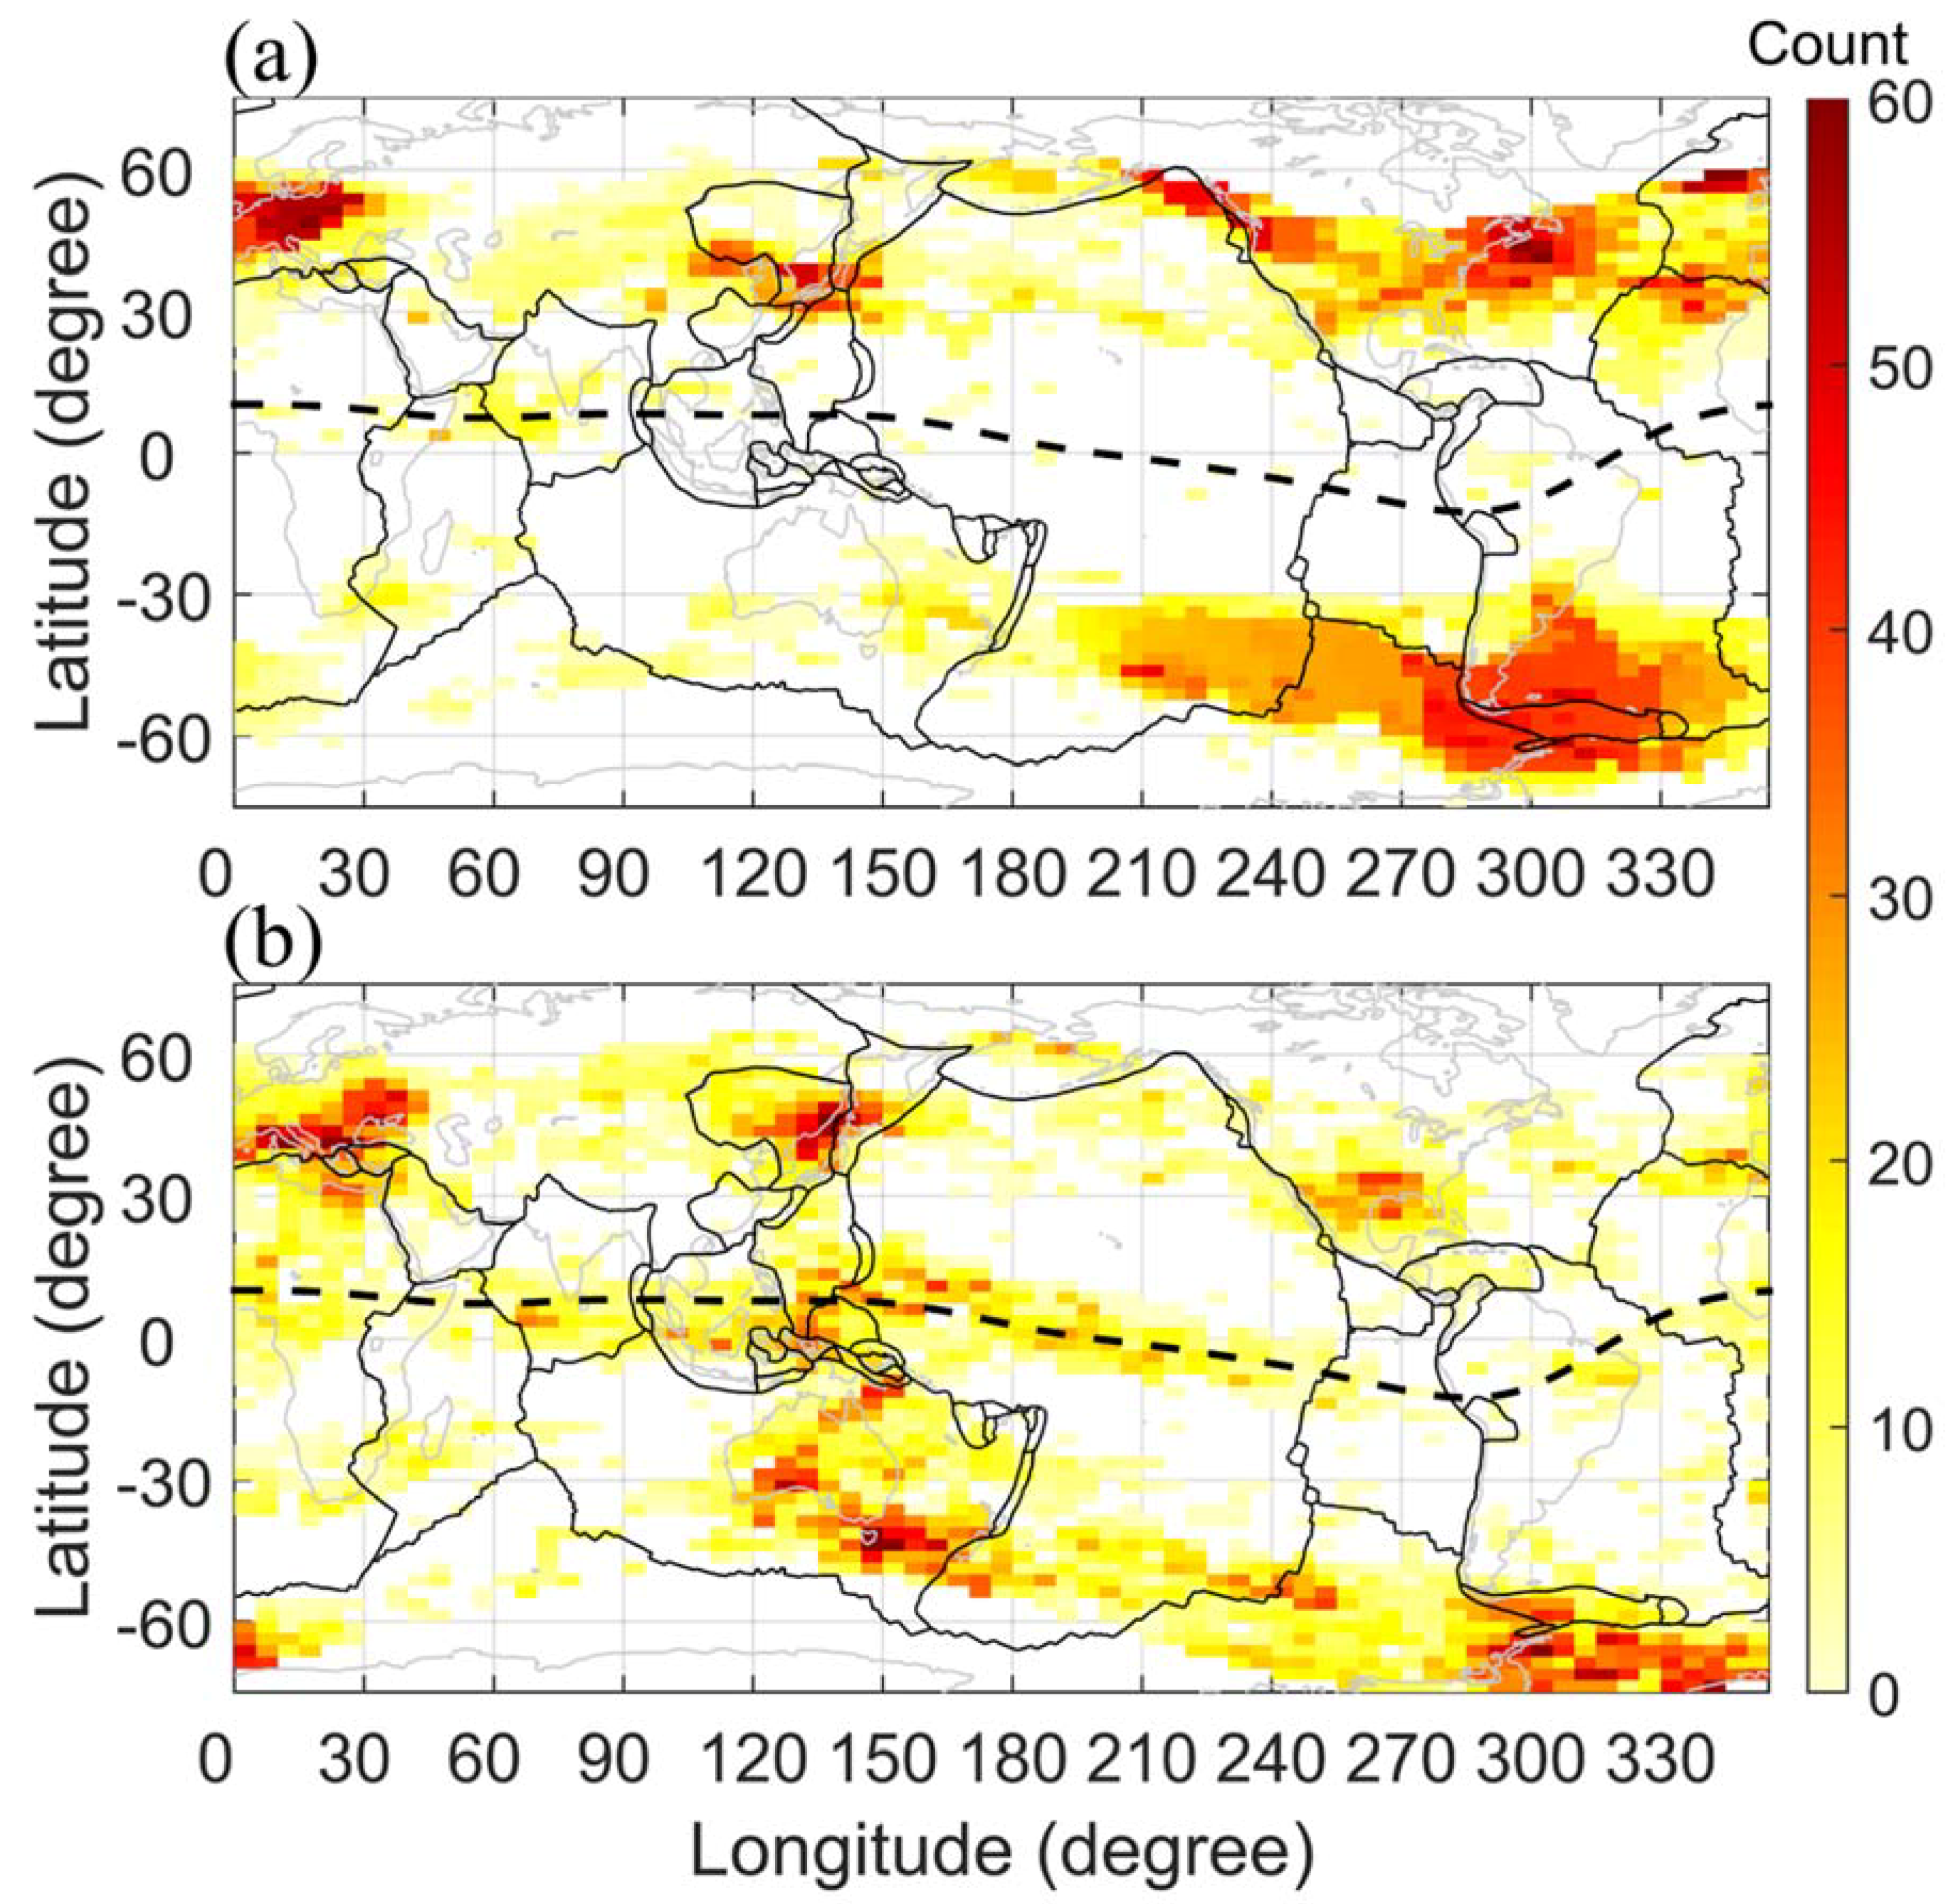
Figure 4 shows counts of the location of the negative and positive anomalies with the persistent duration longer than 24 h at each lattice from 2005 to 2018. The TEC anomalies mainly persist at midlatitudes (~30° to 60° geomagnetic latitudes). In Figure 4a, the negative TEC anomaly persists mainly over the areas of Weddell sea to the Eastern Pacific (270° to 340° E), Mongolia to Japan (115° to 150° E), and Northern America to Europe (210° to 30° E). In Figure 4b, the positive TEC anomaly persists mainly over the areas of Southern Australia to New Zealand (120° to 170° E), Weddell sea (280° to 10° E), Southern America (250° to 280° E), Europe (0° to 45° E), China Northeast to Japan (120° to 150° E), and Indonesia (120° to 170° E). The location of the positive TEC anomalies mainly distributes along the ring of fire on the western Pacific coast.

4. Discussion

The 8-h median value of the duration of persistence suggests that a TEC anomaly hardly persists across day and night over a particular location under geomagnetic quiet condition because the ionospheric morphology yields significant diurnal variation, such as the zonal electric field flipping its direction from eastward to westward mainly in day and night, respectively [1]. Therefore, quite a few TEC anomalies persist longer than 24 h (Figure 3). A TEC anomaly being capable of appearing continuously across day and night suggests that activity from the lithosphere or near-surface environment is a candidate for maintaining TEC anomaly over a certain location.
The conjugate phenomenon of the positive anomaly is obvious in the eastern Asia to Australia longitudinal sector (Figure 4b). Liu et al. [4,5,6,7] reported the occurrence of TEC anomaly around the epicenters of the Wenchuan, Sumatra, Haiti, and Tohoku earthquakes and their conjugate points. The anomalies are stronger near the epicenters than those at the conjugate points in the Southern Hemisphere. The weaker conjugate effect on the negative anomaly can be due to the fact that K = 3 is a strict criterion for defining the negative anomaly (Figure 3).
The interactions between tectonic plates could induce variations in electric and magnetic fields [11,12,13,14]. A strong location preference of the long-duration persistence of TEC anomalies may satisfy the persistence of regional electric field and/or an atmospheric gravity wave in the ionospheric dynamo region that induce TEC anomalies over a certain location through the dynamo process [15,16].
Several studies have reported in-situ satellite measurements of ion density (Ni), electron density (Ne), ion temperature (Ti), and electron temperature (Te) that record the ionosphere morphology response to large earthquakes. Liu et al. [17] examined seismo–ionospheric anomalies observed by the French satellite DEMETER (Detection of Electro-Magnetic Emissions Transmitted from Earthquake Regions) during the Wenchuan earthquake. They showed that the global distribution of the significant differences (or anomalous changes) in the nighttime Ne and Ni as well as daytime Ti 1 to 6 days before and after the earthquake specifically appear over the epicenter. Ryu et al. [18] analyzed the DEMETER Ni around large earthquakes in the north-east Asian region and reported that mid-latitude earthquakes contribute to the equatorial ionization anomaly enhancement. Oyama et al. [19] showed the ionospheric Te observed by HINOTORI satellite during three earthquakes and found that Te around the epicenters significantly decreases in the afternoon periods within 5 days before and after the earthquakes occurred in the eastern Asia longitudinal sector from 80º E to 120º E. The above studies showed the density and temperature measurements, but the response of eclectic field or ion drift to large earthquakes has not yet been fully understood. The electric field and ion drift measurements from the current missions of DMSP (Defense Meteorological Satellite Program), FORMOSAT-5, CSES (China Seismo-Electromagnetic Satellite), and SWARM, etc. should also be examined carefully to find out the connection between lithospheric activities and ionospheric morphologies.
The TEC anomalies appear over the Weddell sea area where the field-aligned component of thermospheric neutral wind highly controls the movement of ionospheric plasma and its density at the midlatitude of the Southern Hemisphere [20,21,22]. The northern Midlatitude Summer Nighttime Anomaly (MSNA) appears near the areas of Europe to Eastern America, Siberia to Alaska [23] that agree mainly with the distribution of the TEC anomalies in the Northern Hemisphere (Figure 4). The agreement reveals that the thermospheric neutral wind may contribute to the formation of the TEC anomalies at midlatitudes.
The high persistence of positive TEC anomaly in the longitudinal band between 105° E and 150° E in the Southern Hemisphere corresponds to the valley between the two peaks of ionospheric electron density over South Asia and the Central Pacific Ocean [24]. The regional persistence should be irrelevant to the ionospheric dynamo driven by global atmospheric tides from the lower atmosphere that result in the ionospheric four-peak structure [25,26].

5. Conclusions

This study defined the persistence of the negative and positive TEC (total electron content) anomalies with the strict criteria of K = 3 and persistent duration >24 h for examining the global preference of the TEC anomaly persistence under geomagnetic condition using the CODE GIM (global ionospheric map) TEC data from 2005 to 2018. Only 1.45% and 3.78% of negative and positive anomalies persist longer than 24 h. The conjugate phenomenon of the TEC anomaly is most significant at the eastern Asia to Australia longitudinal sector. The temporal and spatial anomalies of the ionospheric electric field, atmospheric electric field (flash), atmospheric gravity wave, and neutral wind over the ring of fire should be further examined for explaining the location preference of the persistence of the TEC anomalies. Distinguishing the effect of electrodynamics/electric field from the neutral wind effect on the persistence of the TEC anomalies at midlatitudes benefits to resolve the mechanism of the lithosphere–atmosphere–ionosphere coupling phenomena [27].

Author Contributions

Conceptualization, Y.-Y.S. and J.-Y.L.; methodology, J.-Y.L.; validation, Y.-Y.S. and T.-Y.W.; formal analysis, Y.-Y.S. and T.-Y.W.; investigation, Y.-Y.S., J.-Y.L., T.-Y.W., and C.-H.C.; resources, Y.-Y.S.; data curation, Y.-Y.S.; writing—original draft preparation, Y.-Y.S.; writing—review and editing, Y.-Y.S., J.-Y.L., T.-Y.W, and C.-H.C.; visualization, Y.-Y.S. and T.-Y.W.; supervision, Y.-Y.S.; project administration, Y.-Y.S.; funding acquisition, Y.-Y.S.

Funding

This research was funded by NSFC (National Nature Science Foundation of China), grant number 41804154 and the Fundamental Research Funds for the Central Universities, China University of Geosciences (Wuhan), grant number 2018022.

Acknowledgments

The authors gratefully acknowledge the Crustal Dynamics Data Information System (CDDIS) for providing the global ionospheric map (GIM) of CODE (ftp://cddis.gsfc.nasa.gov/pub/gps/products/ionex).

Conflicts of Interest

The authors declare no conflict of interest.

References

  1. Kelley, M.C. The Earth’s Ionosphere: Plasma Physics and Electrodynamics, 2nd ed.; Academic Publishers: San Diego, CA, USA, 2009; ISBN 978-0-1208-8425-4. [Google Scholar]
  2. Sun, Y.Y.; Matsuo, T.; Eduardo, E.A.; Liu, J.Y. Ground-based GPS observation of SED-associated irregularities over CONUS. J. Geophys. Res. Space Phys. 2013, 118, 2474–2489. [Google Scholar] [CrossRef]
  3. Sun, Y.Y.; Liu, J.Y.; Lin, C.H.; Lin, C.Y.; Shen, M.H.; Chen, C.H.; Chen, C.H.; Chou, M.Y. Ionospheric bow wave induced by the moon shadow ship over the continent of United States on 21 August 2017. Geophys. Res. Lett. 2018, 45, 538–544. [Google Scholar] [CrossRef]
  4. Liu, J.Y.; Chen, Y.I.; Chen, C.H.; Liu, C.Y.; Chen, C.Y.; Nishihashi, M.; Li, J.Z.; Xia, Y.Q.; Oyama, K.I.; Hattori, K.; et al. Seismoionospheric GPS total electron content anomalies observed before the 12 May 2008 Mw7.9 Wenchuan earthquake. J. Geophys. Res. 2009, 114, A04320. [Google Scholar] [CrossRef]
  5. Liu, J.Y.; Chen, Y.I.; Chen, C.H.; Hattori, K. Temporal and spatial precursors in the ionospheric global positioning system (GPS) total electron content observed before the 26 December 2004 M9.3 Sumatra–Andaman Earthquake. J. Geophys. Res. 2010, 115, A09312. [Google Scholar] [CrossRef]
  6. Liu, J.Y.; Le, H.; Chen, Y.I.; Chen, C.H.; Liu, L.; Wan, W.; Su, Y.Z.; Sun, Y.Y.; Lin, C.H.; Chen, M.Q. Observations and simulations of seismoionospheric GPS total electron content anomalies before the 12 January 2010 M7 Haiti earthquake. J. Geophys. Res. 2011, 116, A04302. [Google Scholar] [CrossRef]
  7. Liu, J.Y.; Hattori, K.; Chen, Y.I. Application of Total Electron Content Derived from the Global Navigation Satellite System for Detecting Earthquake Precursors. In Pre-Earthquake Processes: A Multidisciplinary Approach to Earthquake Prediction Studies; Ouzounov, D., Pulinets, S., Hattori, K., Taylor, P., Eds.; John Wiley & Sons: Hoboken, NJ, USA, 2018; pp. 305–317. ISBN 978-1-1191-5693-2. [Google Scholar]
  8. Sun, Y.Y.; Liu, J.Y.; Tsai, H.F.; Krankowski, A. Global ionosphere map constructed by using total electron content from ground-based GNSS receiver and FORMOSAT-3/COSMIC GPS occultation experiment. GPS Solut. 2017, 21, 1583–1591. [Google Scholar] [CrossRef]
  9. Schaer, S. Mapping and Predicting the Earth’s Ionosphere Using the Global Positioning System; Geodätisch-Geophysikalische Arbeiten in der Schweiz; Schweizerische Geodätische Kommission: Zürich, Switzerland, 1999; Volume 59. [Google Scholar]
  10. Kotz, S.; Johnson, N.L. Encyclopedia of Statistical Sciences; John Wiley & Sons: Hoboken, NJ, USA, 1983. [Google Scholar]
  11. Yen, H.Y.; Chen, C.H.; Yeh, Y.H.; Liu, J.Y.; Lin, C.R.; Tsai, Y.B. Geomagnetic fluctuations during the 1999 Chi-Chi earthquake in Taiwan. Earth Planets Space 2004, 56, 39–45. [Google Scholar] [CrossRef] [Green Version]
  12. Chen, C.H.; Lin, C.H.; Wang, C.H.; Liu, J.Y.; Yeh, T.K.; Yen, H.Y.; Lin, T.W. Potential relationships between seismo-deformation and seismo-conductivity anomalies. J. Asian Earth Sci. 2015, 114, 327–337. [Google Scholar] [CrossRef]
  13. Liu, J.Y.; Tsai, Y.B.; Chen, C.H.; Chen, Y.I.; Yen, H.Y. Integrated, Search for Taiwan Earthquake Precursors (iSTEP). IEEJ Trans. Fundam. Mater. 2016, 136, 214–220. [Google Scholar] [CrossRef]
  14. Tsai, Y.B.; Liu, J.Y.; Shin, T.C.; Yen, H.Y.; Chen, C.H. Multidisciplinary Earthquake Precursor Studies in Taiwan: A Review and Future Prospects. In Pre-Earthquake Processes: A Multidisciplinary Approach to Earthquake Prediction Studies; Ouzounov, D., Pulinets, S., Hattori, K., Taylor, P., Eds.; John Wiley & Sons: Hoboken, NJ, USA, 2018; pp. 41–65. ISBN 978-1-1191-5693-2. [Google Scholar]
  15. Sun, Y.Y.; Oyama, K.I.; Liu, J.Y.; Jhuang, H.K.; Cheng, C.Z. The neutral temperature in the ionospheric dynamo region and the relation with the ionospheric density during Wenchuan and Pingtung earthquakes. Nat. Hazard. Earth Syst. Sci. 2011, 11, 1759–1768. [Google Scholar] [CrossRef]
  16. Oyama, K.I.; Chen, C.H.; Bankov, L.; Minakshi, D.; Ryu, K.; Liu, J.Y.; Liu, H. Precursor effect of March 11, 2011 off the coast of Tohoku earthquake on high and low latitude ionospheres and its possible disturbing mechanism. Adv. Space Res. 2019, 63, 2623–2637. [Google Scholar] [CrossRef]
  17. Liu, J.Y.; Chen, Y.I.; Huang, C.C.; Parrot, M.; Shen, X.H.; Pulinets, S.A.; Yang, Q.S.; Ho, Y.Y. A spatial analysis on seismo-ionospheric anomalies observed by DEMETER during the 2008 M8.0 Wenchuan earthquake. J. Asian Earth Sci. 2015, 114, 414–419. [Google Scholar] [CrossRef]
  18. Ryu, K.; Oyama, K.I.; Bankov, L.; Chen, C.H.; Devi, M.; Liu, H.; Liu, J.Y. Precursory enhancement of EIA in the morning sector: Contribution from mid-latitude large earthquakes in the north-east Asian region. Adv. Space Res. 2016, 57, 268–280. [Google Scholar] [CrossRef]
  19. Oyama, K.I.; Kakinami, Y.; Liu, J.Y.; Kamogawa, M.; Kodama, T. Reduction of electron temperature in low latitude ionosphere at 600 km before and after large earthquakes. J. Geophys. Res. 2008, 113, A11317. [Google Scholar] [CrossRef]
  20. Chen, C.H.; Huba, J.D.; Saito, A.; Lin, C.H.; Liu, J.Y. Theoretical study of the ionospheric Weddell Sea Anomaly using SAMI2. J. Geophys. Res. 2011, 116, A04305. [Google Scholar] [CrossRef]
  21. Chang, F.Y.; Liu, J.Y.; Chang, L.C.; Lin, C.H.; Chen, C.H. Three-dimensional electron density along the WSA and MSNA latitudes probed by FORMOSAT-3/COSMIC. Earthplanets Space 2015, 67(1), 1–8. [Google Scholar] [CrossRef] [Green Version]
  22. Sun, Y.Y.; Matsuo, T.; Maruyama, N.; Liu, J.Y. Field-aligned neutral wind bias correction scheme for global ionospheric modeling at midlatitudes by assimilating FORMOSAT-3/COSMIC hmF2 data under geomagnetically quiet conditions. J. Geophys. Res. Space Phys. 2015, 120, 3130–3149. [Google Scholar] [CrossRef]
  23. Lin, C.H.; Liu, C.H.; Liu, J.Y.; Chen, C.H.; Burns, A.G.; Wang, W. Midlatitude summer nighttime anomaly of the ionospheric electron density observed by FORMOSAT-3/COSMIC. J. Geophys. Res. 2010, 115, A03308. [Google Scholar] [CrossRef]
  24. Lin, C.H.; Hsiao, C.C.; Liu, J.Y.; Liu, C.H. Longitudinal structure of the equatorial ionosphere: Time evolution of the four-peaked EIA structure. J. Geophys. Res. 2009, 112, A12305. [Google Scholar] [CrossRef]
  25. Sun, Y.Y.; Liu, H.; Miyoshi, Y.; Liu, L.; Chang, L.C. El Niño-Southern Oscillation effect on quasi-biennial oscillations of temperature diurnal tides in the mesosphere and lower thermosphere. Earthplanets Space 2018, 70, 85. [Google Scholar] [CrossRef]
  26. Sun, Y.Y.; Liu, H.; Miyoshi, Y.; Chang, L.C.; Liu, L. El Niño–Southern Oscillation effect on ionospheric tidal/SPW amplitude in 2007–2015 FORMOSAT-3/COSMIC observations. Earthplanets Space 2019, 71, 35. [Google Scholar] [CrossRef]
  27. Ouzounov, D.; Pulinets, S.; Hattori, K.; Taylor, P. Pre-Earthquake Processes: A Multidisciplinary Approach to Earthquake Prediction Studies; John Wiley & Sons: Hoboken, NJ, USA, 2018; ISBN 978-1-1191-5693-2. [Google Scholar]
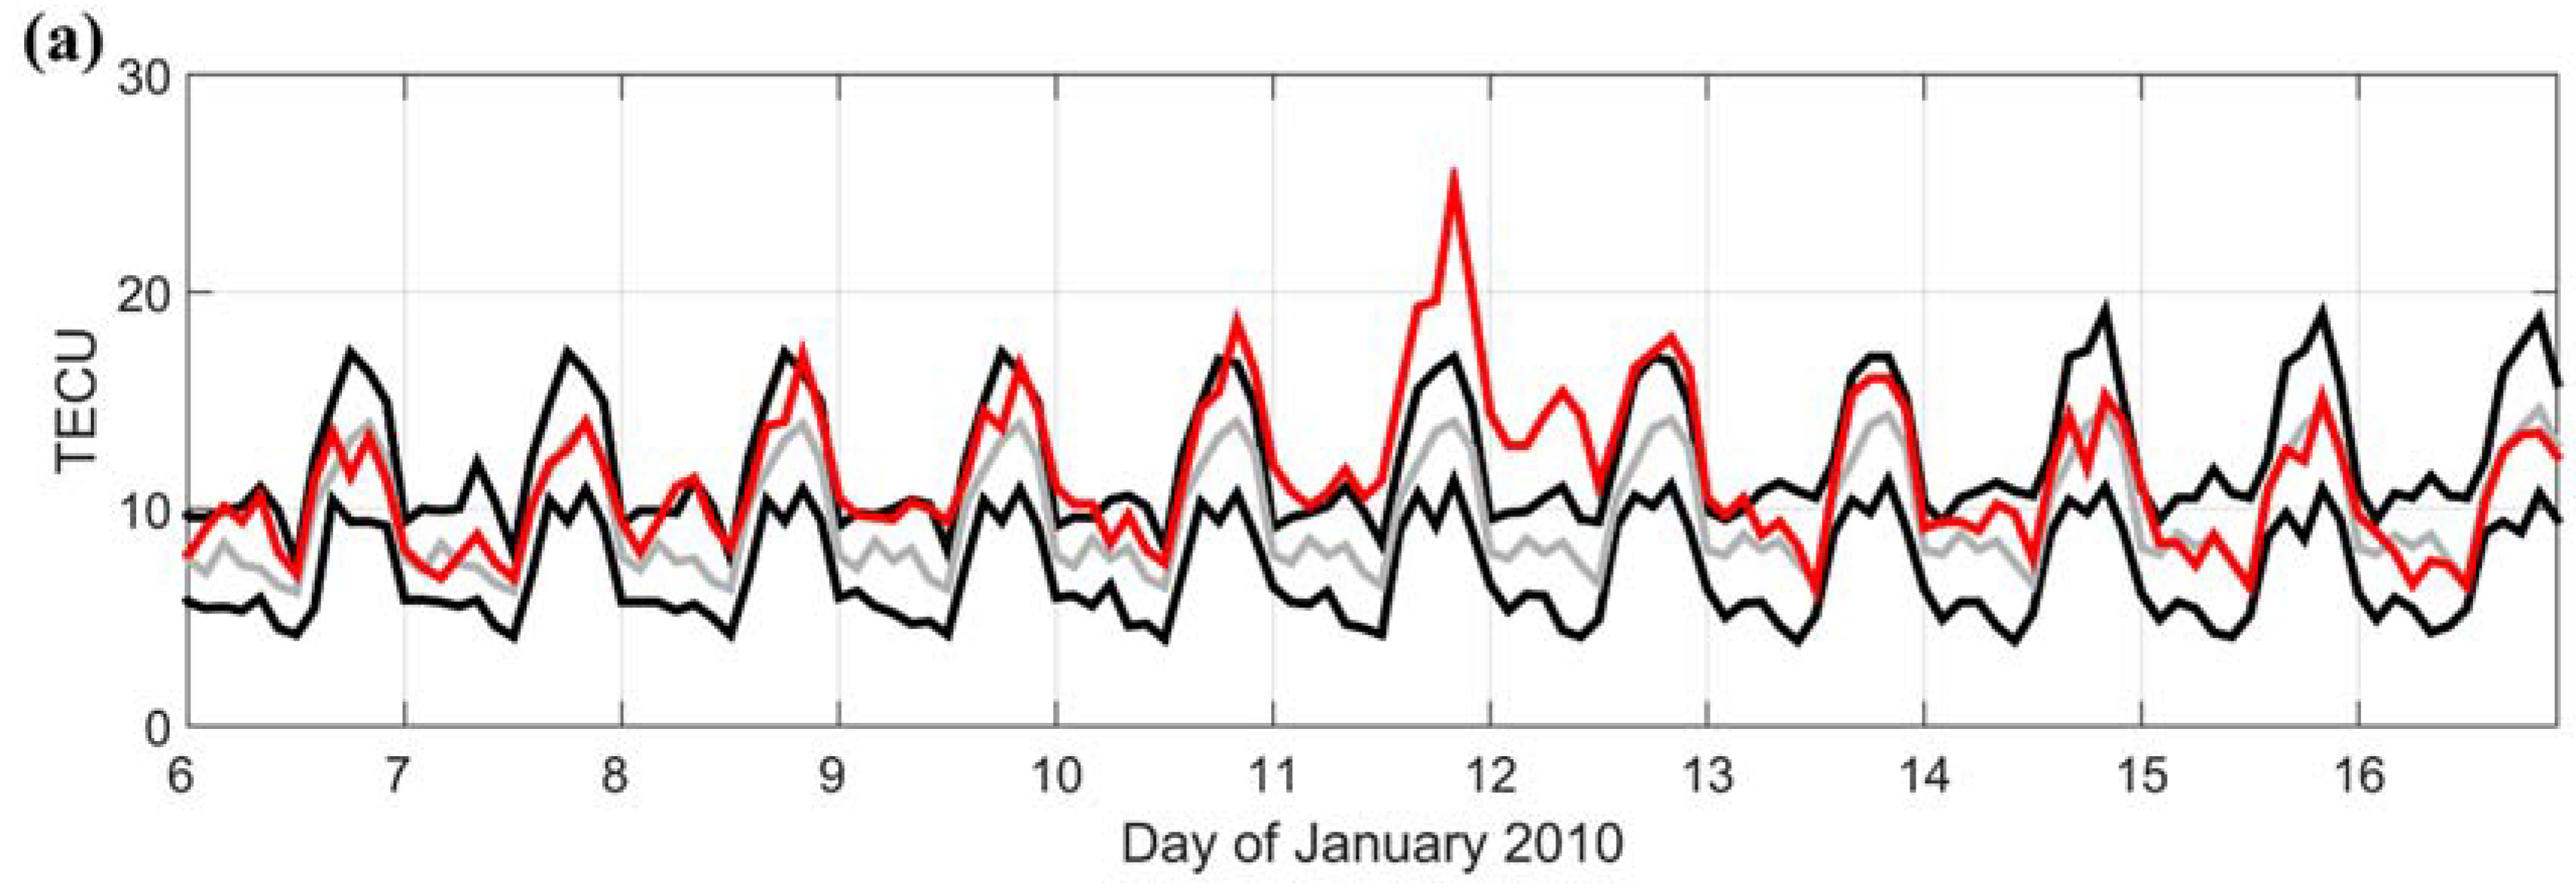
Figure 1. (a) Day-to-day variability in the total electron content (TEC) (red line) from Center for Orbit Determination in Europe (CODE) global ionospheric map (GIM) at 25° N, 90° W. The TEC continuously exceeds the upper bound (UB) from 2000UT on 10 January 2010 to 0400UT on 13 January 2010. The gray and two black curves are the associated medians and UB/lower bound (LB), respectively. The bounds at the current timestep are constructed by the 1 to 30 previous days’ median, lower quartile, and upper quartile at the same universal time and lattices. (b) Global distribution of positive TEC anomaly (TEC–UB) from 10 to 13 January 2010.
Atmosphere 10 00297 g001aAtmosphere 10 00297 g001b
Figure 2. The positive TEC anomaly persists over the Gulf of Mexico (near 25° N, 90° W) for more than two days.
Atmosphere 10 00297 g002
Figure 3. Time series of the persistent duration of (a) the negative and (b) positive TEC anomalies. The dashed red line indicates the criterion of 24 h. 1.45% of the positive anomaly and 3.78% of the negative anomaly persist longer than 24 h.
Atmosphere 10 00297 g003
Figure 4. Distribution of the (a) negative and (b) positive TEC anomalies persisting longer than 24 h. The dashed curve denotes the magnetic equator. The gray and black lines, respectively, sketch the coast and the boundaries of the tectonic plates.
Atmosphere 10 00297 g004