Article

A Test Stand Study on the Volatile Emissions of a Passenger Car Brake Assembly

1
Brembo S.p.A., 24040 Stezzano (BG), Italy
2
Department of Chemistry, Faculty of Materials Science and Technology, VSB-Technical University of Ostrava, 708 00 Ostrava, Czech Republic
3
Department of Machine Design, KTH Royal Institute of Technology, 10044 Stockholm, Sweden
*
Author to whom correspondence should be addressed.
Atmosphere 2019, 10(5), 263; https://doi.org/10.3390/atmos10050263
Submission received: 22 March 2019 / Revised: 30 April 2019 / Accepted: 6 May 2019 / Published: 10 May 2019
(This article belongs to the Special Issue Traffic-Related Emissions)

Abstract

:
Brake-related airborne particulate matter contributes to urban emissions in the transport sector. Recent research demonstrated a clear dependence of the number of ultra-fine particles on the disc brake temperature. Above the so-called transition temperature, the number of ultra-fine particles increases dramatically (several magnitudes). As for exhaust emissions, part of the emissions released during braking can be in the volatile fraction. For this reason, a disc brake test stand specifically designed for aerosol research was equipped with three different aerosol sampling instruments: (i) a standard cascade impactor, (ii) a cascade impactor operating at high temperature with a heated sampling line, and (iii) a standard cascade impactor with a thermodenuder. Tests with a brake assembly representative of European passenger vehicles were executed, and the concentration of released airborne particles was determined. The results showed a decrease by several magnitudes in the concentration (in the size range of below 200 nm) using the cascade impactor operating at 180 °C with the sampling line heated to 200 °C. A further decrease in the concentration of airborne particles with size fractions below 200 nm was measured using a standard cascade impactor with a thermodenuder heated to 300 °C.

1. Introduction

Aerosols generated by car disc brake systems contribute considerably to emissions in urban areas [1]. Studies from field tests, dedicated laboratory tests in disc brake dynamometers, and pin-on-disc tribometers reveal a wide spectrum of aerosol ranges from above 10 µm to below 6 nm [2,3,4]. Furthermore, recent research shows that the size of disc brake aerosols can be reduced to 1 nm [5].
Disc brakes typically consist of two pads that are pressed against the rotor to stop the vehicle by mechanical friction. There is a critical brake material temperature at which the ultrafine particle emission rate rises stepwise by 10 times for railway brake operations [6] and by four to six orders of magnitude in the case of passenger car friction brake operations. This was demonstrated at the pin-on-disc level where Nosko et al. [7] found a transition temperature of 168–189 °C measured in the disc material. Similarly, Alemani et al. [4,8,9] observed that the transition temperature was unaffected by other testing conditions in the range 165–190 °C. Instead, Wahlström et al. [10] found that the ultrafine number increased by several magnitudes when the pin temperature approached 300 °C. The issue of the transient temperature at the brake dynamometer level was also addressed by Mathissen et al. [11] who noticed that emissions were at about 109 N/stop up to a disc temperature of 160 °C, while the number rose by five orders of magnitude for higher temperatures. Garg et al. [12] stated that the particle number increased by 1–2 orders of magnitude when the temperature rose from 200 to 400 °C because of supposed condensation phenomena that could be influenced by airflow used in the experiment. Kukutschová et al. [13] noticed an increase in particle concentration in the ultrafine fraction when the rotor temperature exceeded 300 °C because the organics present in the friction brake material initiated combustion. In addition, the temperature transition process is reversible, and the concentration decreases when the temperature decreases. Below the critical temperature, fine particles outnumber coarse particles, although the coarse particles predominantly contribute to the mass of particulate matter. Above the critical temperature, ultrafine particles constitute almost 100% of the total particle number, and their relative mass contribution can exceed 50% [4]. Recently, Nosko and Olofsson [14] found that the effective density of the disc brake aerosols was 0.75 ± 0.2 g/cm3, and that effective density was sensitive to temperature variations in the disc brake pad and rotor material. The effective density decreased with a temperature in the range of 110–360 °C. There is a large difference between the effective density and the apparent density of particle material, which suggests that the particles are porous [15].
In the case of assessing car exhaust emissions, special attention has been given to the volatile fraction of tailpipe aerosols, and observations have affected the standardized methods of exhaust emission measurements [16,17]. In contrast, only few studies have started to assess the volatile fraction of brake particle emissions. The already published studies were limited to analysis of the content of organic compounds in friction materials of new pads or brake debris collected after brake dynamometer tests [18,19]. Other work showed utilization of volatile particle removers in the case of a singular brake dynamometer test configuration and concluded that, in this specific case, there was no falsification of results because of the non-exhaust brake volatiles [20].
Volatile material may remain in the gas phase, condense on solid particles, or form new particles by nucleation. For example, in terms of the urban background particulate matter (PM) with aerodynamic diameter less than 2.5 μm (PM2.5), it has been shown that in southern Europe 65%–70% of the PM2.5 concentration arises from secondary aerosols, whereas only 30%–35% is attributed to primary aerosols [21]. To study the behaviour of an aerosol in terms of the degree of thermal instability as a function of temperature, one possibility is that the aerosol passes through a heater before it enters the specific aerosol analysing instrument [22,23]. One of the modern evolutions of this concept is in the case of Euro 5b/6 legislation for a volatile particle remover (VPR) in which the sampled aerosol passes through an evaporation tube so all volatile particles evaporate from the sample [24,25]. Another alternative is to use a thermodenuder (TD), which is an instrument specifically designed to remove volatile material from aerosol particles through thermal desorption [26,27,28,29]. A thermodenuder consists of a heated tube where volatile material is desorbed from the particles and a water- or air-cooled tube consisting of activated charcoal. This last tube removes desorbed material and, thus, prevents it from being re-absorbed onto the particles consisting only of the non-volatile portion of the aerosol. Although the TD was originally designed for measuring particulate emissions from combustion processes, it can also be applied to the measurement of atmospheric aerosols.
Since a brake event is a transient process, a high sampling frequency instrument with considerable size resolution is necessary for disc brake aerosol studies, and such an instrument used in combination alternatively with a heated sampling line (HSL) and a thermodenuder can provide information on the number and size distribution of the volatile fraction in disc brake aerosols. For this reason, the experiments within this research were designed to study the effect of both a heated sampling line and a thermodenuder on the number of particles in a given size interval as well as on the emission factors of airborne particles released during the full-scale dynamometer test.

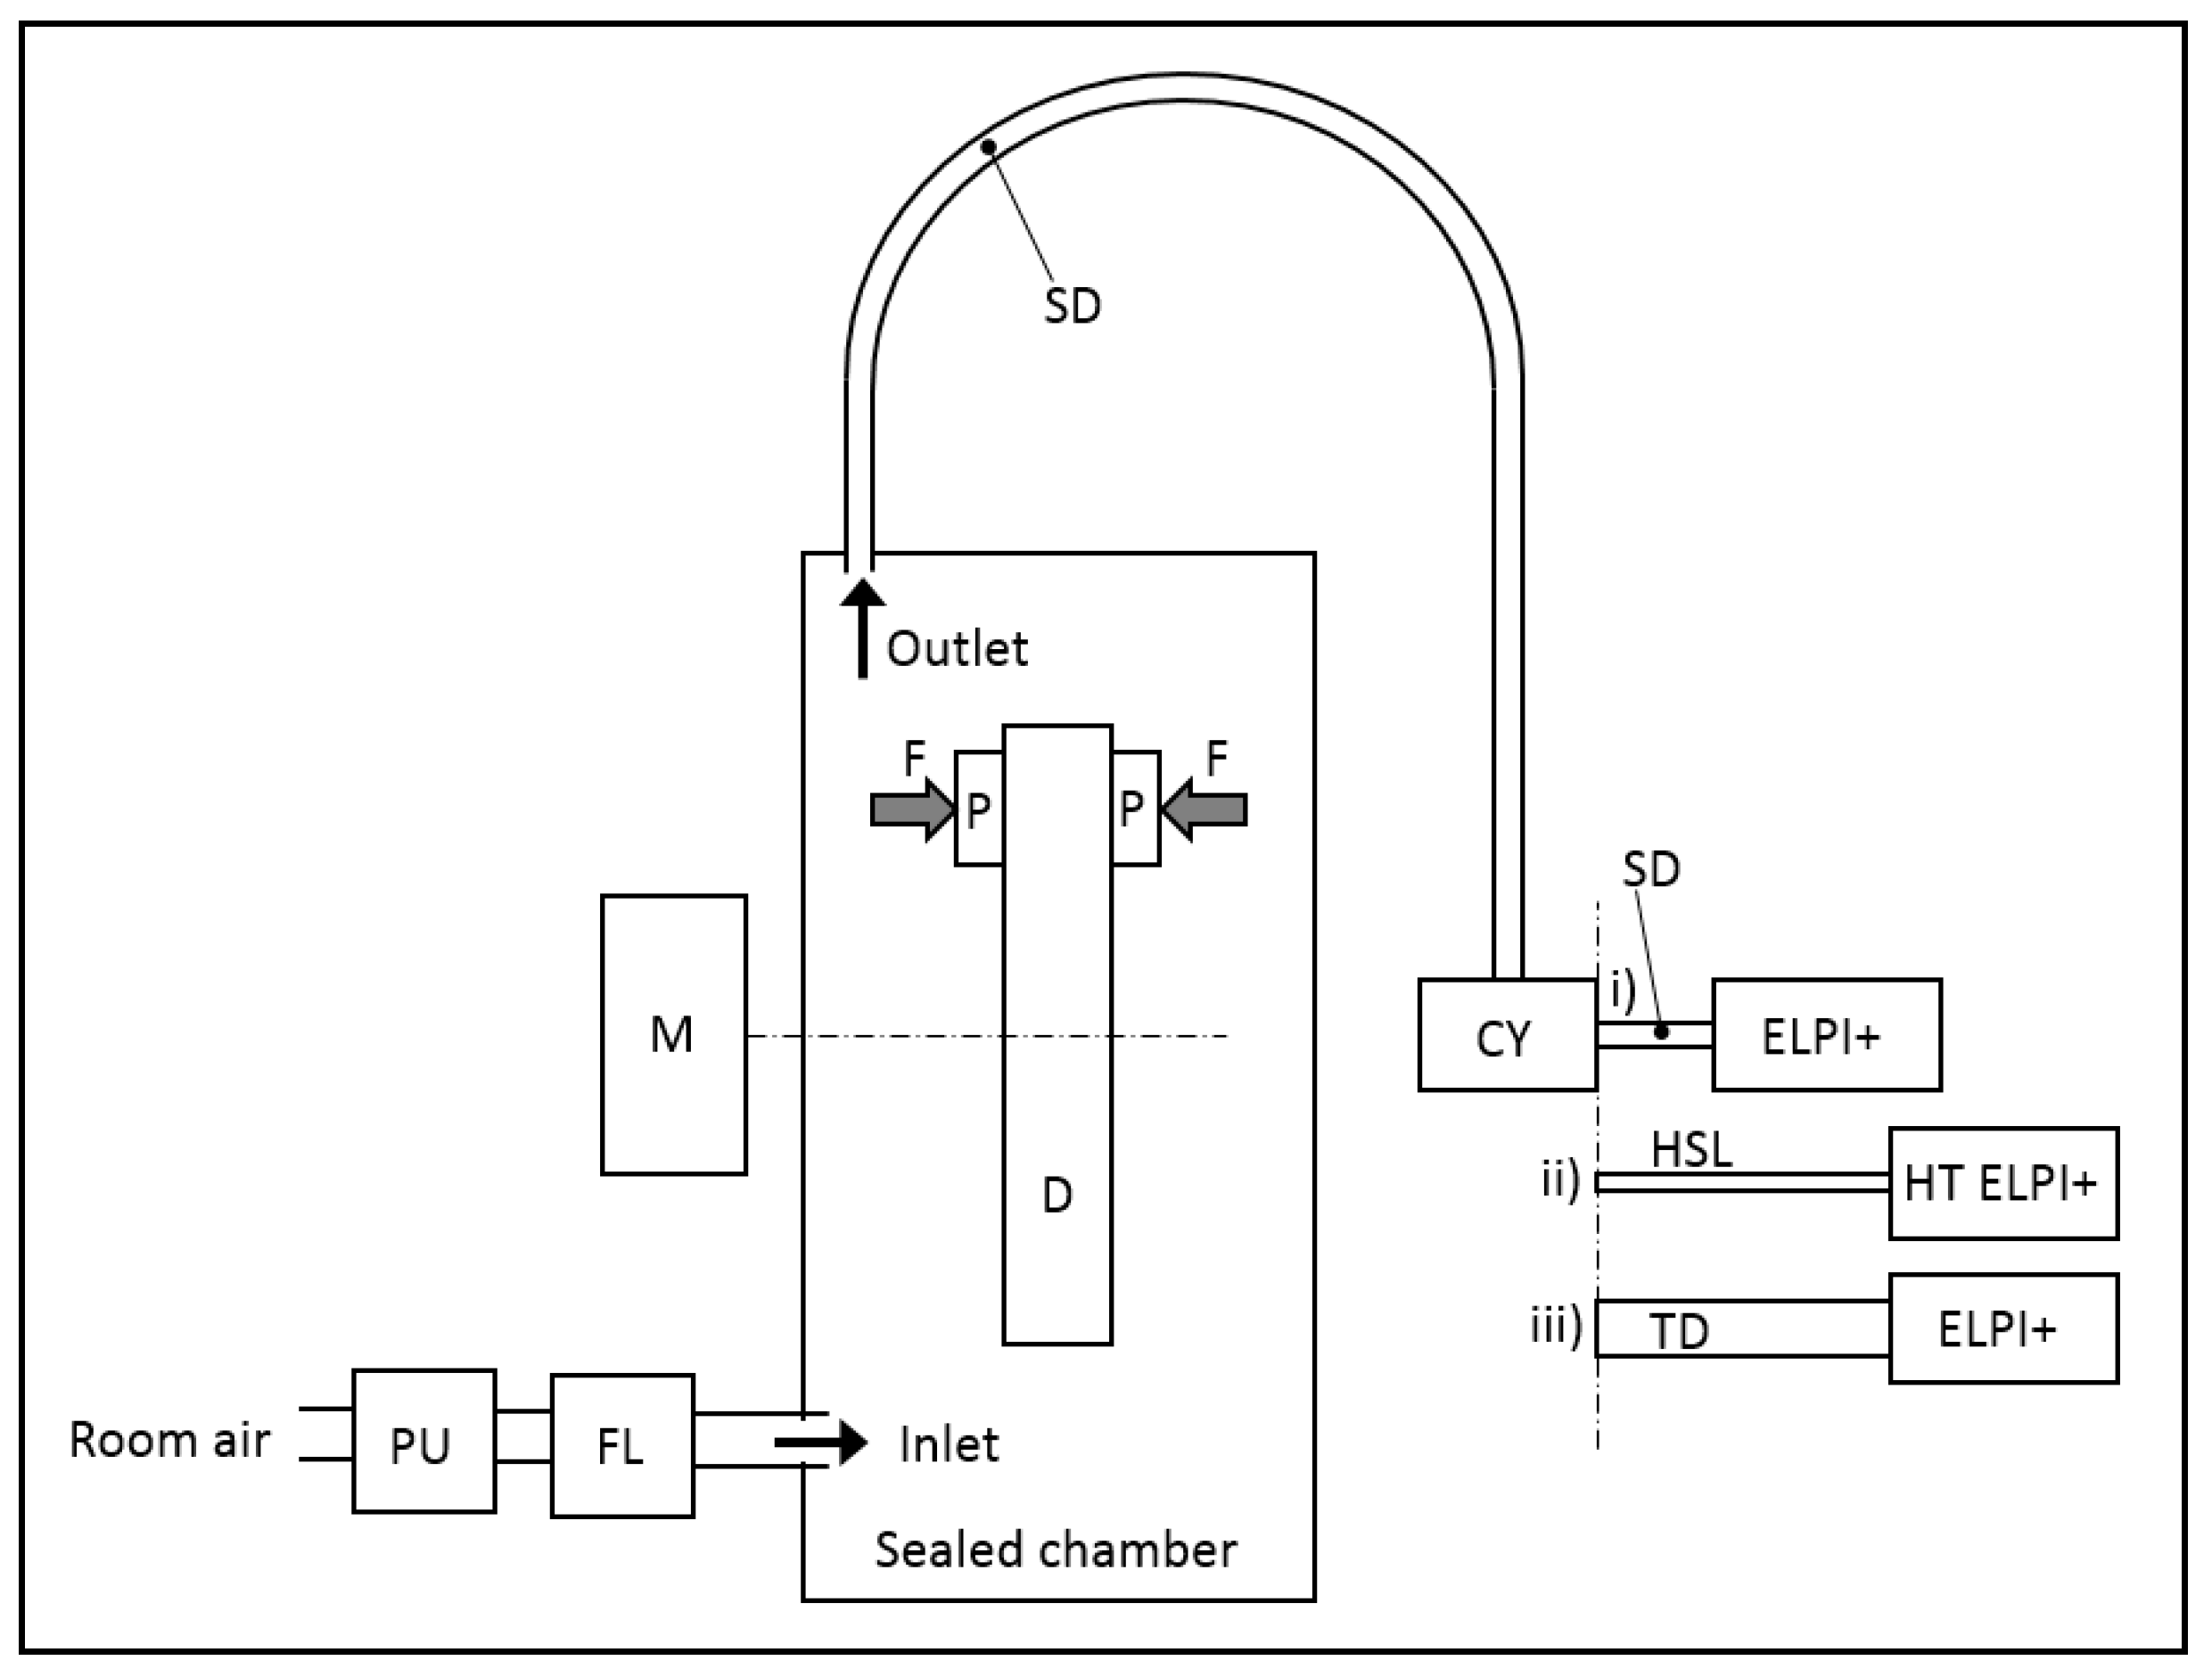
2. Materials and Methods

A front left disc brake assembly characteristic of a typical medium-size European passenger car was used in this work. The disc brake consisted of a ventilated disc made of cast iron, an aluminium fixed calliper with four pistons, and two brake pads. Detailed vehicle and brake system data were presented in [30]. The chemical composition of the brake pad obtained by X-ray fluorescence spectroscopy is presented in Table 1, whereas the chemical composition of the brake disc measured using optical emission spectroscopy is shown in Table 2.
The friction material belonged to the low-metallic brake lining category that is currently most widely used in Europe [31,32]. A disc brake dynamometer specifically designed for aerosol studies was used in this work. Design of this test stand was discussed in previous works [33,34]. The main features implemented in this test stand were: controlled clean air and isokinetic sampling with high sampling efficiency. A closed clean air system was realized by building a slightly over-pressurized box around the brake assembly and using high efficiency particulate air (HEPA) filters to convey the filtered air to over-pressurized box. Two isokinetic probes were used at the outlet and were connected to two cyclones (Dekati® Cyclone) with a 10 μm cut point at 10 L/min (0.6 m3/h). The volume rate of aerosol sampled from the impactor was 10 L/min, whereas the total volume rate through the box was 1175 m3/h. This meant that the volume fraction of the sampled aerosol was 0.051%.
To measure particulate number emissions, three different instruments were alternatively connected to the cyclones: (i) a standard cascade impactor (Dekati ELPI®+, also referred to as ELPI+); (ii) a cascade impactor operating at high temperature (Dekati High Temperature ELPI®+, also called HT ELPI+) with a heated sampling line (Dekati® DEED-150), charger, and impactor; and (iii) the same standard cascade impactor as (i) whereas a thermodenuder (Dekati® Thermodenuder) was used as a sampling line. A schematic of the experimental setup is illustrated in Figure 1.
The ELPI+ instruments were used for real-time measurements of particle size distributions in 14 size stages (from 6 nm up to 10 μm) at a sampling frequency of 1 Hz [35]. The thermodenuder consisted of an aerosol heater and active carbon absorber section. The heater section (up to 300 °C) heated the aerosol sample when it entered the instrument and desorbed volatile compounds. After the heater section, the aerosol sample entered the absorber, which absorbed the vaporized compounds using active charcoal. Cooling air was applied around the absorber section to decrease the sample temperature at the outlet to ambient levels. In the test presented here, the temperature of the heater section of the thermodenuder was set to 300 °C.
A cascade impactor operating at high temperature allowed direct measurement of aerosol samples up to 180 °C without the aerosol cooling down. This instrument was used in connection with a heated sampling line that allowed the sampled aerosol to be heated up to 200 °C; the entire heated line was 150 cm long. In the test presented here, the HT ELPI+ was set to 180 °C (the temperature at the inlet of the impactor), and the sampling line was heated to 200 °C. According to Kannosto [36], who described the temperature profile in an HT ELPI+ impactor, the temperature at the inlet to the HT ELPI+ impactor was approximately 180 °C, whereas the temperature at the outlet from the impactor was 120 °C. Inside the impactor with collection plates, the distribution of the temperature was more homogenous and ranged from 140–165 °C. Before carrying out the test, the HT ELPI+ instrument was left to stabilize for five hours so that the temperature was stable. The HT ELPI+ calibration parameter file selected was the one for a 180 °C working temperature.
The same setup of the inertia full-scale brake dynamometer as described in [34] was used to measure brake torque, hydraulic pressure, pad temperature, and rotor temperature during the braking events at a sample rate of 50 Hz. The temperatures of the pads were measured using K-Type thermocouples positioned in the pad centre, 3 mm below the back plate, whereas the temperature of the rotor was monitored with two sliding K-Type thermocouples on both contact surfaces and one embedded thermocouple, 3 mm below the rotor surface, with a copper pin that connected the thermocouple tip to the rotor surface.
A modified SAE-J 2707 procedure was used during testing (see Table 3). This modified test procedure was first proposed by Perricone et al. [33] to conduct particle emission measurements.

3. Sampling Efficiency in the Thermodenuder and in the Heated Sampling Line (HSL)

Several processes may lead to losses of particles in the sampling line. The sampling line included: (i) the sampling ducts and (ii) the thermodenuder or the heated line, before entering in the cascade impactor or in the cascade impactor operating at high temperature, respectively, as shown in Figure 1. With regard to the sampling ducts, the efficiency losses for the used dyno-bench setup were calculated in [34]. To calculate losses of the particles in the thermodenuder and in the heated sampling line, we assumed that losses came from Brownian diffusion, thermophoresis, and sedimentation [37,38]; which of these effects dominated depended on the temperature and particle size.

3.1. Aerosol Losses for the Thermodenuder

Particle losses in the thermodenuder were determined according to the user manual [39] with the following formulas for the measured particle correction after the TD:
1 η = 9.7   ln ( D p ) 0.5 Q + 68 ,   D p <   70   nm ,
1 η = 0.5 Q + 28 ,   70   nm   D p   500   nm ,
where η is the penetration of particles, Dp is the particle size (nm), and Q is the air flow rate (L/min). For a Dp = 10.9 nm and for a Dp = 494 nm—which correspond to the ELPI+ midpoint diameter of the lowest stage and the 8th stage, respectively—the penetration η was 60.2% and 77%, respectively.

3.2. Aerosol Losses for the Heated Sampling Line

In the case of the HSL, worst-case calculations were made to estimate the influence of thermophoresis, sedimentation, and Brownian diffusion [27]. Calculations were all with a flow rate of 10 L/min.

3.2.1. Thermophoretic Losses for the HSL

Losses due to thermophoresis in volatilization tubes have remained largely unaddressed in the literature. For an accurate calculation, a three-dimensional temperature profile must be considered [40]. A worst-case estimate was considered for thermophoretic phenomena; this kind of aerosol particle loss was triggered by a temperature gradient that caused suspended particles to move from higher temperature towards lower temperature. During this migration, if one particle hit a wall, it was considered stuck and lost. Thermophoresis is not strongly dependent on particle size; it becomes independent of diameter and particle composition for particles smaller than the mean free path, and this is the case we consider below. For larger particles, thermophoresis is less pronounced and becomes material-dependent—we decided to neglect this latter case. The drift velocity vT in one dimension is given by Hinds [38]:
v T = 2.8 × 10 4 c m s 1 K c m 1 d T d x .
Because the HSL consisted of a 200 °C heated section, and the entering aerosol was at a lower temperature then the heated line, we assumed that the wall was hotter than the tube centre. Thus, the particles would eventually drift towards the centre itself, and no losses would occur. Thermophoresis was important in the transition zone from the HSL to the cascade impactor operating at high temperature, where we assumed there was a wall temperature of 180 °C as selected in the HT ELPI+ settings. Furthermore, we considered that the HT ELPI+ began 7 cm after the end of the HSL; this meant that the main decrease in temperature occurred within 7 cm of the end of the HSL (200–180 °C). A flow rate of 10 L/min led to a residence time of t = 0.026 s in this zone. Assuming an average temperature of 190 °C (corresponding to a temperature difference of about 170 °C over 0.445 cm, which is the tube radius connecting the HSL to the HT ELPI+), the drift distance sT can be estimated as:
s T = v T t = 0.028   mm .
This meant that particles entering the tube within <0.028 mm of the tube wall would, therefore, reach the wall and precipitate corresponding to losses of 1.26%. This calculation assumed that the wall temperature was 20 °C. As the wall was warmer in the transition zone from the HSL to the HT ELPI+, losses were even smaller.

3.2.2. Sedimentation Losses for the HSL

Sedimentation affected larger particles. An aerodynamic diameter of dA = 1 μm led to a settling velocity of 3.48 × 10⁻³ cm s−1. Since our HSL had a diameter of 1.78 cm and a length of 150 cm, it resulted in a residence time of 5.6 s, and this corresponded to a settling distance of 0.019 mm. We assumed that all particles in the lower 0.019 mm layer of the tube were settled and so lost, and this meant a loss of 0.5%. Losses were smaller for finer particles. Conversely, the same calculation for 10 μm aerodynamic diameter particles resulted in a loss of 31% with a settling velocity of 3.06 × 10⁻¹ cm s−1 and a settling distance of 1.71 mm.

3.2.3. Diffusive Losses for the HSL

Unlike gas molecules, aerosol particles adhere when they collide with a surface. This meant that the aerosol concentration at the surface was equal to zero, and that a gradient was established in the region near the surface that triggered a continuous diffusion of aerosol particles to the surface, which in turn led to a gradual decay in the aerosol concentration. Diffusive losses inversely depended on particle size. Considering a mobility diameter d = 10 nm, a diffusion constant D = 5.3 × 10⁻⁴ cm2 s−1 resulted at ambient temperature. The deposition parameter can be calculated as [38]:
μ = D L Q = 4.77 × 10 4 ,
where L is the length of the heated sampling line, and Q is the air flow rate passing through the HSL. Consequently, according to [38], this value of μ caused losses of 3.2% at ambient temperature. For d = 20 nm and 100 nm, these losses were approximately 1.4% and 0.2%, respectively. Losses also depended on the temperature, and in this case the following equation was applied:
D = k T C C 3 π η d ,
where k is the Boltzmann constant, T the absolute temperature, CC is the Stokes–Cunningham correction factor, and η is the viscosity. Furthermore, the CC was calculated using following equation:
C C = 1 + 2.52 λ d ,
where λ is the mean free path of gas molecules. Considering now that λ was proportional to the temperature, and η was proportional to the square root of the temperature, an increase in D by a factor of 2.1 was obtained for T = 200 °C. The flow rate also increased linearly with absolute temperature, which led to a decrease in D by a factor of 1.6 and a final μ = 6.06 × 10⁻⁴. This deposition parameter was used to calculate that losses increased by 0.5% for particles with d = 10 nm and insignificantly for d = 100 nm.

4. Emission Factors

The particle number emission factor (EFPN)—expressed in terms of particle numbers emitted for each stop from a single front disc brake—can be determined by dividing the total number of particles measured during the entire test by the number of stops conducted during the test, calculated as:
E F P N = 1 N t 1 t 2 c Q d t ,
in which c is the measured particle concentration, Q is the air flow rate, and t1 and t2 are the start time and end time for the test. Note that in this work, the flow and sampling rates were constant, and the total number of airborne particles for a specific block Nblock could also be determined as:
N b l o c k = Q Δ t i = t 1 b t 2 b c i ,
in which t1b and t2b are the start time and end time for the considered block.
The geometric mean diameter of the particles was calculated as described in [41] using the equation:
log ( d ¯ g ) = i = 1 14 n i log ( d ¯ i ) i = 1 14 n i ,
where ni is the particle count for stage i, as measured from the ELPI+ during the entire test, and d ¯ i is the midpoint of the given size range. d ¯ i can be calculated as:
d ¯ i = d i + d i + 1 2 ,
where di is the 50% diameter cut-point for the filter i as determined by instrument specifications.

5. Results

Figure 2 presents the results in terms of total concentration versus aerodynamic diameter, as measured from the used cascade impactors and corrected for the calculated losses, with both Equations (1) and (2) for the TD and with Equations (3)–(7), and the arguments of the dedicated section, for the HSL. Results showed that with a sampling line heated to 200 °C together with heated collection plates (HT ELPI+), the particle number in the size fraction below 200 nm could be reduced on the order of several decades. In general, the size distribution chart in Figure 2 could be divided into a non-volatile part above 200 nm and a semi-volatile part below 200 nm. During the test, temperatures at 171 °C and 124 °C at the inlet and at the outlet of the impactor of ELPI+ HT, respectively, were measured.
Furthermore, when a thermodenuder set at 300 °C was used, the particle number in the size fraction below 30 nm was further reduced.
Figure 3 shows the total number of particle emissions subdivided per block as summed from measured data of the cascade impactors according to Equation (9). The initial and maximum disc braking temperatures for each block are also included in Figure 3. Figure 3 also clearly documents that the Country road block #1 emitted the vast majority of particles as well as initial and maximum disc braking temperatures of 200 °C and 251 °C, respectively, which were the highest temperatures between all blocks.
As an example, Figure 4 illustrates the instant values of the total concentration calculated for standard cascade impactor of ELPI+, and the one operating at high temperature in the case of HT ELPI+, measured for Town block #1. Note that the first two peaks were ascribed to preheating stops that were executed to heat the brake disc, while the 20 following stops were numbered in Figure 4. It was evident from Figure 4 that over time, the concentration became comparable for both detection setups (ELPI+ and HT ELPI+).
Figure 5 depicts the ratio—in terms of bubble diameter—of the total particle emission amount per block as measured for the standard cascade impactor and the one operating at high temperature. This ratio was plotted in a graph with the braking starting temperature as the x-axis versus the braking starting velocity as the y-axis. The labels associated to each block represented (i) the value of the ratio for that certain block, (ii) the braking starting temperature, (iii) the braking starting velocity, and (iv) the name of the block, while arrows between the bubbles indicated the timeline of the test cycle, also represented in Table 3. The largest ratio was ascribable to Country road block #1 (in Figure 5 assigned as Country #1).
The emission factor numbers per braking stop EFPN were calculated according to Equation (8), The values calculated for each sampling/measuring setup are listed in Table 4. The number of emission factors excluding a count of particles smaller than 200 nm were also reported in Table 4. With regard to the number of emission factors, it was possible to observe one order of magnitude of difference between the standard cascade impactor (std. ELPI+) test and the heated sampling line used in connection with the cascade impactor operating at high temperature (HT ELPI+). Further, a 2.5-fold decrease in EFPN was observed between the test with HT ELPI+ and the test with the ELPI+ in connection with the thermodenuder. In contrast with these results, when the number of emission factors were calculated considering only particles that were larger than 200 nm, differences were less pronounced and stayed on the same order of magnitude (see Table 4).
Additionally, the geometric mean diameter calculated according to Equation (10) is also presented in Table 4.

6. Discussion

Special attention is given to the volatile fraction of disc brake aerosols in this study. The results presented here demonstrate a significant reduction in particle numbers in the size range below 200 nm when a higher sampling temperature was used and further reduction when the thermodenuder was used. These results indicated that volatile fractions contributed to the generated aerosols from standard car disc braking systems for size distributions below 200 nm, and size distributions above 200 nm were not affected by volatiles, as indicated in Figure 2. These volatiles significantly contributed to these small-sized aerosols, as observed with tail pipe aerosols [16,17], whereas the semi-volatile part of tail pipe aerosols was below 80 nm in these studies.
The three tests carried out in the present study showed good agreement with regard to particle number distribution of the particles with size range between 200 nm and 10 μm, as illustrated in Figure 2, as well as documented with calculated values of EFPN for the same particle size range, as shown in Table 4. This means that the test setup, the cycle selected, and the instruments used for the measurement of particle numbers are robust enough to give rather similar information regarding particle concentration versus the particle aerodynamic diameter in the range above 200 nm (see Figure 2). Below 200 nm particle size diameters, the three curve layouts obtained for three different measuring strategies started to have different patterns, and the particle number emission factors were subjected to major differences. More specifically:
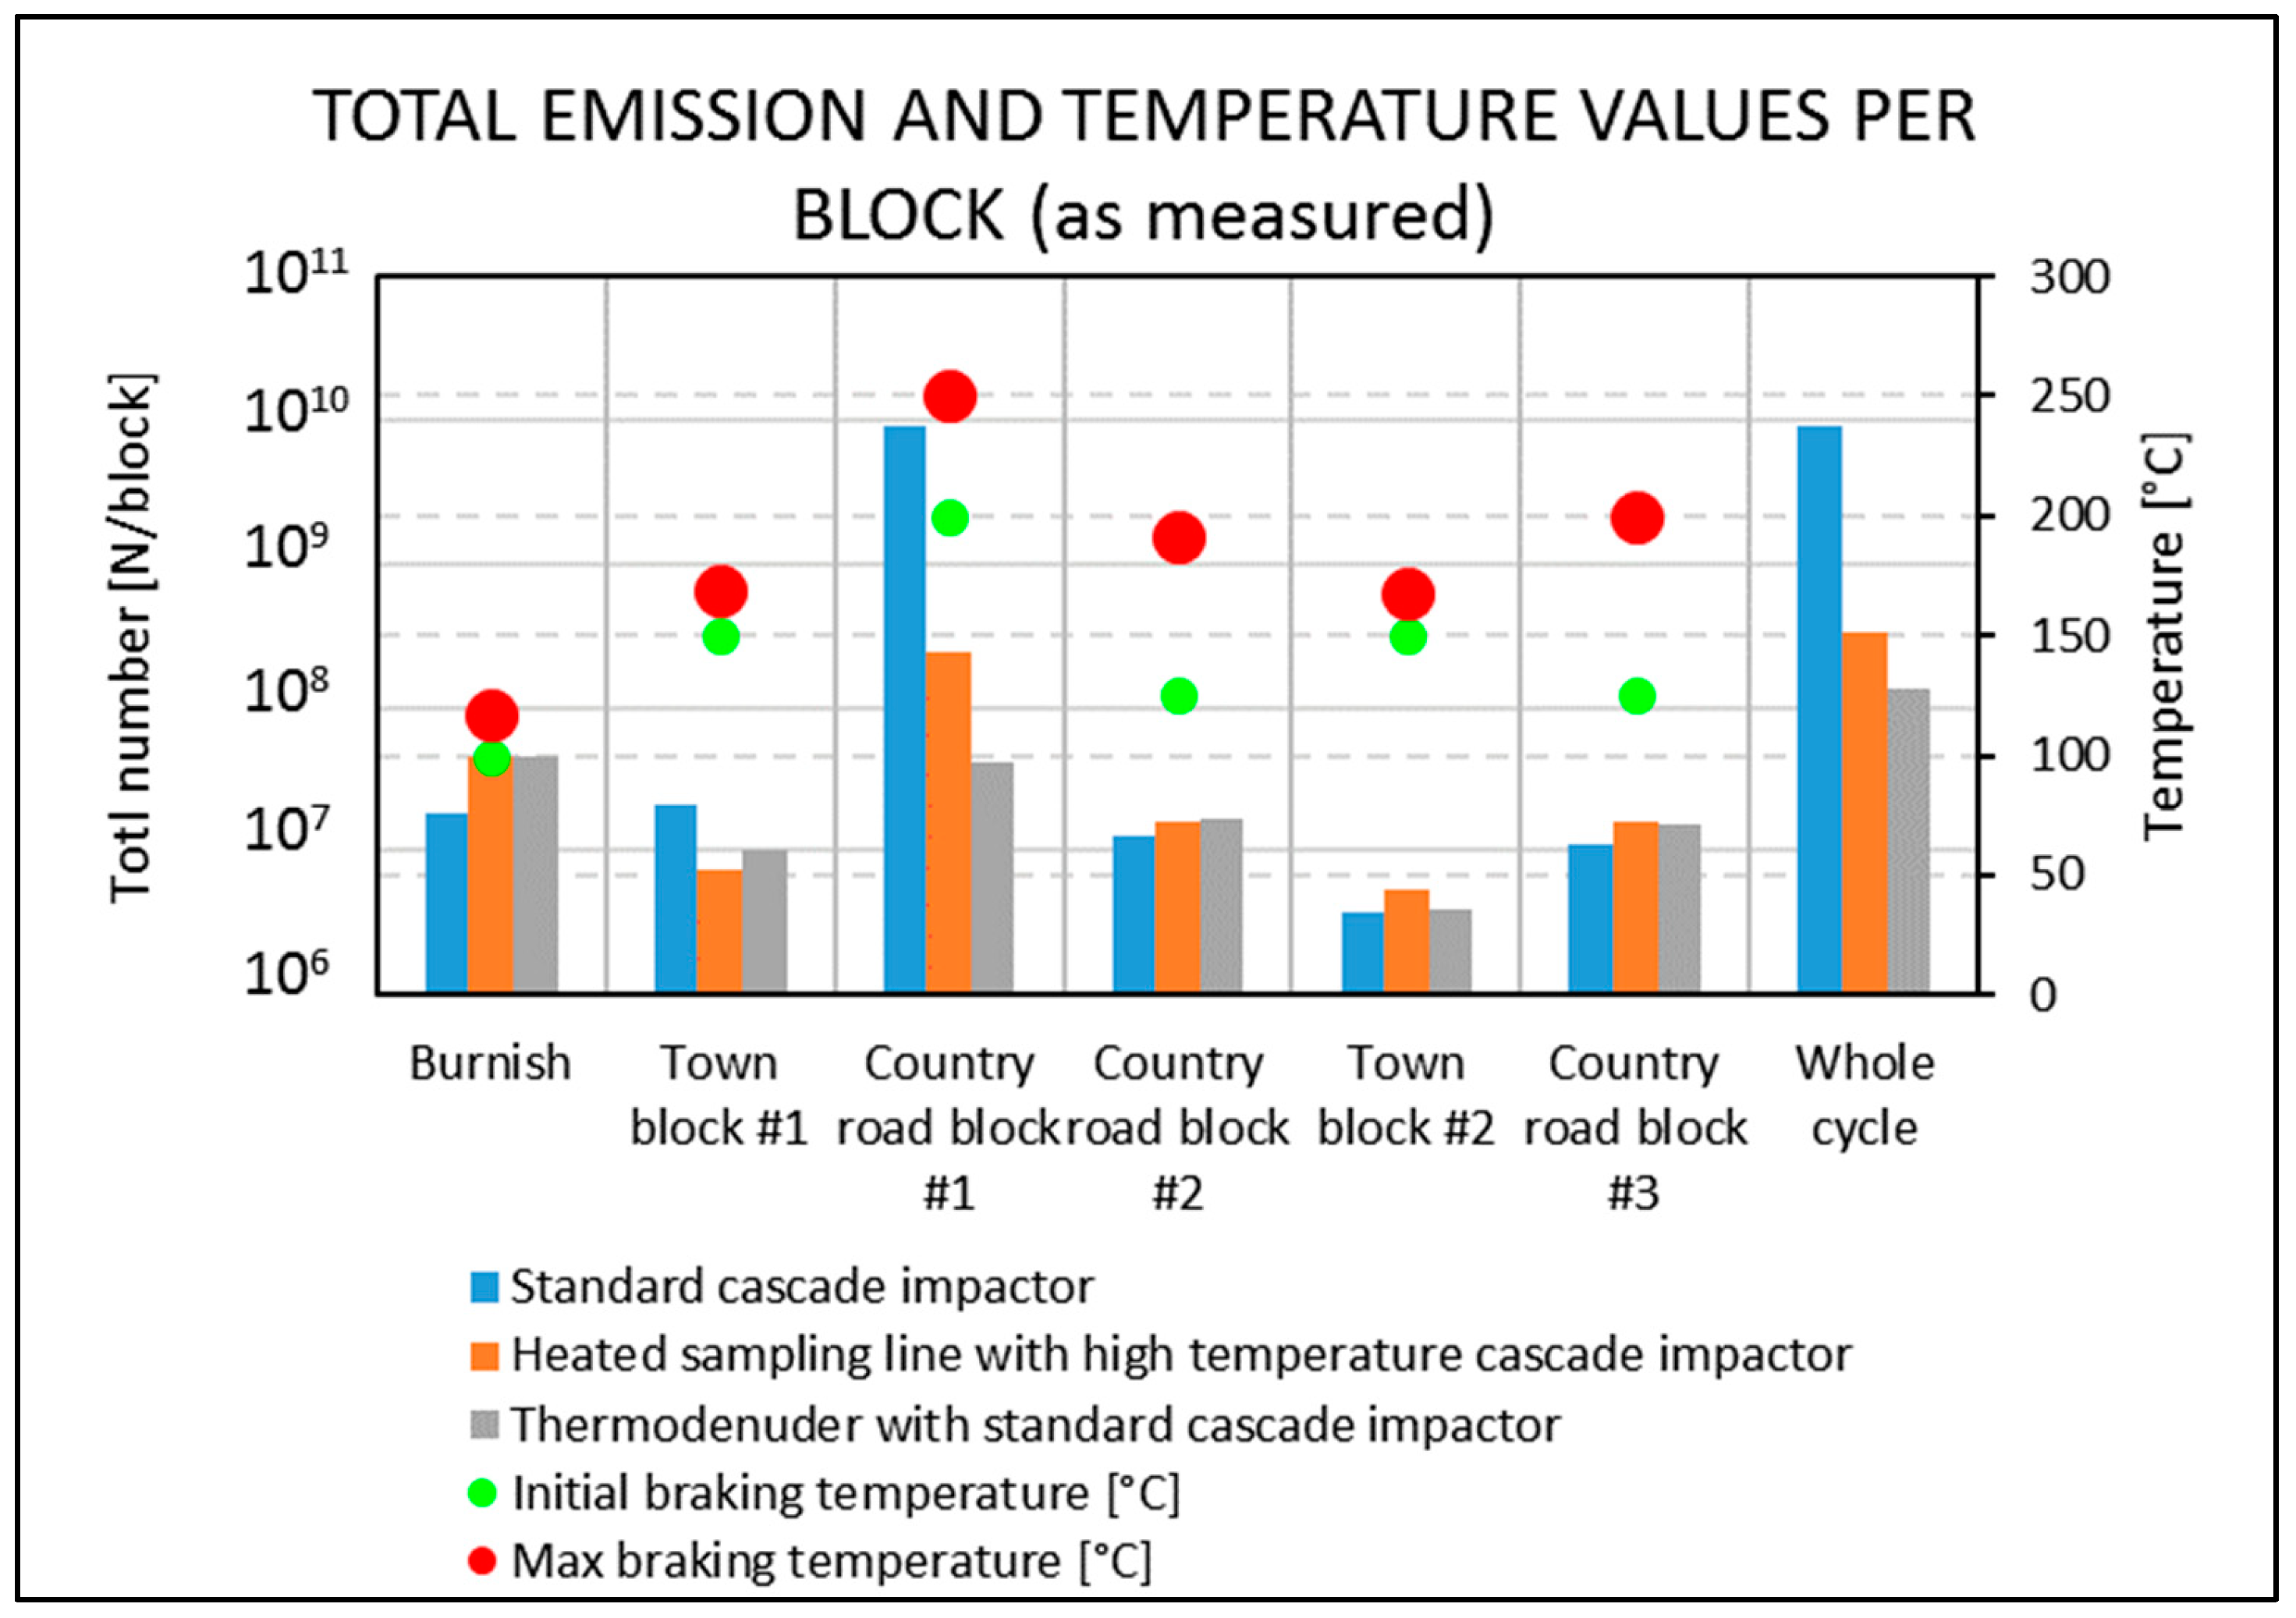
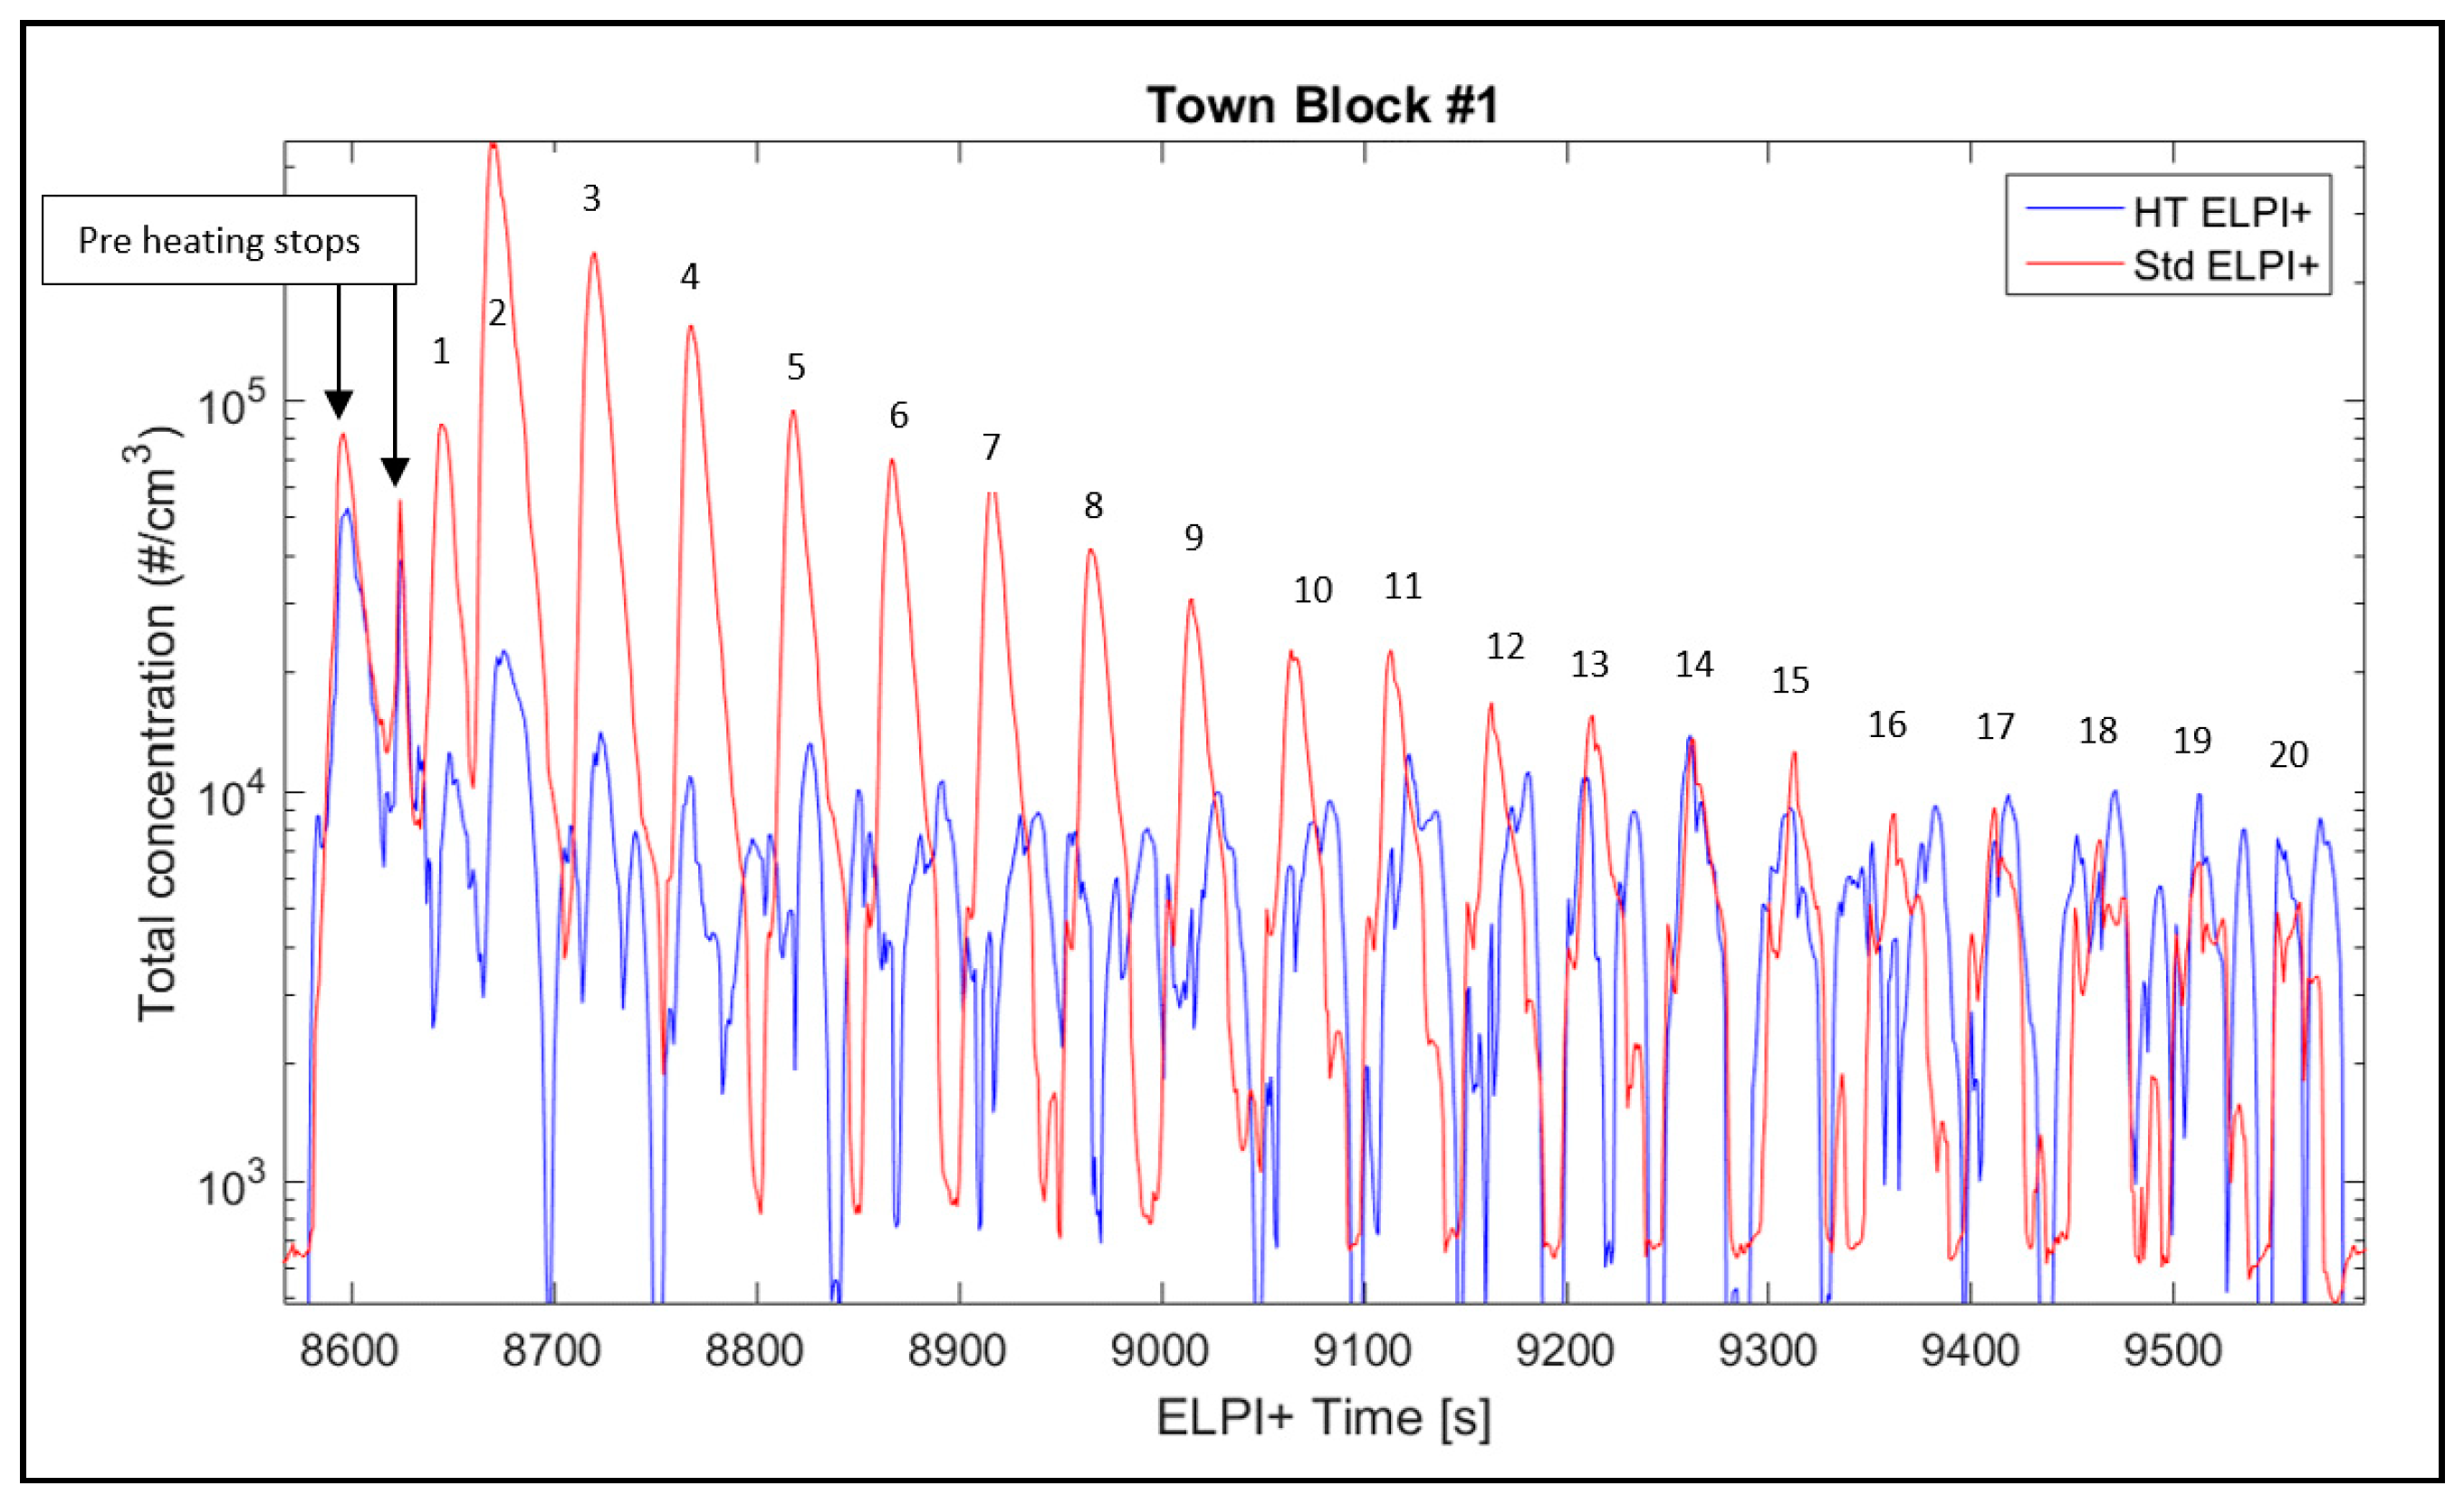
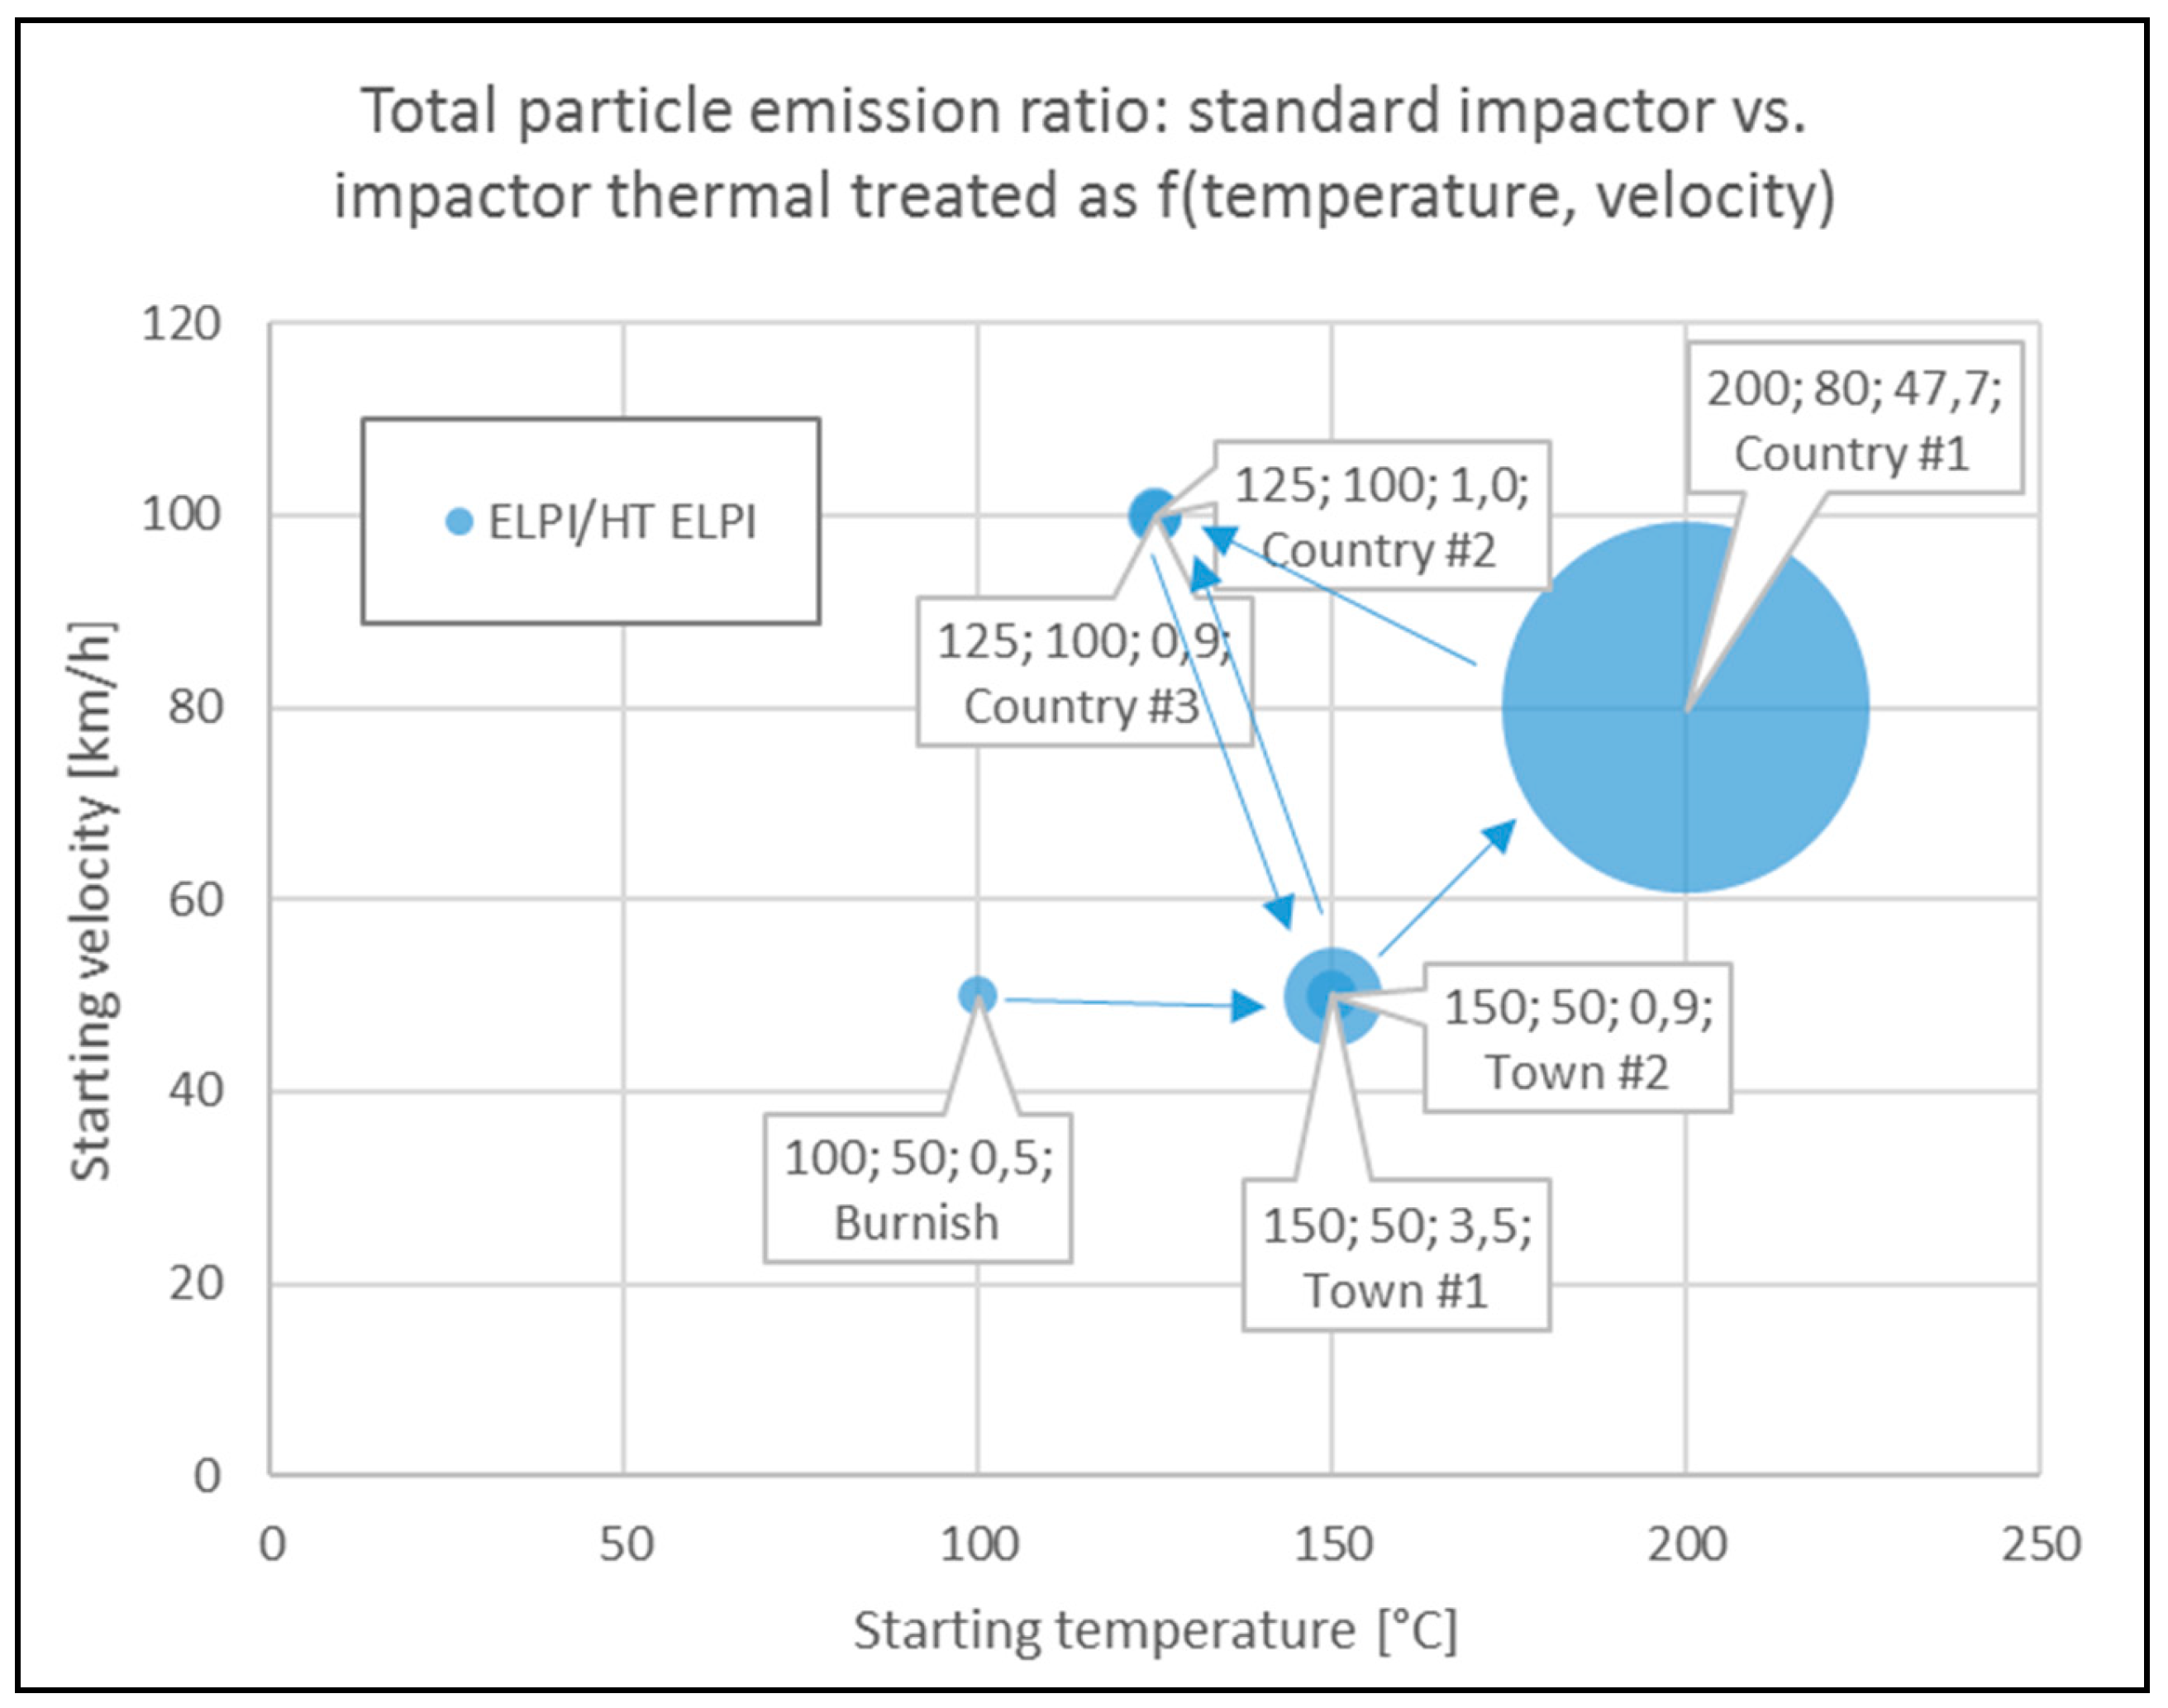
  • When comparing the two tests executed at the same time in this work using the standard cascade impactor (std. ELPI+) and the one operating at high temperature (HT ELPI+), a 28-fold higher EFPN can be detected for the standard cascade impactor, as reported in Table 4. This difference is due mainly to the count of particles smaller than 200 nm in the case of std. ELPI+, as can be seen in Figure 2. This means that 200 °C heating of the incoming air sample results in a decrease in particle count below 200 nm because organics and other easily volatilized compounds are lost. For example, an initial decrease in particle number may result from a loss of moisture in the chamber with the clean air blowing in, as also reported in [23] for natural aerosols. On the other hand, there may be a competitive phenomenon for which some larger particles can release smaller coagulated particles on their surface and so increase the total number of particles. Plachà et al. [19] reported that more than 150 different organic compounds were found in an unused milled brake pad, whereas only 49 confirmed compounds were found in actual-wear debris. This means that several organic compounds are released during the friction process, and as a result we can expect significant amounts of volatile organic compounds (VOCs) and semi-volatile organic compounds (SVOCs) to be released into the atmosphere as real VOCs or be absorbed in airborne particulate matter during braking. Note that in the heated sampling line (HT ELPI+) experiment, mass should be conserved because no device was used to absorb the volatilized fraction. For this reason, the volatile fraction should remain in the air flow but with different sizes; this could not be seen in Figure 2, where it seemed that a net loss of particles smaller than 200 nm occurred. The reason for this discrepancy could be that the particles were disaggregated in particles smaller than 6 nm (the lowest instrument detection limit), or heating changed some electrostatic, density, or shape properties of the particle as measured from the instrument. Further research is necessary to better address this. From Figure 4 it is possible to observe that in the first 13 stops out the 20 that make up Town block #1, the presence of volatile emissions that decrease stop-by-stop until becoming negligible in the last seven stops is clear. This means that volatile emissions are a transient phenomenon once disc braking parameters are kept constant. From Figure 5 it becomes clear that total particle emissions depend on experimental conditions such as the starting braking velocity, temperature, and the existence of some run-in effects as also described in [42]. In fact, considering the emission ratio we can observe that:
    (i)
    In the Burnish block, where initial stopping velocity and temperature are 50 km/h and 100 °C, respectively, the emission ratio is 0.5. This means that the HT ELPI+ measures more particles than the standard cascade impactor, and this can be ascribed to some poorly understood artefacts. Regarding the braking conditions, we can surely conclude that there are no volatiles.
    (ii)
    Increasing only the initial stopping temperature to 150 °C in Town block #1 leads to a ratio equal to 3.5. In this case, the standard ELPI+ measured 3.5 times more particles compared to the HT ELPI+, as is also qualitatively visible stop-by-stop from Figure 4.
    (iii)
    Increasing both the braking starting velocity and temperature to 80 km/h and 200 °C, respectively, as in Country road block #1, results in clearly visible volatile emissions, and the HT ELPI+ measures almost 50 times less particles than the standard one.
    (iv)
    Passing to Country road block #2, and so increasing the braking starting velocity to 125 km/h while at the same time decreasing the disc stopping starting temperature to 100 °C, does not trigger pronounced release of volatiles, and the ratio of emissions measured by the two cascade impactors equals 1: it is possible to believe that previous blocks have provoked the running in of the braking system.
    (v)
    The repetition of Town block #1, and namely carrying out Town block #2, showed that braking conditions in “soft” blocks did not cause release of volatile emissions.
    (vi)
    Repeating the conditions of Country road block #2 with the last Country road block #3 confirms again that the system is already run-in because no volatile emissions are observed.
  • When comparing the two tests that focused on heat conditioning of the sampled aerosol (one with the heated sampling line used in connection with the HT ELPI+ and one with the thermodenuder and the standard cascade impactor), a 2.5-fold higher EFPN was calculated for the HT ELPI+ setup, as reported in Table 4. This was due mainly to the number of particles smaller than around 20 nm, as shown in Figure 2. This indicates that the thermodenuder operating at 300 °C is more effective in removing the smallest particle fraction. This hypothesis is also supported by the fact that this experiment provided the particles with the biggest geometric mean diameter (see Table 4). One possible explanation for this phenomenon is that the compounds that volatilize at 300 °C are prevented from re-entering the aerosol stream thanks to the active charcoal that absorbs them when using the thermodenuder. If, however, VOCs are still in the aerosol stream after the aerosol has heated, as is the case in the heated sampling line, they can act as nucleation sites, or they can coagulate to form larger particles that can be detected in the cascade impactor of ELPI+. This is confirmed by the fact that the configuration with the heated sampling line is the one showing the smallest particle geometric mean diameter, as reported in Table 4, even though the related EFPN is much lower than the ones measured using the standard cascade impactor.
As highlighted in the Introduction, several authors [7,8,9,10,11,12,13] identified a critical temperature when brake friction materials were tested. In both pin-on-disc and dynamometric test setups, the critical temperature inducing a shift towards the emission of ultrafine particulate fraction is between 165 °C and 400 °C depending on the test conditions and tested materials. Considering the previous facts, if we look at Figure 3 we can see that the main contributor to the total amount of particles released during the whole cycle is the Country road block #1, especially for the standard cascade impactor test. The total particle sum obtained for the Whole cycle will not be affected if all the blocks are not considered, with the exception of Country road block #1, which is also in agreement with Perricone et al. [33]. So, one can suppose that in Country road block #1, the critical temperature triggering a sudden ultrafine particle emission is reached, and this fraction is mainly composed of volatiles. This indicates that severity of test conditions has a major influence on the generation of the volatile part and presents an interesting direction for further research on how to test friction pairs in disc brake systems in a way that can be representative, or not, of real-world conditions. Discussion about real-world driving conditions that generate ultrafine particles is out of scope of this paper, but it is worth to be noted that in newly developed braking cycles dedicated to the studies of brake wear particles [11,43], the maximum temperatures measured in the braking disc vehicle only reaches 129 °C in Mathissen et al. [11] and 194 °C in Perricone et al. [43], whereas a maximum temperature of 251°C in Country road block #1 is achieved in our experiments. From this perspective, it seems clear that abrupt ultrafine particle generation caused by a transition temperature should be representative of “extreme” driving conditions only. Note that according to Mathissen et al. [11], neither the initial rotor brake temperatures nor the initial speeds should be considered representative of real-world conditions, at least regarding the maximum disc temperature reached. From this point of view only the Burnish block included in our testing procedure would be considered as a set of brake stops matching temperatures typical for real-world braking conditions. It is evident that more detailed investigations on how parameters that are representative of real-world conditions (mainly velocity and temperature), as well as run-in effects, influence volatile emissions in brake dynamometer tests are needed in future work.
Considering that in this study we started each test with a new pair of brake pads and new cast iron discs, and that Town block #1 and Town block #2 are twin blocks, we can conclude that the friction pair can be considered well run-in after Country road block #1. During ranking of the different friction materials, as already published in our previous paper [33], usage of already run-in friction pairs may be crucial. Depending on when a friction material gets stabilized, and depending on the amount of VOCs released during the first blocks of the cycle, the ranking itself can be changed. Alternatively, it is necessary to use a test setup that handles the volatile fraction.

7. Conclusions

The experimental results presented here show a decrease by several magnitudes in the concentration of disc brake aerosols (size range below 200 nm) using a cascade impactor operating at 180 °C with the sampling line heated to 200 °C. A further decrease in this size range was noted using a standard cascade impactor with a thermodenuder heated to 300 °C. Furthermore, it has been demonstrated that the volatile part was mainly generated during the most severe part of the used test cycle (Country road block #1).

Author Contributions

Conceptualization, G.P. and U.O.; Data curation, V.M.; Formal analysis, G.P. and V.M.; Funding acquisition, G.P. and J.W.; Investigation, V.M. and M.A.; Methodology, G.P. and V.M.; Project administration, G.P.; Resources, M.A.; Supervision, J.W. and U.O.; Validation, G.P., V.M. and M.A.; Visualization, G.P.; Writing—original draft, G.P.; Writing—review & editing, G.P., J.W. and U.O.

Funding

The project leading to this application has received funding from (1) the European Union Seventh Framework Program (FP-PEOPLE-2012-IAPP) under the Rebrake Project, grant agreement no. 324385; and (2) the European Union’s Horizon 2020 research and innovation programme (H2020-MG-2014) under the Lowbrasys Project, grant agreement no. 636592. For further information, see: www.rebrake-project.eu; www.lowbrasys.eu.

Conflicts of Interest

The authors declare no conflict of interest. The funders had no role in the design of the study; in the collection, analyses, or interpretation of data; in the writing of the manuscript, or in the decision to publish the results.

References

  1. Grigoratos, T.; Martini, G. Brake wear particle emissions: A review. Environ. Sci. Pollut. Res. 2015, 22, 2491–2504. [Google Scholar] [CrossRef] [PubMed]
  2. Wahlström, J.; Olofsson, U. A field study of airborne particle emissions from automotive disc brakes. Proc. Inst. Mech. Eng. Part D J. Automob. Eng. 2014, 229, 747–757. [Google Scholar] [CrossRef]
  3. Abbasi, S.; Jansson, A.; Olander, L.; Olofsson, U.; Sellgren, U. A pin-on-disc study of the rate of airborne wear particle emissions from railway braking materials. Wear 2012, 284–285, 18–29. [Google Scholar] [CrossRef]
  4. Alemani, M.; Oleksii, N.; Ibrahim, M.; Olofsson, U. A study on emission of airborne wear particles from car brake friction pairs. Sae Int. J. Mater. Manuf. 2015, 9, 147–157. [Google Scholar] [CrossRef]
  5. Nosko, O.; Vanhanen, J.; Olofsson, U. Emission of 1.3–10 nm airborne particles from brake materials. Aerosol Sci. Technol. 2016, 51, 91–96. [Google Scholar] [CrossRef]
  6. Namgung, H.G.; Kim, J.B.; Woo, S.H.; Park, S.; Kim, M.; Kim, M.S.; Bae, G.N.; Park, D.; Kwon, S.B. Generation of nanoparticles from friction between railway brake disks and pads. Environ. Sci. Technol. 2016, 50, 3453–3461. [Google Scholar] [CrossRef]
  7. Nosko, O.; Alemani, M.; Olofsson, U. Temperature effect on emission of airborne wear particles from car brakes. In Proceedings of the Europe’s Braking Conference and Exhibition, Dresden, Germany, 4–6 May 2015; FISITA: London, UK, 2015. paper EB2015-TEF-014. [Google Scholar]
  8. Alemani, M.; Gialanella, S.; Straffelini, G.; Ciudin, R.; Olofsson, U.; Perricone, G.; Metinoz, I. Dry sliding of a low steel friction material against cast iron at different loads: Characterization of the friction layer and wear debris. Wear 2017, 376–377, 1450–1459. [Google Scholar] [CrossRef]
  9. Alemani, M.; Wahlström, J.; Olofsson, U. On the influence of car brake system parameters on particulate matter emissions. Wear 2018, 396–397, 67–74. [Google Scholar] [CrossRef]
  10. Wahlström, J.; Olander, L.; Olofsson, U. A pin-on-disc study focusing on how different load levels affect the concentration and size distribution of airborne wear particles from the disc brake materials. Tribol. Lett. 2012, 46, 195–204. [Google Scholar] [CrossRef]
  11. Mathissen, M.; Grochowicz, J.; Schmidt, C.; Vogt, R.; Zum Hagen, F.H.F.; Grabiec, T.; Steven, H.; Grigoratos, T. A novel real-world braking cycle for studying brake wear particle emissions. Wear 2018, 414, 219–226. [Google Scholar] [CrossRef]
  12. Garg, B.; Cadle, S.; Mulawa, P.; Groblicki, P.; Laroo, C.; Parr, G. Brake wear particulate matter emissions. Environ. Sci. Technol. 2000, 34, 4463–4469. [Google Scholar] [CrossRef]
  13. Kukutschová, J.; Moravec, P.; Tomášek, V.; Matějka, V.; Smolík, J.; Schwarz, J.; Seidlerová, J.; Šafářová, K.; Filip, P. On airborne nano/micro-sized wear particles released from low-metallic automotive brakes. Environ. Pollut. 2011, 159, 998–1006. [Google Scholar] [CrossRef] [PubMed]
  14. Nosko, O.; Olofsson, U. Effective density of airborne wear particles from car brake materials. J. Aerosol Sci. 2017, 107, 94–106. [Google Scholar] [CrossRef]
  15. Nosko, O.; Borrajo-Pelaez, R.; Hedström, P.; Olofsson, U. Porosity and shape of airborne wear microparticles generated by sliding contact between a low-metallic friction material and a cast iron. J. Aerosol Sci. 2017, 111, 130–140. [Google Scholar] [CrossRef]
  16. Giechaskiel, B.; Chirico, R.; DeCarlo, P.F.; Clairotte, M.; Adam, T.; Martini, G.; Heringa, M.F.; Richter, R.; Prevot, A.S.H.; Baltensperger, U.; et al. Evaluation of the particle measurement programme (PMP) protocol to remove the vehicles’ exhaust aerosol volatile phase. Sci. Total Environ. 2010, 408, 5106–5116. [Google Scholar] [CrossRef]
  17. Khalek, I.A.; Bougher, T. Development of a solid exhaust particle number measurement system using a catalytic stripper technology. SAE Int. J. Eng. 2011, 4, 639–649. [Google Scholar] [CrossRef]
  18. Plachá, D.; Peikertova, P.; Kukutschova, J.; Lee, P.W.; Čabanová, K.; Karas, J.; Kuchařová, J.; Filip, P. Identification of organic compounds released from low-metallic automotive model brake pad and its non-airborne wear particles. Sae Int. J. Mater. Manuf. 2015, 9, 123–132. [Google Scholar] [CrossRef]
  19. Plachá, D.; Vaculík, M.; Mikeska, M.; Dutko, O.; Peikertová, P.; Kukutschová, J.; Kutláková, K.M.; Růžičková, J.; Tomášek, V.; Filip, P. Release of volatile organic compounds by oxidative wear of automotive friction materials. Wear 2017, 376–377, 705–716. [Google Scholar]
  20. Gramstat, S.; Cserhati, A.; Schroeder, M.; Lugovyy, D. Brake Particle Emission Measurements - Testing Method and Results. SAE Int. J. Eng. 2017, 10, 1841–1846. [Google Scholar] [CrossRef]
  21. Amato, F.; Alastuey, A.; Karanasiou, A.; Lucarelli, F.; Nava, S.; Calzolai, G.; Severi, M.; Becagli, S.; Gianelle, V.; Colombi, C.; et al. AIRUSE-LIFE+: A harmonized PM speciation and source apportionment in five southern European cities. Atmos. Chem. Phys. 2016, 16, 3289–3309. [Google Scholar] [CrossRef]
  22. Husar, R.B.; Shu, W.R. Thermal analyses of the LA smog aerosol. J. Appl. Meteorol. 1975, 14, 1558–1565. [Google Scholar] [CrossRef]
  23. Pueschel, R.F.; Bodhaine, B.A.; Mendonca, B.G. The proportion of volatile aerosol on the island of Hawaii. J. Appl. Meteorol. 1972, 12, 308–315. [Google Scholar] [CrossRef]
  24. European Commission. Directive 2008/692/EC of the European Parliament and of the Council of 18 July 2008 on Type-Approval of Motor Vehicles with Respect to Emissions from Light Passenger and Commercial Vehicles (Euro 5 and Euro 6) and on Access to Vehicle Repair and Maintenance Information. Off. J. Eur. Union 2008, L199, 1–135. Available online: http://eur-lex.europa.eu/search.html?qid=1490711490766&whOJ=NO_OJ%3D199,YEAR_OJ%3D2008&type=advanced&lang=en&SUBDOM_INIT=ALL_ALL&DB_COLL_OJ=oj-l (accessed on 17 May 2018).
  25. Giechaskiel, B.; Mamakos, A.; Andersson, J.; Dilara, P.; Martini, G.; Schindler, W.; Bergmann, A. Measurement of automotive nonvolatile particle number emissions within the European legislative framework: A review. Aerosol Sci. Technol. 2012, 46, 719–749. [Google Scholar] [CrossRef]
  26. Mikkanen, M.P.; Ntziachristos, L.; Keskinen, J. Conditioning the automotive exhaust sample with a thermodenuder. In Proceedings of the European Aerosol Conference, Leipzig, Germany, 3–7 September 2001; Elesevier: Amsterdam, The Netherlands, 2001. [Google Scholar]
  27. Burtscher, H.; Baltensperger, U.; Bukowiecki, N.; Cohn, P.; Hüglin, C.; Mohr, M.; Matter, U.; Nyeki, S.; Schmatloch, V.; Streit, N.; et al. Separation of volatile and non-volatile aerosol fractions by thermodesorption: Instrumental development and applications. J. Aerosol Sci. 2001, 32, 427–442. [Google Scholar] [CrossRef]
  28. Wehner, B.; Philippin, S.; Wiedensohler, A. Design and calibration of a thermodenuder with an improved heating unit to measure the size-dependent volatile fraction of aerosol particles. J. Aerosol Sci. 2002, 33, 1087–1093. [Google Scholar] [CrossRef]
  29. Park, D.; Kim, S.; Choi, N.K.; Hwang, J. Development and performance test of a thermo-denuder for separation of volatile matter from submicron aerosol particles. J. Aerosol Sci. 2008, 39, 1099–1108. [Google Scholar] [CrossRef]
  30. Alemani, M.; Perricone, G.; Olofsson, U.; Söderberg, A.; Wahlström, J.; Ciotti, A. A proposed dyno bench test cycle to study particle. In Proceedings of the Eurobrake 2014 conference, Lille, France, 13–15 May 2014; FISITA: London, UK, 2014. Paper EB2014-SE-001. [Google Scholar]
  31. Sanders, P.G.; Xu, N.; Dalka, T.M.; Maricq, M.M. Airborne brake wear debris: Size distributions, composition, and a comparison of dynamometer and vehicle tests. Environ. Sci. Technol. 2003, 37, 4060–4069. [Google Scholar] [CrossRef]
  32. Cox, R.L. Engineered Tribological Composites, 1st ed.; SAE International: Warrendale, PA, USA, 2011; Chapter 6. [Google Scholar]
  33. Perricone, G.; Alemani, M.; Metinöz, I.; Matĕjka, V.; Wahlström, J.; Olofsson, U. Towards the ranking of airborne particle emissions from car brakes—A system approach. Proc. Inst. Mech. Eng. Part D J. Automob. Eng. 2016, 231, 781–797. [Google Scholar] [CrossRef]
  34. Perricone, G.; Wahlström, J.; Olofsson, U. Towards a test stand for standardized measurements of the brake emissions. Proc. Inst. Mech. Eng. Part D J. Automob. Eng. 2015, 230, 1521–1528. [Google Scholar] [CrossRef]
  35. Järvinen, A.; Aitomaa, M.; Rostedt, A.; Keskinen, J.; Yli-Ojanperä, J. Calibration of the new electrical low pressure impactor (ELPI+). J. Aerosol Sci. 2014, 69, 150–159. [Google Scholar] [CrossRef]
  36. Kannosto, J. Dekati® High Temperature ELPI+TM. Presentation for the Royal Technical University of Stockholm, Sweden. 2015. Available online: http://scielutions.com/data/documents/4-HT-ELPI+-JOK-05112015.pdf (accessed on 21 July 2018).
  37. Brockmann, J.E. Aerosol transport in sampling lines and inlets. In Aerosol Measurement; Kulkarni, P., Baron, P.A., Willeke, K., Eds.; John Wiley & Sons, Inc.: Hoboken, NJ, USA, 2011; pp. 88–98. [Google Scholar]
  38. Hinds, W.C. Aerosol Technology, 2nd ed.; John Wiley & Sons, Inc.: Hoboken, NJ, USA, 1999; Chapters 3, 7, 8. [Google Scholar]
  39. Dekati. Dekati® Thermodenuder User Manual. 2015. Available online: http://www.dekati.com/products/Aerosol%20Sample%20Conditioning/Dekati%C2%AE%20Thermodenuder (accessed on 12 August 2017).
  40. Lin, J.S.; Tsai, C.J. Thermophoretic deposition efficiency in a cylindrical tube taking into account developing flow at the entrance region. J. Aerosol Sci. 2003, 34, 569–583. [Google Scholar] [CrossRef]
  41. Ramachandran, G.; Cooper, D.W. Size distribution data analysis and presentation. In Aerosol Measurement; Kulkarni, P., Baron, P.A., Willeke, K., Eds.; John Wiley & Sons, Inc.: Hoboken, NJ, USA, 2011; pp. 480–485. [Google Scholar]
  42. Matějka, V.; Metinöz, I.; Wahlström, J.; Alemani, M.; Perricone, G. On the running-in of brake pads and discs for dyno bench tests. Tribol. Int. 2017, 115, 424–431. [Google Scholar] [CrossRef]
  43. Perricone, G.; Alemani, M.; Wahlström, J.; Olofsson, U. A proposed driving cycle for brake emissions investigation for test stand. Proc. Inst. Mech. Eng. Part D J. Automob. Eng. 2019. [Google Scholar] [CrossRef]
Figure 1. Schematic of the experimental setup. PU: pump; FL: HEPA filter; D: disc; M: motor; P: pad; F: force; SD: sampling ducts, CY: cyclone; HSL: heated sampling line; HT ELPI+: cascade impactor operating at high temperature; ELPI+: standard cascade impactor; and TD: thermodenuder.
Atmosphere 10 00263 g001
Figure 2. Total concentration versus aerodynamic diameter.
Atmosphere 10 00263 g002
Figure 3. Total emission values subdivided per block and for the whole cycle.
Atmosphere 10 00263 g003
Figure 4. Total concentration over time during the execution of Town block #1 for the standard cascade impactor (std. ELPI+) and the one operating at high temperature (HT ELPI+).
Atmosphere 10 00263 g004
Figure 5. Total particle emission amount ratio of the standard cascade impactor and the one operating at high temperature for each block.
Atmosphere 10 00263 g005
Table 1. Chemical composition of brake pads (wt.%).
SampleMgSiAlSCaFeCuZnCrZrSnC
Brake Pads11.16.39.85.65.27.65.813.43.50.19.322.3
Table 2. Chemical composition (wt.%) of a disc.
SampleCSiMnPSFe
Disk 13.401.700.570.030.2693.6
Table 3. Test cycle used for evaluation of particle emission measurements.
NumberSectionInitial Speed (km/h)Final Speed (km/h)Initial Rotor Brake Temperature (°C)Braking Deceleration (units of g)Number of Stops in SAE Test Cycle NSAENumber of Stops in Present Test Npresent
Cleaning for 5′
1Burnish5041000.25100100
Cleaning for 5′
2Town block #15041500.2520020
Cleaning for 5′
4Country road block #18042000.3520020
Cleaning for 5′
5Country road block #210041250.420020
Cleaning for 5′
7Town block #25041500.2520020
Cleaning for 5′
8County road block #310041250.420020
Table 4. Particle number emission factors and geometric mean diameters.
Standard Cascade ImpactorCascade Impactor Operating at High Temperature with Heated Sampling LineStandard Cascade Impactor with Thermodenuder
EFPN (N × 109 per stop per brake) as from Equation (8)90.73.271.3
EFPN [N × 107 per stopper brake] for particle count ≥ 200 nm7.595.24.8
Geometric mean diameter [nm] as from Equation (10)13.4912.2816.07

