Abstract
High-resolution meteorological data products are crucial for agrometeorological studies. Here, we study the accuracy of an important gridded dataset, the near-surface temperature dataset from the 5 km × 5 km resolution China dataset of meteorological forcing for land surface modeling (published by the Beijing Normal University). Using both the gridded dataset and the observed temperature data from 590 meteorological stations, we calculate nine universal meteorological indices (mean, maximum, and minimum temperatures of daily, monthly, and annual data) and five agricultural thermal indices (first frost day, last frost day, frost-free period, and ≥0 °C and ≥10 °C active accumulated temperature, i.e., AAT0 and AAT10) of the 11 temperature zones over mainland China. Then, for each meteorological index, we calculate the root mean square errors (RMSEs), correlation coefficient and climate trend rates of the two datasets. The results show that the RMSEs of these indices are usually lower in the north subtropical, mid-subtropical, south subtropical, marginal tropical and mid-tropical zones than in the plateau subfrigid, plateau temperate, and plateau subtropical mountains zones. Over mainland China, the AAT0, AAT10, and mean and maximum temperatures calculated from the gridded data show the same climate trends with those derived from the observed data, while the minimum temperature and its derivations (first frost day, last frost day, and frost-free period) show the opposite trends in many areas. Thus, the mean and maximum temperature data derived from the gridded dataset are applicable for studies in most parts of China, but caution should be taken when using the minimum temperature data.
1. Introduction
To a large extent, temperature determines optimal regional crop types, cropping systems, as well as farming activities, thus having considerable effects on agricultural output [1,2,3,4]. Related indices, such as agricultural critical temperature, accumulated temperature, and frost-free period, are usually calculated from the available temperature dataset to estimate regional thermal resources and to provide instructions for agricultural production [5,6,7,8,9]. As a result, it is important to evaluate the accuracy and applicability of temperature data for agrometeorological studies.
Atmospheric gridded data are mainly from globally reanalysis datasets, e.g., NCEP /NCAR developed by National Centers for Environmental Prediction and The National Center for Atmospheric Research [10,11,12], ERA-40 developed by European Center for Medium-Range Weather Forecasts [13,14], and JRA-25 developed by Japan Meteorological Agency and Central Research Institute of Electric Power Industry [15,16]. However, over mainland China, observed data from only about 200 meteorological stations are provided for international exchange and constructing these datasets. Thus, these datasets are too coarse (spatial resolution from 1.25° × 1.25° to 5° × 5°) to be used at local or regional scales. Many studies have been on developing and utilizing high resolution atmospheric gridded data. For the validation of a high-resolution climate model over China, Wu and Gao [17] constructed a gridded daily dataset with the resolution of 0.25° × 0.25° via the anomaly approach in which the climatology is first interpolated by thin plate smoothing splines, after which a gridded daily anomaly derived from angular distance weighting method is added to climatology. To assess the changes in frequency and intensity of extreme meteorological events, Chaney et al. [18] developed a temporally homogenous and high temporal-spatial resolution meteorological dataset over sub-Saharan Africa by spatially downscaling the NCEP-NCAR reanalysis data with a resolution of 0.1° × 0.1°. Using a partial thin-plate smoothing spline and simple kriging approach, Li et al. [19] constructed gridded near-surface meteorological datasets with resolutions of 1 km × 1 km and 5 km × 5km. They evaluated the dataset by calculating the root-mean-square errors (RMSEs) and cross validations between the gridded data and observed data from ~700 meteorological stations over mainland China. However, the statistics were not calculated based on detailed temperature zones and some important thermal resource indices (e.g., first and last frost day, frost-free period, and accumulated temperature) were not estimated. Moreover, the climate trends were not assessed, which are of great importance when analyzing long-term climate changes.
In this paper, we re-evaluate the temperature data from the 5 km × 5 km-resolution dataset that are offered for free. For each temperature zone [20], we calculate the RMSEs and compare the climate trends of various temperature indices between the gridded data and observed data from meteorological stations. The indices are divided into two categories: universal meteorological indices (mean, maximum, and minimum temperatures of daily, monthly, and annual data) and agricultural thermal indices (first frost day, last frost day, frost-free period, and ≥0 °C and ≥10 °C active accumulated temperature). The purpose of this study is (1) to evaluate the accuracy of gridded temperate data, (2) to find out the more applicable regions for gridded temperature indices and the relatively effective temperature indices in each region, (3) and to evaluate whether the gridded data is available for assessing climate change trends.
2. The Climate of Mainland China
Located in the southeast part of Asia and facing the Pacific Ocean, mainland of China covers nearly 50 latitude degrees from north to south. Owing to large variance in latitude, the solar energy varies a lot from north to south. The difference in thermal properties between sea and land is remarkable, as well as the monsoon climate. In addition, China’s topography is complex and diverse; it is high in the west and low in the east, with three-ladder terrain. The first ladder is the Tibetan Plateau, with an average altitude of more than 4000 m [21]. Large basins and plateaus are distributed on the second ladder, with an average elevation of 1000–2000 m [22,23]. The third terrain ladder is covered with vast plains, with hills and low mountains, at an altitude of less than 500 m [24]. Therefore, there are significant differences in climate across the mainland China.
Zhang et al. [20] studied climate changes (1981–2010) and divided China into 12 temperature zones. Days with daily temperature steady above 10 °C (DTSA10) are the basic indicator. The secondary is mean temperature of January, and some referenced variables including the accumulated temperature with daily temperature steady above 10 °C and annual minimum temperature. Because of the great difference of terrain and climate in Tibetan Plateau, the mean temperature of July is taken as an auxiliary indicator. As a result, the 12 temperature zones includes cold temperature zone (DTSA10 < 100); mid-temperate zone (100 ≤ DTSA10 < 170); warm temperate zone (170 ≤ DTSA10 < 220); north subtropical zone (220 ≤ DTSA10 < 240), but in the Yunnan-Guizhou plateau it is between 210 and 225 days; mid-subtropical zone (240 ≤ DTSA10 < 285), but in the Yunnan-Guizhou plateau it is between 225 and 285 days; south subtropical zone (285 ≤ DTSA10 < 365); marginal tropical zone, mid-tropical zone and equatorial tropics are where (DTSA10 = 365 ); plateau sub-frigid zone where (DTSA10 < 50); plateau temperate zone (50 ≤ DTSA10 < 80); and plateau subtropical mountains (180 ≤ DTSA10 < 350). Our study mainly aims at the eleven temperature zones over mainland China (Figure 1).
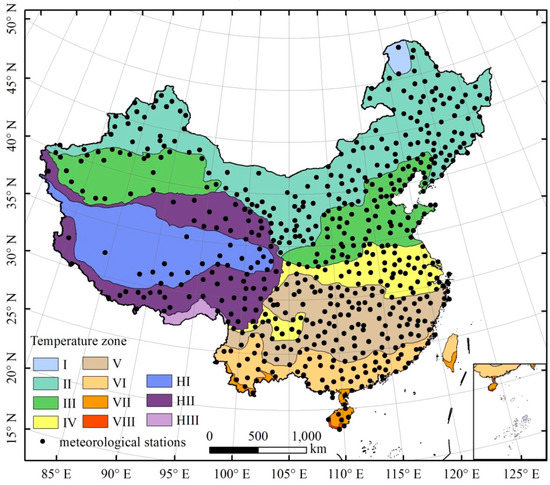
Figure 1.
Sketch map of climate zones over mainland China (revised from [20]). I–cold temperature zone, II–mid-temperate zone, III–warm temperate zone, IV–north subtropical zone, V–mid-subtropical zone, VI–south subtropical zone, VII–marginal tropical zone, VIII–mid-tropical zone, HI–plateau sub-frigid zone, HII–plateau temperate zone, HIII–plateau subtropical mountains.
3. Data and Methods
3.1. Meteorological Data Sets
The gridded near-surface temperature dataset over mainland China (temporal solution: 3 h, time span: from 1981 to 2010) was provided by the Beijing Normal University (BNU). They proposed a new approach that fit a partial thin-plate smoothing spline with orography and reanalysis data as explanatory variables to ground-based observations for estimating a trend surface firstly and then applied a simple kriging procedure to the residual for trend surface correction [19]. The gridding technique details see Appendix. They constructed a set of gridded near-surface temperature, relative humidity, wind speed and surface pressure dataset with a resolution of 1 km × 1 km and 5 km × 5 km, and offered the 5 km × 5 km dataset for free (downloaded from http://globalchange.bnu.edu.cn/research/forcing).
The observed daily meteorological data for the period of 1981–2010 from meteorological stations across mainland China used in this study was obtained from the climate data-sharing service system (http://data.cma.cn//) of the China Meteorological Administration (CMA). Given the continuity and integrity of the data, 590 meteorological stations were selected, providing complete records for daily mean temperature, maximum temperature, minimum temperature during the past 30 years (Figure 1).
3.2. Methods
3.2.1. Evaluating Indices
Due to the large amount of data, a sampling method was used for data evaluation. We used the temperature data in January 1st, April 1st, July 1st, and October 1st as the representative daily data, and the temperature data in January, April, July, and October as the representative monthly data which have cover spring, summer, autumn and winter. We extracted daily mean, maximum, and minimum temperature data from the three-hourly gridded temperature data. The temperature data of the point corresponding to the observation site is obtained from the gridded data by the nearest neighbor distance method.
In each spring and autumn, days when minimum air temperature dropped below 0 °C were designated days with frost. The first time that the minimum temperature dropped below 0 °C in cooling season was defined as the first frost day. The last time when the minimum temperature in the warming season dropped below 0 °C was defined as the last frost day. And the interval between the last frost day and the first frost day in a year was defined as frost-free period. The first frost day, last frost day, frost-free period and annual temperature are of great significance in agricultural production, as well as the ≥0 °C active accumulated temperature (AAT0) and ≥10 °C active accumulated temperature (AAT10).
3.2.2. Root Mean-Square Error
For the eleven temperature zones over mainland China, the universal meteorological indices (mean, maximum, and minimum temperatures of daily, monthly, and annual data), and agricultural thermal indices (first frost day, last frost day, frost-free period, and ≥0 °C and ≥10 °C active accumulated temperature) are evaluated by the methods of root mean-square error (RMSE), correlation test and climate trend analysis for the past thirty years. The root mean-square error (RMSE) is defined as
where N is the total number of years (N = 30 in this study), xt refers to the observed value at t year; yt refers to the corresponding gridded value at t year. The smaller the RMSE, the better the gridded temperature product is. The RMSE over multiple-station regions refers to the mean of the RMSEs for single stations. And the maximum and minimum of the RMSE and the square root of the average of the variances over multiple-station regions are also calculated (see details in the Supplementary Material Table S1).
3.2.3. Correlation Test
The correlation test is a statistical test of the correlation between variables. The degree of correlation between variables is expressed by correlation coefficient R.
when R is greater than the critical value of the correlation coefficient at a given confidence level and a certain degree of freedom, there is a statistical correlation between the variables. Otherwise, there is no correlation. Here, we treat correlation analysis passing 99% confidence test when R ≥ 0.46 and passing 95% confidence test when R ≥ 0.36 [25]. The correlation coefficient over multiple-station regions refers to the mean of the correlation coefficients for single stations. The maximum and minimum of correlation coefficient and square root of the average of the variances over multiple-station regions are calculated (see details in Table S2 in the Supplementary Material).
3.2.4. Climate Trend Analysis
The trend variation of meteorological elements is expressed by a linear equation as follows:
where is the fitting value of meteorological element; a1 × 10 is climate trend rate, which represents the variable rate of meteorological elements per decade.
The observed and gridded data are with the same climate trend when the climate trend rates are both positive or both negative. Otherwise, they are with opposite climate trend. Moreover, we calculated the percentage of the sites where the observed and gridded data are with same climate trends, and define it as OGSP index. The percent of sites where the observed and gridded data are with opposite trends is defined as OGOP index.
4. Results
4.1. Evaluation of Daily Temperature Data
4.1.1. RMSE of Daily Temperature
The daily temperature is evaluated at regional level in mainland China for years 1981–2010. Figure 2 shows the RMSE and correlation coefficient of daily mean, maximum, minimum temperature in January 1st, April 1st, July 1st and October 1st.
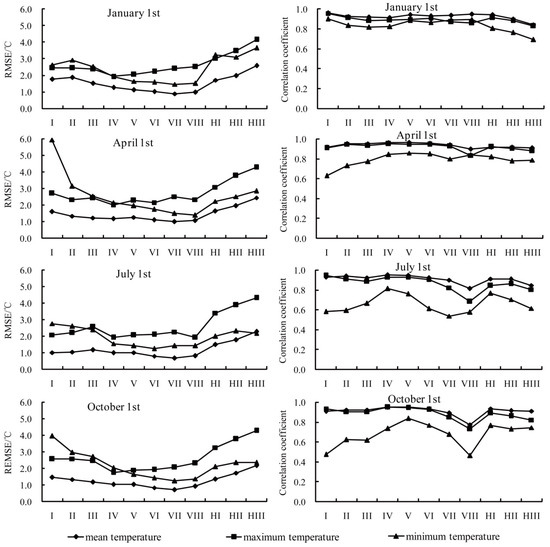
Figure 2.
Root mean-square error (left) and correlation coefficient (right) of daily temperature for January 1st, April 1st, July 1st and October 1st.
The RMSEs of daily mean, maximum, and minimum range in 0.68 (±0.18)–2.59 (±0.89) °C, 1.74 (±0.68)–4.31 (±0.81) °C, and 1.25 (±0.22)–5.93 (±0.46) °C, respectively. Except for minimum temperature in VIII in October 1 st which passes the correlation test of 95% confidence level (R > 0.36), others pass the correlation test of 99% confidence level (R > 0.46).
From the point of research object, the RMSE of daily mean temperature is the lowest, which ranges from 0.89 (±0.14) °C to 2.59 (±0.89) °C in January 1st, 1.00 (±0.12) °C to 2.44 (±0.96) °C in April 1st, 0.68 (±0.18) °C to 2.27 (±0.79) °C in July 1st, and 0.72 (±0.13) °C to 2.17 (±0.94) °C in October 1st, respectively. Bounded by IV, before which the RMSE of daily minimum temperature is higher than that of daily maximum temperature, and after, the RMSE of daily minimum temperature is lower than that of daily maximum temperature. The lower RMSE indicates that the gridded daily mean temperature may be more applicable (Figure 2).
The RMSEs of daily mean temperature, daily maximum temperature, and daily minimum temperature are generally lower in zone IV–VIII (RMSE < 3.0 °C) while a little higher in I–III and HI–HIII. And for zone I, the RMSE of daily minimum temperature are higher than 5.0 °C in April 1st.
4.1.2. Climate Trend of Daily Temperature
For daily mean and maximum temperature (Figure 3 and Figure 4; Table 1), the climate trends of both the observed and gridded data are nearly the same with the OGSP index >80.0% (except the maximum temperature in January 1st, 69.7%). While for minimum temperature (Figure 5, Table 1), the OGSP indices are relatively low. Especially in Oct. 1st, the OGSP index is <60% (Table 1).
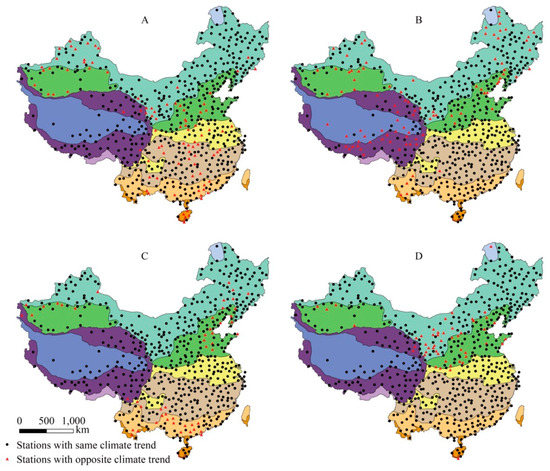
Figure 3.
Climate trend of daily mean temperature for January 1st (A), April 1st (B), July 1st (C) and October 1st (D).
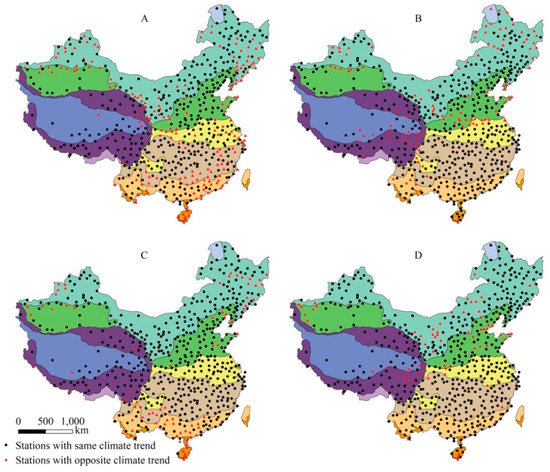
Figure 4.
Climate trend of daily maximum temperature for January 1st (A), April 1st (B), July 1st (C) and October 1st (D).

Table 1.
The number and percentage (in bracket) of the sites where the observed and gridded daily data are with the same climate trends (OGSP index) and opposite climate trends (OGOP index) in mainland China.

Figure 5.
Climate trend of daily minimum temperature for January 1st (A), April 1st (B), July 1st (C) and October 1st (D).
For many sites in the region HII (around the Tibetan Plateau), III (along the Tian Shan), and VI (south China), the climate trends of daily minimum temperature are opposite (Figure 5A–D). Especially in Oct 1st, nearly half of the sites over the mainland China are with the opposite climate trends, mainly in eastern Inner Mongolia (II), and north China (III and IV).
4.2. Evaluation of Monthly Temperature Data
4.2.1. RMSE of Monthly Temperature
For monthly mean, maximum, and minimum temperatures for the four months, the RMSEs range from 0.29 (±0.11) °C to 2.33 (±0.94) °C, 1.26 (±0.66) °C to 4.28 (±0.89) °C, 0.83 (±0.50) °C to 2.90 (±0.91) °C respectively (Figure 6). In July, minimum temperature in VIII does not pass any correlation test, and minimum temperature in VII and maximum temperature in VIII pass the test of 95% confidence level. Others pass the test of 99% confidence level (Figure 6). Generally, the RMSE of monthly mean temperature is the lowest, which ranges from 0.52 (±0.17) °C to 2.33 (±0.94) °C in January, from 0.32 (±0.10) °C to 2.14 (±1.02) °C in April, from 0.29 (±0.11) °C to 2.19 (±0.83) °C in July, and from 0.40 (±0.10) °C to 1.99 (±0.96) °C in October, respectively. But for HII in July, the RMSE of monthly mean temperature is higher than that of monthly minimum temperature (Figure 6).
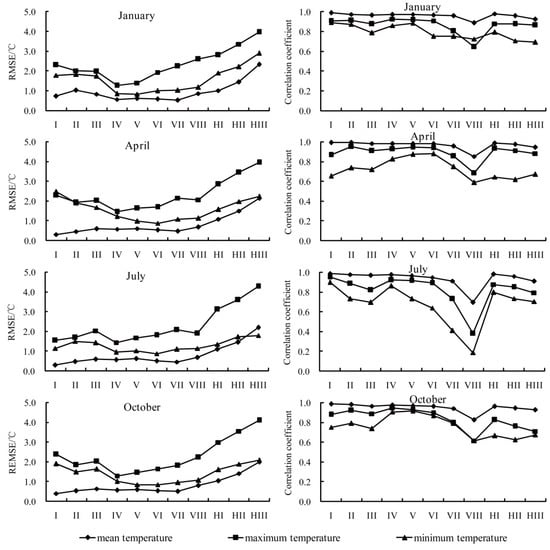
Figure 6.
Root mean-square error (left) and correlation coefficient (right) of monthly temperature for January, April, July and October.
At the regional level, the RMSEs of monthly mean temperature are generally lower in zone I–VIII (RMSE < 1.0 °C), while a little higher in HI–HIII (RMSE generally between 1.0 and 2.0). For monthly maximum temperature, the RMSEs are also lower in zone I–VIII (RMSE < 3.0 °C). However, there is some difference for monthly minimum temperature where RMSEs are generally lower in zone IV–VIII (RMSE < 1.3 °C) while a little higher in I–III and HI–HIII (Figure 6).
4.2.2. Climate Trend of Monthly Temperature
For monthly mean temperature (Figure 7, Table 2), the climate trend of observed and gridded data is nearly the same with the OGSP index >90.0%. For monthly maximum temperature (Figure 8, Table 2), the OGSP index is a bit lower, but >75.0%. While for minimum temperature (Figure 9, Table 2), the OGSP indexes are relatively low in all months, which is 63.1% in January, 39.5% in April, 58.0% in July and 49.8% in October, respectively.
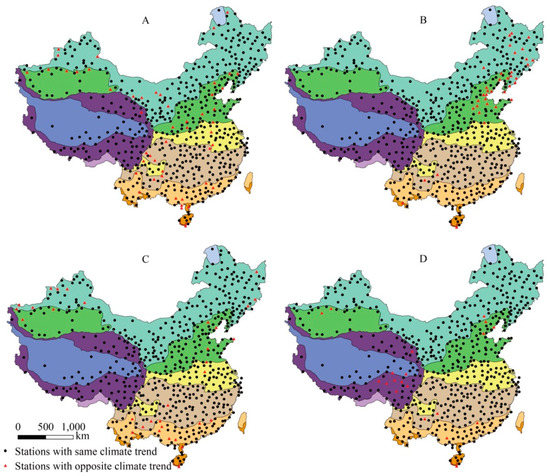
Figure 7.
Climate trend of monthly mean temperature for January (A), April (B), July (C) and October (D).

Table 2.
The number and percentage (in bracket) of the sites where the observed and gridded monthly data are with the same climate trends (OGSP index) and opposite climate trends (OGOP index) in mainland China.
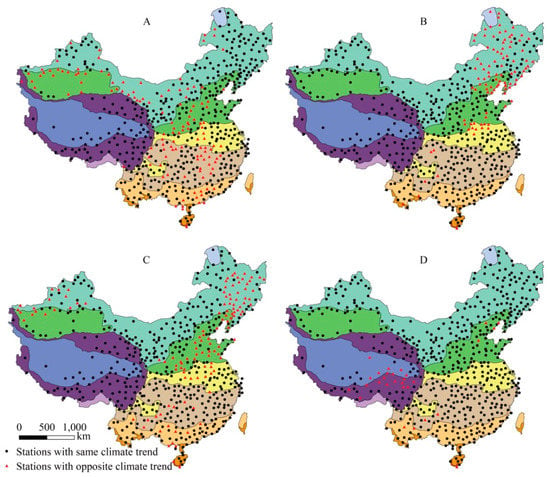
Figure 8.
Climate trend of monthly maximum temperature for January (A), April (B), July (C) and October (D).
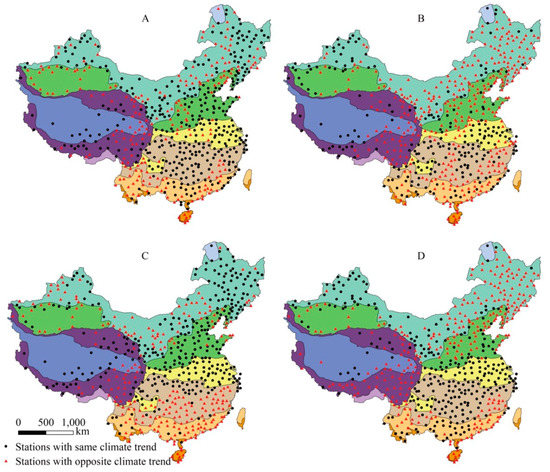
Figure 9.
Climate trend of monthly minimum temperature for January (A), April (B), July (C) and October (D).
In January and July, the climate trends of minimum temperature in VI-VIII almost all are opposite. Others are mostly in III (along the Tian Shan), inner -Mongolia (II), east HII and south V (Figure 9A,C). In April and October, the opposite climate trends of minimum temperature mainly distribute in northeast China (II), III, nearly whole HII, south east of V and VI, and nearly half of VII-VIII.
4.3. Evaluation of Annual Temperature Data
4.3.1. RMSE of Annual Temperature
The RMSEs of annual mean, maximum, and minimum temperature range from 0.36 (±0.11) °C to 2.01 (±1.03) °C, 1.29 (±0.64) °C to 3.95 (±0.87) °C, and 0.79 (±0.45) °C to 1.95 (±1.00) °C, respectively (Figure 10). Typically, the RMSE of annul mean temperature is the lowest, and the RMSE of annul maximum temperature is the highest, except for HIII where the RMSE of annual minimum temperature is a little higher than that of annual mean temperature. Annual minimum temperature in VII and VIII do not pass any confidence test, while it in III, HII and HIII passes the test of 95% confidence level. Others pass the test of 99% confidence level.

Figure 10.
Root mean-square error (left) and correlation coefficient (right) of annual temperature.
At the regional level, the RMSEs of both annual mean and maximum temperature are lower in I–VIII (RMSE <1.0 °C and 2.5 °C), while a little higher in HI–HIII. While for annul minimum temperature, the RMSEs are lower in IV–VIII (RMSE < 1.0 °C) while a little higher in I–III and HI–HIII.
4.3.2. Climate Trend of Annul Temperature
Both for annual mean temperature and maximum temperature (Table 3, Figure 11A,B), the climate trends of observed and gridded data are mostly the same with the OGSP index >95.0%. While for minimum temperature (Figure 11C), the OGSP index is only 51.0%. The opposite ones are mostly distributed in northeast China (II), inner-Mongolia (II), III (along the Tian Shan), east of HII, HIII and nearly whole of VI–VIII.

Table 3.
The number and percentage (in bracket) of the sites where the observed and gridded annual data are with the same climate trends (OGSP index) and opposite climate trends in mainland China.
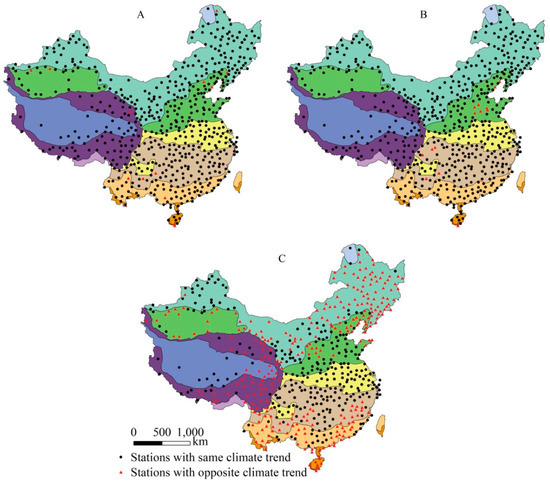
Figure 11.
Climate trend of annual mean temperature (A), maximum temperature (B) and minimum temperature (C).
4.4. Evaluation of Thermal Resources
4.4.1. Evaluation of the Frost-Free Period, First and Last Frost Day
Figure 12 shows the RMSEs of first frost day, last frost day and frost-free period, all are relative lower in I-VIII and HI than HII-HIII. The RMSE (0 (±0.0) to 15.0 (±6.2) d) of first frost day is the lowest, then the last frost day ranges from 0 (±0.0) to 21.7 (±7.9) d. The frost-free period is the highest, which ranges from 0 (±0.0) to 33.5 (±14.0) d. The frost indices in I, II, III, HII and HIII mostly do not pass the test of 95% confidence level.

Figure 12.
Root mean-square error (left) and correlation coefficient (right) of first frost day, last frost day and frost-free period.
For the first frost day, last frost day and frost-free period, the percentages of the sites where the observed and gridded frost data share the same climate trends is 48%–53% (Table 4 and Figure 13). Especially in II and HII, nearly all the climate trends are the opposite.

Table 4.
The number and percentage (in bracket) of the sites where the observed and gridded frost data are with the same climate trends (OGSP index) and opposite climate trends in mainland China.
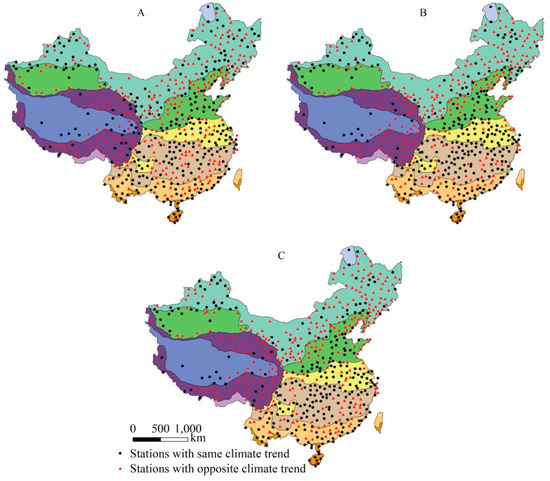
Figure 13.
Climate trend of first frost day (A), last frost day (B) and frost-free period (C).
4.4.2. Evaluation of Active Accumulated Temperature
The RMSEs between ≥0 °C and ≥10 °C active accumulated temperature have no obvious difference, which are both relative low in I–VII and HI (50 °C·d < RMSE < 260 °C·d) and high in HII–HIII (360 °C·d < RMSE < 630 °C·d). The RMSE in I is the lowest. The active accumulated temperature indices in all regions pass the test of 99% confidence level (Figure 14).

Figure 14.
Root mean-square error (left) and correlation coefficient (right) of ≥0 °C (A) and ≥10 °C (B) active accumulated temperature.
Figure 15 shows the relationship of climate trend between observed and gridded data for ≥0 °C and ≥10 °C active accumulated temperature. For both the AAT10 and AAT0, the climate trends of observed and gridded data are nearly the same (OGSP index ≥ 98.0%) in the whole mainland China (Figure 15). And almost all of them are on the rise.
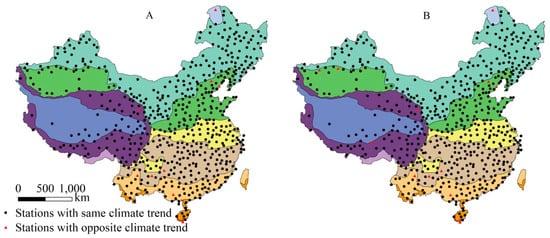
Figure 15.
Climate trend of ≥0 °C (A) and ≥10 °C (B) active accumulated temperature.
5. Discussion
We evaluated the accuracy of the universal meteorological indices (mean, maximum, and minimum temperatures of daily, monthly, and annual data) that derived from the high resolution gridded near-surface temperature dataset. Although we do not evaluate all daily and monthly temperature elements, the representative time we select covering the four seasons of spring, summer, autumn and winter, can basically reflect the overall quality and applicability of the data. Furthermore, we also evaluated some agricultural thermal indices including first frost day, last frost day, frost-free period, and ≥0 °C and ≥10 °C active accumulated temperature, which are commonly used.
5.1. Evaluating Universal Temperature Elements
Here we estimate that the RMSEs (between the station dataset and gridded dataset) range from typically 0.3 to 4 °C or so, depending on the climate region and the specific temperature variable being analyzed. Until now, global atmospheric forcing datasets have mainly been derived from reanalysis datasets which have a coarse spatial resolution typically from 1.25° × 1.25° to 5° × 5°. Zhu et al. [26] estimated the RMSEs of various reanalyzed land surface temperature datasets (ERA-Interim, ERA-Interim/Land, JRA-55, NCEP/NCAR and NCEP/DOE) in China, which mainly fall in the range of 2 to 6 °C. Wang et al. [27] compared the air temperature from the JRA-55 and the ERA-interim with the observations of 18 meteorological stations in Mongolia. They found that the temperature discrepancies range from typically 0.7–6 °C. Thus, the gridded data conducted by Li et al. [19] show an improvement in spatial resolution and some improvement in temperature discrepancies over some regions.
Considering the daily, monthly and annual temperature data, the RMSEs of the mean temperature values are lower than that of the maximum and minimum ones almost in all zones (Figure 2, Figure 6 and Figure 10). For mean temperature, the climate trends of the observed and gridded data are mostly the same with OGSP index >80.0%, even >90.0% in some cases. For maximum temperature, the OGSP indexes are mostly >75.0% (Table 1, Table 2 and Table 3).
From the perspective of correlation test only, except for monthly minimum temperature in July in warm temperate zone, and annual minimum temperature in marginal tropical zone and mid-tropical zone that do not pass any level of correlation test, others all pass the test at 95% (mostly 99%) confidence level.
For daily, monthly, and annual temperature data, the RMSEs of both mean and maximum temperatures are relative low in subtropical, mid-subtropical, south subtropical, marginal-tropical, and mid-tropical zones. This tells the reasonablity of using these data to study regional climate in these areas. In addition to these zones, the cold temperature, mid-temperate and warm temperate zones are also characterized by low RMSEs in monthly and annual temperatures. But for the plateau subfrigid zone, plateau temperate zone and plateau subtropical mountains, the RMSEs are relatively high. These zones are mostly distributed in the Tibetan plateau, where the high altitude and sparse sites may be the main reasons that result in slight deviation between observed and gridded data.
For minimum temperature, the percentage of the sites where the observed and gridded data are with same climate trends is very low (in most cases OGSP < 70.0%; Figure 4, Figure 7 and Figure 10, Table 1, Table 2 and Table 3). The results of observed data show that the minimum temperature in most parts of mainland China is increasing, which is consistent with the trend of global warming [28,29]. However, the results of gridded data show that the minimum temperature in a considerable area is decreasing, which is contrary to the fact of global warming. This may be influenced by the interpolation method of the original gridded data, or the way to obtain the minimum temperature from observed and gridded data. The daily minimum temperature of observed data from CMA is obtained from the minimum value of hourly temperature data, while the daily minimum temperature of gridded data is obtained from the minimum value of 3-hourly temperature data which might not reflect the actual minimum temperature in a day. The nearest distance neighbor method used to obtain the corresponding site data from the gridded dataset may also have some impact, but we think that it has little impact on climate trends. Theoretically, we consider that the value of the daily maximum temperature from gridded data should be smaller than that from observed data, and the value of the daily minimum temperature from gridded data should be larger than that from observed data. Actually, for daily maximum temperature on January 1st, April 1st, July 1st and October 1st in more than 24 years, 53.7%, 62.9%, 69.7% and 72.4% of the 590 points met the theory above. And, for daily minimum temperature on January 1st, April 1st, July 1st and October 1st in more than 24 years, 18.0%, 14.6%, 21.7% and 11.4% of the 590 points met the theory above. It shows that the original method for obtaining gridded weather data could not capture the actual minimum temperature, and to some extent, the minimum temperature gained from the gridded data could not precisely express the change of temperature.
5.2. Evaluating Agricultural Thermal Resources
For correlation test, the frost indices in cold temperature zone, mid-temperate zone, warm temperate zone, plateau temperate zone and plateau subtropical mountains mostly do not pass the test at 95% confidence level, which indicates that frost indices from gridded data do not match those from observed data in these regions. Almost in all the zones, the RMSE of the first frost day is lower than that of the last frost day and frost-free period (Figure 12). As the minimum temperature in most years is above zero, nearly no frost day has been recorded in the south subtropical, marginal-tropical, and mid-tropical zones. But, in a few years, the minimum temperature is <0 °C. Thus, the RMSEs calculated from the observed and gridded data are larger than zero.
For the first frost day, last frost day and frost-free period, the climate trends of observed and gridded data are opposite in nearly half of the study sites (OGSP index < 55.0%; Table 4, Figure 13). Especially in mid-temperate and warm temperate zones, nearly all the climate trends are opposite.
From the observed data, the frost-free period is extended in most areas for the delayed first frost day and the advanced last frost day (Figure 16Aa–C), which is consistent with most studies [30,31,32]. However, from the gridded data, the frost-free period is shortened in many sites because of the advanced first frost day and the delayed last frost day, especially in the northeast and Inner Mongolia (Figure 16D–F). It indicates that the frost data calculated from the gridded data cannot reflect its actual variation. Thus, caution should be taken when using the gridded data for analysis on frost day.
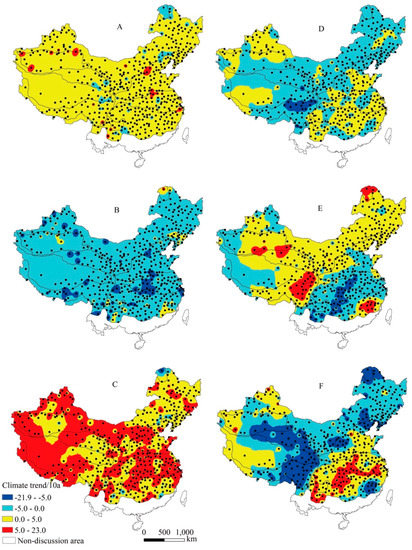
Figure 16.
Climate trend of first frost day, last frost day, frost-free period from observed and gridded data. (A–C) is first frost day, last frost day and frost-free period respectively from observed data. (D–F) is that from gridded data.
For ≥0 °C and ≥10 °C active accumulated temperature, the RMSEs are both relatively low in cold temperature, mid-temperate, warm temperate, north subtropical, mid-subtropical, south subtropical, marginal tropical and plateau sub-frigid zones, and both pass the test at 99% confidence level in all regions. For nearly all the sites, the observed and gridded data have the same climate trends with the majority showing an increasing trend. Thus, the AAT0 and AAT10 calculated from gridded data can tell the variations in thermal resources well and can be used in studies.
5.3. Statistic Test on Climate Trend
Climate trend analysis is a linear regression between climatic variables and year, indeed. Thus, statistic tests should be needed. Whether the variation trend of meteorological elements passes 95% confidence test is defined as a threshold to distinguish between trend and no trend. The trend statistics results for all elements are in the Supplementary file (Table S3).
We choose four representative variables (the minimum temperature in April, annual minimum temperature, frost-free period and ≥10 °C active accumulated temperature) to discuss the results. The results are divided into 5 cases, e.g., stations with the same or opposite climate trend for the observed and gridded data, stations with no trend for observed data, gridded data, or both.
When we defined a threshold to distinguish between trend and no trend, the percentage of the opposite climate trend between observed and gridded data seems to be lower, and the percentage of no tend for both, no trend for observed data only and no trend for gridded data only accounts for a considerable proportion except for ≥10 °C active accumulated temperature for which the same climate trend accounts for 90.3% (Table 5; Figure 17). Frost-free period and accumulated temperature are the most important factors affecting agricultural production. At most stations, trend analysis for other elements do not pass statistic test. However, the annual maximum and mean temperature and the active accumulated temperature mostly show the same trend between observed and gridded data. Thus, the result shows that it is possible to use gridded data for study on accumulated temperature, but caution should be taken when using the gridded data for study on frost days.

Table 5.
Trend statistics (the percentage) between observed data and gridded data in mainland China.
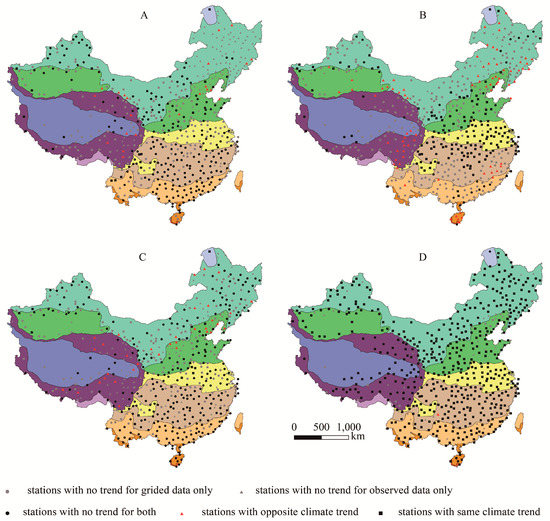
Figure 17.
Statistics for climate trend of minimum temperature in April (A), annual minimum temperature (B), frost-free period (C) and ≥10 °C active accumulated temperature (D) between observed data and gridded data in mainland China.
6. Conclusions
The accuracy of the high-resolution gridded data offered by the Beijing Normal University was re-evaluated by using root mean square error, correlation test and climate trend analysis. The indices for the gridded data, especially mean temperature and its derivatives, are commonly more applicable in north subtropical, mid-subtropical, south subtropical, Marginal tropical and mid-tropical zones than in plateau subfrigid, plateau temperate, and plateau subtropical mountains zones.
According to the correlation test, the active accumulated temperature derived from the gridded data can express the actual variation in thermal resources well. However, the first frost day, last frost day and frost-free period calculated from minimum temperature (gridded data) cannot correctly reflect the actual trend. Therefore, the heat index calculated from minimum temperature should be used with caution.
Supplementary Materials
The following are available online at https://www.mdpi.com/2073-4433/10/5/250/s1.
Author Contributions
M.Q., Y.L., Y.Z., and S.H. collected data. M.Q. analyzed the results, designed the structure, and wrote the manuscript. B.C. supervised the work and provided critical comments.
Funding
This research was funded by the National Key R&D Program of China (2017YFC1502804).
Acknowledgments
We thank Yizhou Wang for valuable suggestions in preparing the manuscript.
Conflicts of Interest
The authors declare no conflict of interest.
Appendix A
Details on how to construct the near-surface gridded meteorological dataset over mainland China has been published by Li et al. [19]. Here, we just made a brief introduction. In the dataset, the temperature T at a specific location (x, y) is calculated by the following equation [33,34]:
where f is a two-dimensional thin-plate smoothing spline; z is elevation at the location x; Tcfsr is the temperature from Climate Forecast System Reanalysis (CFSR) reanalysis dataset [35] (Saha et al., 2010); α and β are coefficients; and ε is the regression residual that is assumed to be under normal distribution ~ N(0, σ2). The variance of ε is spatially invariant. The two-dimension form of f(x, y) is shown as [33]:
where n is the number of grid points that should be linearly interpolated to the station; E is Euler distance; d1, d2, d3, Ci are parameters that need to be estimated.
To derive the estimated values for 2, observation values of temperature from meteorological stations, station elevations, and CFSR temperatures are used to train Equation (A1). Considering the bias in gridded data which are mainly resulted from orographic effect, CFSR temperatures should be linearly interpolated from grids to stations via elevation adjustment that (1) transforming the gridded temperature dataset to the sea level via a constant lapse rate 0.65 °C/100 m, (2) linearly interpolating the transformed gridded data (at sea level) to the specific locations, (3) transforming the interpolated temperature data back to the terrain height by the same constant lapse rate. Using these estimated values 2, the trend surface Tt at any sit is then estimated by (the subscript t represents trend):
The function “mgcv” and “predict” in the generalized additive model routine “gam” (in the R, an open source software) can be used to finish the process above.
References
- Qian, J.X.; Zhang, J.X.; Li, N.; Han, P. Variation characteristics of agricultural heat resource and its effect on agriculture in Shanxi Province, China. Chin. J. Appl. Ecol. 2015, 26, 786–792. [Google Scholar]
- Reddy, P.P. Climate Resilient Agriculture for Ensuring Food Security; Springer India: Pune, Maharashtra, India, 2015; pp. 154–196. [Google Scholar]
- Zhang, X.T.; Pan, X.B.; Xu, L.; Wei, P.; Hu, Q.; Yin, Z.W.; Shao, C.X. Spatio-temporal variation of agricultural thermal resources at different critical temperatures in China’s temperate zone. Res. Sci. 2017, 39, 2104–2115. [Google Scholar]
- Yang, P.Y.; Hu, Q.; Ma, X.Q.; Hu, L.T.; Ren, F.Y.; Yan, M.L.; Huang, B.X.; Pan, X.B.; He, Q. Spatiotemporal Variation of Heat and Solar Resources and Its Impact on Summer Maize in the North China Plain over the Period 1961–2015. Chin. J. Agrometeorol. 2018, 39, 431–441. [Google Scholar]
- Hayhoe, K.; Wake, C.P.; Huntington, T.G.; Luo, L.; Schwarta, M.D.; Sheffield, J.; Wood, E.; Anderson, B.; Bradbury, J.; De Gaetano, A.; et al. Past and future changes in climate and hydrological indicators in the US Northeast. Clim. Dyn. 2007, 28, 381–407. [Google Scholar] [CrossRef]
- Kirby, E.J.M.; Appleyard, M.; Fellowes, G. Effect of sowing date on the temperature response of leaf emergence and leaf size in barley. Plant Cell Environ. 2010, 5, 477–484. [Google Scholar] [CrossRef]
- Wang, Y.Y.; Zhang, B. Characteristics of frost days and accumulated temperature in eastern Gansu over the last 40 years. Res. Sci. 2012, 34, 2181–2188. [Google Scholar]
- Mccabe, G.J.; Betancourt, J.L.; Feng, S. Variability in the start, end, and length of frost-free periods across the conterminous United States during the past century. Int. J. Climatol. 2016, 35, 4673–4680. [Google Scholar] [CrossRef]
- Li, X.H.; Xu, Y.L.; Meng, C.C.; Zhang, L.; Wang, C.G. Analysis on the Changes of Agro-Meteorological Thermal Indices in Northeast China under RCP4.5 Scenario Using the PRECIS2.1. Atmosphere 2018, 9, 323. [Google Scholar] [CrossRef]
- Kalany, E.; Kanamitsu, M.; Kistler, R.; Collins, W.; Deaven, D.; Gandin, L.; Iredell, M.; Higgins, W.; Janowiak, J.; Mo, K.C.; et al. The NCEP/NCAR 40-year reanalysis project. Bull. Am. Meteorol. Soc. 1996, 77, 437–471. [Google Scholar] [CrossRef]
- Kistler, R.; Kalnay, E.; Collins, W.; Saha, S.; White, G.; Woollen, J.; Chelliah, M.; Ebisuzaki, W.; Kanamitsu, M.; Kousky, V.; et al. The NCEP/NCAR-50 year reanalysis: Monthly means CD-ROM and documentation. Bull. Am. Meteorol. Soc. 2001, 82, 247–267. [Google Scholar] [CrossRef]
- Guiot, J.; Boreux, J.J.; Braconnot, P.; Torre, F. Data-model comparison using fuzzy logic in paleoclimatology. Clim. Dyn. 1999, 15, 569–581. [Google Scholar] [CrossRef][Green Version]
- Simmons, A.J.; Gibson, J.K. The ERA-40 Project Plan; ERA-40 Project Report Series; ECMWF: Reading, UK, 2000; pp. 12–24. [Google Scholar]
- Uppala, S.M.; Kallberg, P.W.; Simmons, A.J.; Andrae, U.; Da Costa Bechtold, V.; Fiorino, M.; Gibson, J.K.; HASELER, J.; Hernandez, A.; Kelly, G.A.; et al. The ERA-40 reanalysis. Q. J. R. Meteorol. Soc. 2005, 131, 2961–3012. [Google Scholar] [CrossRef]
- Onogi, K.; Koide, H.; Sakamoto, M.; Kobayashi, S.; Tsutsui, J.; Hatsushika, H.; Matsumoto, T.; Yamazaki, N.; Kamahori, H.; Takahashi, K.; et al. JRA-25: Japanese 25-year re-analysis project-progress and status. Q. J. R. Meteorol. Soc. 2005, 131, 3259–3268. [Google Scholar] [CrossRef]
- Onogi, K.; Tsusui, J.; Koide, H.; Sakamoto, M.; Kobayashi, S.; Hatsushika, H.; Matsumoto, T.; Yamazaki, N.; Kamahori, H.; Takahashi, K.; et al. The JRA-25 Reanalysis. J. Meteorol. Soc. Jap. 2007, 85, 369–432. [Google Scholar] [CrossRef]
- Wu, J.; Gao, X.J. A gridded daily observation dataset over Chinese region and comparison with the other datasets. Chin. J. Geophys. 2013, 56, 1102–1111. [Google Scholar]
- Chaney, N.W.; Sheffield, J.; Villarini, G.; Wood, E.F. Development of a High-Resolution Gridded Daily Meteorological Dataset over Sub-Saharan Africa: Spatial Analysis of Trends in Climate Extremes. J. Clim. 2014, 27, 5815–5835. [Google Scholar] [CrossRef]
- Li, T.; Zheng, X.; Dai, Y.; Yang, C.; Chen, Z.Q.; Zhang, S.P.; Wu, G.C.; Wang, Z.L.; Huang, C.C.; Shen, Y.; et al. Mapping near-surface air temperature, pressure, relative humidity and wind speed over Mainland China with high spatiotemporal resolution. Adv. Atmos. Sci. 2014, 31, 1127–1135. [Google Scholar] [CrossRef]
- Zheng, J.Y.; Bian, J.J.; Ge, Q.S.; Hao, Z.X.; Yin, Y.H.; Liao, Y.M. The climate regionalization in China for 1981–2010. Chin. Sci. Bull. 2013, 58, 3088–3099. [Google Scholar]
- Wang, Y.Z.; Zhang, H.P.; Zheng, D.W.; Dassow, W.V.; Zhang, Z.Q.; Yu, J.X.; Pang, J.J. How a stationary knickpoint is sustained: New insights into the formation of the deep Yarlung Tsangpo Gorge. Geomorphology 2017, 285, 28–43. [Google Scholar] [CrossRef]
- Zheng, D.W.; Zhang, P.Z.; Wan, J.L.; Yuan, D.Y.; Li, C.Y.; Yin, G.M.; Zhang, G.L.; Wang, Z.C.; Min, W.; Chen, J. Rapid exhumation at ~ 8 Ma on the Liupan Shan thrust fault from apatite fission-track thermochronology: Implications for growth of the northeastern Tibetan Plateau margin. Earth Planet. Sci. Lett. 2006, 248, 198–208. [Google Scholar] [CrossRef]
- Chen, B.J. Seismic activity and continental dynamic background in southwestern Guizhou and its adjacent region. J. Geod. Geodyn. 2009, 29, 53–58. [Google Scholar]
- Dai, H.M.; Liu, C.; Gong, C.D.; Cheng, H.X.; Bai, R.J.; Cui, Y.J.; Yang, X.B.; Feng, Y.L. Soil carbon pool in Northeast plain of China and its relations between the soil properties. Quat. Sci. 2013, 33, 986–994. [Google Scholar]
- Wei, F.Y. Modern Climate Statistical Diagnosis and Prediction Technology; China Meteorological Press: Beijing, China, 2013; pp. 290–295. [Google Scholar]
- Zhu, Z.; Shi, C.X.; Zhang, T.; Zhu, C.; Meng, X.Y. Applicability analysis of various reanalyzed land surface temperature datasets in China. J. Glaciol. Geocryol. 2015, 37, 614–624. [Google Scholar]
- Wang, T.Y.; Wu, T.H.; Li, R.; Xie, C.W.; Zou, D.F.; Qian, Y.H.; Yu, W.J.; Wang, W.H. Evaluation of monthly air temperature from two reanalysis datasets in Mongolia. Plateau Meteorol. 2016, 35, 651–661. [Google Scholar]
- Stocker, T.F.; Qin, D.; Plattner, G.K.; Tignor, M.; Allen, S.K.; Boschung, J.; Nauels, A.; Xia, Y.; Bex, V.; Midgley, B.M. Climate Change 2013: The Physical Science Basis; Contribution of Working Group I to the Fifth Assessment Report of the Intergovernmental Panel on Climate Change; Cambridge University Press: Cambridge, UK, 2013. [Google Scholar]
- Liang, H.; Wang, P.J.; Zhang, J.C.; Li, Y.J. Spatial and temporal distribution of variation in heat resource over northeast China during the period from 1960 to 2011. J. Nat. Res. 2014, 29, 466–479. [Google Scholar]
- Han, R.Q.; Li, W.J.; Ai, W.X.; Song, Y.L.; Ye, D.X.; Hou, W. The climatic variability and influence of first frost dates in northern China. Acta Geogr. Sin. 2010, 65, 525–532. [Google Scholar]
- Chen, S.Y. Changes in the first frost date from 1961 to 2009 in Northwest China. Res. Sci. 2013, 35, 165–172. [Google Scholar]
- Zhang, S.Q.; Pu, Z.C.; Li, J.L.; Xu, W.X.; Wang, M.Q.; Zhao, S.Q. The impact of global warming on frost-free periods from 1961 to 2010 in Xinjiang. Res. Sci. 2013, 35, 1908–1916. [Google Scholar]
- Wahba, G. Spline Models for Observational Data; CBMS-NSF Regional Conference Series in Applied Mathematics; SIAM: Siam, Thailand, 1990; Volume 59, p. 169. [Google Scholar]
- Zheng, X.; Basher, R. Thin-plate smoothing spline modeling of spatial climate data and its application to mapping south pacific rainfalls. Mon. Weather Rev. 1995, 123, 3086–3102. [Google Scholar] [CrossRef]
- Saha, S.; Moorthi, S.; Pan, H.L.; Wu, X.; Wang, J.; Nadiga, S.; Tripp, P.; Kistler, R.; Woollen, J.; Behringer, D. The NCEP climate forecast system reanalysis. Bull. Am. Meteorol. Soc. 2010, 91, 1015–1058. [Google Scholar] [CrossRef]
© 2019 by the authors. Licensee MDPI, Basel, Switzerland. This article is an open access article distributed under the terms and conditions of the Creative Commons Attribution (CC BY) license (http://creativecommons.org/licenses/by/4.0/).