Abstract
This study examined the long-term trends in Arctic ambient methane (CH4) mixing ratios over 1986–2014 and investigated their potential causes. Significant correlations between carbon monoxide (CO) and CH4 in Barrow, Alaska (r = −0.59, p = 0.007) and Alert, Canada (r = −0.62, p = 0.004) with the strongest correlations occurring in April (r = −0.81, p = 0.000, and r = −0.80, p = 0.000) suggest local to global anthropogenic contributions to ambient CH4 during the cold months. Backward trajectories indicate a significant influence (27% of total trajectories) of local emissions from the Prudhoe Bay Oil Field on ambient CH4 in Barrow in winter, and this influence was dominated by other factors in summer. The mean CH4 wetland emission flux in Barrow over 1986–2014 was estimated to be 0.008 ± 0.002 µg m−2 s−1 while in Tiksi, Russia it was 0.010 µg m−2 s−1 over 2012–2016, which is comparable to the lower end of measurements in the literature. Note that in Barrow, there was a decrease in wetland flux from 0.0083 ± 0.002 µg m−2 s−1 over 1986–1998 to 0.0077 ± 0.002 µg m−2 s−1 from 1999–2006 followed by an increase to 0.0081 ± 0.002 µg m−2 s−1 over 2007–2014. Although the difference between the three values is not statistically significant due to small sample size, it is indicative of possible warm season wetland emissions contributing to the zero-growth period. Strong support for this hypothesis is that these changes are consistent with a concurrent drop in summertime temperature possibly causing a decrease in wetland emissions over 1998–2006 based on the statistically significant correlations between temperature and CH4 during August through November (r ~ 0.36–0.56, p = ≤0.05). In a warming climate, permafrost thawing can increase CH4 wetland emissions and also decrease wetlands making it a complex problem, and, hence, further study is needed to better understand the mechanisms driving long-term trends in Arctic CH4.
1. Introduction
Methane (CH4) is the second most important anthropogenic greenhouse gas contributing to about 20% of radiative forcing since the pre-industrial era due to long-lived greenhouse gases [1]. While global mixing ratios have increased at varying rates during this period, the mechanisms behind such trend variation are not fully understood. For instance, there was approximately a decade (1998–2006) of near-zero growth in global CH4 mixing ratios [2] with steady increases before and after [1]. Theories for this near-zero growth period include decreased precipitation in tropical wetlands during positive phases of El Niño/Southern Oscillation (ENSO) [3] and reduction in microbial activity in the Northern Hemisphere [4]. The microbial reductions could be from a number of biogenic sources, such as wetlands, cow ruminants, and rice paddies, with potentially half of the emissions reductions in the Northern Hemisphere due to reduced emissions from rice agriculture in Asia [4]. A better understanding is needed for the mechanisms driving the long term trends in atmospheric CH4 mixing ratios.
There is very little literature study on long-term trends in CH4 in the Arctic. CH4 sources are poorly constrained, particularly natural sources in the Arctic regions [5]. The largest natural source is wetlands, comprising about one-third of global CH4 emissions [5]. Methane emissions from boreal and Arctic wetlands make up about 34% of the world’s total wetland emissions, leading to significant contributions in CH4 emissions during the warm seasons [6] and potentially into the cold season [7]. A handful of short-term studies have estimated wetland CH4 fluxes in several locations throughout the Arctic, such as Lena River Delta in Russia, Northeast Greenland, Bethel, Alaska, and the Alaska Range, with fluxes ranging from 0.05 to 1.4 µg m−2s−1 [[8,9,10,11,12]. The wetland emissions are thought to be the dominant source of CH4 in the Arctic during the summer with gas fields contributing to a greater fraction during the spring as indicated by research conducted between the late summer of 2008 to the late summer of 2009 [13]. Very few studies have been conducted to quantify the contribution of wetland emissions to ambient CH4 levels over the long term, which becomes more important in a warming climate.
In these northern regions, permafrost plays a critical role in wetland emissions. Permafrost is defined by soil, rock or sediment that is permanently exposed to below freezing temperatures. Permafrost exists in 24% of the soils in the northern hemisphere [14] and is estimated to contain twice the amount of carbon currently in the atmosphere [15]. A warming climate has the potential to lead to increased permafrost thawing and, subsequently, increased carbon emissions producing positive feedback. On the other hand, permafrost thaw may diminishes Arctic wetlands. During the warm months in the Arctic, there is significant snow melt on the surface. The permafrost prevents drainage of the water from the melted snow creating the Arctic wetlands [16]. Permafrost thaw could potentially impede the creation of Arctic wetlands. Therefore, the impact of permafrost thaw on Arctic wetland emissions is a complicated problem, and an examination of long term data of atmospheric CH4 can maybe shed light on changes in Arctic wetland emissions of CH4 linked to potential permafrost thaw in the past decades.
There is some evidence of increased CH4 release in Arctic wetlands. For instance, reductions in sea ice due to a warming climate may also contribute to increased CH4 releases due to warmer temperatures from a decreased albedo [17]. However, there is little research on trends in atmospheric CH4 in the Arctic, especially as it pertains to the wetlands and other natural sources due likely to the difficulties in constraining emissions for wetlands and the lack of observational data in these areas.
Local to global emissions could contribute to ambient CH4 mixing ratios in a given area. Local anthropogenic sources are scarce in Polar Regions with the exception of oil drilling, such as the Prudhoe Bay oil field [18]. Global transport of CH4 from lower latitudes to the Arctic is facilitated by atmospheric circulation, which is controlled by different climatic patterns, such as the North Atlantic Oscillation (NAO) and El Niño/Southern Oscillation (ENSO). These climate variations can result in anthropogenic influence in the Arctic [2]. Typically, the majority of lower tropospheric transport of pollutants to the Arctic comes during the winter from the Eurasian continent, whereas transport from North America and East Asia is mainly from atmospheric uplift outside the Arctic [19]. This is due to an “Arctic Dome” that surrounds the Arctic created from constant surface level potential temperature. During the summer transport pathways are moved from the North Atlantic Ocean to the North Pacific Ocean, with transport only being half as fast [20]. The seasonal variation in these transport pathways can greatly affect the significance of anthropogenic emissions to Arctic CH4 budgets.
There is a positive latitudinal gradient of CH4 mixing ratios from 90° S to 90° N (Figure S1) thought to be caused by larger sources in the Northern Hemisphere for the latitudinal range of the South Pole to northern hemispheric midlatitudes, and by differences in rates of oxidation and the reductions in available OH further north [21]. Oxidation of CH4 by the hydroxyl radical (OH) is a main sink for atmospheric CH4 [5]. This chemical sink fluctuates throughout the year, highly sensitive to temperature and solar radiation. However, Barrow, Alaska has higher mixing ratios of CH4 than Alert, Canada, against the trend of the gradient. These differences suggest that different sources, sinks, and transport in various environments within the Arctic are playing a role in controlling ambient CH4 mixing ratios.
In this study, long-term trends in sources of CH4 emissions were examined using mixing ratios in one primary North American Arctic site, along with three comparison sites where availability of other measurement data concurrent with CH4 was limited. Local anthropogenic sources were investigated using carbon monoxide (CO) mixing ratios as a proxy for anthropogenic activity. Transport of CH4 was studied using backward trajectory simulations. Lastly, CH4 emissions from wetlands were estimated using a first order of magnitude mass balance method.
2. Results and Discussion
2.1. General Characteristics
Figure 1 exhibits annual average CH4 mixing ratios from monthly flask measurements for Barrow, Alert, Summit, and Tiksi during their respective time periods of data availability. CH4 has increased at a rate of 4.1 ± 0.2 nmol mol−1 yr−1 at Barrow over 1986–2014, 4.0 ± 0.2 nmol mol−1 yr−1 at Alert over 1986–2014, 3.8 ± 0.3 nmol mol−1 yr−1 at Summit over 1997–2014, and 4.4 nmol mol−1 yr−1 at Tiksi over 2011–2014 (Table 1). Both Barrow and Alert saw a decrease in CH4 growth rate from 11.8 ± 1.1 and 10.9 ± 0.7 nmol mol−1 yr−1, respectively, over 1986–1990 to 4.22 ± 0.8 and 3.40 ± 0.6 nmol mol−1 yr−1, respectively, over 1991–1997. Global CH4 growth rates have seen similar changes and were believed to be due to decreases in emissions from fossil fuels [22]. Over 1998–2006, Barrow, Alert, and Summit all saw virtually zero growth in CH4 mixing ratios. Similar results were observed globally, with causes remaining unclear. It was speculated to be associated with higher frequency of occurrence of El Niño leading to decreased precipitation in tropical wetlands reducing their CH4 emissions [2] or reductions in fossil fuel emissions [23]. After 2007, CH4 growth at Barrow and Alert resumed at a rate of 5.4 ± 0.5 and 4.9 ± 0.5 nmol mol−1 yr−1, respectively. To confirm these growth rates, a Mann–Kendall statistical test was used for the sites in Barrow, Alert, and Summit. A test was not run on Tiksi due to the lack of sample size. Barrow, Alert, and Summit all experienced statistically significant positive trends with correlation coefficient of 0.94 (p = 0.00), 0.93 (p = 0.00), and 0.88 (p = 0.00), respectively.
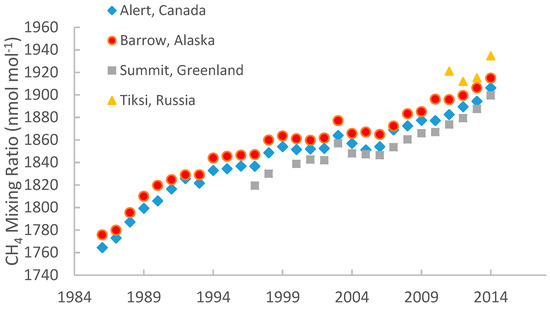
Figure 1.
Annual mean methane (CH4) mixing ratios (nmol mol−1) for Barrow, Alert, Summit, and Tiksi.

Table 1.
Summary of methane (CH4) site characteristics at the four Arctic sites used in this study. Courtesy of National Oceanic and Aeronautics Administration’s (NOAA) Earth System Research Laboratory (ESRL).
Since the lengths of the data records at the four sites are very different (Table 1), the time period 2011–2014, where the four data records overlapped, was used for comparison. Based on a Tukey Pairwise Comparison Test for this period, Tiksi saw the highest average CH4 mixing ratios with a mean of 1921 nmol mol−1, followed in descending order by Barrow, Alert, and Summit with mean values of 1906, 1896, and 1887 nmol mol−1, respectively (Table 1). The differences among the four sites, except between Alert and Summit, were statistically significant (Table S1). These differences suggest that sources and/or processes controlling the CH4 mixing ratios at these Arctic sites could be quite different.
The 29-year average annual cycle in Barrow shows that CH4 peaked at 1873 nmol mol−1 in February through March and was lowest at 1830 nmol mol−1 in July (Figure 2a). The pattern and amplitude of annual variation in CH4 was similar at Alert, Summit, and Tiksi (Figure 2b–d) with annual peaks in the winter months (on average February) and minimums in summer (on average June and July). These consistent patterns of long-term average annual cycles indicate similar processes controlling the annual cycle in all four sites. Alert experienced the highest average annual amplitude of 48 nmol mol−1, followed by Barrow, Tiksi, and Summit (43 nmol mol−1, 41 nmol mol−1, and 34 nmol mol−1, respectively) in descending order.
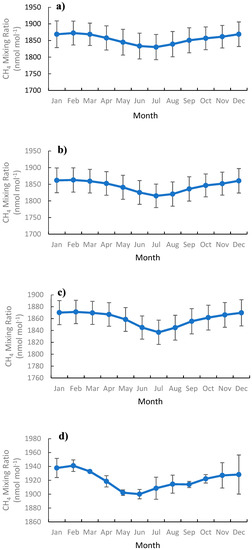
Figure 2.
The annual cycle of CH4 mixing ratios in Barrow (a), Alert (b), Summit (c), and Tiksi (d), averaged over their respective time periods with standard deviation.
Figure 3 exhibits the annual maximum and minimum CH4 mixing ratios as well as the annual amplitude (=annual maximum − minimum mixing ratios of CH4) for each year in Barrow. The annual maximum CH4 ranged between 1799 nmol mol−1 and 1932 nmol mol−1, while the annual minimum CH4 ranged between 1743 nmol mol−1 and 1887 nmol mol−1 (Figure 3a,b). Annual maximum CH4 has been increasing at a rate of 3.76 nmol mol−1 yr−1 while the minimum at 4.21 nmol mol−1 yr−1. Annual amplitude has been decreasing at a rate of 0.45 nmol mol−1 yr−1 (r = −0.40, p = 0.03) from 71 nmol mol−1 to 45 nmol mol−1 in Barrow (Figure 3c). In Alert, the annual maximum increased at 3.81 nmol mol−1 yr−1 while the minimum increased at 3.99 nmol mol−1 yr−1 with a statistically insignificant decrease in amplitude of 0.18 nmol mol−1 yr−1 (r = −0.21, p = 0.28) (Figure S2). In Summit, the annual maximum increased by 3.67 nmol mol−1 yr−1 while the annual minimum increased by 3.42 nmol mol−1 yr−1 with a statistically insignificant increase in the annual amplitude of 0.34 nmol mol−1 yr−1 (r = 0.30, p = 0.23) (Figure S3). Due to a lack of data, trends were not calculated for Tiksi. Trends in annual maximums and minimums at the three Arctic sites appeared to be close in patterns, but only Barrow saw a statistically significant trend in annual amplitude. The statistically significant decreasing trends in the annual amplitude at Barrow could be due to the increasing rates of annual minimums overtaking those of annual maximums. This seems to allude to some particular processes affecting CH4 levels in Barrow in the summer, which is discussed in Section 2.4.
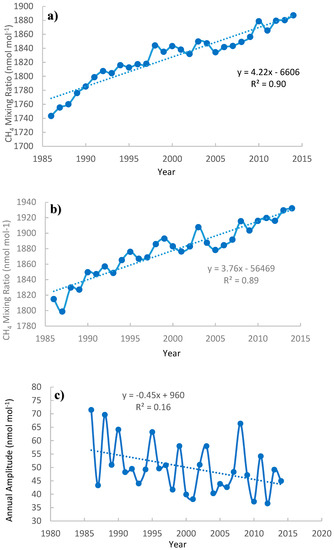
Figure 3.
Annual minimums (a) and maximums (b) as well as annual amplitude (c) for Barrow, Alaska. The dash lines represent lines of best fit.
2.2. Regional Anthropogenic Influences
CO mixing ratios were used to identify the influence of anthropogenic sources, because CO is a common by-product of incomplete combustion of oil, making it a useful indicator of anthropogenic emissions. CO data were available in Barrow and Alert only, which limited the analysis of anthropogenic influence to these two sites. There is a statistically significant negative correlation between the annual averaged CH4 and CO mixing ratios in both Barrow and Alert, with r = −0.59 (p = 0.007) and −0.62 (p = 0.004), respectively (Figure 4). An examination of the long-term trend in CO in Barrow showed a rate of −1.1 nmol mol−1 yr−1 and in Alert of −1.1 nmol mol−1 yr−1 (Figure S4). These declining trends are consistent with decreasing CO emissions during the past decades from 204 thousand tons in 1970 to 60 thousand in 2017 in the United States [24] and from 12 thousand tons in 1990 to 5.6 thousand tons in 2015 in Canada [25] which had supposedly the largest immediate influence on the two sites. This relationship implies a predominant anthropogenic influence on ambient CH4 mixing ratios.
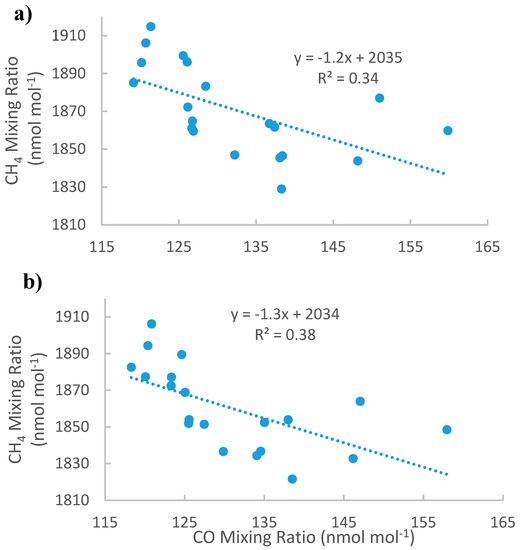
Figure 4.
Annual average CH4 vs carbon monoxide (CO) in Barrow (a) and Alert (b) over 1986–2014.
Correlations between CH4 and CO were also examined by month (Table 2). In Barrow, there is a negative correlation over January–May with the highest correlation (r = −0.81, p = 0.00) occurring in April with no significant correlations for the remaining months. Similarly, in Alert, there is a significant correlation between CH4 and CO in December through June, with the strongest correlation occurring in April (r = −0.80, p = 0.00). In summer there is a combination of seasonal reductions in CH4 due to oxidation and dilution due to increased planetary boundary layer (PBL) height, and a seasonal increase in wetland emissions, especially in Barrow, which could confound the negative correlation [26]. In Barrow, in addition to global anthropogenic influence, there are most likely local anthropogenic influences due to the ~4000 residents in the town [27] as well as emissions from the Prudhoe Bay Oil Field [18]. With only 62 residents and no other local emission sources in Alert, it is very unlikely that local anthropogenic sources played a significant role [28]. Instead, it is more likely the result of long-range transport of anthropogenic CH4 and CO, which is suggested by the negative correlation (Figure 4b).

Table 2.
Correlations (r) between CH4 and carbon monoxide (CO) for each month in Barrow and Alert and sample size (n) at significance level of 0.05. The boldfaced values represent statistically significant correlations.
2.3. Transport
To understand transport pathways for air masses reaching the Arctic, atmospheric circulation patterns were examined using the mean composite sea level pressure for the months of January and July averaged over 1992–2014 (Figure 5). During the month of January, the Aleutian low-pressure system was situated over Alaska and the Bering Strait [29]. There was also a high-pressure system situated over the Eastern Asian continent. These systems formed southeasterly flow, which could potentially transport air masses rich in CH4 among other pollutants from the West Coast of the U.S. or the Eurasian Continent, potentially contributing to ambient CH4 mixing ratios in Barrow, which is suggested by the negative CO–CH4 correlation. In July, the Aleutian low-pressure system disappears, replaced by two high-pressure systems indicating less dynamic circulation in the region that significantly reduced transport of anthropogenic emissions from distant source regions.
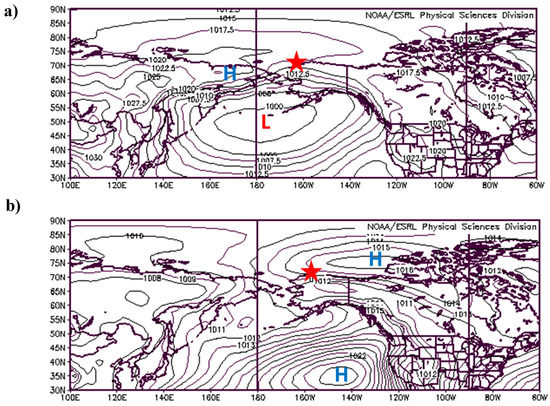
Figure 5.
The sea level pressure composite for Barrow from 1992–2014 for the months of January (a) and July (b). The star represents the study site, Barrow. H (L) represents a high (low) pressure system. (Courtesy of National Oceanic and Aeronautics Administration’s (NOAA)).
The hypothesized transport regimes above are supported by the cluster analysis of 1992–2014 5-day backward trajectories starting from Barrow for the months of January and July as shown in Figure 6. Each line represents the fraction of trajectories originating from a given direction. During January, a total of 46% and 13% of the trajectories arrive from east and west, with respect to Barrow. These clusters were likely coming from the Eurasian continent and the Northern Coastlines of Alaska Peninsula and adjacent Canada’s Yukon and Northwest Territories, potentially bringing anthropogenic CH4 into Barrow. Note that 27% of these trajectories, in green, flowed near the Prudhoe Bay Oil Field, directly east of Barrow [18]. This cluster also had relatively low altitude, likely bringing CH4 released from the oil field. In July, a larger percentage (13% in yellow) of trajectories arrived from the south of Barrow. The trajectories from the north moved further into the ocean and decreased in percentage, decreasing the chances of CH4 coming from continental anthropogenic sources. The high-pressure systems in the summer likely reduced transport from the Eurasian Continent, but possibly enhanced transport from across Alaska and further south including the U.S. West Coast (Figure 5b and Figure 6) as well as vertical downward transport from aloft. Overall, the trajectories indicate that transport of anthropogenic CH4 from Eurasia may have decreased significantly, but the transport from the North American continent and upper air may have increased during the summer months. Therefore, the overall influence of global transport remains unclear.
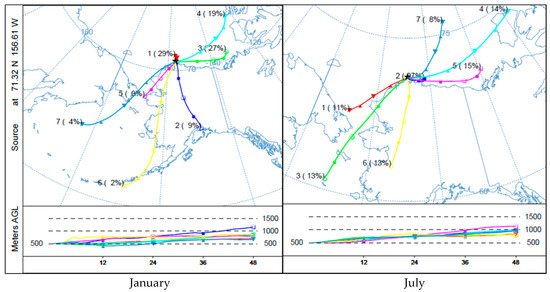
Figure 6.
Backward Trajectory clusters for Barrow, Alaska for the months of January and July over 1992–2014.
It was unlikely that CH4 emissions were directly transported near the surface from North America or East Asia [19]. The Arctic region is surrounded by a dome that is created from constant potential temperatures. This dome forces air parcels outside of it to rise. In the winter, this polar dome reaches around 65° N over Alaska, placing Barrow well within the dome, and can drop to 40° N over the Eurasian Continent [30]. This dome prevents transport near the surface coming from lower latitudes of North America and Asia, making Eurasia the primary source of long-range transport near the surface. On the North American continent, the Prudhoe Bay Oil Field is inside of this dome, continuously contributing a large source of CH4, especially during the winter. This is manifested in the nitrogen oxide (NOx) emissions, a strong indicator of anthropogenic emissions, from Prudhoe Bay oil fields, ranging over 34,000 to 36,000 tons per year during 2008–2014 [31]. These large NOx emissions over the years suggest that Prudhoe Bay oil fields are a significant local CH4 emission source. To corroborate these results, individual trajectories were simulated using Hybrid Single Particle Lagrangian Integrated Trajectory (HYSPLIT) for each CH4 data point. To better illustrate the potential sources of air masses with high and low CH4 mixing ratios, mixing ratios below their 25th percentile were highlighted in blue, between the 25th and 75th percentile in green, and above the 75th percentile in red for the month of January between the years 1992–2012 (Figure S5). There seem to be a significant number of trajectories (46%) for the data points less than the 25th percentile mixing ratio coming from the East and Northeast (Figure 6). More importantly, the number of trajectories below the 25th percentile decrease in frequency closer to Alaska’s coast, along with an increased number of trajectories greater than the 75th percentile value, implying increased influence from anthropogenic sources of CH4. There are also a significant number of trajectories for data points greater than the 75th percentile value arriving West of Barrow. It is likely that these trajectories transport anthropogenic CH4 from the Eurasian continent within the Arctic Dome as aforementioned ([19,30]).
2.4. Influence of Wetland Emissions During Warm Seasons
Further investigation of the annual minimum mixing ratios at Barrow (Figure 3b) uncovered a very similar pattern to the annual mean values at the site (Figure 1), with a decreased growth rate after 1992 from 10.9 nmol mol−1 yr−1 to 4.93 nmol mol−1 yr−1, a plateau in growth between 1998 and 2006 and resumed growth rate of 6.17 nmol mol−1 yr−1 after 2006. This pattern is largely missing from annual maximums (Figure 3a). The most distinct difference between summertime and wintertime sources and sinks in the Arctic is increased CH4 oxidation, reduced long-range transport, and wetland emissions in the summer. No literature has reported long-term trends in OH mixing ratios and long-range transport of CH4 for Barrow. However, permafrost thaw has been reportedly occurring and expanding in the Arctic increasing warm season wetland emissions [32]. On the other hand, [33] suggested that thawing permafrost could potentially lead to a decrease in Arctic wetland areas and, therefore, CH4 emissions. In this study, it was hypothesized that the similarity in patterns of long term variations in annual minimum and annual mean CH4 mixing ratios was caused by the long-term variation in Arctic summer sources of CH4 emissions.
To corroborate the hypothesis that wetland emissions drove the increasing trend in summertime minimum of CH4 mixing ratios in Barrow, the relationship between temperature and CH4 mixing ratios was examined. It was found that there was a positive correlation of 0.49 (p = 0.007) between annual average temperature and annual average CH4 mixing ratios (Figure 7). This linear correlation suggests that enhanced emission sources were temperature dependent, pointing to emission sources from thawing permafrost. Studies have shown that in addition to warming temperature, the growing season has been lengthened [34], allowing for a longer period of wetland emissions. These findings indicate a need for estimations of wetland emissions.
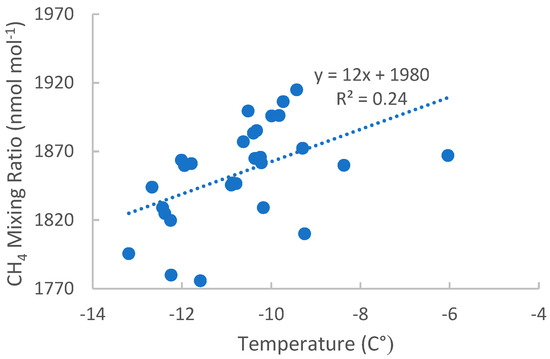
Figure 7.
Annual average temperature versus annual average CH4 mixing ratios in Barrow during 1986–2014.
During the summer months, the influence of Arctic wetlands increases dramatically. However, the annual lowest mixing ratios of CH4 occur during the summer (Figure 2). On average, the drop from the annual peak mixing ratios in February to minimum mixing ratio in July is 42.32 nmol mol−1 averaged over 1986–2014. This is mainly due to oxidation of CH4 [26] along with dilution from increasing PBL height and likely reduced long-range transport.
To estimate the emission rate of Arctic wetlands, Equation (2) in Section 3 “Data and Method” was used to estimate the flux of CH4 in Barrow between the months of May and July, and June and July over a 29-year period. The same was done for Tiksi over the 5-year period when data were available. The May–July and June–July time periods were used as these are the periods that include the growing season start and peak, respectively, in the Arctic. It was assumed that the overall change in mixing ratios between the cold and warm season was determined by oxidation, dilution (due to increasing PBL height), wetland emissions, and the contribution of seasonal changes in long-range transport and anthropogenic emissions. Due to the very long lifetime of CH4, it is reasonable to assume relatively constant impacts of global transport of CH4 to Barrow, and local anthropogenic emissions were assumed to be constant throughout the year. Thus, the seasonal change in anthropogenic emissions and transport was considered to be negligible. These assumptions can be corroborated by the seasonal changes in the CO–CH4 correlation seen in Table 2. There was a strong correlation between CO and CH4 during the winter months, indicating predominant anthropogenic influence on CH4 mixing ratios. During the summer, this correlation became insignificant, implying a change in sources or sinks of CO and/or CH4. These results imply that natural sources of CH4, and losses of CH4 through oxidation become important in the summer. Therefore, Equation (3) was simplified to s (4) as follows,
Using the change in CH4 from May to July and June to July subtracting the influence of dilution (fdilution = 0.2, the justification for this value can be found in Section 3 Data and Methods) due to increased PBL height together with the calculated oxidation, wetland emissions can be estimated for these periods. Table 3 shows the wetland emission fluxes for Barrow and Tiksi, along with other flux estimates at other sites from previous studies.

Table 3.
Calculated and literature wetland emission fluxes (µg m−2s−1) for various sites. Bold highlights potential changes in CH4 emission fluxes before, during, and after the plateau period.
Barrow saw a maximum flux of 0.011 µg m−2s−1 during 1986–2014 while Tiksi saw a maximum flux of 0.014 µg m−2s−1 over 2012–2016. There were statistically significant differences between May–July and June–July fluxes, but no statistically significant differences between the time intervals before (<1998), during (1998–2006), and after (>2006) the plateau period (p = 0.00).
The range of the literature sources for Arctic wetland emissions was 0.05–1.5 µg m−2s−1 (Table 3). Our estimated fluxes are near the lower end of this range. This discrepancy may be caused by several reasons. First, the method used in this study is a first order of magnitude method with reasoned approximations, whereas the cited studies employed measurement approaches. Second, previous wetland studies focused on areas of wetlands, while our study averages over a large area of mixed land surface types including surfaces of low CH4 emissions, potentially leading to lower CH4 emission estimates in our study. The Carbon Arctic Reservoirs Vulnerability Experiment (CARVE) found mean flux average over the State of Alaska to be 0.093 µg m−2s−1 putting this study’s June–July fluxes within the same order of magnitude [12]. Third, the time periods of the calculation in this study and the measurement periods in the literature were very different. The data from the literature fluxes were instantaneous fluxes measured over short periods, whereas the calculated fluxes presented here were averages between May–July and June–July over the period of nearly 2–3 decades at Barrow, Alert, and Summit, and 5 years over Tiksi. Fourth, there is significant uncertainty in the PBL height that was used, which determined the dilution factor (0.2) used in the estimation. A mean value of 1.5 km was used for calculations, but this height can fluctuate, bringing uncertainty into the calculation [35]. Fifth, there was great uncertainty in estimation of oxidation. There is very little literature on OH concentrations in the Arctic, and model estimations used in this study [36] seem to underestimate OH concentrations compared to measured values [37].
In Barrow, there appears to be a decrease in flux from 0.0083 µg m−2s−1 before the plateau period to 0.0077 µg m−2s−1 during the plateau period, and then increase to 0.0081 µg m−2s−1 after (Table 3). Admittedly these changes are not statistically significant due to limited sample size. However, this pattern in the fluxes is consistent with the pattern of temperatures in July during the three time periods, where the average July temperature during 1998–2006 dropped by 0.41 °C compared to the mean of all of July over 1986–2014, 0.37 °C compared to the mean over 1986–1997, and 0.94 °C compared to the mean over 2007–2014 (Figure 8). This indicates that wetlands saw a decrease in emissions which possibly contributed to this plateau. Nisbet et al. (2016) suggested that this plateau was largely due to a drop in emissions from tropical wetlands [3]. Our finding suggest that this decrease in fluxes from Arctic wetlands could also have played a role. More measurement data from the Arctic are needed to obtain more rigorous estimates of summertime wetland emission flux and to validate our hypothesis.
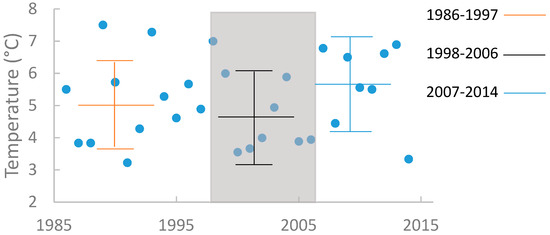
Figure 8.
Average monthly temperature for July (solid dots in blue) over time in Barrow with the plateau period of 1998–2006 shaded in grey. Each line represents the mean temperature, along with their standard deviations for three time periods; the orange line represents 1986–1997, the black line represents 1998–2006, and the blue line represents 2007–2014.
Arctic wetland emissions have the potential to increase over time, specifically in the fall. Table S2 summarizes correlations between temperature and CH4 mixing ratios in Barrow for each month over 1986–2014. Statistically significant correlations occurred in months of August (r = 0.37, p = 0.05). September (r = 0.44, p = 0.02), October (r = 0.50, p = 0.01), November (r = 0.56, p = 0.00), apparently with the strongest correlation in late fall.
During the fall, OH mixing ratios are reduced, and oxidation is subsequently weakened [36]. With this reduced oxidation and a warming climate, more days above freezing could extend the period of wetlands emissions. A study in 2012 found that 21–25% of CH4 emissions in Barrow occurred during the fall [38]. In a warming climate, these autumn influences could increase. Another study found that fall emissions could be significant [7]. In this study, a “zero curtain” was proposed in soils during the fall when permafrost is still relatively low in the soil profile, and colder air temperatures freeze the surface layer of soil. These conditions insulate an unfrozen layer of the soil profile that can continue microbial activity. The CH4 produced in this manner can diffuse through the upper frozen soil in which minimal consumption CH4 occurs, thereby leading to elevated CH4 emissions through the fall [7]. However, Sweeney. (2016) showed only an increase of 1.5% global CH4 emissions attributed to natural sources in the Arctic, smaller than the increase estimated from simply using the linear relationship between temperature and CH4 mixing ratios, and further suggested other processes are affecting the long-term CH4 emissions [39]. These results suggest that the mechanisms controlling CH4 are complicated and require further study in a variety of ecosystems to better understand how they change under a warming climate.
3. Data and Methods
3.1. Site Locations
Figure 9 and Table 1 show the observation sites used in this study. The Barrow Observatory (71.32° N, 156.61° W, 3 m A SL), the primary site studied, is located 8 km east of the city of Barrow on the North Slope of Alaska, with an elevation of 3 m above sea-level (ASL). Barrow, Alaska is a small city on the North Slope of Alaska, with ~4000 residents [27]. A substantial amount of oil drilling is done on the North Slope, which includes the Prudhoe Bay oil field, one of the largest in North America. Barrow is surrounded by wetlands that are classified as “permafrost affected”, indicating that permafrost plays a significant role in the formation of the wetlands there [40]. Alert (82.451° N, 62.507° W, 190 m ASL) is a high latitude Arctic site in Northern Canada, remote from local anthropogenic sources, with only 62 inhabitants as of 2016 [28]. Alert is covered with snow almost 10 months of the year, with very sparse arctic vegetation appearing during the brief summer, which limits the influence of warm season wetland emissions. The site is surrounded by hills and plateaus (Hopper and Hart, 1994). Summit, Greenland (72.596, 38.422° W, 3209 m ASL) is a high elevation site on the summit of the Greenland Ice Sheet [41]. Tiksi, Russia (71.64° N, 128.86° E) is an Arctic site at a similar latitude to Barrow, in an area surrounded by permafrost affected wetlands. CH4 venting from sediments in shallow waters in the East Siberian Shelf could be contributing to CH4 [42]. There is also significant oil drilling occurring in Siberia within the Tiksi region [43].
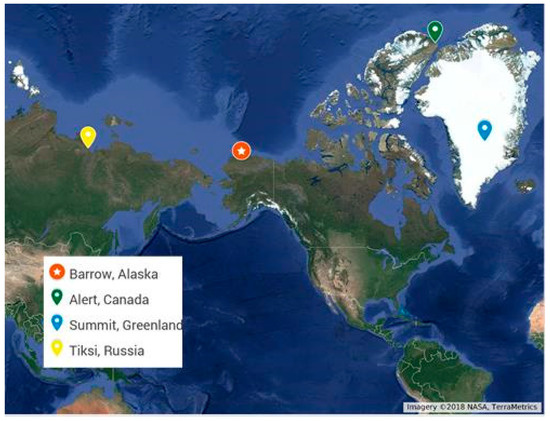
Figure 9.
Locations of observation sites, the red star represents the primary study site. The background image is obtained from Google Earth.
3.2. Data
The atmospheric CH4 and carbon monoxide (CO) data used in this study for Barrow and Alert were from the National Oceanic and Aeronautics Administration’s (NOAA) Earth System Research Laboratory Global Monitoring Division (ESLR), ([44,45], accessed by ftp://aftp.cmdl.noaa.gov/data/trace_gases. The data included monthly averaged data spanning the time period of 1986–2014 that were determined with flask measurements. CH4 and CO were both analyzed at NOAA ESRL in Boulder, Colorado. CH4 was measured using gas chromatography with flame ionization. CO from 1988 to 2008 was analyzed using instruments based on gas chromatography and HgO reduction detection. After 2008, CO fluorescence in the vacuum ultraviolet replaced one of the two gas chromatography on the instrument. Data availability limited time ranges for Summit, Greenland to 1997–2014, and 2011–2017 for Tiksi, Russia. The repeatability of the data was estimated at 2 nmol mol−1 [44].
Meteorological data, including precipitation and temperature, were taken from two sources: NOAA’s National Climatic Data Center (NCDC) [46]. and the Environment and Climate Change Canada [47] Composite mean sea surface pressure distributions between the years of 1992 and 2012 were created using NOAA’s ESRL Seasonal/Monthly Mean Composites [48]
Concentrations of hydroxyl radicals (OH) were estimated using a combination of field measurements [37] and a modeling study [36]. OH concentrations were used to estimate the loss rate of atmospheric CH4 via oxidation by OH radicals (Section 2.4).
3.3. Trajectory Simulations
To determine the influence of atmospheric transport on CH4 concentrations, NOAA’s Hybrid Single Particle Lagrangian Integrated Trajectory (HYSPLIT) Model [49] was used to investigate past trajectories of air masses. Cluster analysis was used to identify the origin and path of air masses reaching Barrow, Alaska for the months of January and July. The meteorological data used to drive HYSPLIT were acquired from the National Centers for Environmental Prediction (NCEP) North American Regional Reanalysis (NARR) with a spatial resolution of 32 × 32 km [50]. Five-day backward trajectories were simulated for each day starting at 12 pm at a height of 500 m above ground level for the period of 1992–2012.
3.4. Rate of Oxidation, Dilution Factor, and Wetland Flux Estimation
The oxidation reaction for atmospheric CH4 is:
The rate of oxidation of CH4 was determined as follows:
where [OH] is the concentration of OH radicals, and [CH4] represents concentrations of CH4 molecules. The concentrations of CH4 and OH were in units of molecules cm−3. K represents a temperature dependent rate constant and is calculated as follows:
where A is a frequency factor of 2.45 × 10⁻¹² s−1, Ea is the activation energy, R is the gas constant with an Ea/R value of 1775 K, and T is the temperature in K. Arrhenius equation values were acquired from NOAA’s Chemical Kinetics and Photochemical Data for Use in Atmospheric Studies [51]
The rate of oxidation was calculated and then converted into moles m−3. The planetary boundary layer (PBL) height was 1.5 km, a median value with a range of 1.1–1.8 km and variations of 30%–40% in Barrow, Alaska, between April and the summer months [52]. A previous study using the Constellation Observing System for the Meteorology, Ionosphere, and Climate (COSMIC) satellite mission found an approximate change of 20% in PBL height between May and July, in St Paul Alaska [53]. As a result, 30%–40% of the changes in CH4 between the winter and summer months can be explained by dilution due to the rise in the PBL in warm seasons, and ~20% between the summer months. Therefore, the dilution factor used in Equation (1) is 0.2.
The wetland fluxes were estimated, based on a long-term average annual cycle, using a mass balance method as follows [54]:
where ∆CH4 represents the seasonal change in CH4 concentrations from the cold to warm season, fdilution is the dilution factor due to change of PBL height and the value of 0.2 was used for May–July and June–July, EAnthrop is the seasonal change in emissions of CH4 from local anthropogenic sources, Transport is the seasonal change in transport of CH4 from other locations, EWetlands are the CH4 emissions from wetlands, and oxidation is the removal of CH4 represented by Equation (1). Ewetlands and oxidation occur in the warm season only.
4. Summary
This study investigated factors affecting Arctic atmospheric CH4 in Barrow, Alaska along with comparison sites in Alert, Canada, Summit, Greenland, and Tiksi, Russia. During the winter, Barrow and Alert see a significant correlation between CO and CH4 concentrations, indicative of anthropogenic influences. Cluster Analysis of backward trajectories during the winter suggested transport of CH4 from the Eurasian Continent and significant contribution from the Prudhoe Bay Oil Field. The amplitude of the annual cycle of CH4 has decreased over time due to increasing summertime annual minimums indicating increasing wetland emissions of CH4. Wetland fluxes between May and July in Barrow and Tiksi were estimated to be 0.005 µg m−2 s−1 and 0.006 µg m−2 s−1, respectively, while fluxes between June and July were 0.011 µg m−2s−1 and 0.014 µg m−2s−1. These fluxes are near the lower end of the range of ones from in situ field measurement studies. Wetland emission fluxes were estimated to be 0.0083 µg m−2s−1 before, 0.0077 µg m−2s−1 during, and 0.0081 µg m−2s−1 after the CH4 growth rate plateau (1998–2006). Although the difference between these three periods is not statistically significant, it indicates that reduced wetland emissions in the Arctic linked to cooler temperature may have played a role in the CH4 plateau during 1998–2006. This hypothesis was supported by a correlation (r = 0.37–0.56, p = 0.05–0.00) between temperature and CH4 over August–November. As the planet continues to warm, global wetlands, including Arctic wetlands, are likely to play a growing role in increasing CH4 concentrations. It has been estimated that global wetland CH4 emissions could increase by 33–60% [55] or as high as 80–110% [56] by the year 2100. However, with the potential decrease of Arctic wetlands due to permafrost loss, CH4 emissions may decrease in the Arctic long term [33]. The complexity of how Arctic wetland emissions of CH4 would respond to a warming climate warrants further study.
Supplementary Materials
The following are available online at https://www.mdpi.com/2073-4433/10/4/187/s1.
Author Contributions
Conceptualization, C.L. and H.M.; Formal Analysis, C.L.; Methodology, H.M.; Writing—original draft, C.L.; Writing—review and editing, H.M.
Funding
We would like to thank the Environmental Science Department of the State University of New York College of Environmental Science and Forestry for sponsoring this study.
Acknowledgments
We would like to thank the State University of New York College of Environmental Science and Forestry (SUNY ESF) for support with this research. We would also like to thank NOAA’s Earth Science Research Laboratory’s Global Monitoring Division for the data they provided that was critical for this research. We would like to thank A. Moore and R. Briggs of SUNY ESF for their advice and mentoring throughout this study and Y. Zhou of SUNY ESF for her assistance with the HYSPLIT Trajectory Analysis. Additionally, we would like to thank Mark Beauharnois of SUNY Albany’s Atmospheric Sciences Research Center for his assistance with the HYLSPIT Individual Trajectory Analysis. We appreciate the input for this paper from E. Dlugokencky and G. Petron of NOAA’s Earth Science Research Laboratory’s Global Monitoring Division for. We would like to thank G. Lawrence of the US Geological Survey with his assistance in editing this paper. We thank the two anonymous reviewers for their constructive comments.
Conflicts of Interest
Declare conflicts of interest or state. The funders had no role in the design of the study; in the collection, analyses, or interpretation of data; in the writing of the manuscript, and in the decision to publish the results.
References
- World Meteorological Organization WMO Greenhouse Gas Bulletin. Available online: https://library.wmo.int/opac/doc_num.php?explnum_id=4022 (accessed on 31 May 2018).
- Dlugokencky, E.J.; Bruhwiler, L.; White, J.W.C.; Emmons, L.K.; Novelli, P.C.; Montzka, S.A.; Masarie, K.A.; Lang, P.M.; Crotwell, A.M.; Miller, J.B.; et al. Observational constraints on recent increases in the atmospheric CH4 burden. Geophys. Res. Lett. 2009, 36. [Google Scholar] [CrossRef]
- Nisbet, E.G.; Dlugokencky, E.J.; Manning, M.R.; Lowry, D.; Fisher, R.E.; France, J.L.; Michel, S.E.; Miller, J.B.; White, J.W.C.; Vaughn, B.; et al. Rising atmospheric methane: 2007–2014 growth and isotopic shift. Glob. Biogeochem. Cycles 2016, 30, 1356–1370. [Google Scholar] [CrossRef]
- Kai, F.M.; Tyler, S.C.; Randerson, J.T.; Blake, D.R. Reduced methane growth rate explained by decreased Northern Hemisphere microbial sources. Nature 2011, 476, 194–197. [Google Scholar] [CrossRef] [PubMed]
- Kirschke, S.; Bousquet, P.; Ciais, P.; Saunois, M.; Canadell, J.G.; Dlugokencky, E.J.; Bergamaschi, P.; Bergmann, D.; Blake, D.R.; Bruhwiler, L.; et al. Three decades of global methane sources and sinks. Nat. Geosci. 2013, 6, 813–823. [Google Scholar] [CrossRef]
- Bloom, A.A.; Palmer, P.I.; Fraser, A.; Reay, D.S.; Frankenberg, C. Large-Scale Controls of Methanogenesis Inferred from Methane and Gravity Spaceborne Data. Science 2010, 327, 322–325. [Google Scholar] [CrossRef] [PubMed]
- Zona, D.; Gioli, B.; Commane, R.; Lindaas, J.; Wofsy, S.C.; Miller, C.E.; Dinardo, S.J.; Dengel, S.; Sweeney, C.; Karion, A.; et al. Cold season emissions dominate the Arctic tundra methane budget. Proc. Natl. Acad. Sci. USA 2016, 113, 40–45. [Google Scholar] [CrossRef] [PubMed]
- Sebacher Daniel, I.; Harriss Robert, C.; Bartlett Karen, B.; Sebacher Shirley, M.; Grice Shirley, S. Atmospheric methane sources: Alaskan tundra bogs, an alpine fen, and a subarctic boreal marsh. Tellus B 1986, 38B, 1–10. [Google Scholar] [CrossRef]
- Wille, C.; Kutzbach, L.; Sachs, T.; Wagner, D.; Pfeiffer, E.-M. Methane emission from Siberian arctic polygonal tundra: Eddy covariance measurements and modeling. Glob. Chang. Biol. 2008, 14, 1395–1408. [Google Scholar] [CrossRef]
- Sayres, D.S.; Dobosy, R.; Healy, C.; Dumas, E.; Kochendorfer, J.; Munster, J.; Wilkerson, J.; Baker, B.; Anderson, J.G. Arctic regional methane fluxes by ecotope as derived using eddy covariance from a low-flying aircraft. Atmos. Chem. Phys. 2017, 17, 8619–8633. [Google Scholar] [CrossRef]
- Fan, S.M.; Wofsy, S.C.; Bakwin, P.S.; Jacob, D.J.; Anderson, S.M.; Kebabian, P.L.; McManus, J.B.; Kolb, C.E.; Fitzjarrald, D.R. Micrometeorological measurements of CH4 and CO2 exchange between the atmosphere and subarctic tundra. J. Geophys. Res. Atmos. 2012, 97, 16627–16643. [Google Scholar] [CrossRef]
- Chang, R.Y.-W.; Miller, C.E.; Dinardo, S.J.; Karion, A.; Sweeney, C.; Daube, B.C.; Henderson, J.M.; Mountain, M.E.; Eluszkiewicz, J.; Miller, J.B.; et al. Methane emissions from Alaska in 2012 from CARVE airborne observations. Proc. Natl. Acad. Sci. USA 2014, 111, 16694–16699. [Google Scholar] [CrossRef] [PubMed]
- Fisher, R.E.; Sriskantharajah, S.; Lowry, D.; Lanoisellé, M.; Fowler, C.M.R.; James, R.H.; Hermansen, O.; Myhre, C.L.; Stohl, A.; Greinert, J.; et al. Arctic methane sources: Isotopic evidence for atmospheric inputs. Geophys. Res. Lett. 2011, 38. [Google Scholar] [CrossRef]
- Zhang, T.; Barry, R.G.; Knowles, K.; Heginbottom, J.A.; Brown, J. Statistics and characteristics of permafrost and ground-ice distribution in the Northern Hemisphere. Polar Geogr. 1999, 23, 132–154. [Google Scholar] [CrossRef]
- Schuur, E.A.G.; McGuire, A.D.; Schädel, C.; Grosse, G.; Harden, J.W.; Hayes, D.J.; Hugelius, G.; Koven, C.D.; Kuhry, P.; Lawrence, D.M.; et al. Climate change and the permafrost carbon feedback. Nature 2015, 520, 171–179. [Google Scholar] [CrossRef] [PubMed]
- Woo, M.; Young, K.L. High Arctic wetlands: Their occurrence, hydrological characteristics and sustainability. J. Hydrol. 2006, 320, 432–450. [Google Scholar] [CrossRef]
- Parmentier, F.-J.W.; Zhang, W.; Mi, Y.; Zhu, X.; van Huissteden, J.; Hayes, D.J.; Zhuang, Q.; Christensen, T.R.; McGuire, A.D. Rising methane emissions from northern wetlands associated with sea ice decline. Geophys. Res. Lett. 2015, 42, 7214–7222. [Google Scholar] [CrossRef] [PubMed]
- Gunsch, M.J.; Kirpes, R.M.; Kolesar, K.R.; Barrett, T.E.; China, S.; Sheesley, R.J.; Laskin, A.; Wiedensohler, A.; Tuch, T.; Pratt, K.A. Contributions of transported Prudhoe Bay oil field emissions to the aerosol population in Utqiaġvik, Alaska. Atmos. Chem. Phys. 2017, 17, 10879–10892. [Google Scholar] [CrossRef]
- Stohl, A. Characteristics of atmospheric transport into the Arctic troposphere. J. Geophys. Res. Atmos. 2006, 111, D11306. [Google Scholar] [CrossRef]
- Law, K.S.; Stohl, A. Arctic Air Pollution: Origins and Impacts. Science 2007, 315, 1537–1540. [Google Scholar] [CrossRef]
- Fiore, A.M.; West, J.J.; Horowitz, L.W.; Naik, V.; Schwarzkopf, M.D. Characterizing the tropospheric ozone response to methane emission controls and the benefits to climate and air quality. J. Geophys. Res. Atmos. 2008, 113, D08307. [Google Scholar] [CrossRef]
- Dlugokencky, E.J.; Masarie, K.A.; Lang, P.M.; Tans, P.P. Continuing decline in the growth rate of the atmospheric methane burden. Nature 1998, 393, 447–450. [Google Scholar] [CrossRef]
- Dlugokencky, E.J.; Houweling, S.; Bruhwiler, L.; Masarie, K.A.; Lang, P.M.; Miller, J.B.; Tans, P.P. Atmospheric methane levels off: Temporary pause or a new steady-state? Geophys. Res. Lett. 2003, 30. [Google Scholar] [CrossRef]
- US EPA. Carbon Monoxide Trends. Available online: https://www.epa.gov/air-trends/carbon-monoxide-trends (accessed on 6 March 2018).
- Canada, E. and C.C. Carbon Monoxide Emissions. Available online: https://www.canada.ca/en/environment-climate-change/services/environmental-indicators/air-pollutant-emissions/carbon-monoxide.html (accessed on 19 June 2018).
- Warwick, N.J.; Cain, M.L.; Fisher, R.; France, J.L.; Lowry, D.; Michel, S.E.; Nisbet, E.G.; Vaughn, B.H.; White, J.W.C.; Pyle, J.A. Using δ13C-CH4 and δD-CH4 to constrain Arctic methane emissions. Atmos. Chem. Phys. 2016, 16, 14891–14908. [Google Scholar] [CrossRef]
- Bureau, U.C. City and Town Population Totals: 2010–2016. Available online: https://www.census.gov/data/tables/2016/demo/popest/total-cities-and-towns.html (accessed on 25 April 2018).
- Government of Canada, S.C. Census Profile, 2016 Census-Baffin, Unorganized, Unorganized [Census Subdivision], Nunavut and Baffin, Region [Census Division], Nunavut. Available online: http://www12.statcan.gc.ca/census-recensement/2016/dp-pd/prof/details/page.cfm?Lang=E&Geo1=CSD&Code1=6204030&Geo2=CD&Code2=6204&Data=Count&SearchText=Baffin&SearchType=Begins&SearchPR=01&B1=All&GeoLevel=PR&GeoCode=6204&TABID=1 (accessed on 30 April 2018).
- Rodionov, S.N.; Bond, N.A.; Overland, J.E. The Aleutian Low, storm tracks, and winter climate variability in the Bering Sea. Deep Sea Res. Part II Top. Stud. Oceanogr. 2007, 54, 2560–2577. [Google Scholar] [CrossRef]
- Barrie, L.A. Arctic air pollution: An overview of current knowledge. Atmos. Environ. (1967) 1986, 20, 643–663. [Google Scholar] [CrossRef]
- United States Environmental Protection Agency. 2014 National Emissions Inventory (NEI) Data. Available online: https://www.epa.gov/air-emissions-inventories/2014-national-emissions-inventory-nei-data (accessed on 14 May 2018).
- Chadburn, S.E.; Burke, E.J.; Cox, P.M.; Friedlingstein, P.; Hugelius, G.; Westermann, S. An observation-based constraint on permafrost loss as a function of global warming. Nat. Clim. Chang. 2017, 7, 340–344. [Google Scholar] [CrossRef]
- Avis, C.A.; Weaver, A.J.; Meissner, K.J. Reduction in areal extent of high-latitude wetlands in response to permafrost thaw. Nat. Geosci. 2011, 4, 444–448. [Google Scholar] [CrossRef]
- Blinova, I.; Chmielewski, F.-M. Climatic warming above the Arctic Circle: Are there trends in timing and length of the thermal growing season in Murmansk Region (Russia) between 1951 and 2012? Int. J. Biometeorol. 2015, 59, 693–705. [Google Scholar] [CrossRef]
- Seidel, D.J.; Ao, C.O.; Li, K. Estimating climatological planetary boundary layer heights from radiosonde observations: Comparison of methods and uncertainty analysis. J. Geophys. Res. Atmos. 2010, 115. [Google Scholar] [CrossRef]
- Spivakovsky, C.M.; Logan, J.A.; Montzka, S.A.; Balkanski, Y.J.; Foreman-Fowler, M.; Jones, D.B.A.; Horowitz, L.W.; Fusco, A.C.; Brenninkmeijer, C.A.M.; Prather, M.J.; et al. Three-dimensional climatological distribution of tropospheric OH: Update and evaluation. J. Geophys. Res. Atmos. 2000, 105, 8931–8980. [Google Scholar] [CrossRef]
- Mauldin, R. OH, MSA, and H2SO4 Meazsurements during OASIS Barrow Field Intensive Spring 2009; Version 1.0.; UCAR/NCAR-Earth Observing Laboratory: Boulder, CO, USA, 2012. [Google Scholar]
- Sturtevant, C.S.; Oechel, W.C.; Zona, D.; Kim, Y.; Emerson, C.E. Soil moisture control over autumn season methane flux, Arctic Coastal Plain of Alaska. Biogeosciences 2012, 9, 1423–1440. [Google Scholar] [CrossRef]
- Sweeney, C.; Dlugokencky, E.; Miller, C.E.; Wofsy, S.; Karion, A.; Dinardo, S.; Chang, R.Y.-W.; Miller, J.B.; Bruhwiler, L.; Crotwell, A.M.; et al. No significant increase in long-term CH4 emissions on North Slope of Alaska despite significant increase in air temperature. Geophys. Res. Lett. 2016, 43, 6604–6611. [Google Scholar] [CrossRef]
- Global Distribution of Wetlands Map|NRCS Soils. Available online: https://www.nrcs.usda.gov/wps/portal/nrcs/detail/soils/use/?cid=nrcs142p2_054021 (accessed on 13 April 2018).
- US Department of Commerce. ESRL Global Monitoring Division-Observation Sites, Summit, Greenland. Available online: https://www.esrl.noaa.gov/gmd/dv/site/site.php?code=SUM (accessed on 4 April 2018).
- Shakhova, N.; Semiletov, I. Methane release and coastal environment in the East Siberian Arctic shelf. J. Mar. Syst. 2007, 66, 227–243. [Google Scholar] [CrossRef]
- Dienes, L. Observations on the Problematic Potential of Russian Oil and the Complexities of Siberia. Eurasian Geogr. Econ. 2004, 45, 319–345. [Google Scholar] [CrossRef]
- Dlugokencky, E.; Lang, P.M.; Crotwell, A.M.; Mund, J.W.; Crotwell, M.J.; Thoning, K.W. Atmospheric Methane Dry Air Mole Fractions from the NOAA ESRL GMD Carbon Cycle Cooperative Global Air Sampling Network 1968–2017; U.S. Department of Commerce: Boulder, CO, USA, 2018; Version: 2018-07-31.
- Petron, G.; Crotwell, A.M.; Lang, P.; Dlugokencky, E.J. Atmospheric Carbon Monoxide Dry Air Mole Fractions from the NOAA ESRL Carbon Cycle Cooperative Global Air Sampling Network, 1988–2017; U.S. Department of Commerce: Boulder, CO, USA, 2018; Version: 2018-07-31.
- National Centers for Environmental Information (NCEI). Formerly Known as National Climatic Data Center (NCDC)|NCEI Offers Access to the Most Significant Archives of Oceanic, Atmospheric, Geophysical and Coastal DATA. Available online: https://www.ncdc.noaa.gov/ (accessed on 21 June 2018).
- Government of Canada. Historical Data-Climate-Environment and Climate Change Canada. Available online: http://climate.weather.gc.ca/historical_data/search_historic_data_e.html (accessed on 23 April 2018).
- US Department of Commerce. ESRL: PSD: Monthly/Seasonal Composites. Available online: https://www.esrl.noaa.gov/psd/cgi-bin/data/composites/printpage.pl?var=Sea%20Level%20Pressure;level=1000mb;mon1=0;mon2=0;iy=;iy=;iy=;iy=;iy=;iy=;iy=;iy=;iy=;iy=;iy=;iy=;iy=;iy=;iy=;iy=;iy=;iy=;iy=;iy=;ipos%5B1%5D=1992;ipos%5B2%5D=2014;ineg%5B1%5D=;ineg%5B2%5D=;timefile0=;tstype=0;timefile1=;value=;typeval=1;compval=1;lag=0;labelc=Black%20and%20white;labels=Contours%20%28black%20and%20white%20only%29;type=1;scale=100;labelcon=1;switch=0;cint=;lowr=;highr=;proj=North%20America;xlat1=60;xlat2=90;xlon1=150;xlon2=270;custproj=Cylindrical%20Equidistant;level1=1000mb;level2=10mb;Submit=Create%20Plot (accessed on 4 April 2018).
- Air Resources Laboratory-HYSPLIT-Hybrid Single Particle Lagrangian Integrated Trajectory Model. Available online: https://ready.arl.noaa.gov/HYSPLIT.php (accessed on 21 June 2018).
- US Department of Commerce. ESRL: PSD: NCEP North American Regional Reanalysis (NARR). Available online: https://www.esrl.noaa.gov/psd/data/gridded/data.narr.html (accessed on 21 June 2018).
- Burkholder, J.B.; Abbatt, J.P.D.; Sander, S.P.; Barker, J.R.; Huie, R.E.; Kolb, C.E.; Kurylo, M.J.; Orkin, V.L.; Wilmouth, D.M.; Wine, P.H. JPL Publication 15-10: Chemical Kinetics and Photochemical Data for Use in Atmospheric Studies; Jet Propulsion Laboratory, National Aeronautics and Space Administration: Pasadena, CA, USA, 2006.
- Hartery, S.; Commane, R.; Lindaas, J.; Sweeney, C.; Henderson, J.; Mountain, M.; Steiner, N.; McDonald, K.; Dinardo, S.J.; Miller, C.E.; et al. Estimating regional-scale methane flux and budgets using CARVE aircraft measurements over Alaska. Atmos. Chem. Phys. 2018, 18, 185–202. [Google Scholar] [CrossRef]
- Chan, K.M.; Wood, R. The seasonal cycle of planetary boundary layer depth determined using COSMIC radio occultation data. J. Geophys. Res. Atmos. 2013, 118, 12422–12434. [Google Scholar] [CrossRef]
- Li, S.-M.; Leithead, A.; Moussa, S.G.; Liggio, J.; Moran, M.D.; Wang, D.; Hayden, K.; Darlington, A.; Gordon, M.; Staebler, R.; et al. Differences between measured and reported volatile organic compound emissions from oil sands facilities in Alberta, Canada. Proc. Natl. Acad. Sci. USA 2017, 114, E3756–E3765. [Google Scholar] [CrossRef]
- Melton, J.R.; Wania, R.; Hodson, E.L.; Poulter, B.; Ringeval, B.; Spahni, R.; Bohn, T.; Avis, C.A.; Beerling, D.J.; Chen, G.; et al. Present state of global wetland extent and wetland methane modelling: Conclusions from a model inter-comparison project (WETCHIMP). Biogeosciences 2013, 10, 753–788. [Google Scholar] [CrossRef]
- Zhang, Z.; Zimmermann, N.E.; Stenke, A.; Li, X.; Hodson, E.L.; Zhu, G.; Huang, C.; Poulter, B. Emerging role of wetland methane emissions in driving 21st century climate change. Proc. Natl. Acad. Sci. USA 2017, 114, 9647–9652. [Google Scholar] [CrossRef]
© 2019 by the authors. Licensee MDPI, Basel, Switzerland. This article is an open access article distributed under the terms and conditions of the Creative Commons Attribution (CC BY) license (http://creativecommons.org/licenses/by/4.0/).