Article

Effects of Anthropogenic Aerosols on a Heavy Rainstorm in Beijing

1
Institute of Urban Meteorology, China Meteorological Administration, Beijing 100089, China
2
Environmental Meteorology Forecast Center of Beijing–Tianjin–Hebei, Beijing 100089, China
3
Key Laboratory of Cloud-Precipitation Physics and Severe Storms, &Center of Disaster Reduction, Institute of Atmospheric Physics, Chinese Academy of Sciences, Beijing 100029, China
4
University of Chinese Academy of Sciences, Beijing 100049, China
*
Authors to whom correspondence should be addressed.
Atmosphere 2019, 10(4), 162; https://doi.org/10.3390/atmos10040162
Submission received: 18 February 2019 / Revised: 15 March 2019 / Accepted: 23 March 2019 / Published: 27 March 2019
(This article belongs to the Section Aerosols)

Abstract

:
A heavy rainstorm occurred in Beijing on 19–20 July 2016. The Weather Research and Forecasting Model coupled with Chemistry (WRF-Chem) was used to investigate the effects of anthropogenic aerosols on precipitation and microphysical processes. Three conditions were simulated by altering the anthropogenic emissions. When the anthropogenic emissions were increased by 10 times, the area-average accumulated rainfall amount and maximum accumulated rainfall amount both decreased. The cloud water mixing ratio increased and the rain mixing ratio decreased. The radii of cloud droplets decreased, and the collision efficiency of cloud water by rain and the autoconversion rate of cloud water into rain were both low. When the anthropogenic emission was 10% of the original emission, the area of accumulated rainfall amounts greater than 25 mm in the Beijing area was 10% larger than those of the other two tests. The collision efficiency and autoconversion rate of cloud water into rain were high for large contact areas and large cloud droplets. The graupel mixing ratio was the largest. Thus, the process of melting of graupel into rain was the largest. In the WRF-Chem model, the aerosols did not participate as ice nuclei (IN) in the ice-phase microphysical processes, and therefore the aerosols could influence only the warm rain processes and mix-phased processes near the freezing level line. For no influence on ice-phase microphysical processes, the snow and ice mixing ratios did not show many differences among the different tests.

1. Introduction

With rapid economic development, the population increases dramatically, and urbanization issues become increasingly prominent. The release of anthropogenic aerosols like sulfate, nitrate, and black carbon is massively increasing, and the air quality is getting worse as a result [1,2,3,4,5,6]. These directly emitted aerosols or those produced through secondary formation can affect the climate both directly [7,8,9,10] and indirectly [11,12,13,14,15,16]. As we know, the process whereby the suspended aerosols in the atmosphere grow into cloud droplets is called aerosol activation. When the atmospheric environment reaches a certain supersaturation ratio, parts of aerosols can be activated into cloud droplets and this aerosol fraction is called cloud condensation nuclei (CCN). The indirect effect refers to that the influence of aerosols on clouds and precipitation as CCN. When the number concentrations of aerosols increase, the number concentrations of CCN and cloud droplets increase correspondingly, and then the average radii of cloud droplets decrease and the cloud albedo increases [17]. Thus, the cloud lifespan changes, and then the precipitation is affected [18,19]. Although there is much research on aerosols, the way aerosols affect clouds and precipitation directly and indirectly keeps a lot of uncertainties [20,21,22]. It varies under different weather conditions and areas, and it has a very complicated mechanism, resulting from the interactions among thermal, dynamic, and microphysical processes [23,24].
A large number of observational tests showed that changes in the number concentrations of aerosols can influence the distributions of clouds and precipitation, but they may have different conclusions [25]. According to the observations, the precipitation was enhanced in severely polluted areas of America, and the nonconvective precipitation induced by anthropogenic aerosols was increased by 30% [26,27]. Lacke et al. [28] found that with the increase in aerosols in Atlanta, the atmospheric instability during the daytime increased, and the mixing layer became shallow, which led to precipitation increase in most areas. Evan et al. [29] indicated that the anthropogenic aerosols in the Arab Sea could weaken the vertical wind shear, making the environment more favorable for the formation of tropical convection. However, the results of other studies are opposite. Rosenfeld et al. [30] analyzed the biomass aerosols burned in Indonesia using the satellite precipitation data. The results showed that an increase in aerosols leads to an increase in cloud droplets and decrease in the collision efficiency between cloud droplets and rain drops. Thus, the warm rain processes decreased. This result is similar to that determined in Xiao et al. [31]. Due to air pollution, the precipitation on the windward slope of a mountain decreased, which was not only caused by the decreased collision efficiency of clouds and rain, but also the decreased riming efficiency between clouds and ice crystals [32,33].
Although the observational data can verify some factors causing changes in precipitation due to aerosols, in most cases, the relationship between aerosols and precipitation remains highly unclear. In recent years, numerical models with higher space and time resolutions became effective measures to reveal the relationship among aerosols, clouds, and precipitation. Yang et al. [34,35] investigated the effects of varing the CCN and giant cloud condensation nuclei (GCCN) concentrations on the microphysical processes of spring hailstorms in a semiarid region of northern China. The researchers found that the variation in aerosol concentrations had significant effects on the cloud microphysical processes, as well as on hail precipitation during hailstorms at the surface. Jiang et al. [36] simulated a typhoon in China using the Weather Research and Forecasting Model coupled with Chemistry (WRF-Chem). The results showed that with changes in anthropogenic aerosols, the formation processes of hydrometeors in the cloud system of the typhoon and the related latent heat changed simultaneously. In the mature stage of a typhoon, the aerosols are not regarded as ice nuclei (IN) based on the Lin microphysical scheme. In the lower layers of the atmosphere over the sea, the increased aerosols could result in a warmer environment. Thus, the convection was stronger and the precipitation increased. Gibbons et al. [37] studied the effects of dust aerosols on precipitation using bin microphysical schemes coupled with the WRF model. The results showed that the increased dust can be regarded as IN. Increased IN could lead to a less precipitation.
In addition to CCN and IN concentrations, aerosols can affect the clouds and precipitation in some other ways. Fan et al. [38] analyzed the effects of the aerosols on deep convective and stratiform clouds in China continent. The effects of aerosols on precipitation were nonlinear in different meteorological and aerosol environments. Ilotoviz and Khain [39] put a new nucleation scheme of cloud droplets in cloud base into the Hebrew University cloud model. Sensitivity tests indicated that the distribution of the droplet spectrum was as important as the number concentration of CCN. CCNs with diameters of less than 0.015 μm were very important for the mixed-phase and ice phase microphysical processes. They can produce additional supercooled liquid droplets above 5-6 km in high CCN concentration condition, and increase the concentration and mass concentration of ice crystals in low CCN concentration condition. The drag effect of aerosols could also lead to the convection enhancement [13,40].
Aerosols also experience a set of chemical reactions during formation. Thus, the exact simulation of aerosols and atmosphere requires a coupled model. WRF-Chem is a typical online atmospheric chemistry model that can precisely describe the relationship between meteorology factors and air pollutants. Northern China is one of the most polluted areas in China (http://www.chinadaily.com.cn/china/2015-02/02/content_19466412.htm). It has received much research attention for pollution issues. However, it remains uncertain how the aerosols affect the formation of precipitation and microphysical processes in this area. Beijing lies in the middle of northern China and is the capital city of China. A heavy rainstorm occurred in Beijing on 19–20 July, 2016. In this paper, the effects of anthropogenic aerosols on precipitation and cloud microphysical processes of this heavy rainstorm will be simulated and analyzed using the WRF-Chem model.
In Section 2, the precipitation event is described. In Section 3, the model setup and experimental design are introduced. In Section 4, the results are analyzed. Finally, the conclusions are provided in Section 5.

2. The Precipitation Event

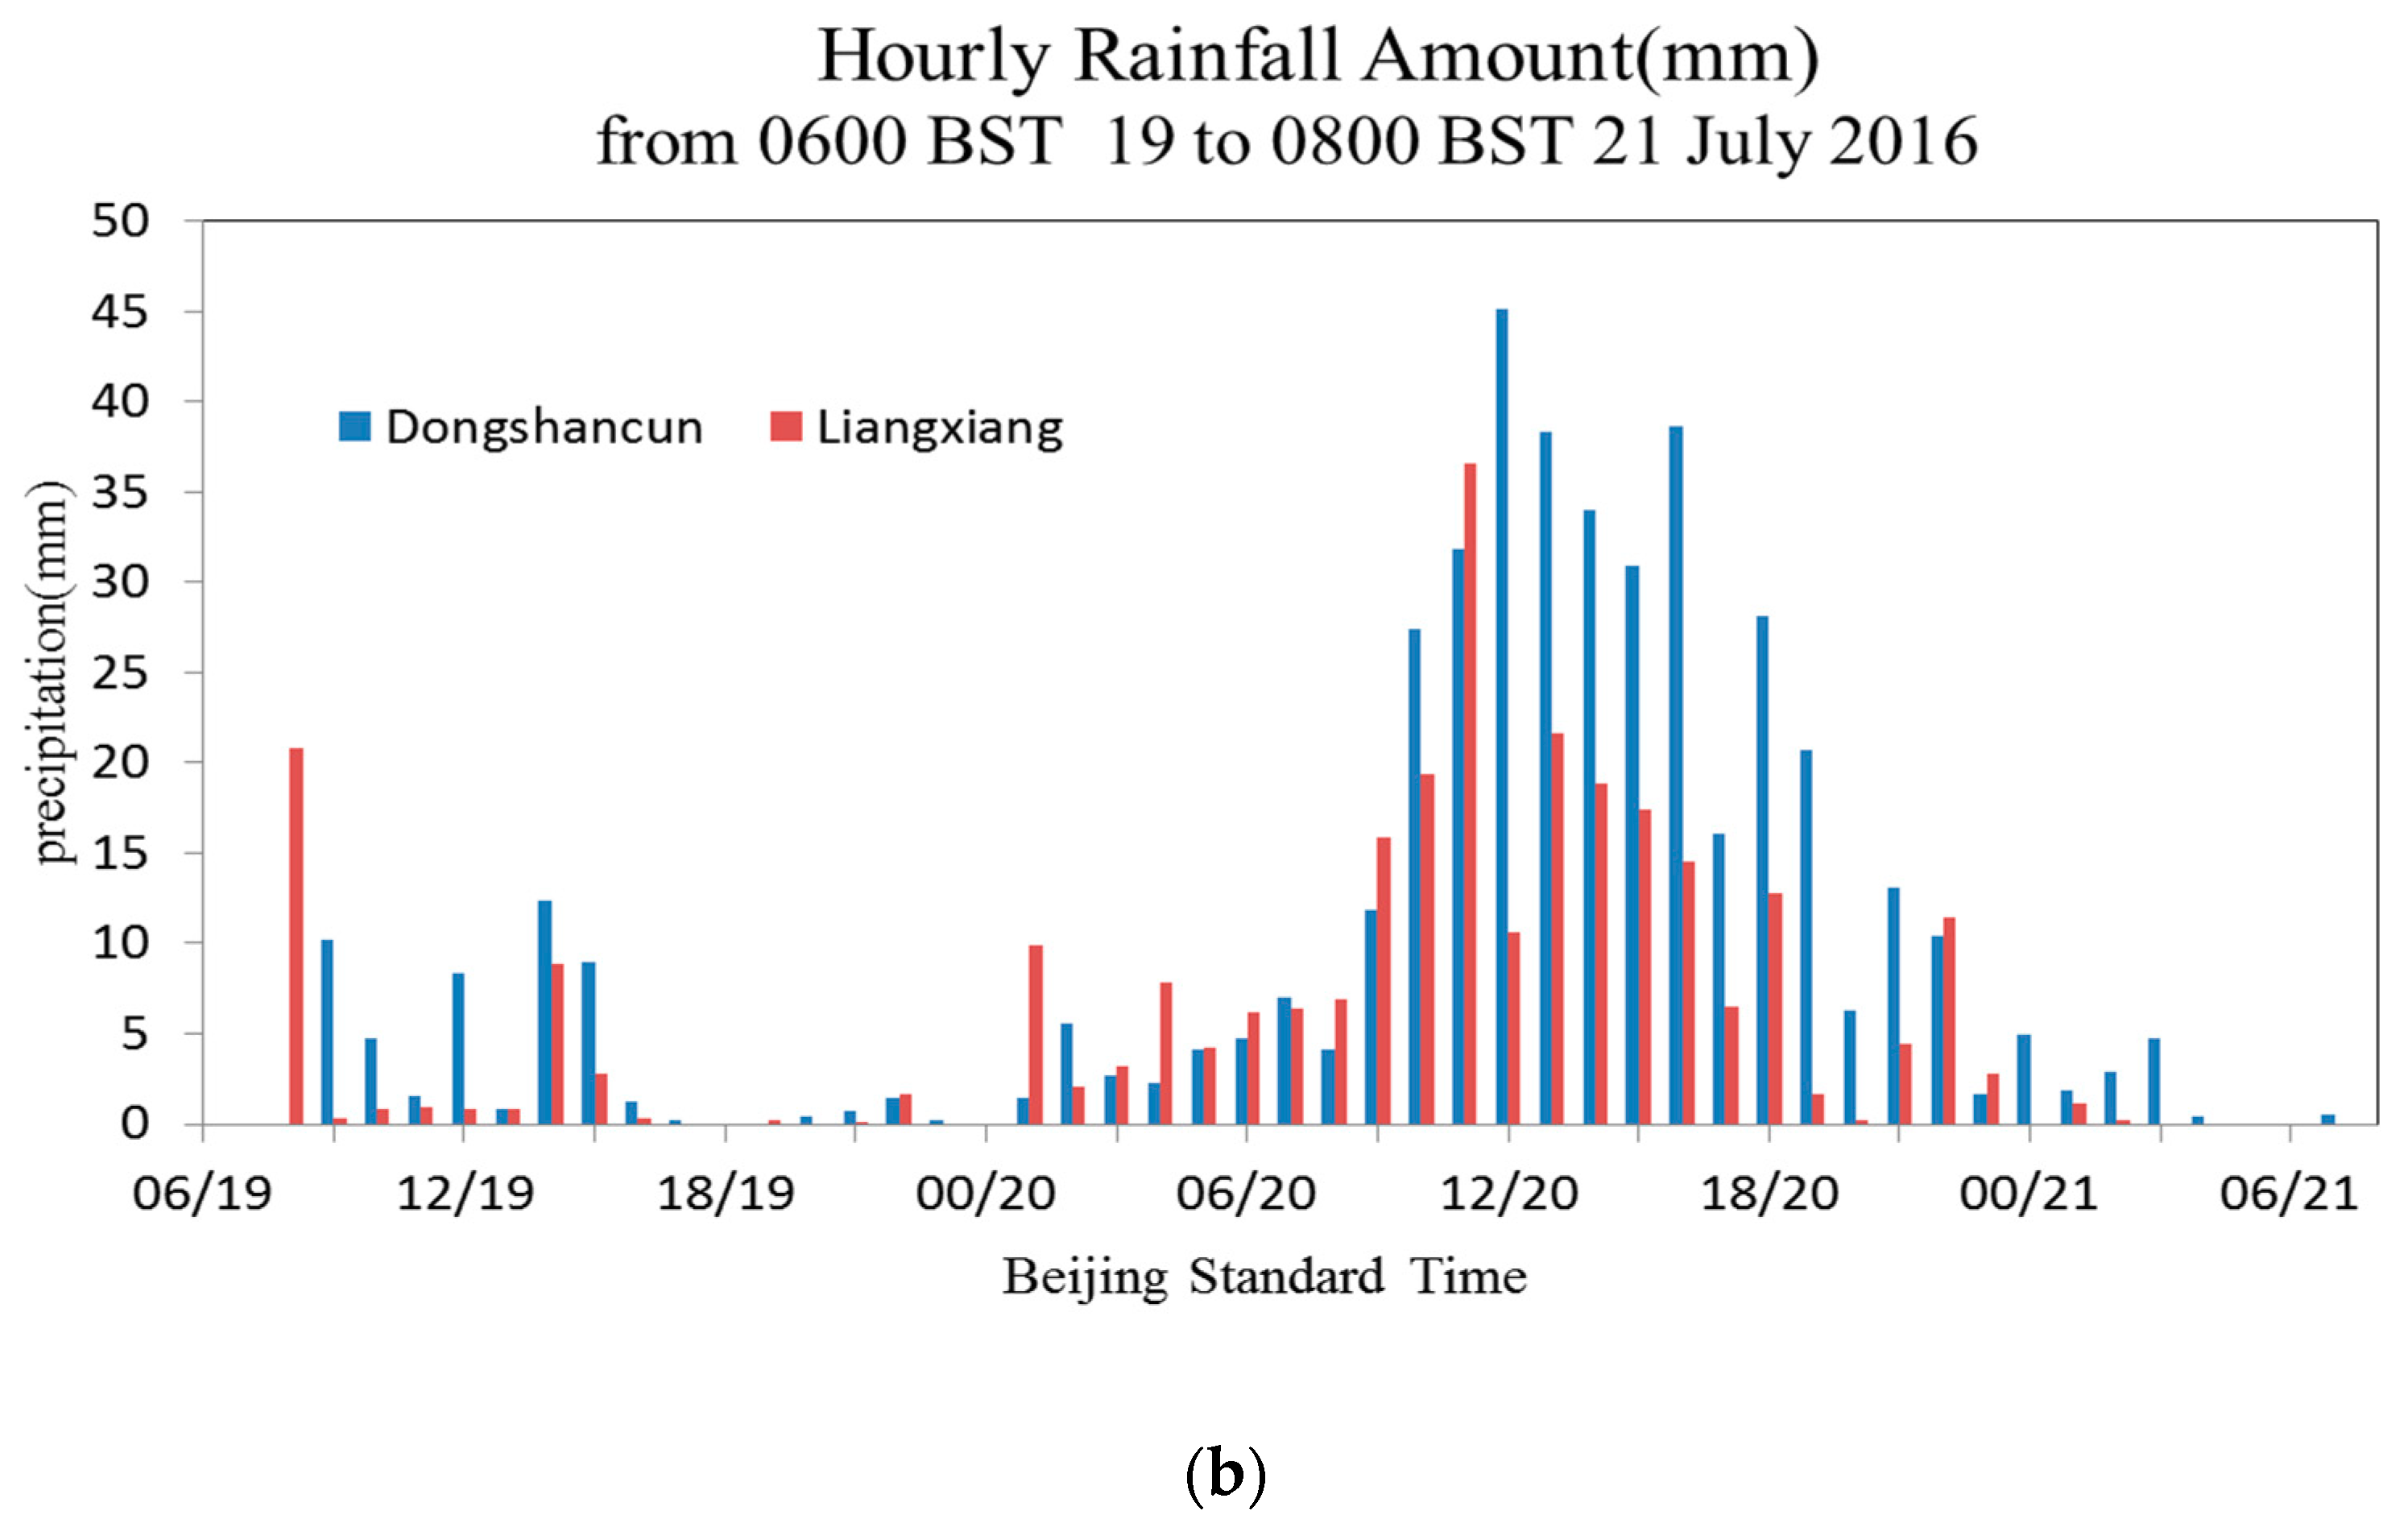
Beijing is located in the North China Plain, with the Taihang Mountains to the west and Yan Mountains to the north. A heavy rainstorm occurred in Beijing on 19–20 July, 2016. The rain lasted for over 55 h. There were 125 stations with accumulated rainfall amounts (ARAs) greater than 250 mm. Among those, four stations had accumulated rainfall amounts greater than 400 mm. The average ARA in the urban area of Beijing was 274 mm and that for all of Beijing city was 212 mm. A maximum ARA of 453.7 mm was observed at Dongshancun in the Mentougou District (Figure 1). The rainfall event was characterized by a wide range, great rainfall amount, and long duration. The rainfall process can be divided into two phases. On 19 July, there was less precipitation. The main precipitation time period occurred on 20 July, with a large rainfall amount.
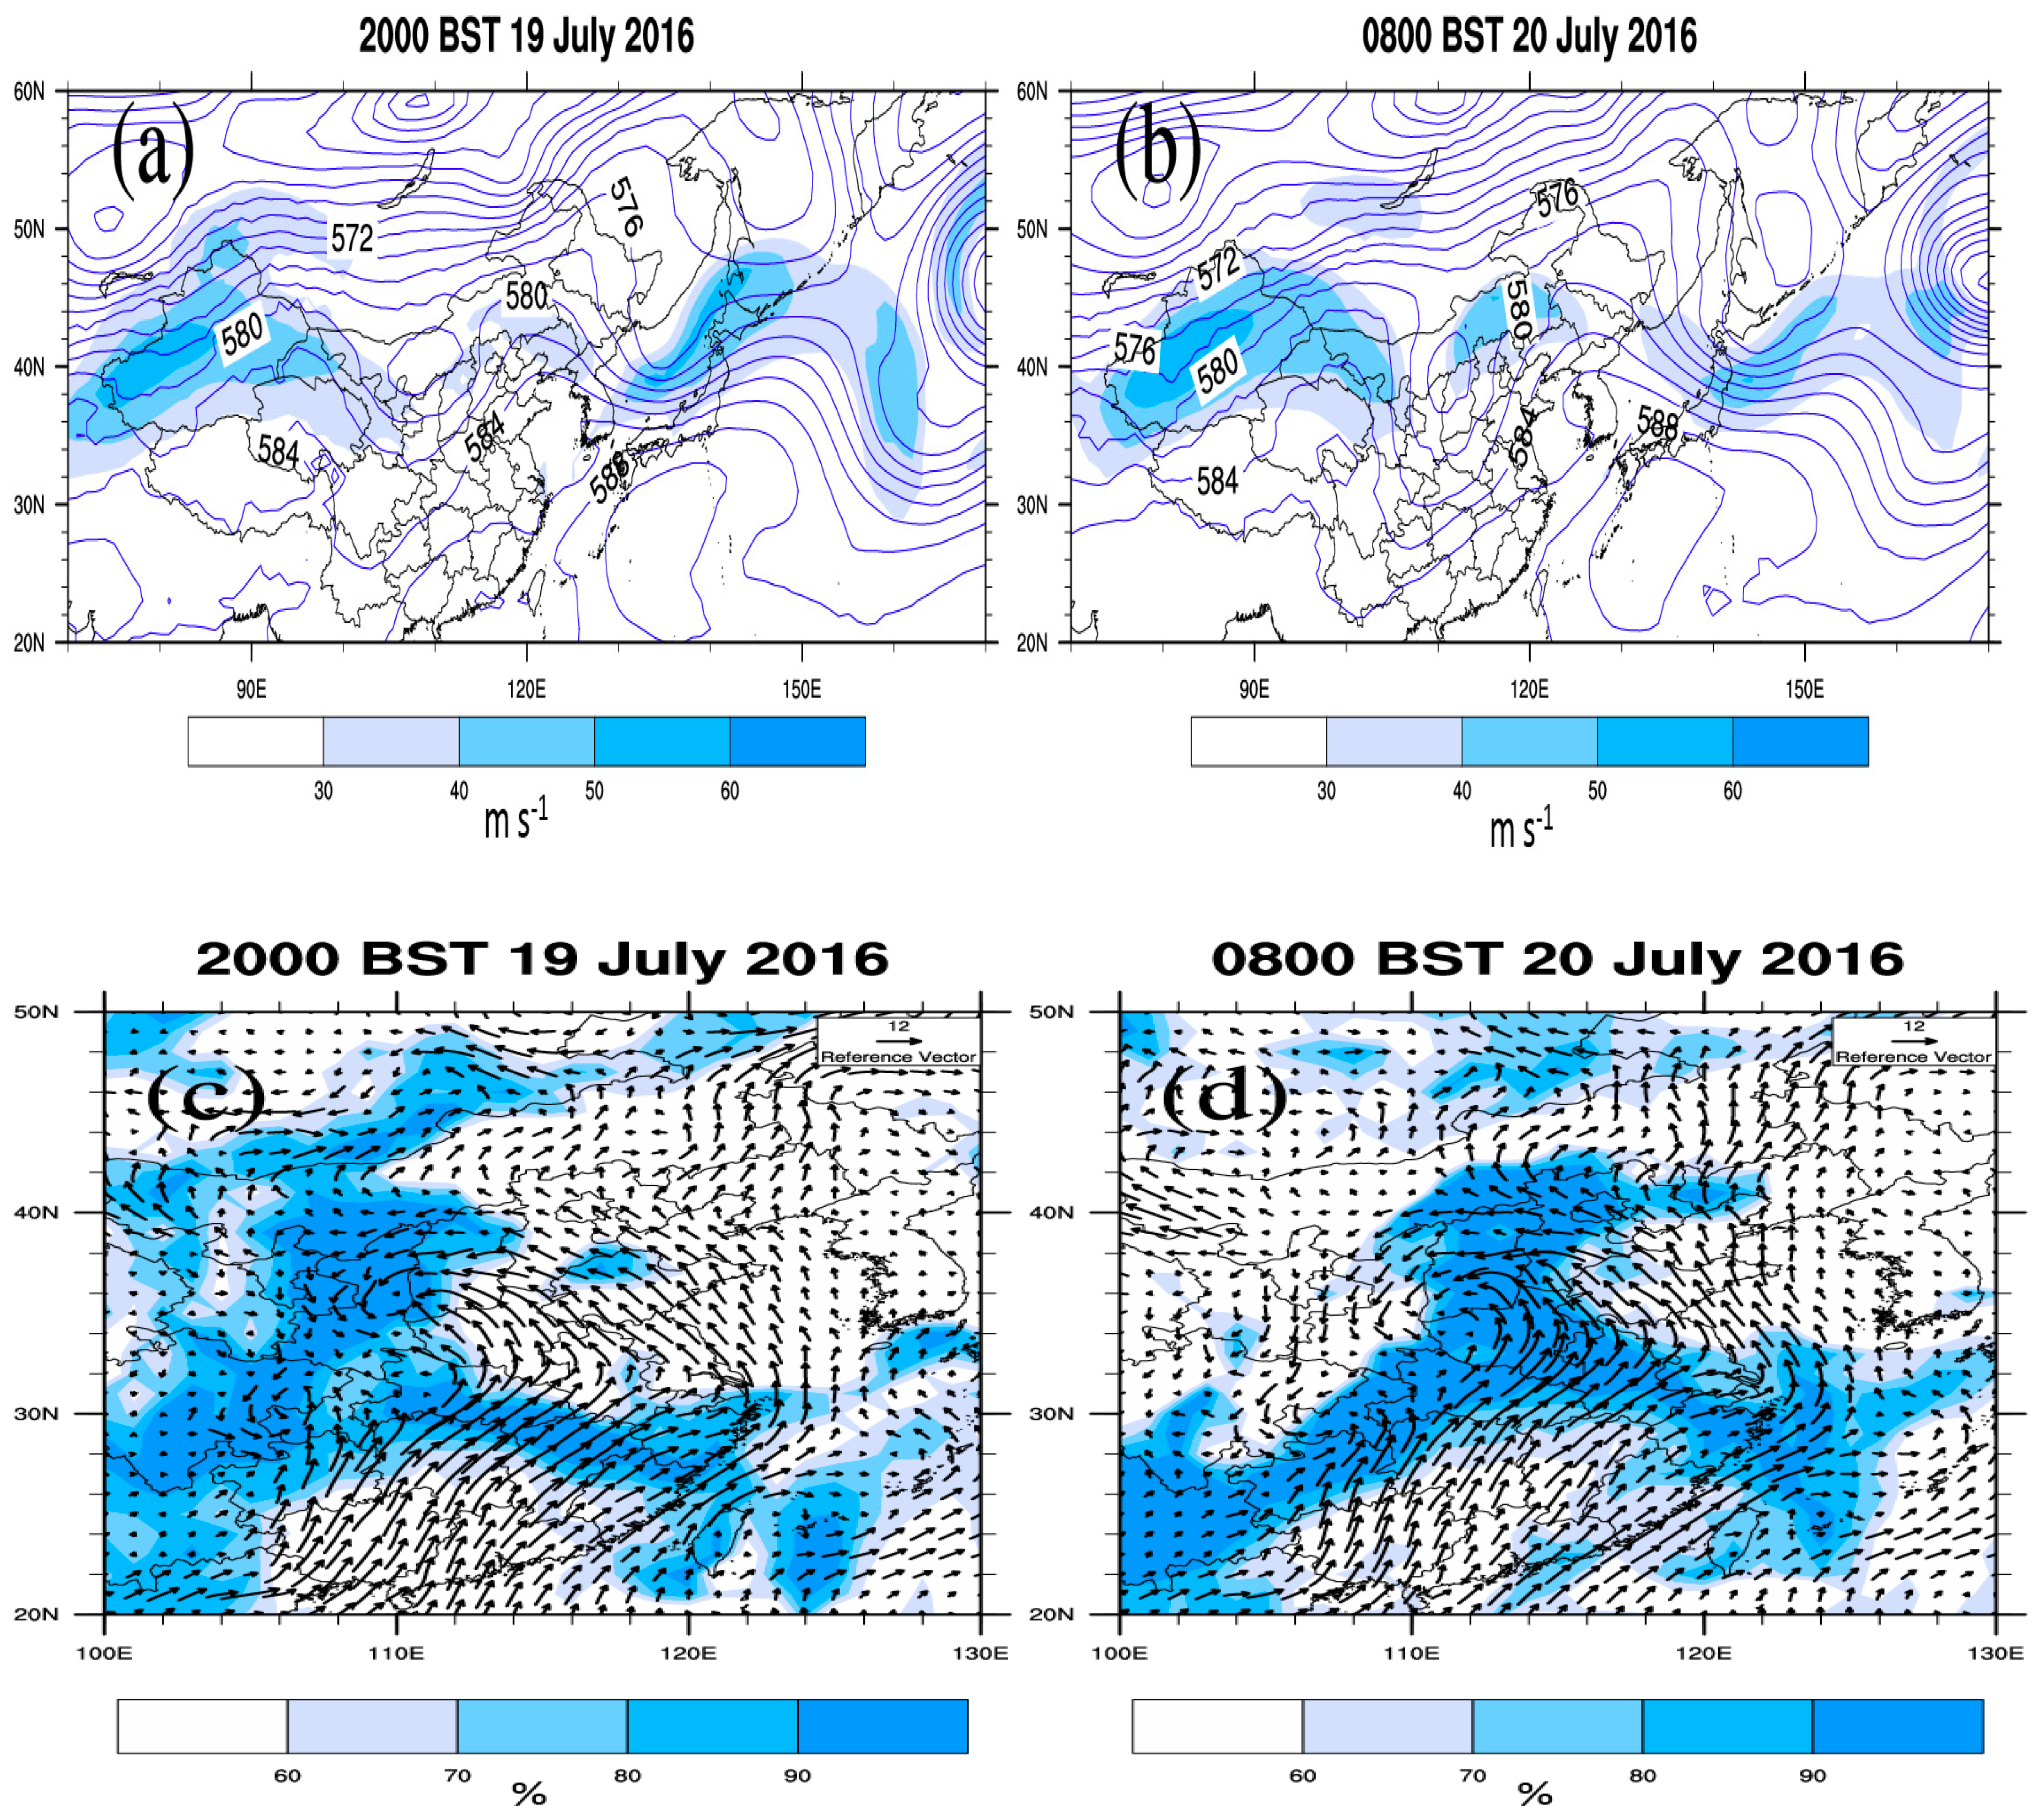
Wu [41] noted that in the right exit and left entrance of the upper-level jet stream, it is convergent with negative vorticity advection. And in the left exit and right entrance of the upper-level jet stream, it is divergent with positive vorticity advection. Thus, warm air is rising and cold air is sinking at the entrance of the upper-level jet stream, and cold air is rising and warm air is sinking at the exit. There was not an evident upper-level jet stream at the 200 hPa level at 2000 BST (Beijing Standard Time) on 19 July 2016. However, at 0800 BST on 20 July, Beijing was in the right entrance of the upper-level jet stream, and there was clear upward movement, which was favorable for the development of the precipitation system. There was a strong and deep cold vortex north of Lake Baikal (approximately 110° E, 55° N) at the 500 hPa level. The cold air carried by the westerly trough spread south along the northwest wind in the front of the high-pressure ridge, enabling continuous vortex development near the Hetao region during the eastward movement process. The subtropical high moved westward and northward, stopping the eastward movement of the vortex. This movement strengthened the vortex development (Figure 2a,b). Based on the relative humidity at the 700 hPa level at 2000 BST on 19 July, Beijing and Hebei Province were covered by low humidity (Figure 2c). At 0800 on 20 July, the water vapor from the Bay of Bengal was transported to North China by the southwesterly jet stream, enriching this area in water vapor, which was favorable for precipitation (Figure 2d).

3. Model Setup and Experimental Design

3.1. Model Setup

In this paper, the meso-scale atmospheric chemistry model WRF-Chem 3.8.1 was used. This model covers comprehensive physical and chemical processes. Physical processes include advection and convection transport of air pollutants, turbulent diffusion, dry and wet deposition and radiation transfer. Chemical processes include wildfire and anthropogenic emission, multiphase chemistry, and aerosol chemistry. This model can reflect the coupling and feedback of atmospheric dynamics, radiation and chemical processes. The experiments were initialized at 2000 BST on 18 July 2016 and integrated for 60 h, with the first 12 h treated as the spin-up time. The horizontal resolution was 3 km with a grid of 320 × 350. The domain covered most areas of North China. The model top was at 50 hPa, and 30 sigma layers were used in the vertical direction. There were 13 levels under 1500 m. The initial and boundary conditions were interpolated from NCEP reanalysis data with a 1° × 1° spatial resolution and 6 h temporal resolution. The Yonsei University (YSU) planetary boundary layer scheme [42], Rapid Radiative Transfer Model with GCM applications (RRTMG) shortwave and longwave radiation schemes [43], Unified Noah land surface scheme [44] and Morrison two-moment microphysics scheme [45] were employed. No convection scheme was used. The Morrison scheme is a double-moment microphysical scheme. When this scheme is coupled with the chemistry module, the CCN number concentration can be calculated. There are five kinds of hydrometeors in this scheme: Cloud water, rain, graupel, snow, and ice crystals. To better understand the microphysical processes occurring in this rainstorm, we improved the WRF model and added the output of the conversion amounts of all 41 cloud microphysical processes. Thus, the evaporation, condensation, melting, sublimation, coagulation, and autoconversion processes can be easily analyzed. The Carbon Bond Mechanism version Z (CBMZ) photochemical mechanism gas-phase chemical scheme [46] and Fast-J photolysis scheme [47] were used. The aerosol scheme was the Model for Simulating Aerosol Interactions and Chemistry scheme (MOSAIC). This scheme is a new one in the WRF-Chem model. The aerosols can be divided into four or eight bins according to the size distribution, and SO42−, NH4+, NO3-, and black carbon can be simulated simultaneously. The configuration can be found in Table 1.
The main factor limiting the simulation results of the air quality model is the emission source uncertainty. Tsinghua University focused on the formulation and research of emission sources in China for many years. In this study, we used the emission inventory released in 2012 by Tsinghua University. This inventory included the emissions of SO2, NO2, TSP, PM10, PM2.5, VOCS, NH3, CO, organic carbon, and black carbon, and the inventory had a horizontal resolution of 0.1° × 0.1°.

3.2. Experimental Design

To study the effects of aerosols on precipitation, three tests were designed by controlling the concentrations of anthropogenic aerosols. In the control (CTL) test, the emission inventory was the original inventory. In the clean test, the emission of anthropogenic aerosols was only 10% of that in the CTL test. In the polluted test, the emission of anthropogenic aerosols was 10 times that in the CTL test. All the other settings in the three tests were the same except the emission of anthropogenic aerosols.

4. Results Analyses

4.1. Comparison of PM2.5 Concentrations

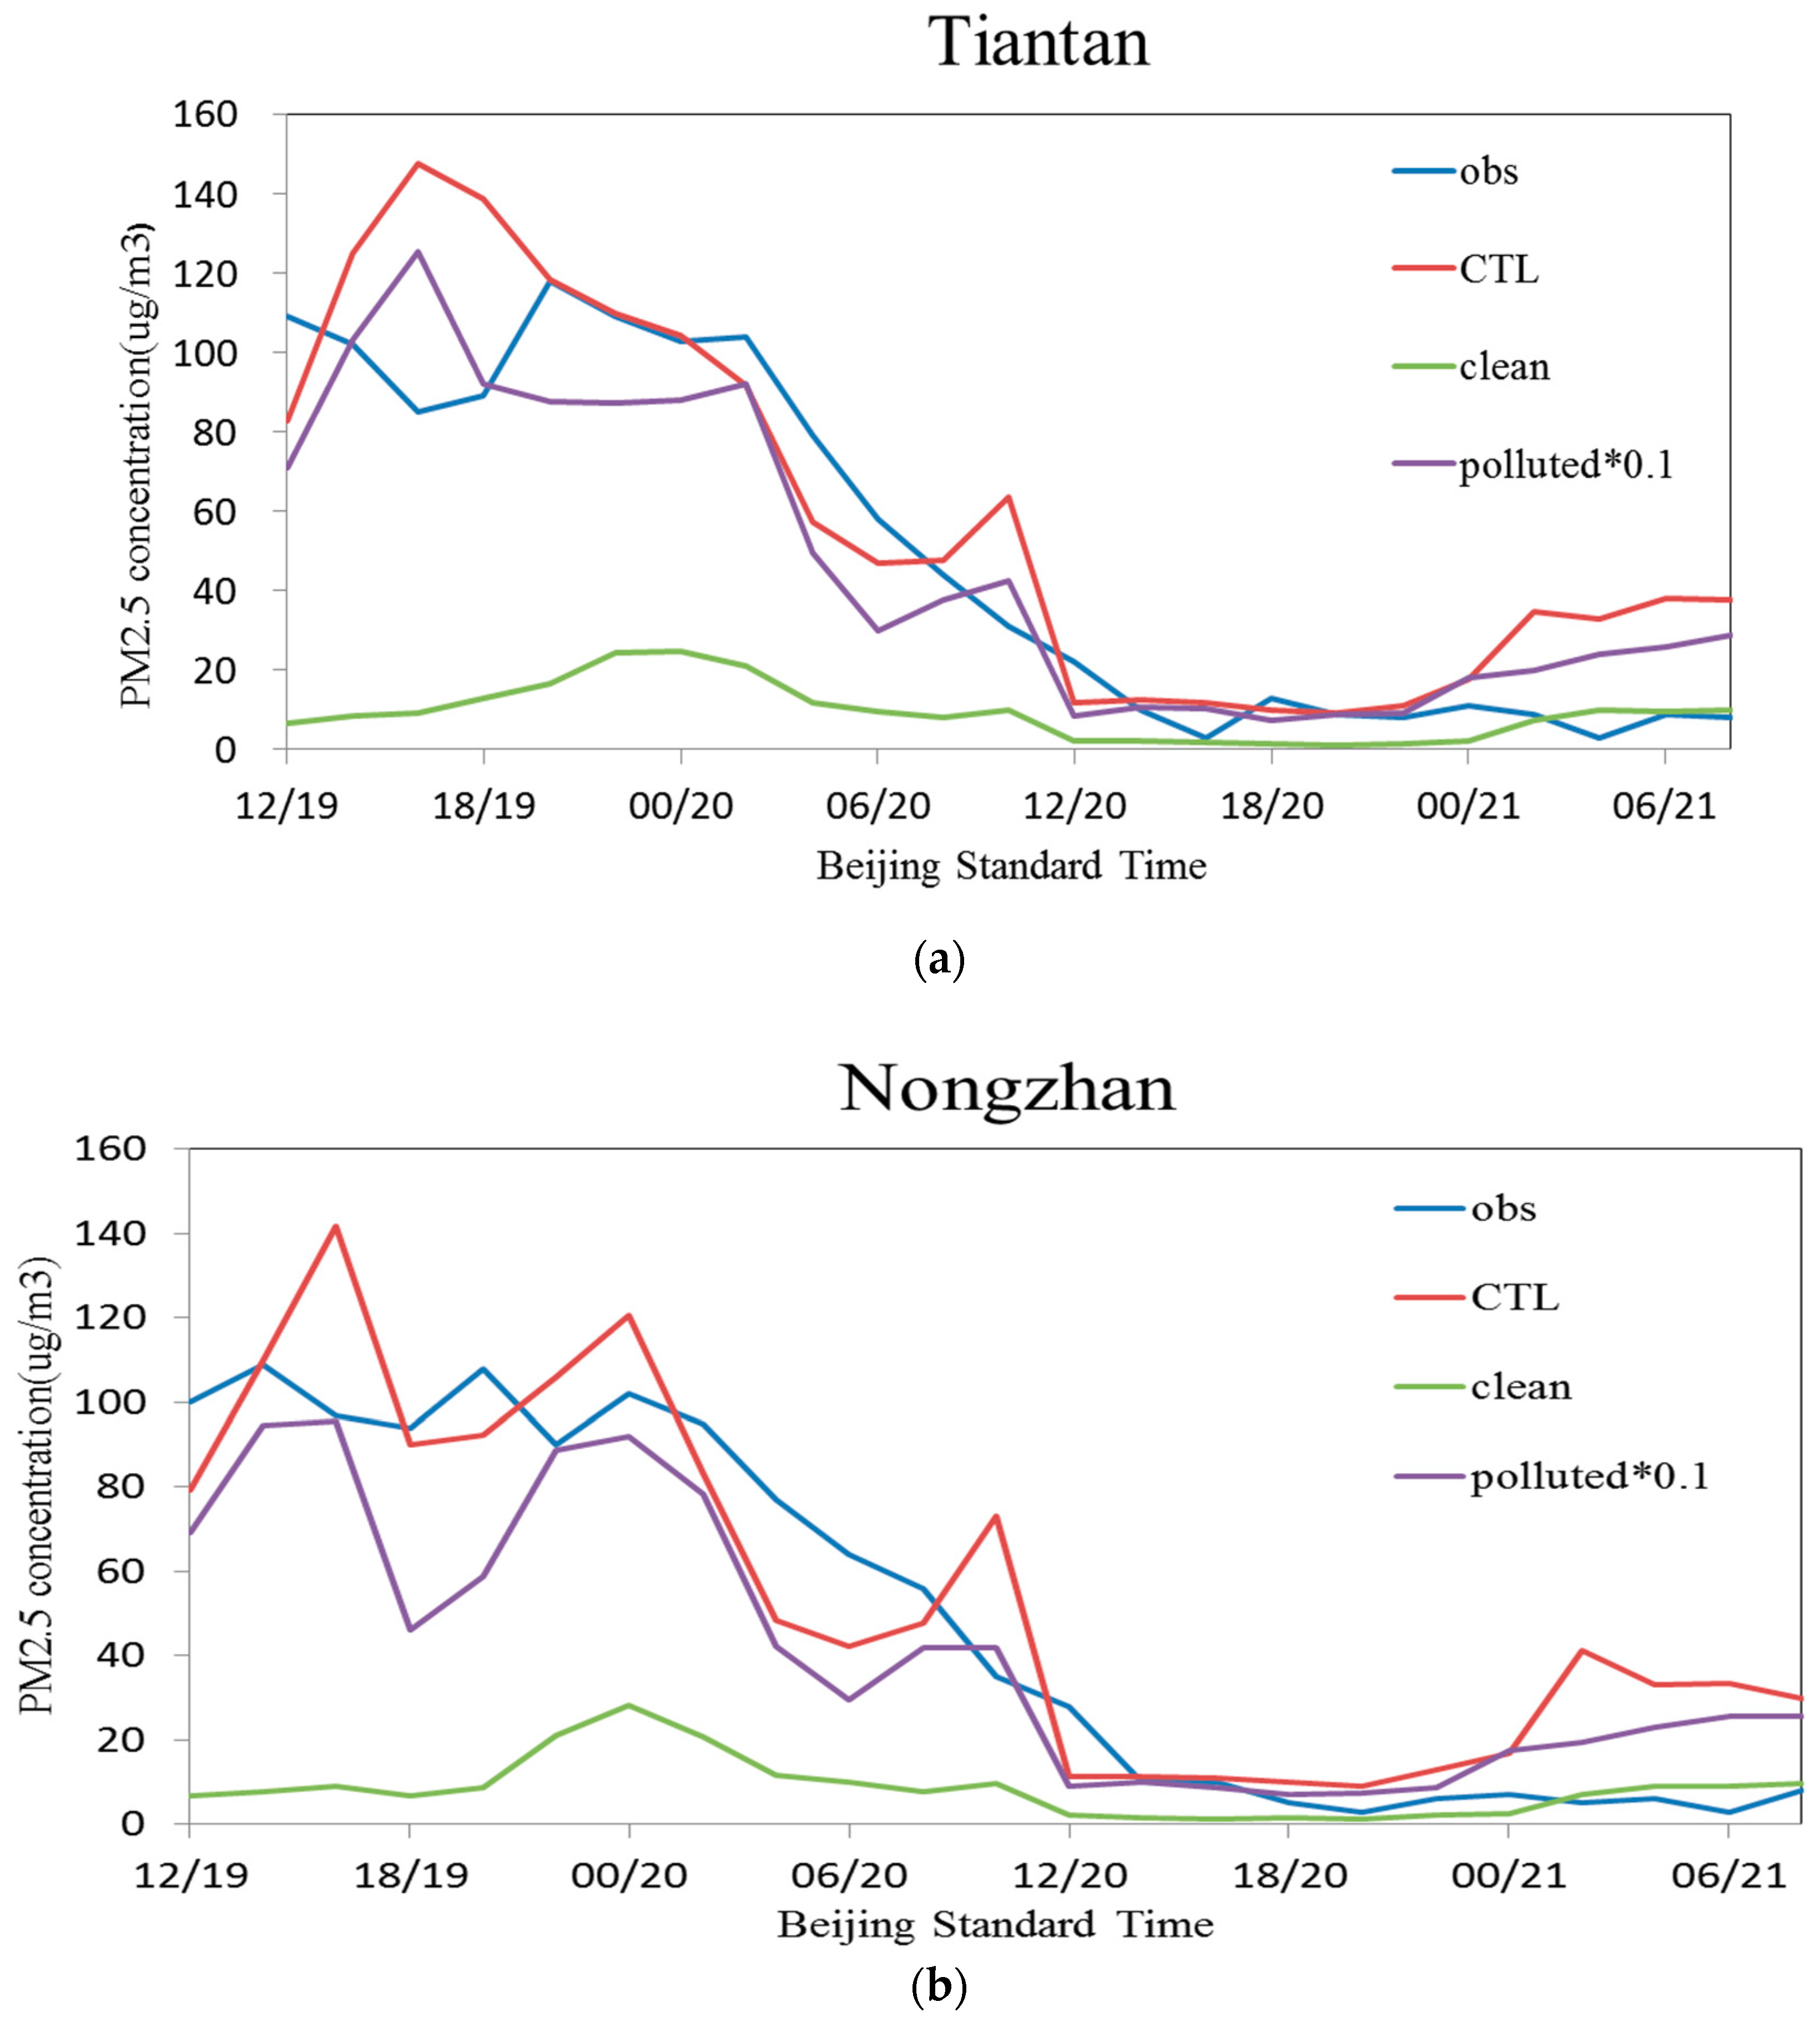
Figure 3 shows the monitored (observed by instrument) and simulated concentrations of PM2.5 at the Tiantan (116.41° E, 39.88° N, urban, south part of Beijing) and Nongzhan (116.46° E, 39.94° N, urban, east part of Beijing) stations in Beijing in all three tests. The PM2.5 concentrations were large on 19 July in the three tests. Then, with the beginning of the precipitation, the PM2.5 concentrations decreased slowly. After the main rainfall occurred, the PM2.5 concentrations decreased significantly, with the values tending to be stable after the maximum rainfall amount appeared at 1200 BST on 20 July. The PM2.5 concentrations in the CTL test were close to those of the observations, which in the polluted test were about 10 times that in the CTL test, and the concentration in the clean test was very low with a maximum of less than 30 μg m−3. The maximum PM2.5 concentration appeared at 1600 BST on 19 July in the CTL and polluted tests, at 2000 BST on 19 July in the observation, and at 0000 BST on 20 July in the clean test, respectively. The maximum PM2.5 concentrations at Tiantan station were 120 μg m−3, 140 μg m−3, 30 μg m−3, and over 1000 μg m−3 in the observation, CTL, clean test, and polluted test, respectively. The results at Nongzhan station were similar to those at Tiantan station. The PM2.5 concentration in the CTL test was close to that of the observation, which indicated that the simulated results were very reliable.

4.2. Effects of Aerosols on Precipitation

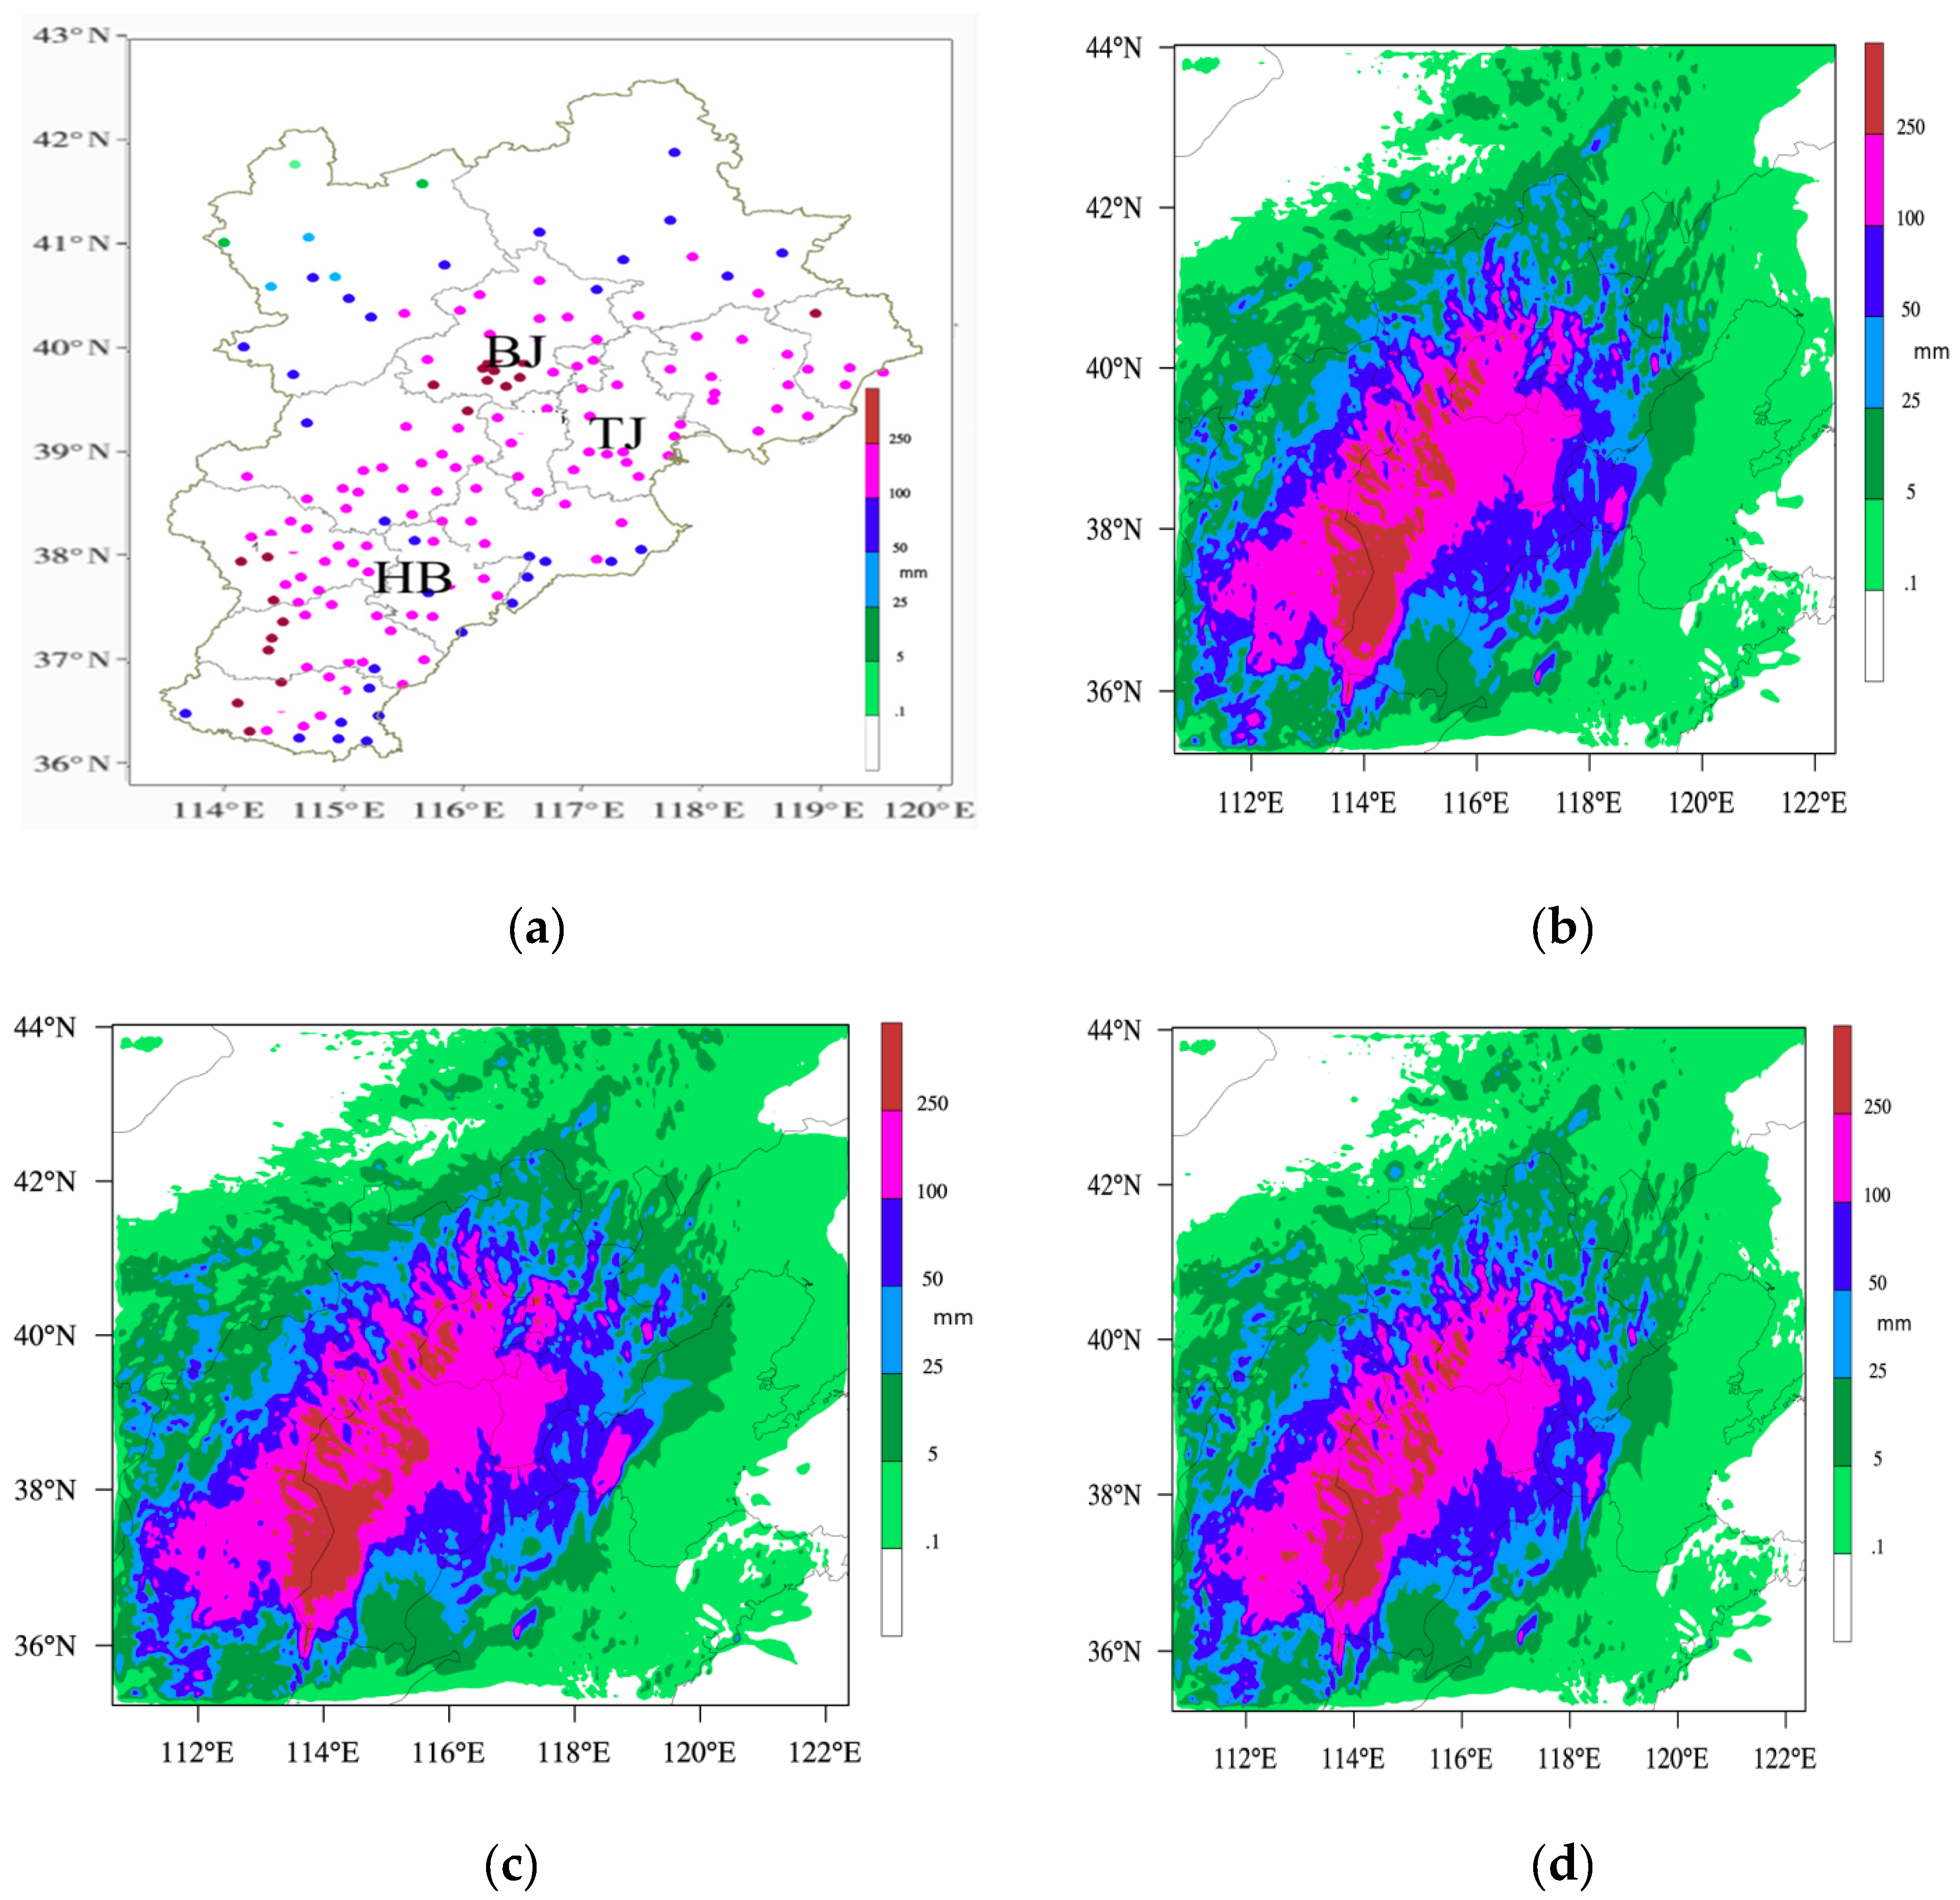
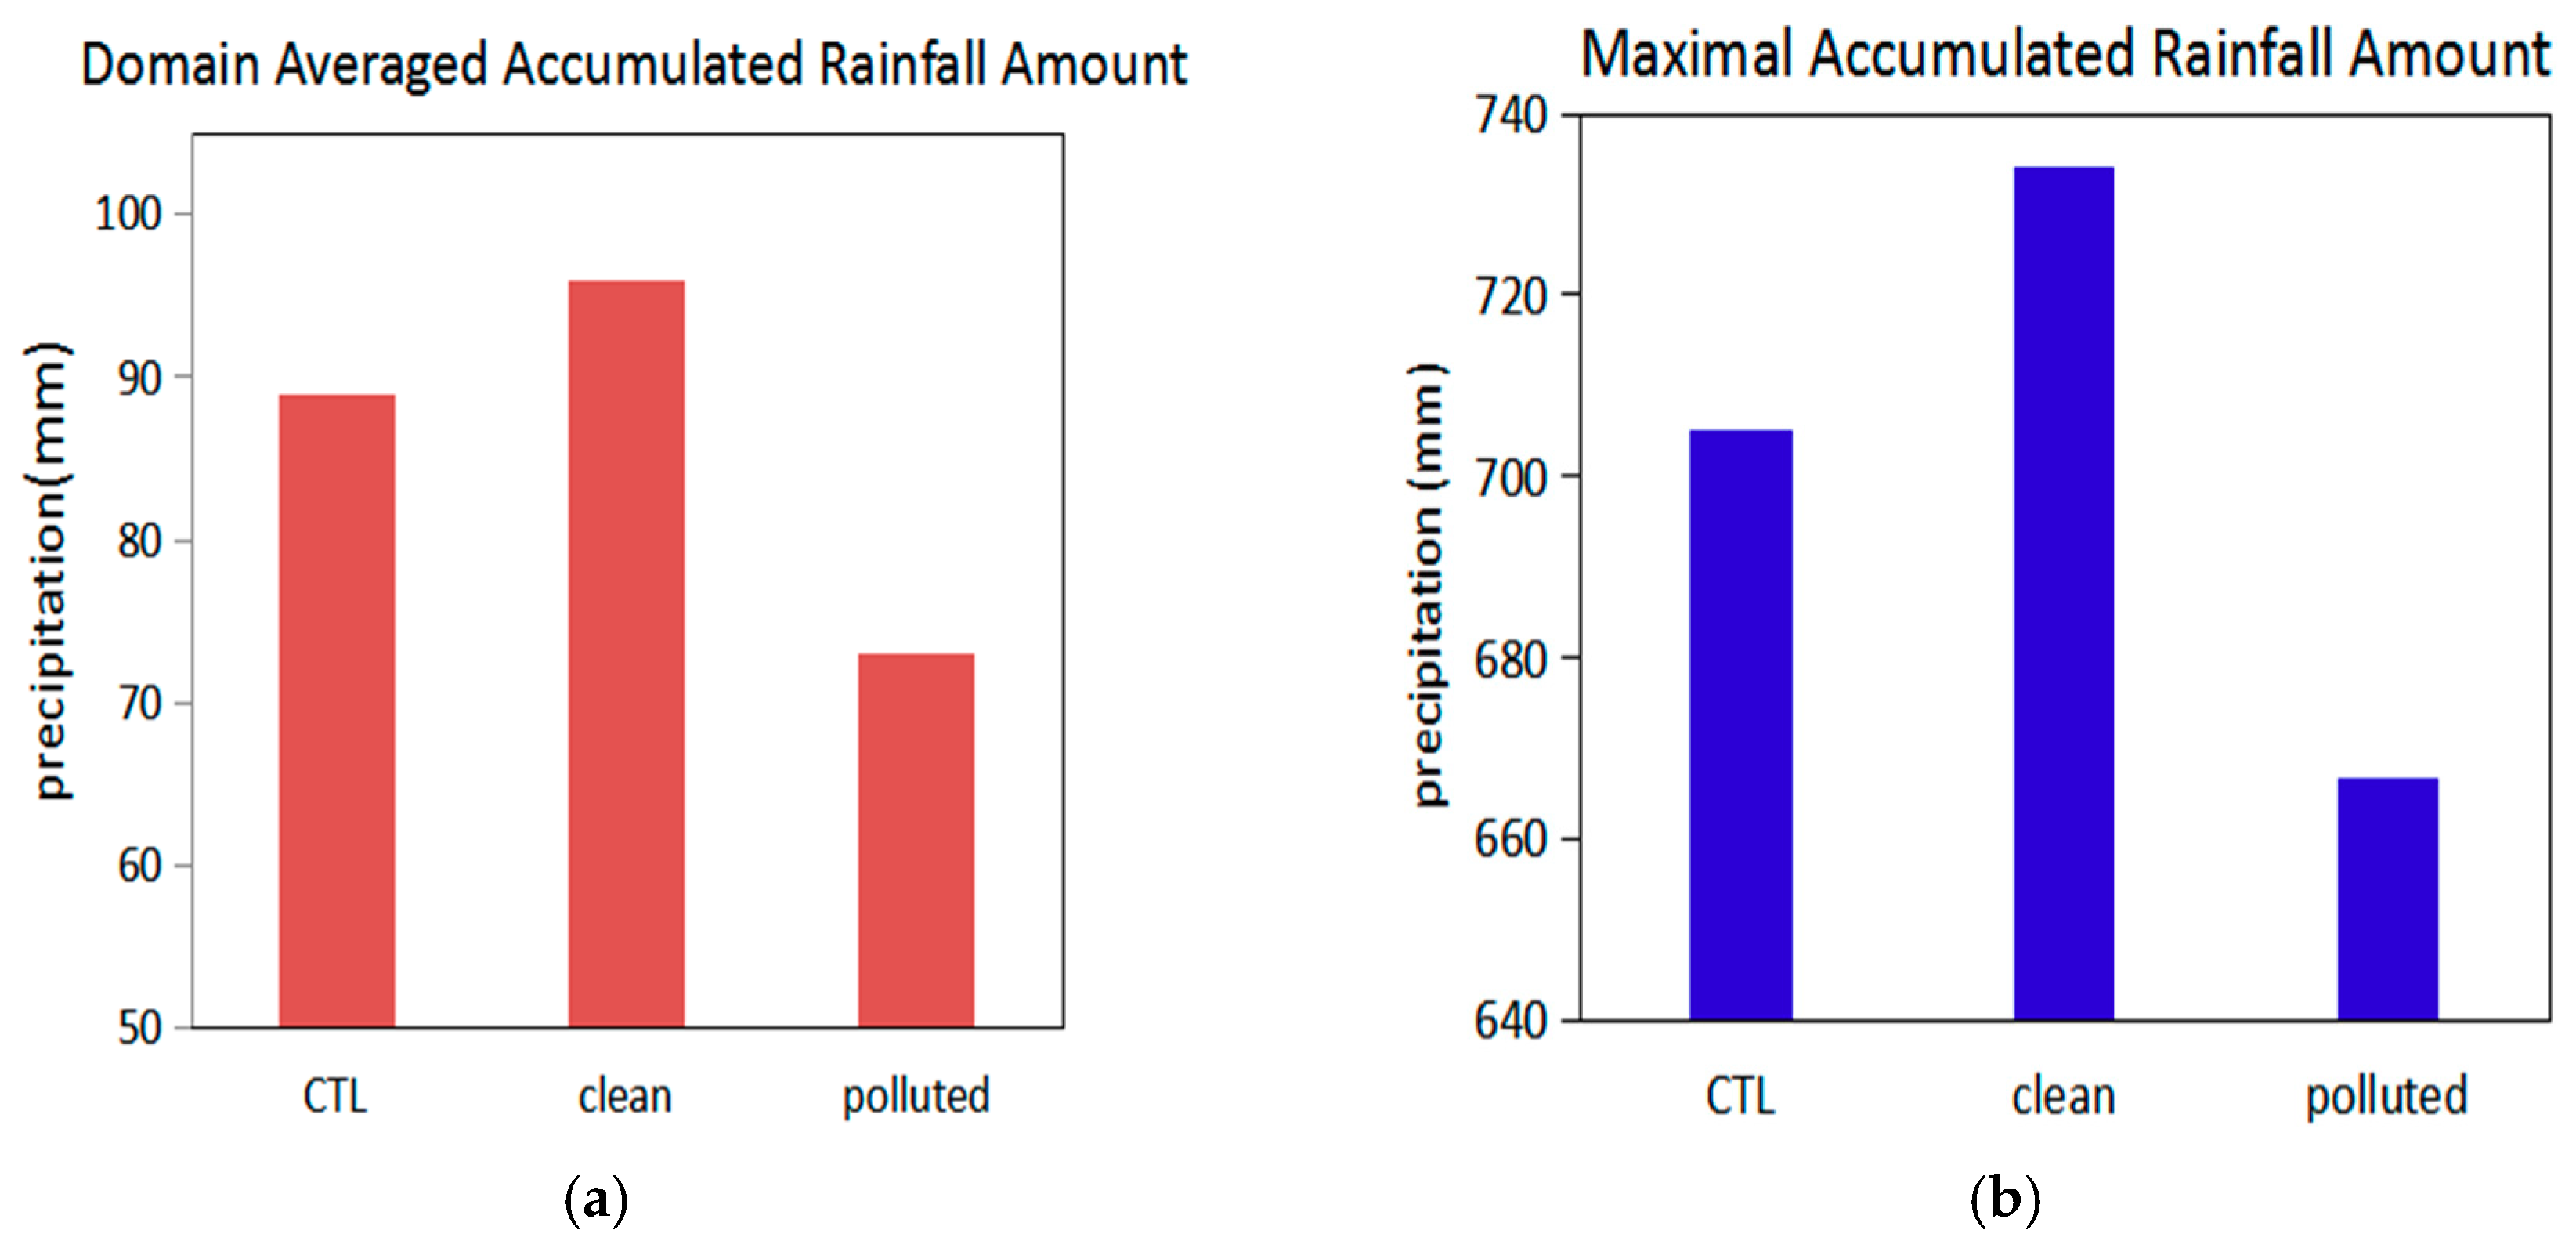
Figure 4 shows the ARAs in observation and the three tests from 0600 BST on 19 July to 0800 BST on 21 July 2016. The maximum accumulated rainfall amount was centered on the southwest part of Beijing and southern Hebei Province. The areas with an accumulated rainfall amount of greater than 250 mm in Beijing area (115.4° E–117.6° E, 39.4° N–41.1° N) in the three tests were located west of the observational area, and the ARAs in the middle and southern Hebei Province were greater than those of the observation. Generally, the ARAs in the three tests were similar to that of the observation. According to the calculation, the average ARAs in the CTL, clean and polluted tests were 89 mm, 96 mm and 81 mm respectively. The average ARAs in the clean and polluted tests were 7 mm greater and 8 mm smaller than that in the CTL test, respectively, which is an increase of 8% and decrease of 9%, respectively (Figure 5a). The maximum ARAs in Beijing were 705 mm, 734 mm, and 666.7 mm in the CTL, clean test, and polluted test, respectively (Figure 5b). The maximum ARAs in the clean and polluted tests were 4% greater and 5.4% smaller, respectively, than that in the CTL test. The area where the ARA was 0.01–25 mm accounted for 31.2% and 31.8% of the total area in Beijing in the CTL and polluted tests, respectively, but accounted for only 22.1% of the total area in the clean test. Simultaneously, the area where ARAs were 25–50 mm, 50–100 mm, 100–250 mm, and greater than 250 mm accounted for less of the total area of Beijing in the CTL and polluted tests than that in the clean test (Table 2).

4.3. Effects of Aerosols on Microphysical Processes

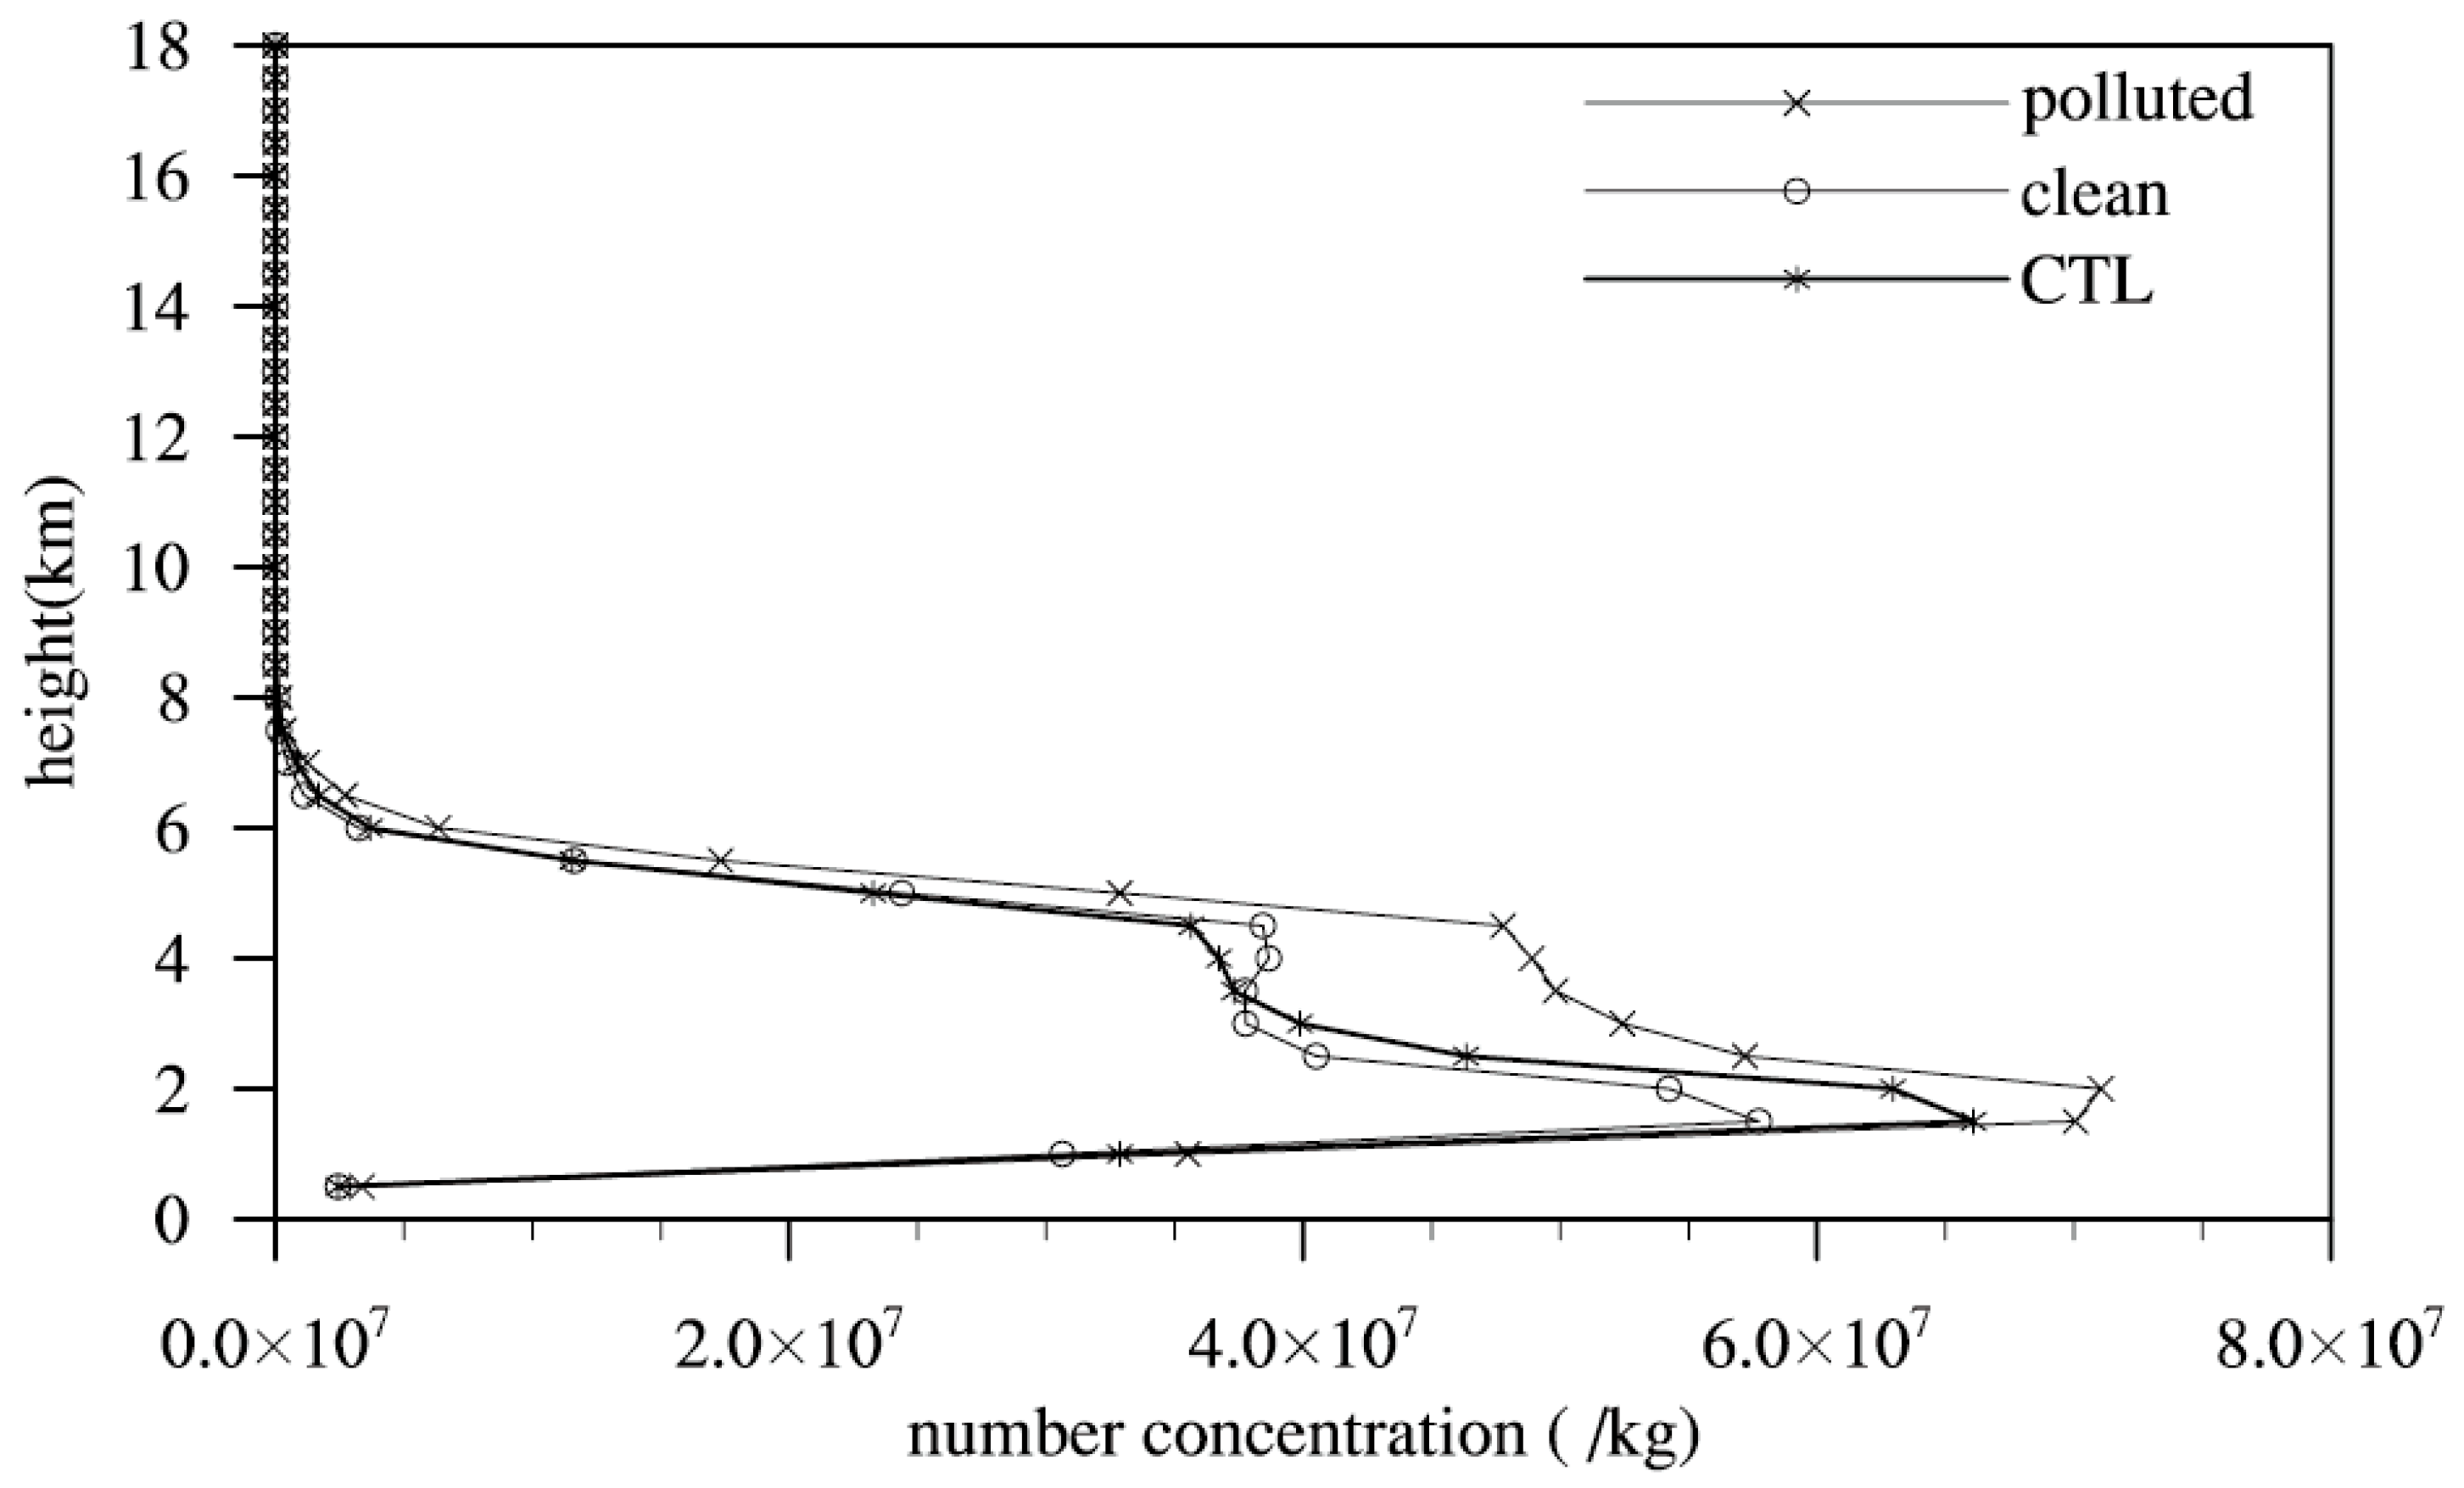
The variation in the concentration of air pollutants can affect the aerosol formation. When the concentrations of air pollutants are high, the CCN number concentrations are high. Thus, the number concentrations of cloud droplets are high, and the corresponding diameters of cloud droplets decrease. Figure 6 shows the time and area-average number concentration variation in cloud droplets with height in the Beijing area in all three tests. Cloud droplets appeared below the height of 8 km, with the maximum appearing at the height of 2 km in all three tests. There were not many differences in the number concentrations of cloud droplets below 2 km and over 4 km in the three tests. In the CTL test, the maximum number concentration of cloud droplets was 67,000 kg−1. In the clean test, the maximum number concentration of cloud droplets was 58,000 kg−1, which is 13.4% smaller than that in the CTL test. In the polluted test, the maximum number concentration of cloud droplets was 72,000 kg−1, which was 6% higher than that in the CTL test. The results indicated that the number concentrations of cloud droplets increased with the increase in air pollutants emissions.
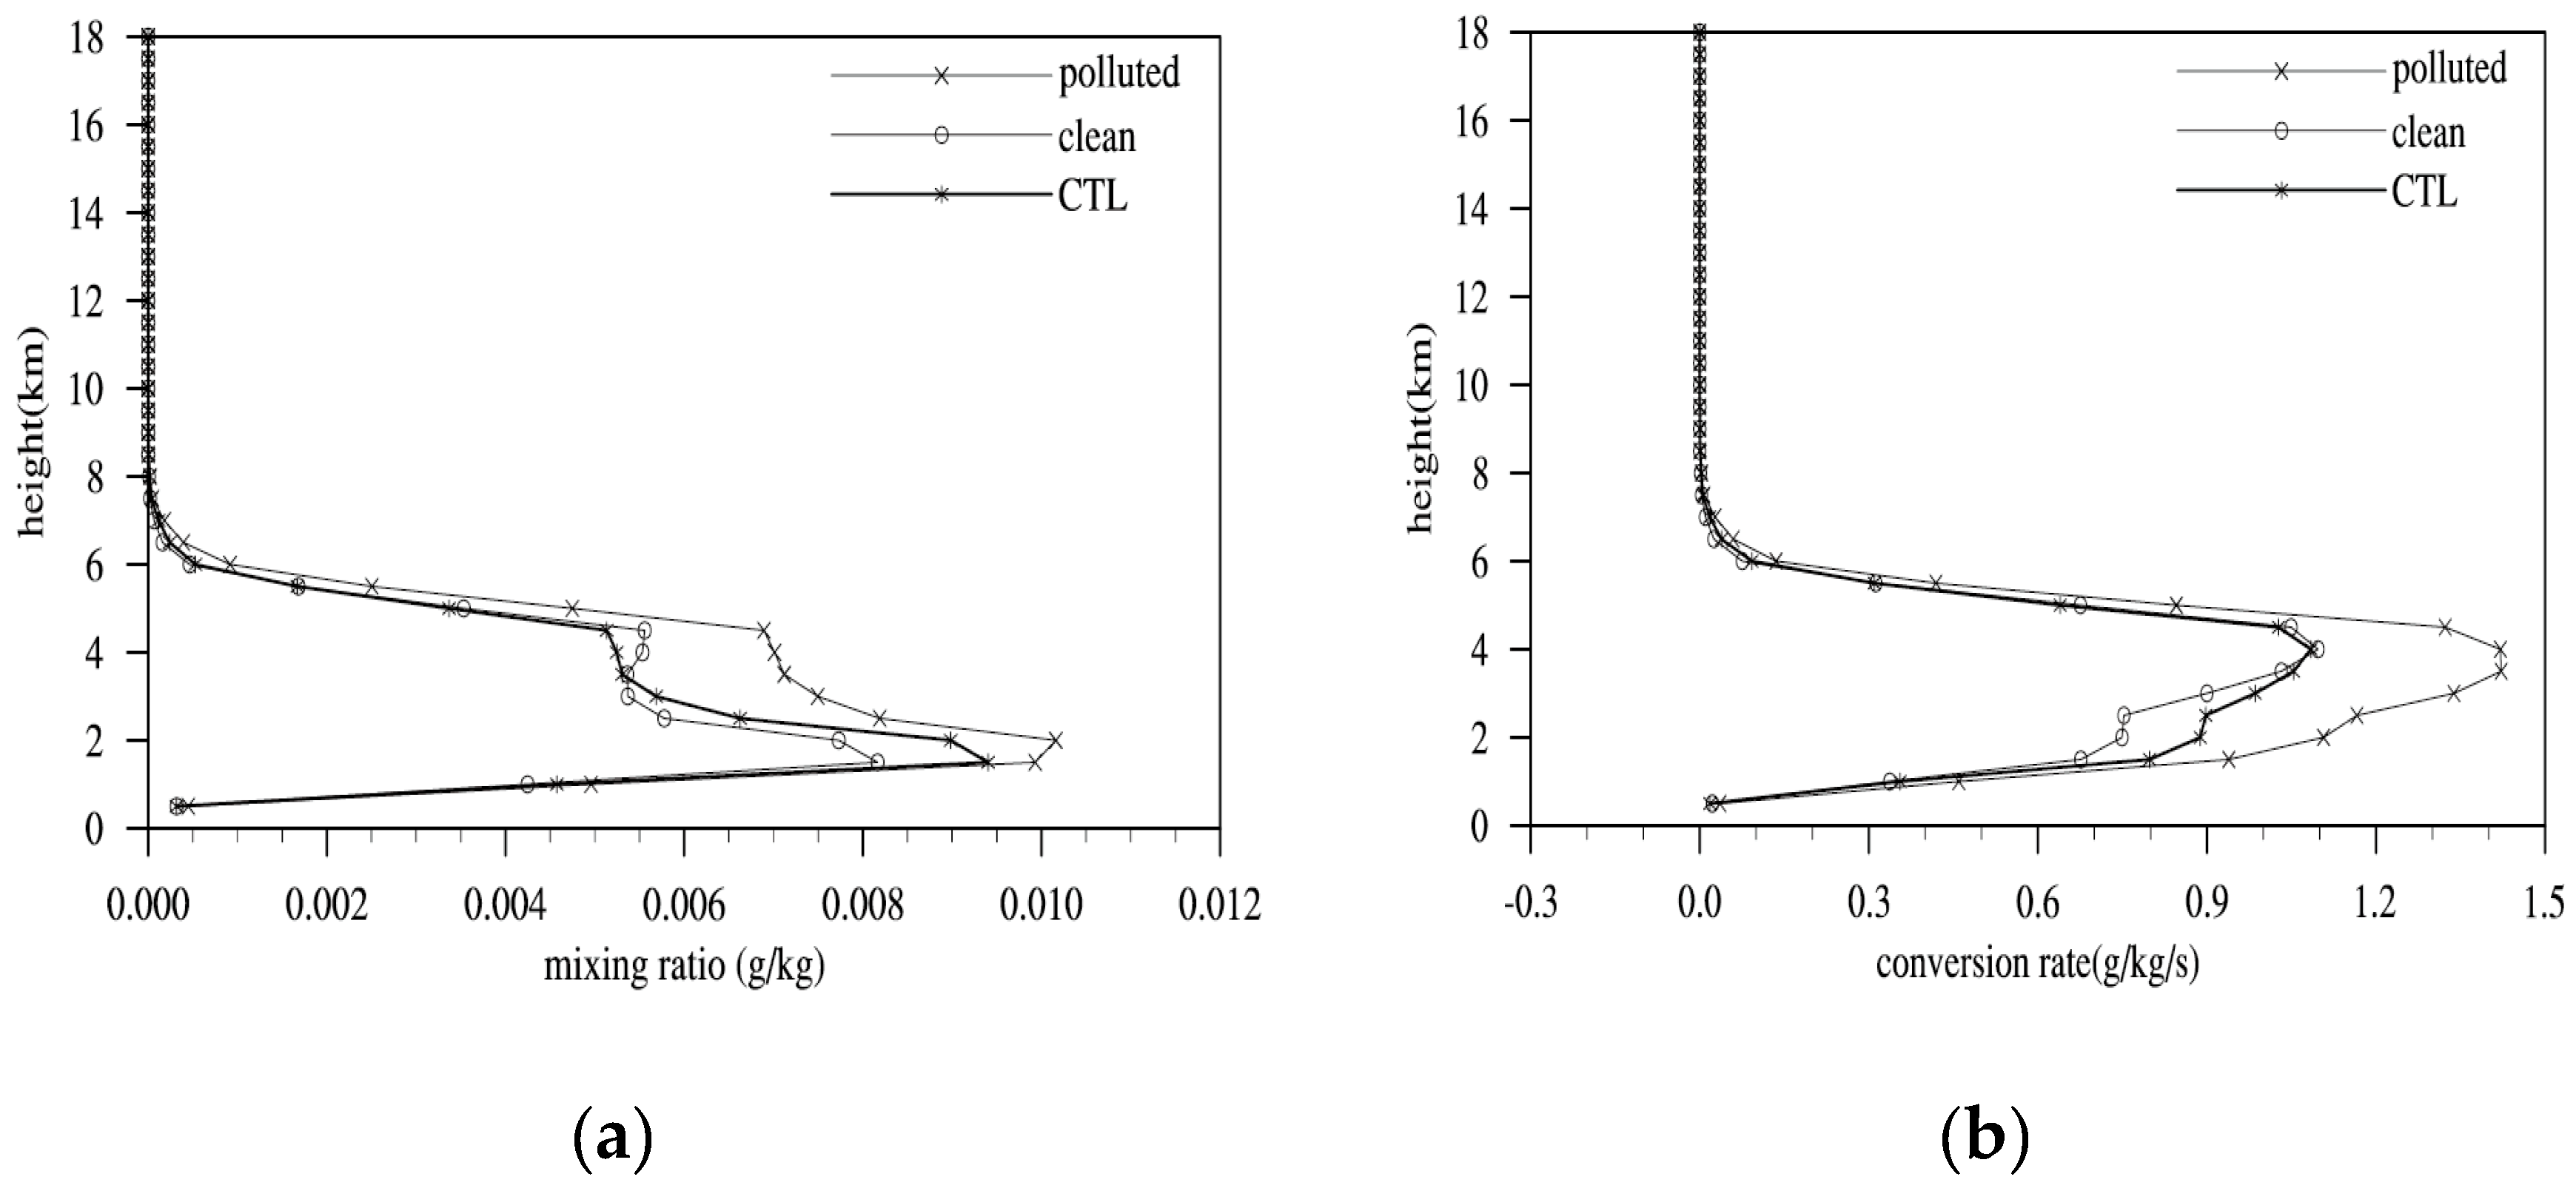
Correspondingly, there were some changes in the mixing ratio of cloud water (Figure 7a). The cloud water mainly appeared below the height of 8 km, with the maximum appearing at 2 km. There were not too many differences below 2 km and over 4 km among all three tests. The distribution was similar to number concentration distribution of cloud droplets. The maximum mixing ratios of cloud water were 0.0082 g kg−1 and 0.0103 g kg−1 in the clean and polluted tests, which were 13.7% smaller and 8.4% higher than that in the CTL test, respectively. Cloud water is mainly from water vapor condensation. The maximum conversion rate of condensation appeared at 4 km in all three tests. The conversion rate of water vapor condensation in the clean test was similar to that in the CTL test, and the maximum values in all tests were 1.1 × 10⁻⁴ g kg s−1. In the polluted test, the maximum conversion rate was 1.4 × 10⁻⁴ g kg s−1, which was higher than those of the other two tests. This result indicated that with the increase of aerosol concentration, the CCN concentration increased, which led to the enhancement of water vapor condensation, and the increase in cloud water content.
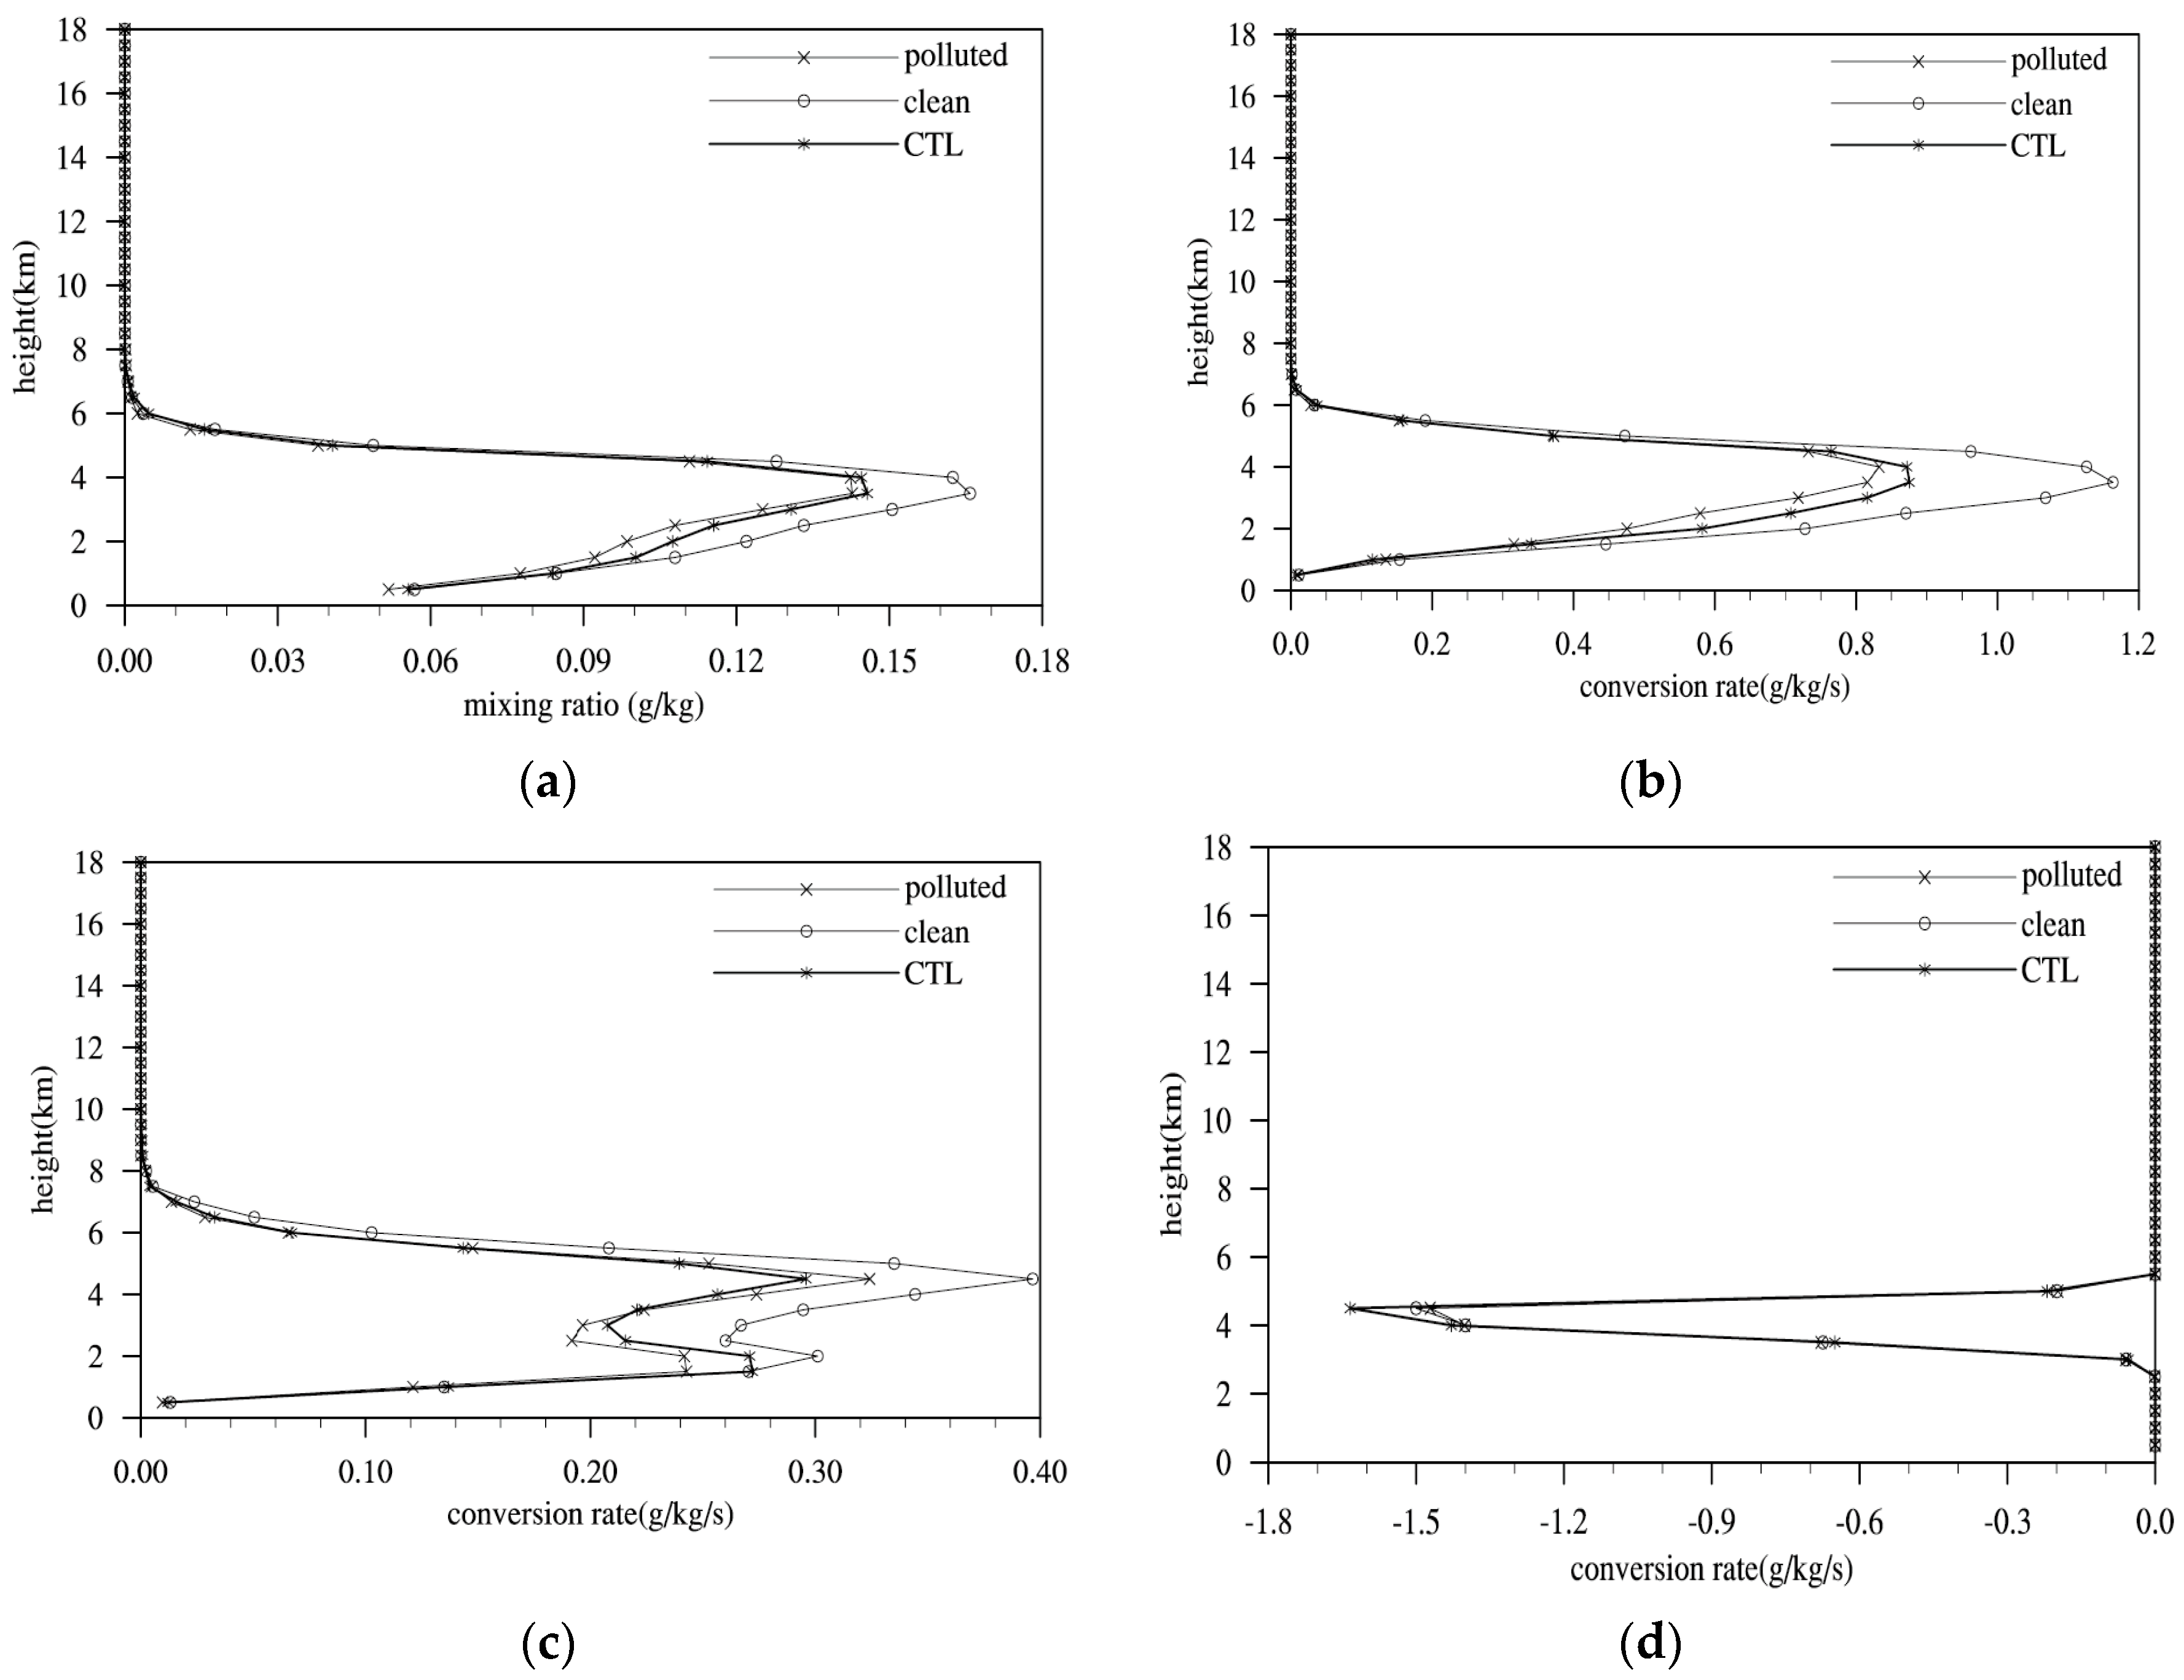
Rain mainly appeared below 8 km height, with a maximum mixing ratio appearing at approximately 4 km. Rain mixing ratios were nearly the same above 5 km in all three tests. The maximum mixing ratio of rain was approximately 0.15 g kg−1 in the CTL test, which was similar to that in the polluted test. In the clean test, the maximum rain mixing ratio was 0.17 g kg−1 (Figure 8a). There are two ways to form rainwater: warm rain processes and cold rain processes. Warm rain processes comprise the accretion of cloud water by rain and autoconversion of cloud water into rain. Cold rain processes mainly include the melting of graupel and snow. Figure 8b shows that the maximum conversion rate of accretion of cloud water by rain appeared at 4 km, which was the height where the maximum rain mixing ratio appeared. For smaller cloud droplets in the polluted test, the conversion rate of accretion of cloud water by rain was the smallest. In the clean test, the conversion rate of accretion of cloud water by rain was the largest for the large cloud water droplets and their large contact areas with rain. Figure 8c shows the autoconversion process of cloud water into rain. This process mainly appeared below 8 km, with maxima appearing at 2 km and 5 km, respectively. In the polluted test, the concentration of cloud droplets was high and the radius was small. Thus, the autoconversion rate was low. The autoconversion rate in the CTL test was slightly higher. In the clean test, the autoconversion process occurred easily due to the large cloud droplet radii. The maximum conversion rate in the clean test was 0.4 × 10⁻⁴ g kg−1 s−1, much higher than that in the polluted test, which was only 0.30 × 10⁻⁴ g kg−1 s−1. In all three tests, the conversion processes of melting of snow were similar (Figure 8d). Figure 8e shows that the melting of graupel into rain mainly appeared at 3–6 km, with the maximum appearing at 4 km, which corresponded to the height where the maximum rain mixing ratio appeared. The maximum conversion rate of melting of graupel in the clean test was 0.7 × 10⁻⁴ g kg−1 s−1, which was much higher than that of the other two tests. The accretion of cloud water by rain, the autoconversion of cloud water into rain and the melting of graupel all contributed to the high precipitation in the clean test.
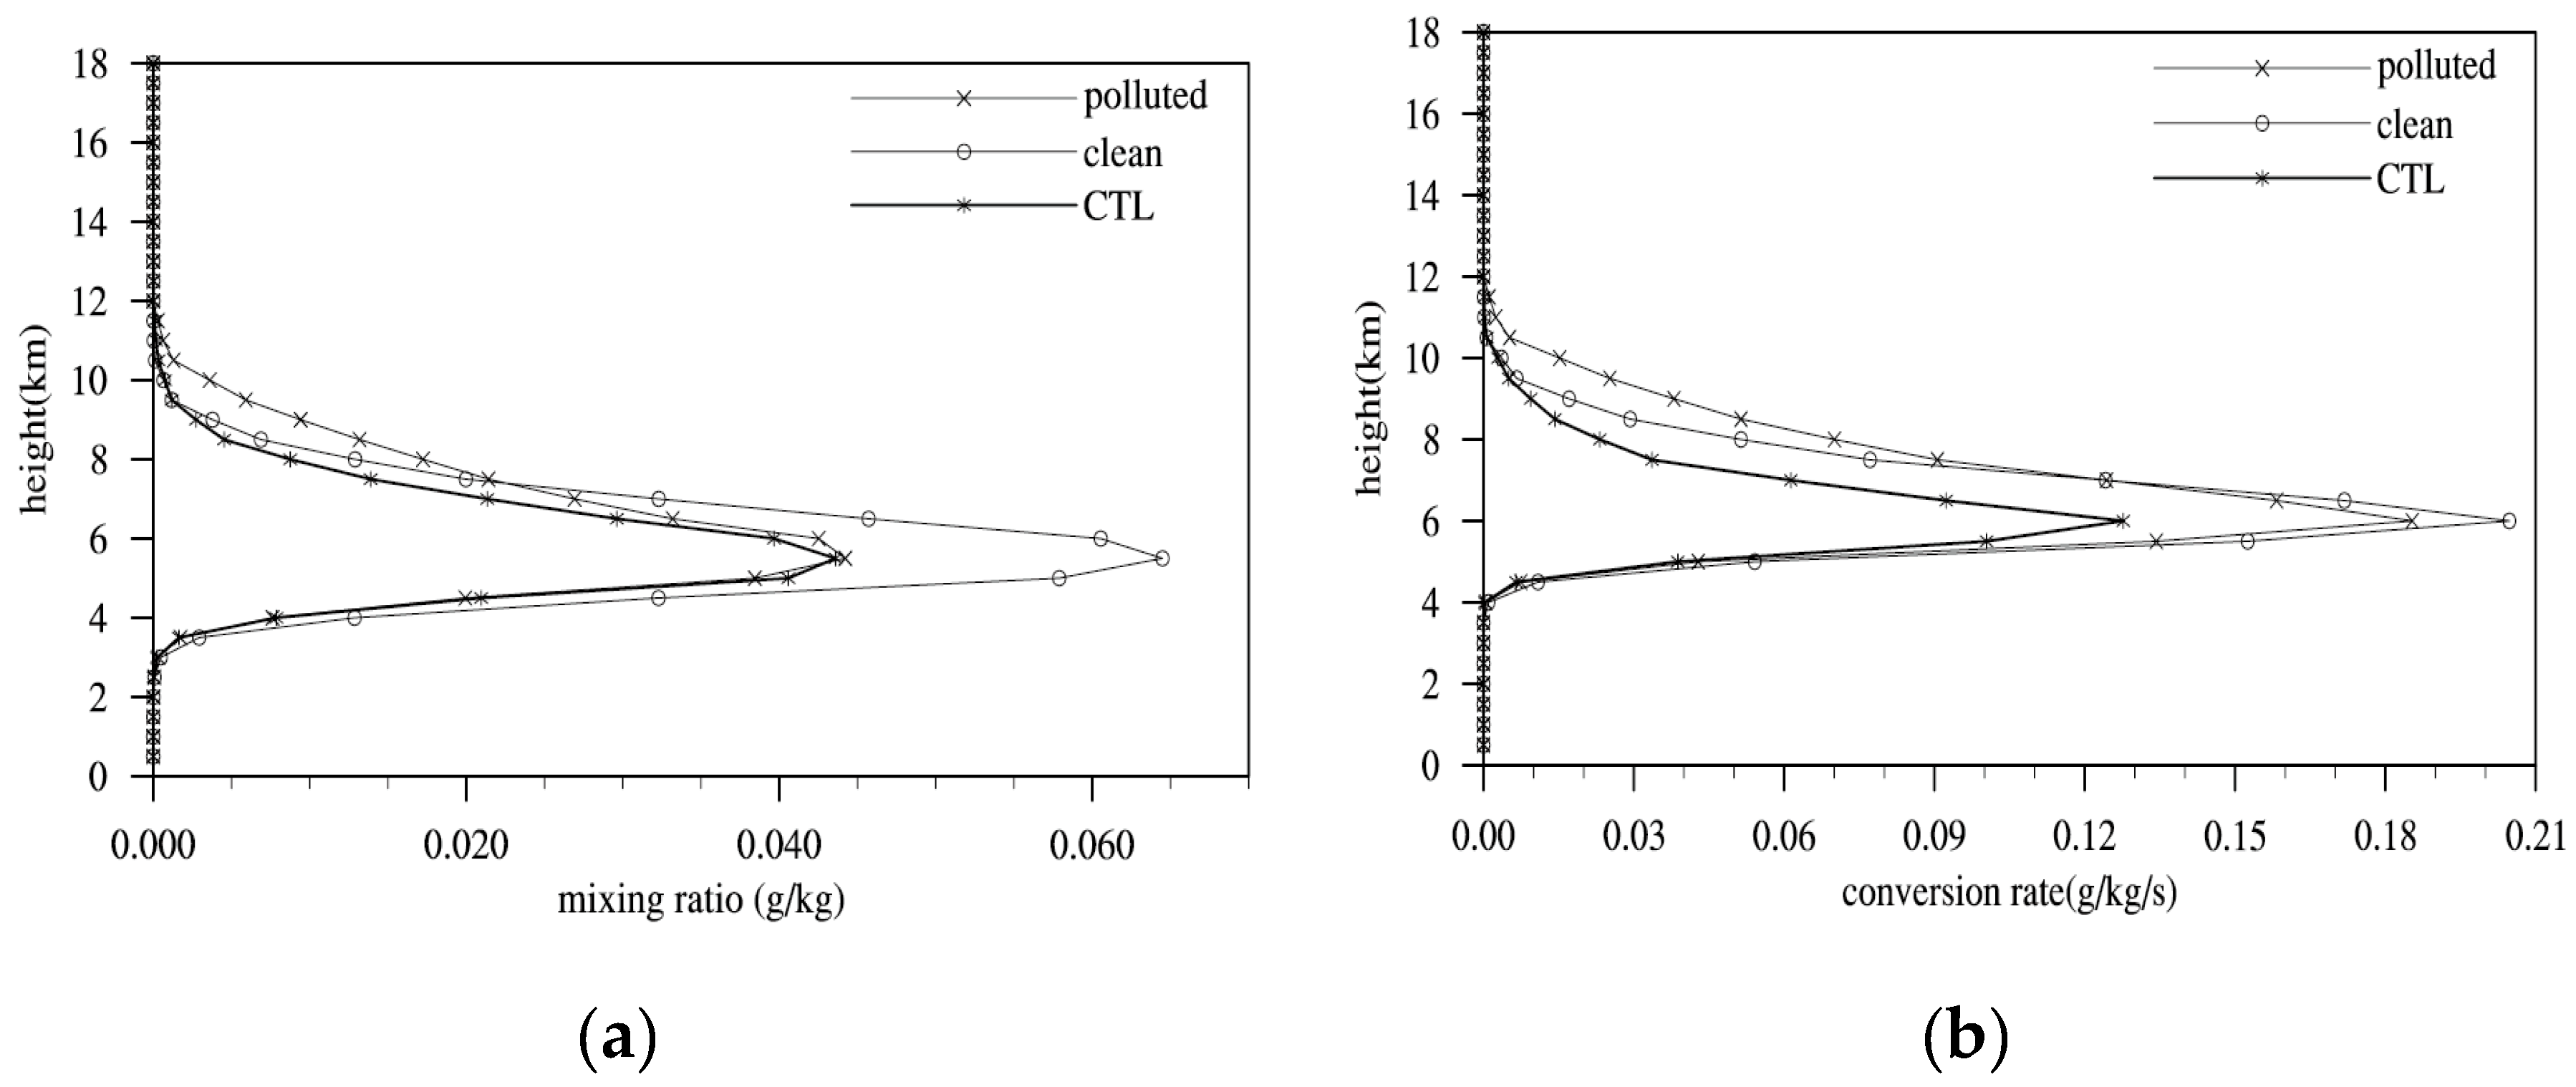
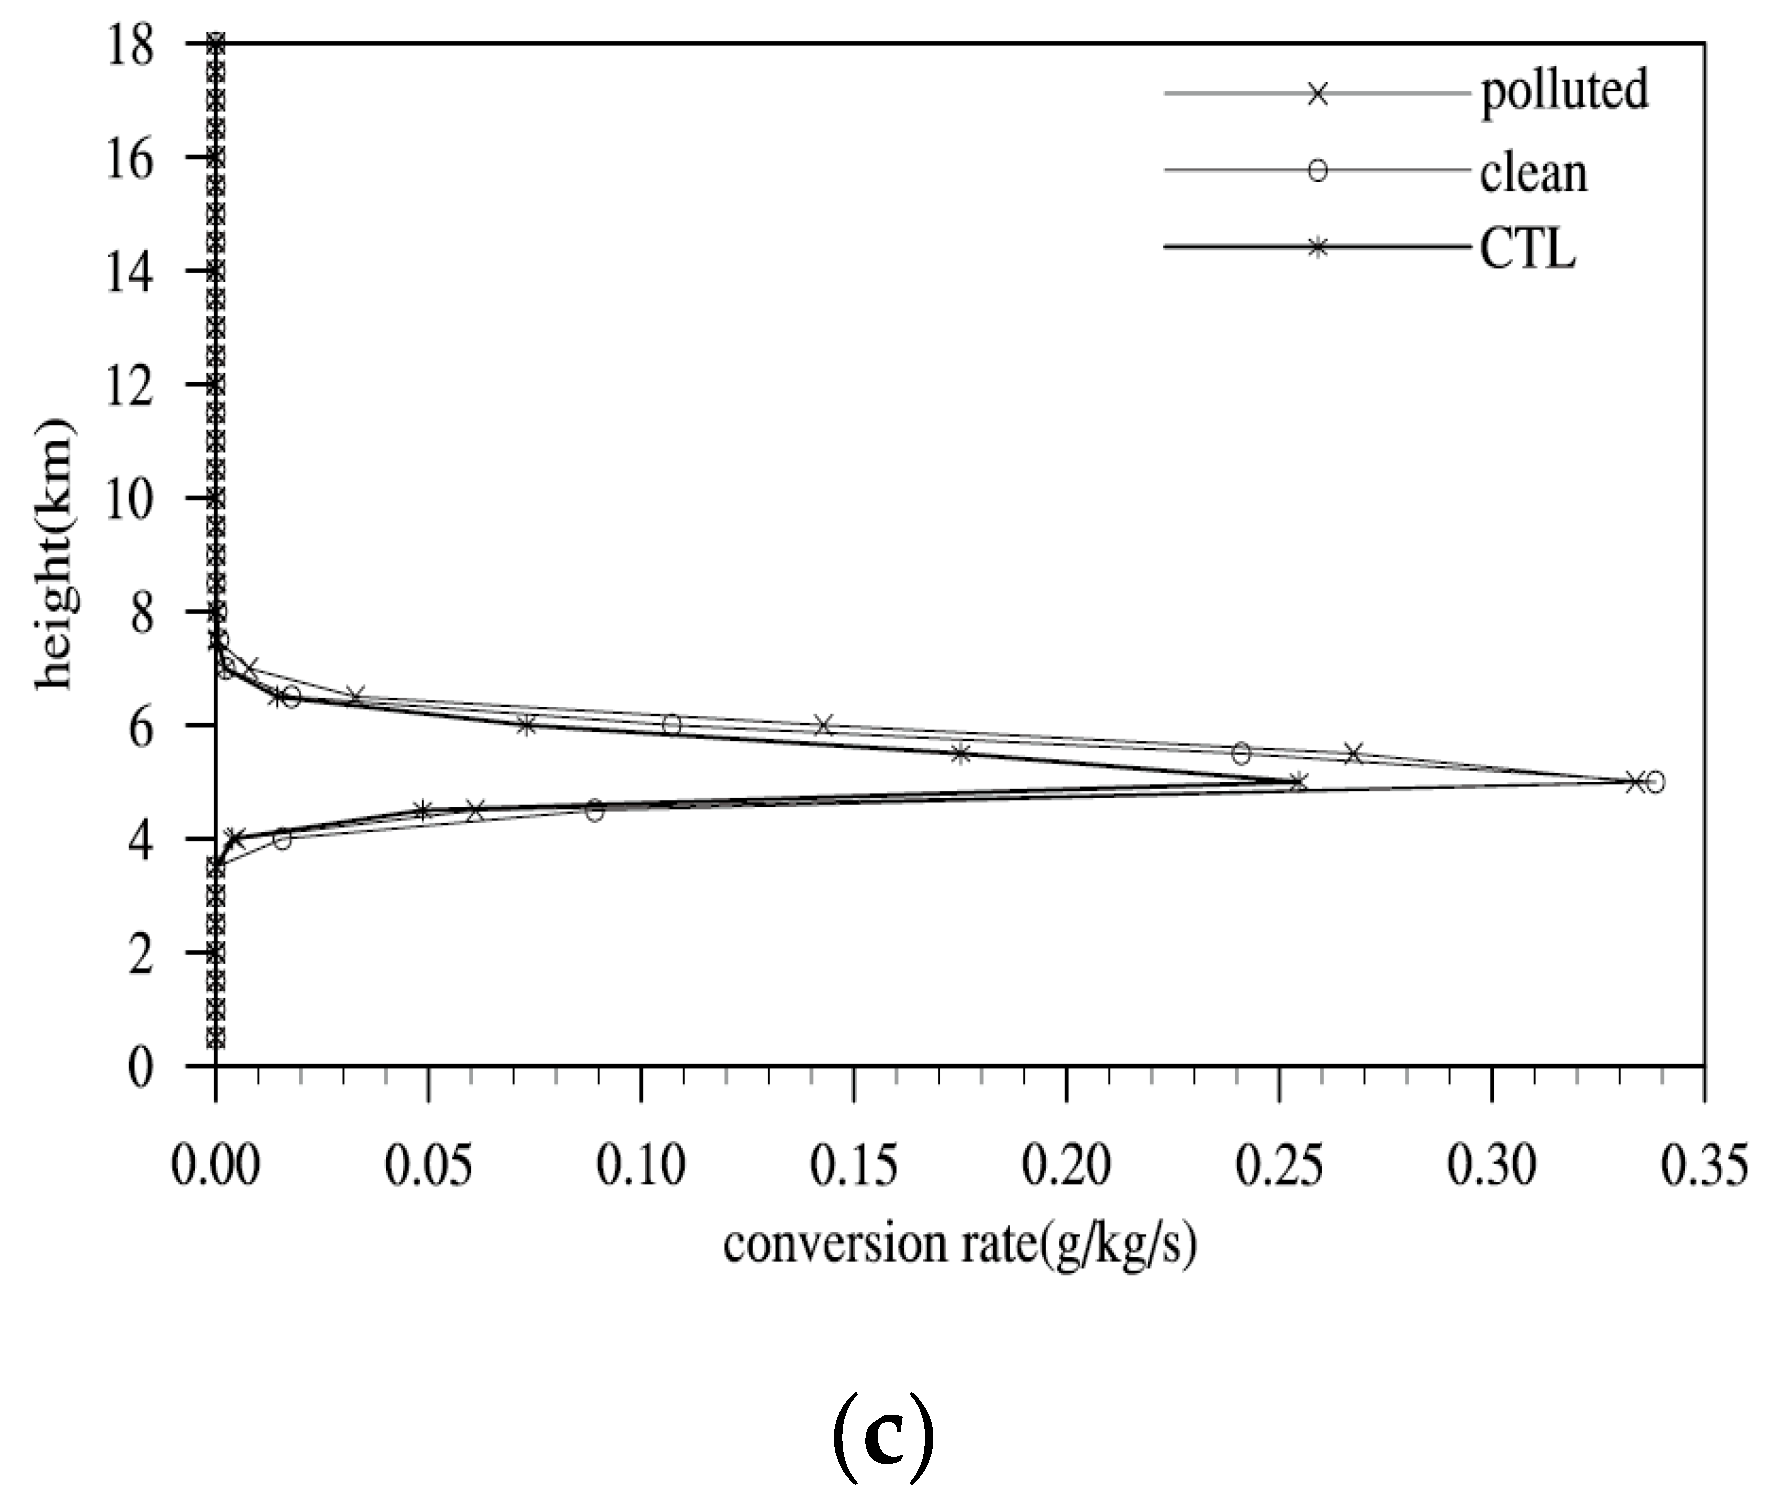
Graupel mainly appeared in the layer from 3 to 12 km, with the maximum appearing at a height of approximately 6 km, which was the freezing-level height. The maxima of graupel mixing ratios were 0.45g kg−1, 0.67 g kg−1 and 0.45 g kg−1 in the CTL, clean test and polluted test, respectively (Figure 9a). The graupel mixing ratio in the clean test was 50% larger than those of the other two tests. The main processes forming the graupel were the deposition of water vapor and the accretion of rain by graupel. Figure 9b shows that the deposition of water vapor into graupel mainly appeared at 6 km height, which was the height where the maximum graupel mixing ratios appeared. In the clean test, the conversion rate of water vapor deposition into graupel was the largest. The conversion rate of water vapor deposition into graupel in the polluted test was higher than that in the CTL test. Figure 9c shows that the conversion rates of accretion of rain by graupel were nearly the same as that in the clean and polluted tests, and higher than that in the CTL test.
The mixing ratios of snow and ice in the three tests did not change significantly. In the WRF-Chem model, aerosols cannot participate in the ice phase microphysical processes as IN. The main process forming ice was the deposition of water vapor. With no changes in the deposition of water vapor into ice, the mixing ratios of ice in all three tests were nearly the same. The main processes forming snow are the autoconversion of ice into snow, the accretion of ice by snow, and the deposition of water vapor into snow. All these processes are related to ice. Because there was not too much change in ice, there was not much change in the mixing ratio of snow. In summary, the variation in aerosol concentration mainly affected the warm rain processes and the mixed-phase processes around the freezing level.

4.4. Effects of Aerosols on Vertical Velocity

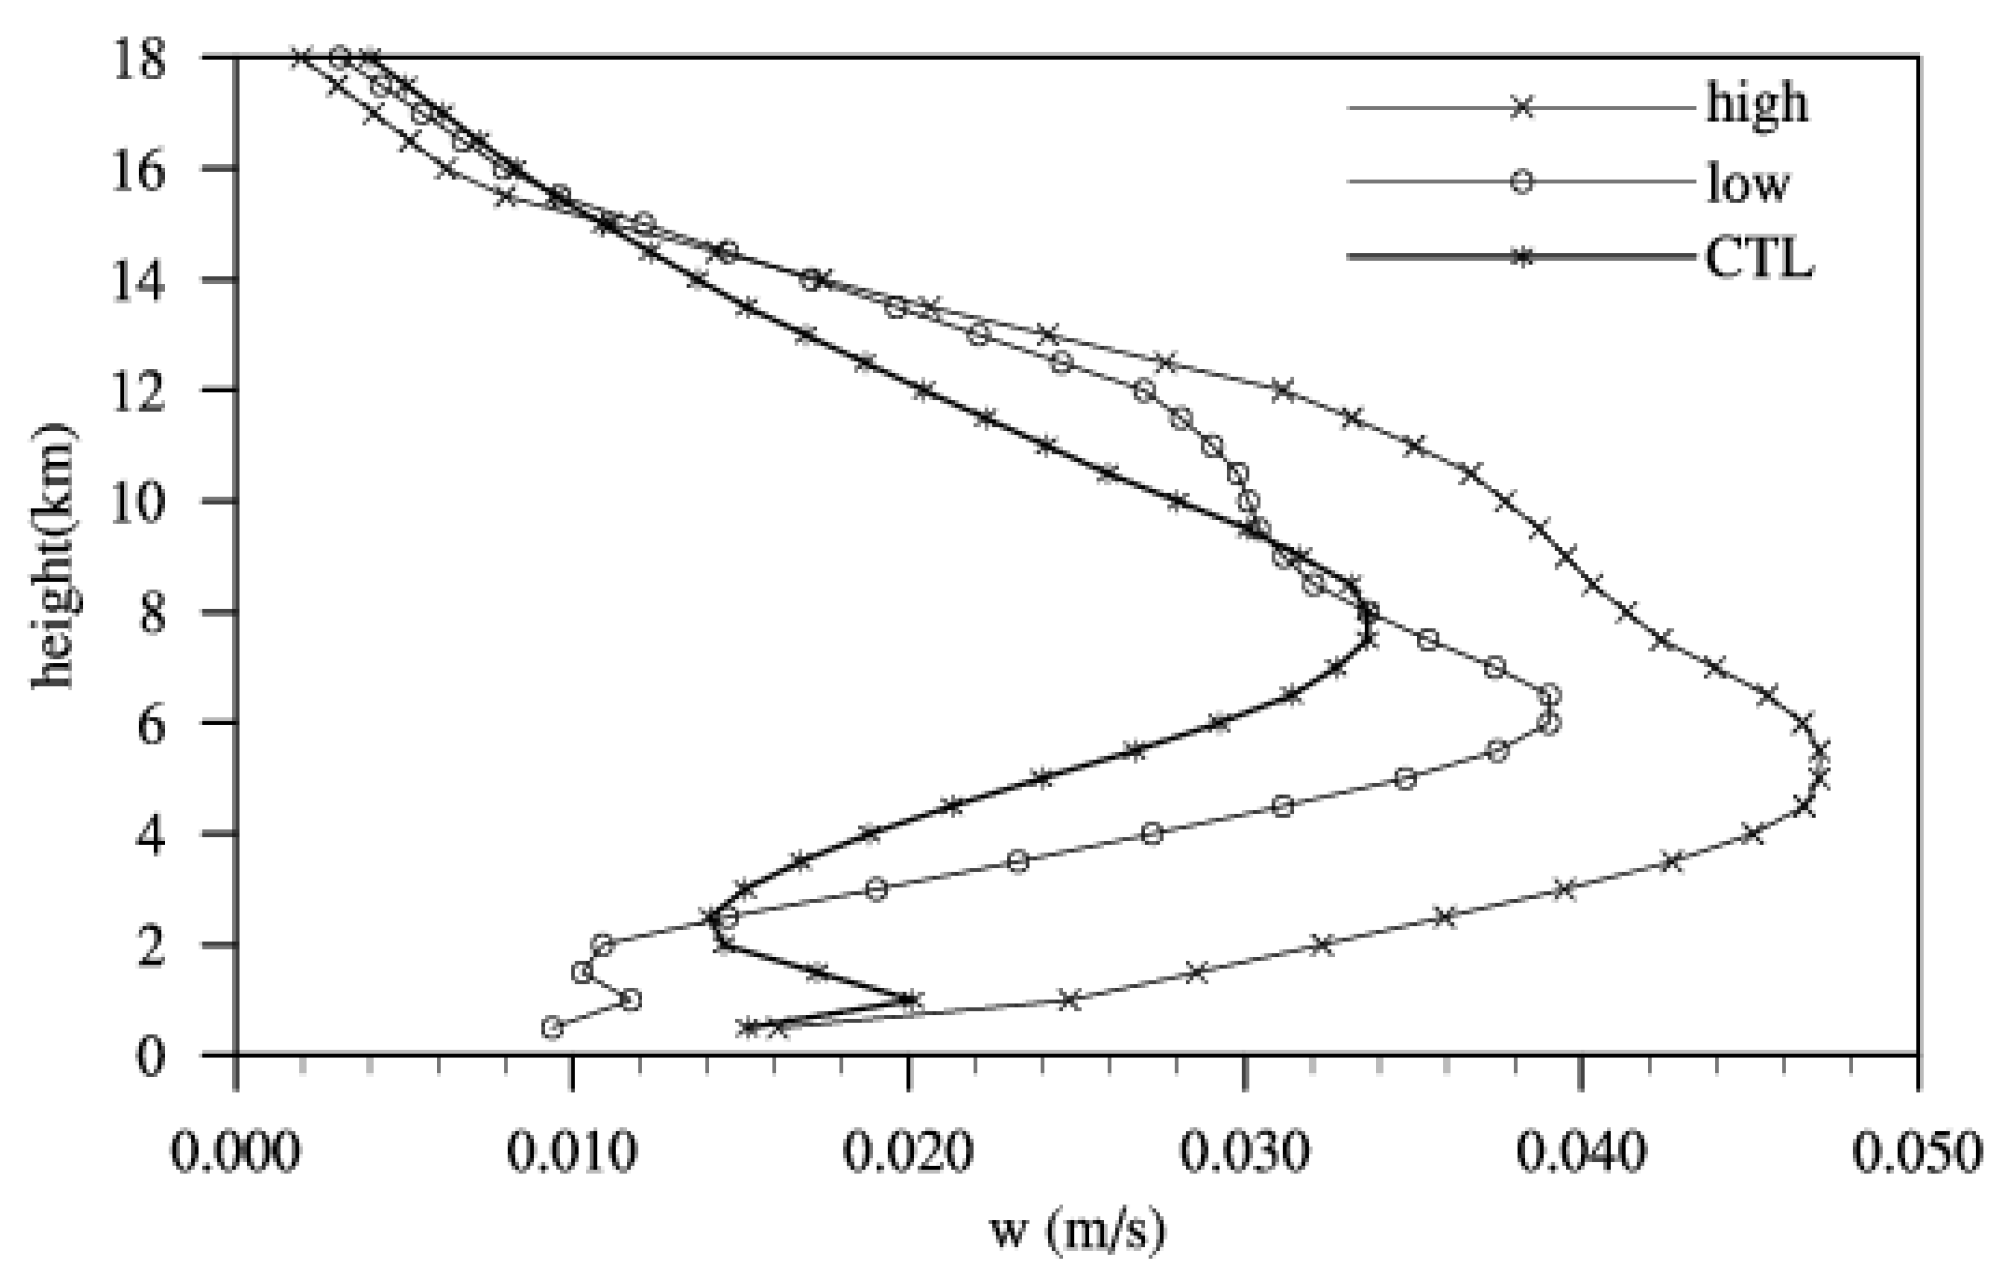
Figure 10 showed the domain averaged updraft in the three tests. In the polluted test, there were many cloud droplets. The condensation process of water vapor into cloud water was strong and thus there was much heat release in the low layers. The updraft was a little large. The cloud droplets were small and could only be suspended in the air. In the clean test, the terminal velocity of the cloud droplets was large for the large radius. The droplets had a drag effect and led to a decrease in the updraft. Simultaneously, the conversion rate of graupel melting could absorb a large amount of heat around the zero-degree level, which led to a decrease in the updraft.

5. Conclusions

A heavy rainstorm occurred in Beijing on 19–20 July, 2016. In this paper, the WRF-Chem model was used to investigate the effects of aerosols on precipitation and microphysical processes by altering the anthropogenic emission. The results are as follows:
(1)
During this rainfall process, Beijing was located at the entrance of the upper-level jet stream on 20 July 2016. During the westward and northward movement of the subtropical high, the cold vortex moved slowly, and this movement enabled the low-pressure system to be maintained for a long time in North China. Simultaneously, water vapor from the Bay of Bengal was transported to the North China area, providing good conditions for this rainfall process.
(2)
When the anthropogenic emission was increased by 10 times, the area average accumulated rainfall amount and the maximum accumulated rainfall amount decreased by 9% and 5.4%, respectively. When the anthropogenic emission decreased to 10%, the area-average accumulated rainfall amount and the maximum accumulated rainfall amount increased by 8% and 4%, respectively. In the clean test, the area of accumulated rainfall amounts greater than 25 mm in the Beijing area was 10% larger than that of the other two tests.
(3)
With the increase in anthropogenic emissions, the concentration of aerosols increased. Thus, the number concentrations of CCN and cloud droplets increased, which led to an increase in the cloud water mixing ratio. Because the radii of cloud droplets decreased, the contact area between the cloud and rain was reduced, and the collision process was decreased. The autoconversion rate of cloud water into rain was low for small cloud droplets. In the clean test, the collision efficiency and autoconversion rate of cloud water into rain were high for large contact areas and large cloud droplets.
(4)
In the clean test, the graupel mixing ratio was the largest. Thus, the process of melting of graupel into rain was the largest.
(5)
The mixing ratios of snow and ice did not show too many differences among the three tests. In the WRF-Chem model, the aerosols cannot participate in the ice-phase microphysical processes as IN. For the main formation process of deposition of water vapor into ice was not changed, there was no change in ice mixing ratio. The main formation processes of snow were related to ice. Therefore, there was no change in snow mixing ratio. The concentration variation mainly influenced the warm rain processes and mix-phased processes near the freezing level line.
The effects of aerosols on a heavy rainstorm in Beijing were discussed in this paper. In this event, aerosols mainly influenced the warm rain and mixed-phase microphysical processes, which led to the change in precipitation. In the future, more rain cases induced by different weather systems should be analyzed and summarized, which can reveal the complex effects of aerosols on precipitation.

Author Contributions

C.G. designed the experiments and wrote the manuscript. H.X. supervised the work and provided critical comments. H.Y. and W.W. collected data and analyzed the results.

Funding

This research was funded by the National Natural Science Foundation of China (Grant Nos. 41605110 and 41575037), and the National Key Research and Development Plan of China (Grant Nos. 2016YFC0208902, 2016YFC0208905 and 2016YFE0201900-02).

Conflicts of Interest

The authors declare no conflict of interest.

References

  1. Gong, W.; Zhang, T.H.; Zhu, Z.; Ma, Y.; Ma, X.; Wang, W. Characteristics of PM1.0, PM2.5, and PM10, and Their Relation to Black Carbon in Wuhan, Central China. Atmosphere 2015, 6, 1377–1387. [Google Scholar] [CrossRef]
  2. Han, R.; Wang, S.; Shen, W.; Wang, J.; Wu, K.; Ren, Z.; Feng, M. Spatial and temporal variation of haze in China from 1961 to 2012. J. Environ. Sci. 2016, 46, 134–146. [Google Scholar] [CrossRef] [PubMed]
  3. Zhang, J.; Liu, Y.; Cui, L.; Liu, S.; Yin, X.; Li, H. Ambient air pollution, smog episodes and mortality in Jinan, China. Sci. Rep. 2017, 7, 11209. [Google Scholar] [CrossRef]
  4. Lang, J.; Li, S.; Cheng, S.; Zhou, Y.; Chen, D.; Zhang, Y.; Zhang, H.; Wang, H. Chemical Characteristics and Sources of Submicron Particles in a City with Heavy Pollution in China. Atmosphere 2018, 9, 388. [Google Scholar] [CrossRef]
  5. Chalvatzaki, E.; Chatoutsidou, S.E.; Lehtomäki, H.; Almeida, S.M.; Eleftheriadis, K.; Hänninen, O.; Lazaridis, M. Characterization of Human Health Risks from Particulate Air Pollution in Selected European Cities. Atmosphere 2019, 10, 96. [Google Scholar] [CrossRef]
  6. Lu, H.; Wu, Y.; Mutuku, J.; Chang, K.H. Various Sources of PM2.5 and their Impact on the Air Quality in Tainan City, Taiwan. Aerosol. Air Qual. Res. 2019, 19, 601–619. [Google Scholar] [CrossRef]
  7. Kiehl, J.; Briegleb, B. The relative roles of sulfate aerosols and greenhouse gases in climate forcing. Science 1993, 260, 311–314. [Google Scholar] [CrossRef]
  8. Koren, I.; Kaufman, Y.; Remer, L.; Martins, J. Measurement of the effect of Amazon smoke on inhibition of cloud formation. Science 2004, 303, 1342–1345. [Google Scholar] [CrossRef] [PubMed]
  9. Boucher, O.; Randall, D.; Artaxo, P. Clouds and aerosols. In Climate Change 2013: The Physical Science Basis: Contribution of Working Group I to the Fifth Assessment Report of the Intergovernmental Panel on Climate Change; Cambridge University Press: Cambridge, UK; New York, NY, USA, 2013; pp. 571–657. [Google Scholar]
  10. Castellanos, P.; Da Silva, A.M.; Darmenov, A.S.; Buchard, V.; Govindaraju, R.; Ciren, P.; Kondragunta, S. A Geostationary Instrument Simulator for Aerosol Observing System Simulation Experiments. Atmosphere 2019, 10, 2. [Google Scholar] [CrossRef]
  11. Phillips, V.; Andronache, C.; Sherwood, S.; Bansemer, A.; Conant, W.C.; Demott, P.J.; Flagan, R.C.; Heymsfield, A.; Jonsson, H.; Poellot, M.; et al. Anvil glaciation in a deep cumulus updraught over Florida simulated with the Explicit Microphysics Model. I: Impact of various nucleation processes. Q. J. R. Meteorol. Soc. 2005, 131, 2019–2046. [Google Scholar] [CrossRef] [Green Version]
  12. Zhang, R.; Li, G.; Fan, J.; Wu, D.; Molina, M. Intensification of Pacific storm track linked to Asian pollution. Proc. Natl. Acad. Sci. USA 2007, 104, 5295–5299. [Google Scholar] [CrossRef] [PubMed] [Green Version]
  13. Rosenfeld, D.; Lohmann, U.; Raga, G.; O’Dowd, C.; Kulmala, M.; Fuzzi, S.; Reissell, A.; Andreae, M. Flood or drought: How do aerosols affect precipitation? Science 2008, 321, 1309–1313. [Google Scholar] [CrossRef]
  14. Fan, J.; Comstock, J.; Ovchinnikov, M. The cloud condensation nuclei and ice nuclei effects on tropical anvil characteristics and water vapor of the tropical tropopause layer. Environ. Res. Lett. 2010, 5, 044005. [Google Scholar] [CrossRef] [Green Version]
  15. Tuccella, P.; Menut, L.; Briant, R.; Deroubaix, A.; Khvorostyanov, D.; Mailler, S.; Siour, G.; Turquety, S. Implementation of Aerosol-Cloud Interaction within WRF-CHIMERE Online Coupled Model: Evaluation and Investigation of the Indirect Radiative Effect from Anthropogenic Emission Reduction on the Benelux Union. Atmosphere 2019, 10, 20. [Google Scholar] [CrossRef]
  16. Varghese, M.; Prabha, T.; Murugavel, P. Aerosol and cloud droplet characteristics over Ganges Valley during break phase of monsoon: A case study. Atmos. Res. 2019, 220, 125–140. [Google Scholar] [CrossRef]
  17. Twomey, S. The influence of pollution on the shortwave albedo of clouds. J. Atmos Sci. 1977, 34, 1149–1152. [Google Scholar] [CrossRef]
  18. Fan, J.; Leung, L.; Rosenfeld, D.; Chen, Q.; Li, Z.; Zhang, J.; Yan, H. Microphysical Effects Determine Macrophysical Response for Aerosol Impacts on Deep Convective Clouds. Proc. Natl. Acad. Sci. USA 2013, 110, E4581–E4590. [Google Scholar] [CrossRef] [PubMed]
  19. Zhong, S.; Qian, Y.; Zhao, C.; Leung, R.; Wang, H.; Yang, B.; Fan, J.; Yan, H.; Yang, X.; Liu, D. Urbanization-induced urban heat island and aerosol effects on climate extremes in the Yangtze River Delta region of China. Atmos. Chem. Phys. 2017, 17, 5439–5457. [Google Scholar] [CrossRef] [Green Version]
  20. Yang, H.; Xiao, H.; Hong, Y. Progress in impacts of aerosol on cloud properties and precipitation. Clim. Environ. Res. 2011, 16, 525–542. [Google Scholar]
  21. IPCC. Summary for policymakers. In Climate Change 2013: The Physical Science Basis. Contribution of Working Group I to the Fifth Assessment Report of the Intergovernmental Panel on Climate Change; Cambridge University Press: Cambridge, UK; New York, NY, USA, 2013; pp. 3–29. [Google Scholar]
  22. Várnai, T.; Marshak, A. Satellite Observations of Cloud-Related Variations in Aerosol Properties. Atmosphere 2018, 9, 430. [Google Scholar] [CrossRef]
  23. Hobbs, P. Aerosol-Cloud-Climate Interactions; Academic Press: Cambridge, MA, USA, 1993; p. 54. [Google Scholar]
  24. McComiskey, A.; Feingold, G. The scale problem in quantifying aerosol indirect effects. Atmos. Chem. Phys. 2012, 12, 1031–1049. [Google Scholar] [CrossRef] [Green Version]
  25. Fan, J.; Wang, Y.; Rosenfeld, D.; Liu, X. Review of aerosol–cloud interactions: Mechanisms, significance, and challenges. J. Atmos Sci. 2016, 73, 4221–4252. [Google Scholar] [CrossRef]
  26. Shepherd, J.; Burian, S. Detection of urban-induced rainfall anomalies in a major coastal city. Earth Interact. 2003, 7, 1–17. [Google Scholar] [CrossRef]
  27. Mashayekhi, R.; Sloan, J. Effects of aerosols on precipitation in north-eastern North America. Atmos. Chem. Phys. 2014, 14, 5111–5125. [Google Scholar] [CrossRef] [Green Version]
  28. Lacke, M.; Mote, T.; Shepherd, J. Aerosols and associated precipitation patterns in Atlanta. Atmos. Environ. 2009, 43, 4359–4373. [Google Scholar] [CrossRef]
  29. Evan, A.; Foltz, G.; Zhang, D.; Vimont, D. Influence of African dust on ocean–atmosphere variability in the tropical Atlantic. Nat. Geosci. 2011, 4, 762–765. [Google Scholar] [CrossRef]
  30. Rosenfeld, D. TRMM observed first direct evidence of smoke from forest fires inhibiting rainfall. Geophys. Res. Lett. 1999, 26, 3105–3108. [Google Scholar] [CrossRef] [Green Version]
  31. Xiao, H.; Yin, Y.; Jin, L.; Chen, Q.; Chen, J. Simulation of aerosol effects on orographic clouds and precipitation using WRF model with a detailed bin microphysics scheme. Atmos. Sci. Lett. 2014, 15, 134–139. [Google Scholar] [CrossRef]
  32. Borys, D.; Lowenthal, D.; Cohn, S.; Brown, W. Mountain top and radar measurements of anthropogenic aerosol effects on snow growth and snowfall rate. Geophys. Res. Lett. 2003, 30, 1538. [Google Scholar] [CrossRef]
  33. Givati, A.; Rosenfeld, D. Quantifying precipitation suppression due to air pollution. J. Appl. Meteorol. 2004, 43, 1038–1056. [Google Scholar] [CrossRef]
  34. Yang, H.; Xiao, H.; Hong, Y. The effects of giant cloud condensation nuclei on the structure of precipitation in hailstorm clouds. Sci China Earth Sci. 2012, 55, 126–142. [Google Scholar] [CrossRef]
  35. Yang, H.; Xiao, H.; Hong, Y. A numerical study of aerosol effects on cloud microphysical processes of hailstorm clouds. Atmos. Res. 2011, 102, 432–443. [Google Scholar] [CrossRef]
  36. Jiang, B.; Huang, B.; Lin, W.; Xu, S. Investigation of the effects of anthropogenic pollution on typhoon precipitation and microphysical processes using WRF-Chem. J. Atmos. Sci. 2016, 73, 1593–1610. [Google Scholar] [CrossRef]
  37. Gibbons, M.; Min, Q.; Fan, J. Investigating the impacts of Saharan dust on tropical deep convection using spectral bin microphysics. Atmos. Chem. Phys. 2018, 18, 12161–12184. [Google Scholar] [CrossRef]
  38. Fan, J.; Rosenfeld, D.; Ding, Y.; Leung, L.; Li, Z. Potential aerosol indirect effects on atmospheric circulation and radiative forcing through deep convection. Geophys. Res. Lett. 2012, 39, L09806. [Google Scholar] [CrossRef]
  39. Ilotoviz, E.; Khain, A. Application of a new scheme of cloud base droplet nucleation in a spectral (bin) microphysics cloud model: Sensitivity to aerosol size distribution. Atmos. Chem. Phys. 2016, 16, 14317–14329. [Google Scholar] [CrossRef]
  40. Dagan, G.; Koren, I.; Altaratz, O. Aerosol effects on the timing of warm rain processes. Geophys. Res. Lett. 2015, 42, 4590–4598. [Google Scholar] [CrossRef]
  41. Wu, R. Principles of Modern Meteorology; Higher Education Press: Beijing, China, 1999; p. 319. [Google Scholar]
  42. Hong, S.; Pan, H. Nonlocal boundary layer vertical diffusion in a medium-range forecast model. Mon. Weather Rev. 1996, 124, 2322–2339. [Google Scholar] [CrossRef]
  43. Iacono, M.; Delamere, J.; Mlawer, E.; Shephard, M.; Clough, S.; Collins, W. Radiative forcing by long-lived greenhouse gases: Calculations with the AER radiative transfer models. J. Geophys. Res. 2008, 113, D13103. [Google Scholar] [CrossRef]
  44. Chen, F.; Dudhia, J. Coupling an advanced land surface hydrology model with the Penn State-NCAR MM5 modeling system. Part I: Model implementation and sensitivity. Mon. Weather Rev. 2001, 129, 569–585. [Google Scholar] [CrossRef]
  45. Morrison, H.; Curry, J.; Khvorostyanov, V. A new double-moment microphysics parameterization for application in cloud and climate models. Part I: Description. J. Atmos. Sci. 2005, 62, 1665–1677. [Google Scholar] [CrossRef]
  46. Zaveri, R.; Peters, L. A new lumped structure photochemical mechanism for large-scale applications. J. Geophys. Res. 1999, 104, 30387–30415. [Google Scholar] [CrossRef] [Green Version]
  47. Fast, J.; Gustafson, W.; Easter, R.; Zaveri, R.; Barnard, J.; Chapman, E.; Grell, G.; Peckham, S. Evolution of ozone, particulates, and aerosol direct radiative forcing in the vicinity of Houston using a fully coupled meteorology-chemistry-aerosol model. J. Geophys. Res. 2006, 111, D21305. [Google Scholar] [CrossRef]
Figure 1. (a) The location of Beijing and the weather stations at Dongshancun (marked by a red triangle) and Liangxiang (marked by a black triangular) (BJ: Beijing, TJ: Tianjin, HB: Hebei Province) (b) Hourly rainfall amounts (mm) at the Dongshancun and Liangxiang stations (mm).
Atmosphere 10 00162 g001aAtmosphere 10 00162 g001b
Figure 2. Upper-level jet stream at the 200 hPa level (shaded), unit: m s−1 and potential height at the 500 hPa level (blue lines), unit: dagpm at (a) 2000 BST on 19 July (B: Lake Baikal, H: Hetao region), and (b) 0800 BST on 20 July. Wind field at the 850 hPa level (arrow), unit: m s−1 and relative humidity at the 700 hPa level (shaded), unit:% at (c) 2000 BST on 19 July, and (d) 0800 BST on 20 July.
Atmosphere 10 00162 g002
Figure 3. The variations of PM2.5 concentrations over time in the observation, CTL, clean, and polluted tests (unit: μg m−3, the values in the polluted test are multiplied by 0.1) at (a) Tiantan station and (b) Nongzhan station.
Atmosphere 10 00162 g003
Figure 4. The accumulated rainfall amount from 0600 BST on 19 July to 0000 BST on July 21, 2016 (mm). (a) Observation, (b) CTL test, (c) clean test, and (d) polluted test.
Atmosphere 10 00162 g004
Figure 5. Comparison of the domain-averaged accumulated rainfall amount and maximum accumulated rainfall amount (mm).
Atmosphere 10 00162 g005
Figure 6. Time and area-average number concentration variation in cloud droplets with height in the Beijing area (kg−1).
Atmosphere 10 00162 g006
Figure 7. (a) Cloud water mixing ratio (g kg−1) and (b) conversion rate of water vapor condensation (10−4 g kg−1 s−1).
Atmosphere 10 00162 g007
Figure 8. (a) Mixing ratio of rain (g kg−1), the conversion rates of (b) accretion of cloud water by rain, (c) the autoconversion of cloud water into rain, (d) the melting of snow, and (e) the melting of graupel (10−4 g kg−1 s−1).
Atmosphere 10 00162 g008aAtmosphere 10 00162 g008b
Figure 9. (a) The mixing ratio of graupel (g kg−1), and the conversion rates of (b) the deposition of water vapor into graupel, and (c) the accretion of rain by graupel (10−4 g kg−1 s−1).
Atmosphere 10 00162 g009aAtmosphere 10 00162 g009b
Figure 10. Domain averaged updraft in all three tests (m s−1).
Atmosphere 10 00162 g010
Table 1. Physical and chemical parameterization schemes employed in the simulations.
Physical and Chemical ProcessScheme
Microphysical scheme Morrison two-moment
Planetary boundary layerYSU
Land surface modelUnified Noah land surface scheme
Shortwave radiationRRTMG
Long wave radiationRRTMG
ChemistryCBMZ
AerosolMOSAIC
Table 2. Area percentage of the domain-averaged accumulated rainfall amount in different intervals of the total precipitation area (%).
Test0–25 mm25–50 mm50–100 mm100–250 mm>250 mm
CTL31.217.722.1236
clean 22.118.125.227.27.4
polluted31.817.721.323.65.6