Article

Impact of Different Types of ENSO Years on Intensity Changes of Landfalling Tropical Cyclones over China

State Key Laboratory of Severe Weather, Chinese Academy of Meteorological Sciences, Beijing 100081, China
Atmosphere 2019, 10(3), 161; https://doi.org/10.3390/atmos10030161
Submission received: 21 February 2019 / Revised: 19 March 2019 / Accepted: 22 March 2019 / Published: 26 March 2019
(This article belongs to the Section Meteorology)

Abstract

:
This study examines whether there are significant differences in intensity and destructiveness of landfalling tropical cyclones (TCs) over China in central Pacific warm (CPW), eastern Pacific warm (EPW) and La Niña (LA) years. By analyzing different seasons and locations of TCs making landfall over China, it was found that TCs in LA years generally had a larger power dissipation index (PDI) and may cause more disasters in China, while TCs in EPW years had a larger PDI over South China in autumn. A larger PDI of TCSC (landing location in Southern China) usually occurred in EPW years and a larger PDI of TCEC (landing location in Eastern China) occurred in LA years, compared with CPW years. The TCs in LA years were generally stronger, more frequent, and of longer duration over China, because of the positive relative humidity (RH) anomalies, the significant anomalous cyclone that occupied the South China Sea (SCS), and the easterly wind anomalies providing a beneficial steering flow for TCs making landfall. In EPW years, although TCs were less frequent, they had stronger intensity when making landfall and a longer lifetime over land which was mainly caused by a broad band of anomalous westerlies over the SCS giving rise to a belt of positive relative vorticity anomalies, as well as the slow translation speed of TCs before landfall supplying more energy for TCs to survive over land. Overall, we conclude that greater caution is warranted when TCs occur in LA and EPW years, as they may result in more serious disasters in China.

1. Introduction

Tropical cyclone (TC) landfalls result in strong wind gusts and heavy rainfall, causing major disasters including floods, landslides, and storm surges. About seven to nine TCs make landfall in China every year, inflicting huge losses to life and property [1,2]. Recently, the variability of TC activity over land, including the frequency, intensity, and precipitation, has become of great concern.
Currently, most researchers focus primarily on variations and characteristics of landfalling TC frequency [3,4,5,6,7] or the asymmetric spatial distribution of rainfall or hazardous weather onshore [8,9,10]. For example, Gao et al. [11] examined the impact of tropical North Atlantic (TNA) sea surface temperature anomalies (SSTA) on western North Pacific (WNP) landfalling TCs and found that TNA SSTA has a significant negative correlation with the frequency of TCs making landfall in China. Park et al. [12] studied the long-term changes in TCs making landfall in Korea and Japan, and pointed out that the power dissipation index (PDI) and TC-induced rainfall increased significantly between 1997 and 2008, which was mainly due to the increase in the number of landfalling TCs and the longer duration of TCs over land. Wang and Lee [13] noted that the global warming of the sea surface, associated with a secular increase of tropospheric vertical wind shear, caused a weak but robust downward trend in U.S. landfalling hurricanes. Yu et al. [14] proved by statistical analysis that, on average, axisymmetric rainfall is closely related to TC intensity.
However, relatively few studies have emphasized the intensity changes of TCs during their landfall. An increase in TC activity after landfall is particularly hazardous, since this is when most TC-related casualties occur. Taukey [15] explored pre-landfall changes in TC intensity, and showed that the spring-neap tidal pattern during pre-landfall and solar heating played important roles. Li et al. [16] investigated changes in the destructiveness of landfalling TCs over China. It was found that TCs making landfall over eastern China tended to be more destructive in recent decades, with a significant increase in PDI after landfall. Owning to the cast socioeconomic influences of landfalling TCs and their uncertain variation, a comprehensive study is essential to investigate changes in the destructiveness of landfalling TCs over China.
El Niño-Southern Oscillation (ENSO) is a powerful interplay between the tropical ocean and the atmosphere in the Pacific Basin. The modulation of TC activity by ENSO has been studied in terms of formation, track, intensity and landfall [17,18,19,20,21,22,23,24]. A number of studies on TC landfall under the influence of ENSO have been extensively carried out. Lyon and Camargo [25] examined a seasonal reversal in the ENSO rainfall signal in the north-central Philippines and found that tropical cyclone activity was enhanced (reduced) during the boreal summer of El Niño (La Niña (LA)) events. Wu et al. [22] and Liu and Chan [26] all detected that a strong El Niño event could reduce the number of landfalling TCs whereas more tropical cyclones tend to make landfall in years associated with LA events. Fudeyasu et al. [27] investigated the impact of ENSO on the landfall characteristics of TCs over the western North Pacific during the summer monsoon season, pointing out that an increase in the numbers of TCs that make landfall in the Korean Peninsula or Japan during the early monsoon period and the number of landfalling TCs was greater for El Niño during the peak monsoon period.
Over the past few years, a new type of Pacific warming has been described in the central Pacific (CP) Ocean, referred to as El Niño Modoki or CP El Niño (CPW) [28,29]. The mechanisms causing CPW, eastern Pacific (EP) El Niño (EPW) and LA to modulate TC variability have been investigated by many researchers [30,31,32]. Kim et al. [33] showed the different impacts of two distinctly different forms of tropical Pacific Ocean warming on the frequency and tracks of North Atlantic tropical cyclones. Furthermore, Chen and Tam [34] examined the relationship between two kinds of Pacific Ocean warming and TC frequency over the western North Pacific, finding that the Niño-3 index had a markedly negative significantly positive (negative) correlation with the TC frequency in the northern (southern) portion of the WNP. Li and Wang [35] further examined large-scale atmospheric responses to two types of ENSO events and studied their impact on TC activity in the western North Pacific by an atmospheric general circulation model. They claimed that the positive TC formation anomaly in CP El Niño shifts to the west in a pattern very different from EP El Niño. However, little attention has been paid to TC landfall in East Asia corresponding to different El Niño types. A recent study by Zhang et al. [36] examined the different El Niño types influence on TC landfall over East Asia and indicated that TCs were more likely to make landfall over East Asia because of a strong easterly steering flow anomaly during the summer of a CP El Niño year.
Most previous studies have focused primarily on the frequency or asymmetric precipitation of TC landfall in the Western Pacific, and relatively few have tried to investigate the characteristics of TC intensity variation during landfall. So, the objective of this study is to examine the impact of different types of ENSO (CPW, EPW, and LA) years on the intensity changes of landfalling TCs over China. This paper is organized as follows: Section 2 introduces the data and meteorology used in this study. Section 3 discusses the characteristics and distributions of landfalling TC intensity over China. Then, Section 4 explores the possible factors contributing to such differences. Finally, Section 5 provides the discussions and conclusions.

2. Data and Methodology

The TC data acquired from the China Meteorological Administration/Shanghai Typhoon Institute (CMA/STI) at 6-h intervals for the years between 1960 and 2016 were primarily used for this study. The CMA/STI dataset was used here because more observational data were available over land and used to produce the dataset. The CMA/STI best track dataset contains TC latitude, longitude, maximum sustained wind speed, and minimum sea level pressure at 6-h intervals.
Monthly atmospheric data for the same period were obtained from the National Centers for Environmental Prediction (NCEP)—National Center for Atmospheric Research (NCAR) reanalysis [37]. The monthly National Oceanic and Atmospheric Administration (NOAA) 2 × 2 Extended Reconstructed Sea Surface Temperature (ERSST) version 4 data were obtained from the NOAA’s website (http://www.cpc.ncep.noaa.gov/data/indices/) of NOAA. A landfalling TC in this study refers to any TC that crosses the coastline of China at least once during its lifetime.
The major concern of this study is to analyze the influence of different types of ENSO years on TCs making landfall in China. Since the Niño-3.4 index may mix EP warming with CP warming, the EMI and Niño-3 index were introduced to distinguish two types of Pacific warming events [33,34,35,36]. To compare the impacts of different Pacific warmings on landfalling TCs, the Niño-3 index, Niño-4 index, Niño-3.4 index and EMI were employed to examine their associations with TC landfall in China. The monthly Niño-3.4, Niño-3, and Niño-4 indices were directly downloaded from NOAA Climate Prediction Center (http://www.cpc.ncep.noaa.gov/data/indices/sstoi.indices). The EMI [28] was used to measure the SSTA in the center Pacific. It is defined as
EMI = [SSTA]A − 0.5[SSTA]B − 0.5[SSTA]C
where [SSTA]A, [SSTA]B, and [SSTA]C indicate the SSTA averaged over the regions of (10° S–10° N, 165° E–140° W), (15° S–5° N, 110° W–70° W), and (10° S–20° N, 125° E–145° E), respectively. The EMI can also be downloaded (http://www.jamstec.go.jp/frcgc/research/d1/iod/modoki_home.html.en). After removing the linear trends of the indices, the CPW (EPW) events were associated with the maximum SSTA in the eastern Pacific and required the 5-month (JJASO months, from June to October) running means of SSTA in the EMI (Niño-3 index) region to exceed one standard deviation. Similarly, the LA events were defined by if the 5-month (JJASO months) running means of SSTA in the Niño 3.4 region were cooler than one standard deviation [33,34,35,36]. Subsequently, 8 years with JJASO characterized by CPW (1966, 1967, 1977, 1990, 1991, 1994, 2002, and 2004), 7 years with JJASO characterized by EPW (1965, 1972, 1982, 1987, 1997, 2009, and 2015), and 10 years with JJASO characterized by LA (1964, 1970, 1971, 1973, 1975, 1988, 1998, 1999, 2007, and 2010) were defined accordingly. The composites of SSTA for CPW, EPW, and LA events during the mature stage of ENSO are shown in Figure 1 (blue rectangle).
Many metrics have been used to characterize tropical cyclone activity, such as the accumulated cyclone energy (ACE) index [38,39,40], integrated kinetic energy (IKE), [41] and PDI [42,43,44]. One common measure of the potential destructiveness of TCs is the PDI, which is defined as the sum of the cubes of the maximum sustained wind speed over the entire lifetime of a TC [12,16]. The accumulated PDI is calculated by summing the individual PDIs over a particular year. The accumulated TC PDI is defined as
PDI = n = 1 N t = 1 T v m a x 3
where N is the total number of landfalling TCs in certain years, and T is the duration of landfalling TCs after making landfall. This definition of the accumulated PDI was obtained from Emanuel [42]. The average PDI was obtained by dividing the number of landfalling TCs.

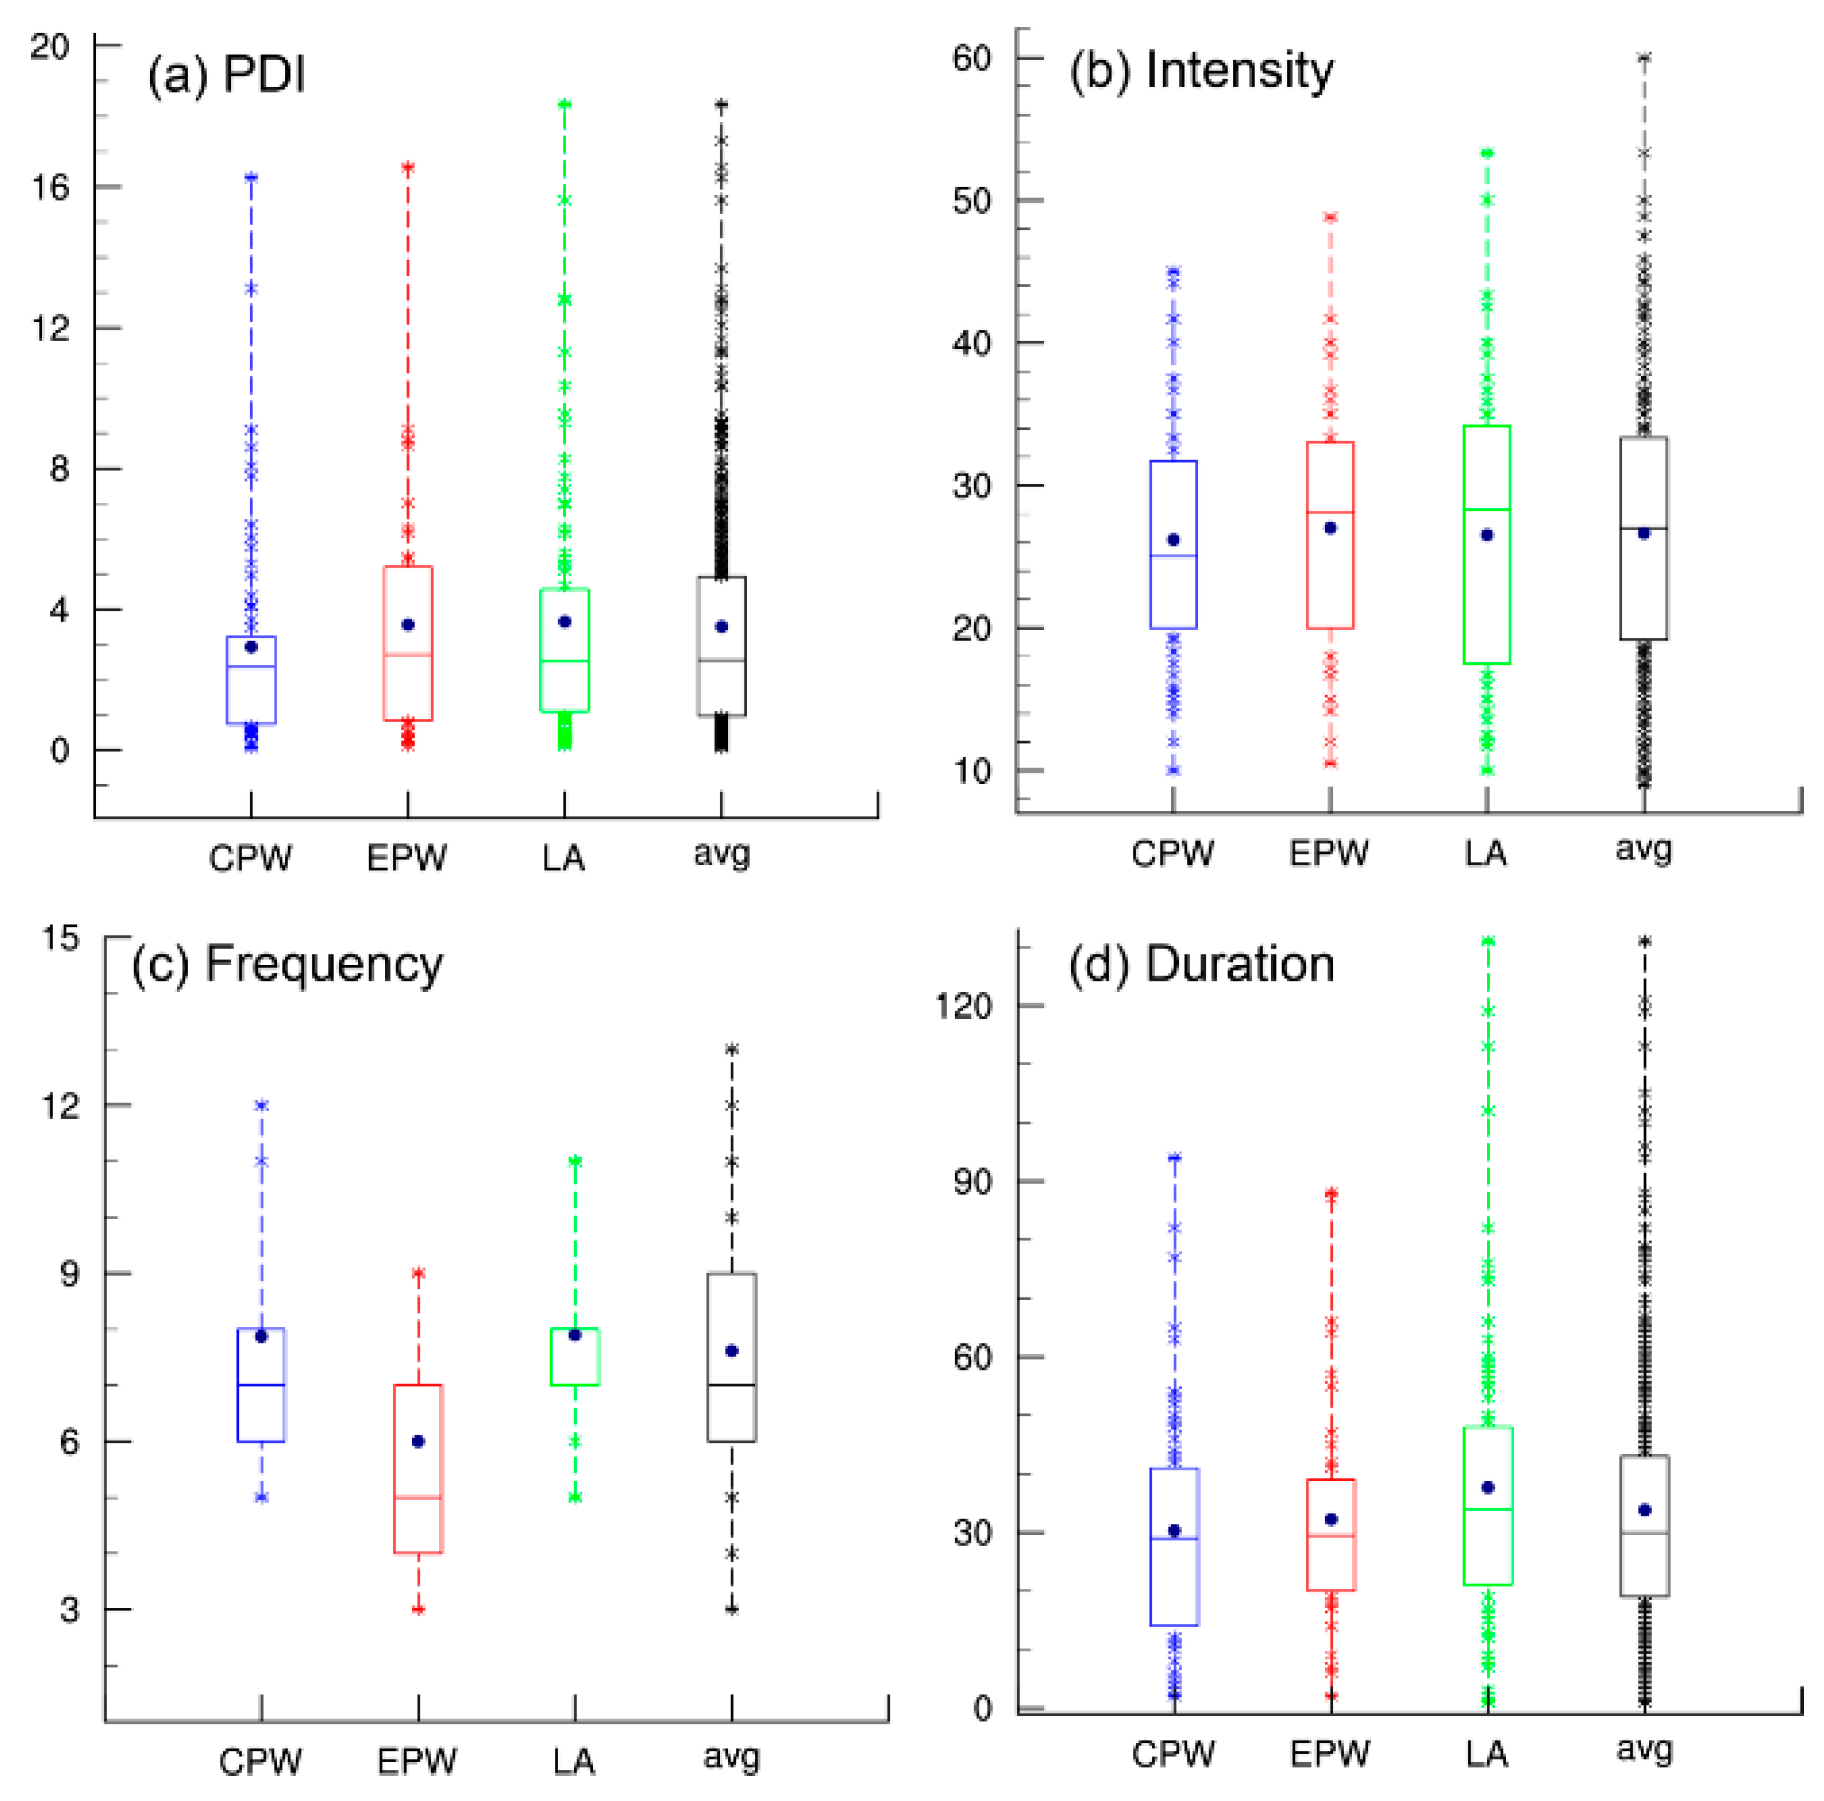
3. Characteristics of Landfalling Intensity

The observed characteristics of landfalling TCs over China during the defined CPW, EPW, and LA years are given in Table 1. This table shows that the average frequency of landfalling TCs generated in EPW years was much smaller than in CPW and LA years, which was significant at 85% confidence based on the Student’s t-test. This phenomenon has been proved by many previous studies [30,35,36]. The primary reason for this is that most TCs preferred to generate in the eastern Pacific during EPW years, which is far away from China. When they traveled a long distance to reach China, a number of them were weakened or underwent recurvature. Thus, in terms of the ratio between the number of landfalling TCs over China and the number of TCs generated over the WNP, more landfalling TCs were available in LA years with the ratio of 24.3%, which was larger than that in CPW and EPW years. In addition to the frequency of landfall, it is worth noting that the mean duration of TCs generated over the WNP associated with EPW years was much longer than that in CPW and LA years, which was mainly due to their long travels through warm water over the central Pacific. In terms of the ratio between the whole lifetime of TCs generated over the ocean and their lifetime after landfall, the TCs in LA years spent more time over land, with a proportion of 26.3%, which was larger than that in CPW and EPW years. Therefore, it can be concluded that we should be more cautious when TCs occur in LA years, because there are more TCs making landfall and staying over land for a longer time, which may cause more serious disasters in China.
Figure 2 displays the characteristics distribution of the average PDI, landfalling intensity, landfalling frequency and mean duration after landfall in different ENSO types and in total average during period of 1960–2016. As for PDI during landfall, the significant differences between different ENSO types were evident. The mean and median distribution of the PDI in LA and EPW years was shifted to larger values than that in CPW years. A closer look at the TC-related parameters suggests that although the frequency of TC landfall was larger in CPW years, the mean duration after landfall was noticeably large in LA years and the mean maximum intensity was a bit larger in EPW years. Thus, the PDI in LA and EPW years were larger than that in CPW years. Compared these TC activity metrics in different ENSO states (color boxes in Figure 2) with the total average (black box in Figure 2), it was shown that the metrics in LA years was almost higher than these in total average, while the metrics in CPW years was largely lower than these in total average, indicating that the TC activities in CPW years were inactive. Further analysis on PDI in CPW and EPW years showed that the primary difference between these two ENSO years was the moderate intensity of PDI (Figure 3). The probability of PDI occurrence was similar in lowest and highest parts of PDI in CPW and EPW years, while it was notably larger in the middle parts of PDI in EPW years than in CPW years, leading to the higher PDI in EPW years as a whole.
Many previous researchers have shown that different seasons [22,23,24,25,35,36] and different locations where TCs make landfall [16,26,45] have different influences on landfalling TCs in East Asia. Therefore, in this study, we intend to further analyze the impact of different landing locations and different seasonal changes on landfalling TCs in different types of ENSO. The peak TC season (JJASON) was divided into two parts: summer (JJA) and autumn (SON). The landfall location was subdivided into South China (SC) and East China (EC) by an artificial boundary line along 25° N [16]. Figure 4, Figure 5, Figure 6 and Figure 7 display the distribution of landfall intensity, landfall frequency, mean duration after landfall, and average PDI associated with TCSC, TCEC, TCJJA, and TCSON.
It can be seen that there were no significant differences in landfall intensity over SC and EC across EPW, CPW, and LA years (Figure 4 and Table 2), while during the autumn season, the landfall intensity (with the average of 28.7 m/s) was much stronger than that in the summer (25.67 m/s), especially in EPW and LA years. As for landfall frequency (Figure 5), the number of landfalling TCs in the summer was much greater than that in autumn. During the summer, the landfall frequency was highest in CPW years, while during autumn it was highest in the LA years compared with the other two ENSO events. According to the landing locations, there was an obvious tendency toward a larger number of TCs in CPW and LA years making landfall along the SC coast. Every year, an average of about 70% of TCs struck the SC coast [16]. In LA years, 84% of TCs (6.7) made landfall over SC, which was much higher than the mean, and the remaining 16% (1.3) struck the EC coast. Some researchers have proved that the westward shift in the mean genesis position, together with the strong subtropical ridge, favors a steering toward the South China Sea (SCS) [22]. In terms of the mean duration of landfalling TCs (Figure 6), it can be seen that the duration of TCEC was much longer than that of TCSC, especially during EPW and LA years. An explanation for this is that some TCs making landfall over the EC coast will be recurved and moved back over the ocean again, thus prolonging their lifetimes, and some other TCEC will interact with mid-latitude weather systems, such as the mid-tropopause trough, resulting in TC deformation. This process can also extend the life span of landfalling TCs. In addition, duration of TCs in summer is greater than that in autumn, especially in LA years.
Therefore, the distribution of landfalling TCs in three ENSO phases are significantly different from each other. Finally, the different characteristics of landfalling TCs lead to different distributions of PDI over land (Figure 7). In summer, the TCs in LA years may cause more disastrous losses in China, while in autumn, we should enhance alertness about TCs in EPW years. A notably larger PDI occurred in EPW years during in autumn with significant over 80% confidence level (Table 2). In addition, there were a markedly larger PDI of TCSC occurred in EPW years and a larger PDI of TCEC usually occurred in LA years, compared with CPW years, which were all significant over 80% confidence level (Table 2). The TC-related parameters show that the distribution of PDI in the summer season was mainly decided by TC duration after landfall, and the PDI in the autumn season was primarily due to the increase in landfall intensity. The larger PDI of TCSC occurring in EPW years and the larger PDI of TCEC occurring in LA years were mainly due to the combination of the intensity and the duration of landing time of TCs. The significant differences of TCs activities metrics in different ENSO stages can be found in Table 2. Thus, it was found that TCs in LA years generally had larger power dissipation index (PDI) and may cause more disastrous losses over China, while TCs in EPW years had larger PDI over South China in autumn.
Based on the aforementioned data, it can be found that the TCs in LA years were generally stronger, of higher frequency, and of longer duration over China, and therefore, more likely to cause serious damage in China. In EPW years, although TCs had low frequency, they generally had stronger landfalling intensity and a longer lifetime over land. However, the highly frequent landfalling TCs in CPW years had a weaker intensity and a shorter duration of landing time, resulting in the lowest PDI over China.

4. Large-Scale Circulation Analysis

Previous section has examined the characteristics of landfalling TCs during different ENSO states. The following section will discuss several factors that play crucial roles in characteristics of intensity variation of landfalling TCs over China.

4.1. Thermodynamic Factors

To analyze the difference in variation between different ENSO states, the composite SSTAs during CPW, EPW and LA years are illustrated in Figure 1. There was a significant increase in SSTAs offshore of mainland China mainland (area over 10° N–30° N, 110° E–130° E, in red rectangle) in LA years, which was much larger than that in CPW and EPW years. The warmer sea surface could convey a large amount of energy to TCs before they made landfall, as a result these TCs could be enhanced and sustained for a longer lifetime, leading to more disastrous losses in China during LA years.
The anomalous mid-level moisture was also one of the important factors affecting TC intensity and track. The dry mid-levels are not conducive to the development of TC activities [46]. Figure 8 shows the composite of relative humility (RH) anomalies at 850 hPa in different seasons (JJA and SON) for each of three ENSO phases. In CPW, the decrease of midlevel RH over the China coastal area and adjacent sea led to weakened landfalling TC activities, regardless of if it was in JJA or SON seasons. For LA events, the pattern was generally the opposite of that in the CPW years, with positive RH anomalies over the southern and eastern China seas, especially the pattern in the SON of LA years. This pattern in LA years provided favorable condition for maintaining the intensity and lifetime of landfalling TCs over China which were consistent with the statistical results. As for RH distribution in EPW years, there was a range of weak positive anomalies over the south and a range of weak negative anomalies over the east coast of China in summer, which was conducive to stronger TCs making landfall over South China and weaker TCs making landfall over East China.

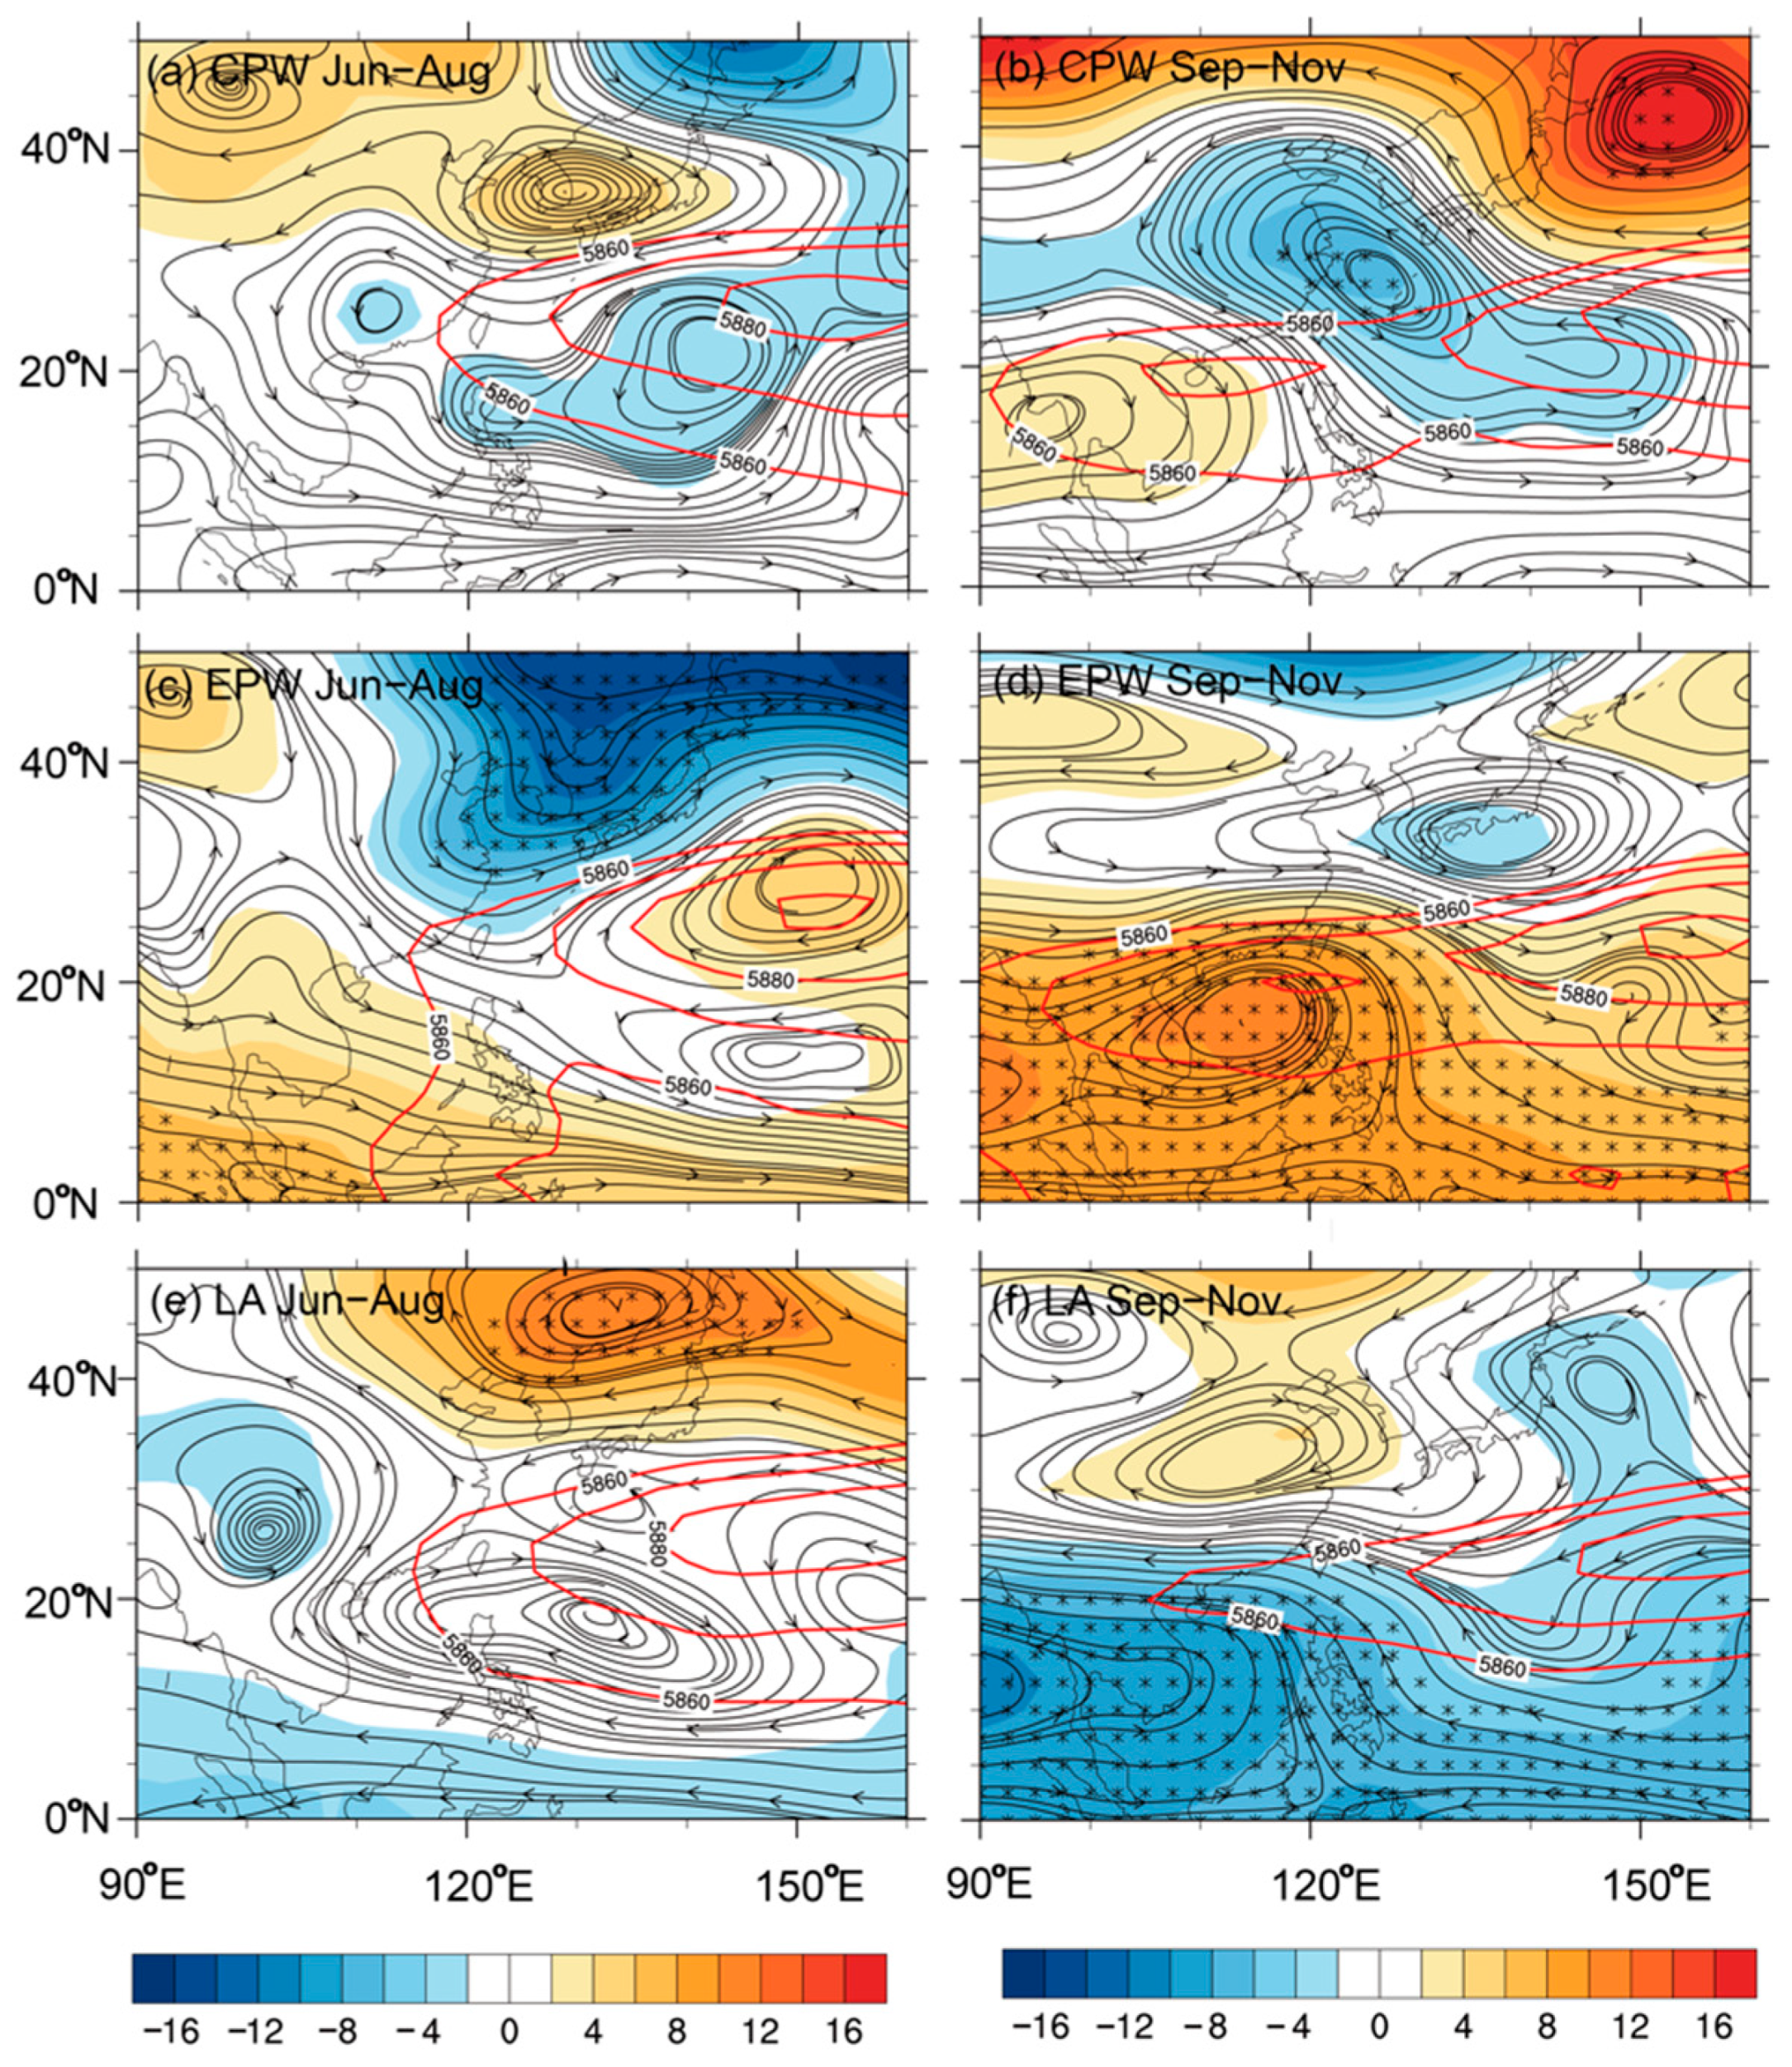
4.2. Atmospheric Circulation

In addition to thermodynamics, TC activity is also influenced by large-scale dynamic factors [47]. It is known that the zonal and meridional location of the monsoon trough [48] is one of the most important influences governing TC activities over the northwestern part of the western Pacific. Figure 9 shows the composite of the geopotential height anomaly and the wind vector anomaly at 850 hPa. In CPW, there was an obvious anomalous low-level cyclonic circulation over the central mid-latitude Pacific, which intensified the eastward extension of the monsoon trough that was conducive to development of TC activities [48]. Frank [49] claimed that flow intensification on either side of the monsoon trough increased the low-level vorticity and enhanced TC activity. Compared with the circulation in JJA, the cyclone area retracted from the China coastal area to almost 130° N in the SON of CPW years. This means that the area conducive to TC activity has been reduced over the China coastal area and offshore area. In general, the low-level flow contributed positively to the TCs enhancement before landfall in CPW years. In EPW years, the anomalous anticyclonic circulation over the central Pacific led to the suppression of TC activity. However, there was still a small range of cyclonic circulation that occurred over the eastern coast of China in the JJA of EPW years. Further, there was a broad band of anomalous westerlies over the SCS and Philippine area in the JJA of CPW and EPW years. Such westerly anomalies gave rise to a belt of positive relative vorticity anomalies from the tropical area to the northern part of the SCS, which resulted in a stronger monsoon trough in this region, thus favoring TC activity over the SCS [26]. Therefore, it can be seen that there was favorable circulation for TCs activity in the summer of CPW and EPW years. However, during autumn, the anomalous westerlies propagated eastward and weakened; thus, the monsoon trough became weaker in this region, which did not favor TC activity. The circulation pattern in LA years was nearly the mirror image of CPW conditions. There was anticyclonic circulation over the central Pacific and a cyclonic circulation occurred over China in the JJA of LA years, which was favorable to the long-term life of TCs over land. Also, a significant anomalous cyclone occupied the SCS in the SON season, resulting in enhanced TCs when they made landfall [24]. In contrast, there was a belt of easterly anomalies that occurred over the SCS in the JJA, which depressed TC activity over the SCS. During autumn, the westerly anomalies from the Indian Ocean shifted eastward and dominated the SCS, leading to positive vorticity anomalies in this region. This comprehensive effect in LA years explained the statistical results that TCs had a longer lifetime over land in LA years than in other ENSO phases and had a stronger intensity and a higher frequency of making landfall in the SON.
The movements of TCs are largely controlled by the surrounding environmental flow in the troposphere. An integrated flow through a layer of the atmosphere from 850 to 300 hPa is usually defined as the TC steering flow [35]. A composite of wind anomalies and geopotential height are shown in Figure 10. The 5880-gpm contour represents the position of the subtropical high [50,51]. The subtropical high in EPW and CPW years covered a larger area with a stronger intensity and extended farther westward in comparison to LA years whether in the JJA or SON seasons. However, during the late season of EPW and CPW years, the subtropical high split into two separate cells at about 130° N, which helped TCs to recurve north or northeast before landfall [22,52]. Thus, this partly explains the smaller number of landfalling TCs over China in the SON of EPW and CPW years. The TC steering flow in the JJA for EPW was associated with the westerly anomalies in the tropics and an anomalous cyclone along eastern China coast. This TC steering flow pattern was unfavorable for TCs to take a westward track and make landfall over China [35,36,52]. In CPW years, the TC steering flow showed weaker westerly anomalies in the tropics and the southeasterly anomalies over the China coastal area in the JJA season, which enhanced the possibility of TCs making landfall over China. Thus, in summer, there was an increased number of TCs making landfall over China in CPW years compared with EPW years. In autumn (SON) for CPW, the southeasterly anomalies changed into northwesterly anomalies, which was not conducive to landfalling TCs. The TC steering flow for LA years showed easterly anomalies in the tropics with weak southeasterly wind in summer and strong southwesterly wind in autumn over the southern coast of China. Because the TCs formed more westward, they may have been steered by strong easterlies to make landfall over China. Therefore, there were more TCs making landfall over southeast China in LA years, especially in autumn, which is consistent with the distributions of the observed TC activities [36].
The inter-annual variation of the vertical wind shear (VWS) causes different TC activities in different ENSO phases. The VWS is calculated as the magnitude of the vector difference between winds at 200 and 850 hPa. Strong VWS inhibits the formation and development of TCs, while weak VWS promotes TC activities [53]. Figure 11 displays the distribution of VWS for each of the three regimes in different seasons. For CPW years, the reduction of VWS over the China coastal area and the offshore area contributed to the enhancement of landfalling TC activities in the summer [36], allowing landfalling TCs passage through the weak shear region across the east coast of China. In the SON for CPW years, there was a mirror image of VWS distribution in the JJA. In an EPW event, there were almost positive anomalies in summer and autumn over the China coastal area and adjacent sea area, depressing TC development when they were approaching and making landfall. The distribution of VWS in LA years provided a mirror image of the EPW years, which offered more favorable conditions for landfalling TCs with negative anomalies over China, especially in autumn, resulting in stronger TCs making landfall in autumn.
Upper-level divergence is associated with low-level convergence or surface low-pressure area development. Surface low pressure areas require divergence aloft to continue deepening. The composite divergence at 200 hPa in various ENSO phases is shown in Figure 12. There was a large range of weak negative anomalies that occurred over China in CPW years, while a large range of weak positive anomalies occurred over China in LA years and in the SON of EPW years. This provided more favorable conditions for landfalling TC development in EPW and LA years. Further, there was significant divergence in the eastern part of China generally in the JJA of EPW years, which maintained TC development over the east coast of China. Thus, it was an important reason for there being TCs with a longer lifetime over land along the East China coast.
Apart from the large environmental circulation, the mean translation speed over open sea before landfall is also important for TC intensity [16]. When the storm moves slowly with warmer SSTA, it can absorb more energy from the ocean, which favors its development. Figure 13 shows the differences in mean translation speed between different ENSO phases. In summer, the translation speed of TCs before landfall was faster in CPW than EPW and LA years generally. Thus, TC could stay longer over the open ocean and obtained more energy that enhanced TC landfall intensity and survival over land in EPW and LA years. This can help explain the increase in TC landfall intensity and lifetime over land in EPW and LA years in summer. A similar phenomenon occurred for TCs when they made landfall on the south coast of China. However, the translation speed in autumn for EPW years was smaller than that of CPW years when they moved into SCS, after which they became larger when they approached land. Thus, the lifetime of TCs over land was shorter than that in CPW years in autumn.

5. Summary and Conclusions

An increase in TC activities after landfall is particularly hazardous, since this is when most TC-related casualties occur after landfall. The impact of different types of ENSO (CPW, EPW, and LA) years on the intensity changes of landfalling TCs over China has not been well examined compared with the characteristics of landfalling TC frequency or the asymmetric spatial distribution of TC rainfall. Thus, a composite statistical analysis was conducted on the intensity variation of TCs making landfall over China.
In this study, the peak TC season (JJASON) was divided into two parts: summer (JJA) and autumn (SON). Also, the landfall location was subdivided into South China (SC) and East China (EC) by an artificial boundary line along 25° N. The TCs in LA years generally had a larger PDI and may have caused more disastrous losses over China, while the TCs in EPW years had a larger PDI over South China in autumn. A larger PDI of TCSC usually occurred in EPW years and a larger PDI of TCEC occurred in LA years, compared with CPW years. The TC-related parameters showed that the distribution of PDI in the summer season was mainly decided by the duration of TCs after landfall, and the PDI in the autumn season was primarily due to the increase in landfall intensity. The larger PDI of TCSC that occurred in EPW years and the larger PDI of TCEC that occurred in LA years were mainly due to the combination of the intensity and the duration of landing time of TCs.
The reasons for this phenomenon were complicated. In LA years, landfalling TCs were stronger, more frequent, and of longer duration over China, which increased the possibility of causing serious damage in China. This was because almost all the primary environmental factors were conducive to maintaining and enhancing TCs over land, including the significant anomalous cyclone that occupied the SCS with positive RH anomalies, the easterly anomalous wind providing a beneficial steering flow for TCs making landfall and the reduction of VWS over the China coastal area. Moreover, the slow translation speed of TCs before landfall in LA years during summer supplied TCs making landfall over China with more energy to survive over land. Thus, there the TCs in LA years had a longer lifetime and were stronger TCs over China.
In EPW years, although TCs were less frequent, they generally had a stronger intensity when making landfall and a longer lifetime over land. The reasons for this were that there was a broad band of anomalous westerlies over the SCS and Philippine area in the JJA of EPW years, which gave rise to a belt of positive relative vorticity anomalies and resulted in a stronger monsoon trough in this region, therefore favoring TC activities over the SCS. In addition, the stronger subtropical high, the divergence anomalies, and the slow translation speed of TCs before landfall all provided favorable conditions for TC development over China and its offshore sea. The split subtropical high over the western Pacific caused TCs to recurve north or northeast before landfall, leading to less TCs reaching mainland China [26,54].
The TCs making landfall over China in CPW years were of weaker intensity and had a shorter duration of landing time, which caused the lowest PDI over China. Unlike the environmental distribution in EPW and LA years, there were disadvantageous environmental conditions with negative anomalous RH, enhanced VWS, high-level convergence anomalies, and faster translation speed, which all depressed TC enhancement over mainland China.
Overall, we concluded that more attention should be paid to TCs that occur in LA and EPW years, as they may cause more serious disasters in China. A better understanding of the mechanisms responsible for the inter-annual or inter-decadal variation of TC activities may be helpful for the effective mitigation and reduction of TC disasters. Thus, follow-up studies will be needed to investigate the intensity variation before or during landfall over China, and to further examine the underlying factors by typical case analysis.

Funding

This study has been supported in part by the National Key R&D Program of China under grants 2017YFC1501602, the National Basic Research and Development Project (973 program) of China under contract no. 2015CB452805 and in part by National Natural Science Foundation of China under grants 41675044, 41705027, 41730960, and 41875114 and the Basic Research Fund of CAMS 2017Y013.

Acknowledgments

The FNL data used in this study were downloaded from https://rda.ucar.edu/datasets/ds083.2/. All figures were produced using the NCAR Command Language (NCL). The TC best track data were obtained from STI/CMA (http://tcdata.typhoon.org.cn). The Administration Extended Reconstructed Sea Surface Temperature (ERSST) version 4 data were obtained from (http://www.cpc.ncep.noaa.gov/data/indices/). The monthly Niño-3.4, Niño-3, and Niño-4 indices were directly downloaded from the NOAA Climate Prediction Center website (http://www.cpc.ncep.noaa.gov/data/indices/sstoi.indices). The EMI can also be downloaded from (http://www.jamstec.go.jp/frcgc/research/d1/iod/modoki_home.html.en).

Conflicts of Interest

The author declares that there are no conflicts of interest regarding the publication of this paper.

References

  1. Zhang, Q.; Wu, L.; Liu, Q. Tropical cyclone damages in China 1983–2006. Bull. Am. Meteorol. Soc. 2009, 90, 489–496. [Google Scholar] [CrossRef]
  2. Lu, X.; Zhao, B. Analysis of the climatic characteristics of landing tropical cyclones in East China. J. Trop. Meteorol. 2013, 19, 145. [Google Scholar]
  3. Kubota, H.; Chan, J.C. Interdecadal variability of tropical cyclone landfall in the Philippines from 1902 to 2005. Geophys. Res. Lett. 2009, 36, 38108. [Google Scholar] [CrossRef]
  4. Weinkle, J.; Maue, R.; Pielke, R., Jr. Historical global tropical cyclone landfalls. J. Clim. 2012, 25, 4729–4735. [Google Scholar] [CrossRef]
  5. Lyons, S.W. US tropical cyclone landfall variability: 1950–2002. Wea. Forecast. 2004, 19, 473–480. [Google Scholar] [CrossRef]
  6. Choi, K.S.; Kim, B.J.; Kim, D.W.; Byun, H.R. Interdecadal variation of tropical cyclone making landfall over the Korean Peninsula. Int. J. Climatol. 2010, 30, 1472–1483. [Google Scholar] [CrossRef]
  7. Park, D.S.R.; Ho, C.H.; Kim, J.H.; Kim, H.S. Spatially inhomogeneous trends of tropical cyclone intensity over the western North Pacific for 1977–2010. J. Clim. 2013, 26, 5088–5101. [Google Scholar] [CrossRef]
  8. Chan, J.C.; Liu, K.S.; Ching, S.E.; Lai, E.S. Asymmetric distribution of convection associated with tropical cyclones making landfall along the South China coast. Mon. Weather Rev. 2004, 132, 2410–2420. [Google Scholar] [CrossRef]
  9. Wang, C.; Wang, X. Classifying El Niño Modoki I and II by different impacts on rainfall in southern China and typhoon tracks. J. Clim. 2013, 26, 1322–1338. [Google Scholar] [CrossRef]
  10. Yu, Z.; Wang, Y.; Xu, H. Observed rainfall asymmetry in tropical cyclones making landfall over China. J. Appl. Meteorol. Climatol. 2015, 54, 117–136. [Google Scholar] [CrossRef]
  11. Gao, S.; Chen, Z.; Zhang, W. Impacts of Tropical North Atlantic SST on Western North Pacific Landfalling Tropical Cyclones. J. Clim. 2018, 31, 853–862. [Google Scholar] [CrossRef]
  12. Park, D.S.R.; Ho, C.H.; Kim, J.H.; Kim, H.S. Strong landfall typhoons in Korea and Japan in a recent decade. J. Geophys. Res. Atmos. 2011, 116, 14801. [Google Scholar] [CrossRef]
  13. Wang, C.; Lee, S.K. Global warming and United States landfalling hurricanes. Geophys. Res. Lett. 2008, 35, 32396. [Google Scholar] [CrossRef]
  14. Yu, Z.; Wang, Y.; Xu, H.; Davidson, N.; Chen, Y.; Chen, Y.; Yu, H. On the Relationship between Intensity and Rainfall Distribution in Tropical Cyclones Making Landfall over China. J. Appl. Meteorol. Climatol. 2017, 56, 2883–2901. [Google Scholar] [CrossRef]
  15. Yaukey, P. Wind speed changes of North Atlantic tropical cyclones preceding landfall. J. Appl. Meteorol. Climatol. 2011, 50, 1913–1921. [Google Scholar] [CrossRef]
  16. Li, R.C.Y.; Zhou, W.; Shun, C.M.; Lee, T.C. Change in destructiveness of landfalling tropical cyclones over China in recent decades. J. Clim. 2017, 30, 3367–3379. [Google Scholar] [CrossRef]
  17. Camargo, S.J.; Sobel, A.H. Western North Pacific tropical cyclone intensity and ENSO. J. Clim. 2005, 18, 2996–3006. [Google Scholar] [CrossRef]
  18. Chan, J.C.L.; Xu, M. Inter-annual and inter-decadal variations of landfalling tropical cyclones in East Asia. Part I: Time series analysis. Int. J. Climatol. 2009, 29, 1285–1293. [Google Scholar] [CrossRef]
  19. Chu, P.S. ENSO and tropical cyclone activity. In Hurricanes and Typhoons: Past, Present, and Potential; Murnane, R.J., Liu, K.B., Eds.; Columbia University Press: New York, NY, USA, 2004; pp. 297–332. [Google Scholar]
  20. Goh, A.Z.C.; Chan, J.C.L. Interannual and interdecadal variations of tropical cyclone activity in the South China Sea. Int. J. Climatol. 2010, 30, 827–843. [Google Scholar] [CrossRef]
  21. Larson, J.; Zhou, Y.; Higgins, R.W. Characteristics of landfalling tropical cyclones in the United States and Mexico: Climatology and interannual variability. J. Clim. 2005, 18, 1247–1262. [Google Scholar] [CrossRef]
  22. Wu, M.C.; Chang, W.L.; Leung, W.M. Impacts of El Niño–Southern Oscillation events on tropical cyclone landfalling activity in the western North Pacific. J. Clim. 2004, 17, 1419–1428. [Google Scholar] [CrossRef]
  23. Wu, G.; Lau, N.-C. A GCM simulation of the relationship between tropical-storm formation and ENSO. Mon. Weather Rev. 1992, 120, 958–977. [Google Scholar] [CrossRef]
  24. Zhang, W.; Vecchi, G.A.; Murakami, H.; Delworth, T.; Wittenberg, A.T.; Rosati, A.; Underwood, S.; Anderson, W.; Harris, L.; Gudgel, R.; et al. Improved Simulation of Tropical Cyclone Responses to ENSO in the Western North Pacific in the High-Resolution GFDL HiFLOR Coupled Climate Model. J. Clim. 2016, 29, 1391–1415. [Google Scholar] [CrossRef]
  25. Lyon, B.; Camargo, S.J. The seasonally-varying influence of ENSO on rainfall and tropical cyclone activity in the Philippines. Clim. Dyn. 2009, 32, 125–141. [Google Scholar] [CrossRef]
  26. Liu, K.S.; Chan, J.C.L. Climatological characteristics and seasonal forecasting of tropical cyclones making landfall along the South China coast. Mon. Weather Rev. 2003, 131, 1650. [Google Scholar] [CrossRef]
  27. Fudeyasu, H.; Iizuka, S.; Matsuura, T. Impact of ENSO on landfall characteristics of tropical cyclones over the western North Pacific during the summer monsoon season. Geophys. Res. Lett. 2006, 33, 27449. [Google Scholar] [CrossRef]
  28. Ashok, K.; Behera, S.K.; Rao, S.A.; Weng, H.; Yamagata, T. El Niño Modoki and its possible teleconnection. J. Geophys. Res. Oceans 2007, 112, 3798. [Google Scholar] [CrossRef]
  29. Weng, H.; Ashok, K.; Behera, S.K.; Rao, S.A.; Yamagata, T. Impacts of recent El Niño Modoki on dry/wet conditions in the Pacific rim during boreal summer. Clim. Dyn. 2007, 29, 113–129. [Google Scholar] [CrossRef] [Green Version]
  30. Kim, H.M.; Webster, P.J.; Curry, J.A. Modulation of North Pacific tropical cyclone activity by three phases of ENSO. J. Clim. 2011, 24, 1839–1849. [Google Scholar] [CrossRef]
  31. Lee, S.K.; Wang, C.; Enfield, D.B. On the impact of central Pacific warming events on Atlantic tropical storm activity. Geophys. Res. Lett. 2010, 37, 44459. [Google Scholar] [CrossRef]
  32. Wang, L.; Huang, R.; Wu, R. Interdecadal variability in tropical cyclone frequency over the South China Sea and its association with the Indian Ocean sea surface temperature. Geophys. Res. Lett. 2013, 40, 768–771. [Google Scholar] [CrossRef] [Green Version]
  33. Kim, H.M.; Webster, P.J.; Curry, J.A. Impact of shifting patterns of Pacific Ocean warming on North Atlantic tropical cyclones. Science 2009, 325, 77–80. [Google Scholar] [CrossRef]
  34. Chen, G.; Tam, C.Y. Different impacts of two kinds of Pacific Ocean warming on tropical cyclone frequency over the western North Pacific. Geophys. Res. Lett. 2010, 37, 41708. [Google Scholar] [CrossRef]
  35. Li, C.; Wang, C. Simulated impacts of two types of ENSO events on tropical cyclone activity in the western North Pacific: Large-scale atmospheric response. Clim. Dyn. 2014, 42, 2727–2743. [Google Scholar] [CrossRef]
  36. Zhang, W.; Graf, H.F.; Leung, Y.; Herzog, M. Different El Niño types and tropical cyclone landfall in East Asia. J. Clim. 2012, 25, 6510–6523. [Google Scholar] [CrossRef]
  37. Kalnay, E.; Kanamitsu, M.; Kistler, R.; Collins, W.; Deaven, D.; Gandin, L.; Iredell, M.; Saha, S.; White, G.; Woollen, J.; et al. The NCEP/NCAR 40-year reanalysis project. Bull. Am. Meteorol. Soc. 1996, 77, 437–472. [Google Scholar] [CrossRef]
  38. Bell, G.D.; Chelliah, M. Leading tropical modes associated with interannual and multidecadal fluctuations in North Atlantic hurricane activity. J. Clim. 2006, 19, 590–612. [Google Scholar] [CrossRef]
  39. Camargo, S.J.; Sobel, A.H. Formation of tropical storms in an atmospheric general circulation model. Tellus 2004, 56A, 56–67. [Google Scholar] [CrossRef]
  40. Trenberth, K. Uncertainty in hurricanes and global warming. Science 2005, 308, 1753–1754. [Google Scholar] [CrossRef] [PubMed]
  41. Powell, M.D.; Reinhold, T.A. Tropical cyclone destructive potential by integrated kinetic energy. Bull. Am. Meteorol. Soc. 2007, 88, 513–526. [Google Scholar] [CrossRef]
  42. Emanuel, K. Increasing destructiveness of tropical cyclones over the past 30 years. Nature 2005, 436, 686. [Google Scholar] [CrossRef] [PubMed]
  43. Emanuel, K. Environmental factors affecting tropical cyclone power dissipation. J. Clim. 2007, 20, 5497–5509. [Google Scholar] [CrossRef]
  44. Kossin, J.P.; Knapp, K.R.; Vimont, D.J.; Murnane, R.J.; Harper, B.A. A globally consistent reanalysis of hurricane variability and trends. Geophys. Res. Lett. 2007, 34, 28836. [Google Scholar] [CrossRef]
  45. Corporal-Lodangco, I.L.; Leslie, L.M.; Lamb, P.J. Impacts of ENSO on Philippine tropical cyclone activity. J. Clim. 2016, 29, 1877–1897. [Google Scholar] [CrossRef]
  46. Camargo, S.; Sobel, A.H.; Barnston, A.G.; Emanuel, K.A. Tropical cyclone genesis potential index in climate models. Tellus 2007, 59A, 428–443. [Google Scholar] [CrossRef]
  47. Gray, W.M. Hurricanes: Their formation, structure and likely role in the tropical circulation. In Meteorology over the Tropical Oceans; Shaw, D.B., Ed.; Royal Meteorological Society: Bracknell, UK, 1979; pp. 155–218. [Google Scholar]
  48. Chia, H.H.; Ropelewski, C.F. The interannual variability in the genesis location of tropical cyclones in the northwest Pacific. J. Clim. 2002, 15, 2934–2944. [Google Scholar] [CrossRef]
  49. Frank, W.M. Tropical cyclone formation. In A Global View of Tropical Cyclones; Elsberry, R., Ed.; Office of Naval Research: Arlington, VA, USA, 1987; pp. 53–90. [Google Scholar]
  50. Nitta, T.; Hu, Z.Z. Summer climate variability in China and its association with 500 hPa height and tropical convection. J. Meteorol. Soc. Jpn. Ser. II 1996, 74, 425–445. [Google Scholar] [CrossRef]
  51. Tu, J.Y.; Chou, C.; Chu, P.S. The abrupt shift of typhoon activity in the vicinity of Taiwan and its association with western North Pacific–East Asian climate change. J. Clim. 2009, 22, 3617–3628. [Google Scholar] [CrossRef]
  52. Wang, B.; Chan, J.C.L. How strong ENSO events affect tropical storm activity over the western North Pacific. J. Clim. 2002, 15, 1643–1658. [Google Scholar] [CrossRef]
  53. Clark, J.D.; Chu, P.S. Interannual variation of tropical cyclone activity over the central North Pacific. J. Meteorol. Soc. Jpn. Ser. II 2002, 80, 403–418. [Google Scholar] [CrossRef]
  54. Zhang, W.; Leung, Y.; Chan, J.C. The Analysis of Tropical Cyclone Tracks in the Western North Pacific through Data Mining. Part I: Tropical Cyclone Recurvature. J. Appl. Meteorol. Climatol. 2013, 52, 1394–1416. [Google Scholar] [CrossRef]
Figure 1. Composites of SSTA during the phase of ENSO for (a) CPW, (b) EPW, and (c) La Niña events (K).
Atmosphere 10 00161 g001
Figure 2. Distribution of (a) average PDI (105 m3/s3), (b) intensity (m/s), (c) frequency (number), and (d) duration (h) of TCs making landfall in CPW, EPW, and La Niña years. “avg” means the total average during period of 1960–2016. The boxes show the 25th and 75th percentiles, the lines in the boxes mark the median, the dark dot mark the mean, and the crosses mark the values below (above) the 25th (75th) percentiles of the distributions.
Atmosphere 10 00161 g002
Figure 3. The probability of average PDI (105 m3/s3) occurrence exceeding a certain threshold in EPW years (red line) and CPW years (blue line). The abscissa was threshold of PDI, and the ordinate was probability of PDI occurrence.
Atmosphere 10 00161 g003
Figure 4. Same as in Figure 2, but for landfalling TCs intensity (m/s) during different seasons (summer, 6–8; autumn, 9–11) and over different landing locations (south and east).
Atmosphere 10 00161 g004
Figure 5. Same as in Figure 3, but for frequency (number) of TCs making landfall.
Atmosphere 10 00161 g005
Figure 6. Same as in Figure 3, but for TC duration (h) after landfall.
Atmosphere 10 00161 g006
Figure 7. Same as in Figure 3, but for the average PDI (105 m3/s3) of TCs after landfall.
Atmosphere 10 00161 g007
Figure 8. Composite anomalies of relative humidity (RH, %) at 850 hPa for JJA (a,c,e) and SON (b,d,f) seasons during CPW (a,b), EPW (c,d) and LA (e,f) events. Regions with trends that are significant at 90% confidence are shaded with dots.
Atmosphere 10 00161 g008
Figure 9. Composite anomalies of the vector wind (vector, m/s) and geopotential height (contour, gpm) at 850 hPa for JJA (a,c,e) and SON (b,d,f) seasons during CPW (a,b), EPW (c,d) and La (e,f) events. Regions with trends that are significant at 90% confidence are indicated by red arrows, and the center of cyclones are indicated by red pentagram.
Atmosphere 10 00161 g009
Figure 10. Composite anomalies of the steering flow (streamline, m/s) and subtropical high (red contour, gpm) at 500 hPa for JJA (a,c,e) and SON (b,d,f) seasons during CPW (a,b), EPW (c,d) and LA (e,f) events. Regions with trends that are significant at 90% confidence are shaded by dots.
Atmosphere 10 00161 g010
Figure 11. Composite anomalies of the vertical wind shear (VWS, m/s) for JJA (a,c,e) and SON (b,d,f) seasons during CPW (a,b), EPW (c,d) and LA (e,f) events. Regions with trends that are significant at 90% confidence are shaded by dots.
Atmosphere 10 00161 g011
Figure 12. Composite anomalies of the divergence (shaded, 10−6 s−1) and wind vector (vector, m/s) at 200 hPa for JJA (a,c,e) and SON (b,d,f) seasons during CPW (a,b), EPW (c,d) and LA (e,f) events. Regions with trends that are significant at 90% confidence are shaded by red dots.
Atmosphere 10 00161 g012
Figure 13. Composite of the differences of mean translation speed (km/h) for different seasons (JJA (c,g,k) and SON (d,h,l)) and different landing locations (SC (a,e,i) and EC (b,f,j)) during CPW, EPW and LA events.
Atmosphere 10 00161 g013
Table 1. The annual average frequency and duration of TCs in different ENSO patterns over the tropical Pacific. Total represents the total number of TCs generated over the ocean; LF represents the frequency of TCs making landfall; LT represents the total lifetime of TCs; LFLT represents the lifetime of TCs over land; LF/T represents the ratio between the number of landfalling TCs over China and the number of TCs generated over the WNP; LFLT/LT represents the ratio between the lifetime of landfalling TCs over China and the total lifetime of TCs generated over the WNP. “avg” means the total average during period of 1960-2016. The results that are statistically significant at 85% confidence are in bold.
YearsTotalLFLT (h)LFLT (h)LF/T (%)LFLT/LT (%)
CPW36.97.8143.930.321.421
EPW31.36192.8432.21916.7
LA32.57.9143.1537.6824.326.3
avg32.67.5171.6533.82319.7
Table 2. The average PDI, intensity, frequency and duration of TCs making landfall in CPW, EPW, and LA years during different seasons (JJA and SON) and over different landing locations (south and east). “Avg” in brackets indicates the total average during period of 1960–2016. The results compared with each other in three ENSO states that are statistically significant at 85% confidence level are in bold.
CPW; EPW; LA (Avg)PDIIntensityFrequencyDuration
TOTAL2.92; 3.56; 3.65 (3.5)26.2; 27.02; 26.5 (26.6)7.8; 6; 7.9 (7.5)30.3; 32.2; 37.68 (33.8)
JJA3.18; 3.15; 3.7626.0; 26.2; 24.85.6; 4.6; 4.130.5; 34.1; 44.3
SON2.45; 4.82; 3.6927.3; 29.8; 29.02; 1.4; 3.531.1; 26.2; 30.1
South2.88; 3.94; 3.6425.26; 27.0; 26.35; 3.86; 6.727.8; 28.6; 36.36
East3.0; 2.85; 3.6227.8; 25.96; 27.652.87; 2.15; 1.334.69; 38.8; 44.46

