Article

Evaluation of Tire Wear Contribution to PM2.5 in Urban Environments

1
Cardno ChemRisk, Pittsburgh, PA 15222, USA
2
Ramboll, Atlanta, GA 30339, USA
3
Environmental Research Group, King’s College London, London SE1 9NH, UK
*
Author to whom correspondence should be addressed.
Atmosphere 2019, 10(2), 99; https://doi.org/10.3390/atmos10020099
Submission received: 8 January 2019 / Revised: 19 February 2019 / Accepted: 19 February 2019 / Published: 23 February 2019
(This article belongs to the Special Issue Air Quality and Sources Apportionment)

Abstract

:
Vehicle-related particulate matter (PM) emissions may arise from both exhaust and non-exhaust mechanisms, such as brake wear, tire wear, and road pavement abrasion, each of which may be emitted directly and indirectly through resuspension of settled road dust. Several researchers have indicated that the proportion of PM2.5 attributable to vehicle traffic will increasingly come from non-exhaust sources. Currently, very little empirical data is available to characterize tire and road wear particles (TRWP) in the PM2.5 fraction. As such, this study was undertaken to quantify TRWP in PM2.5 at roadside locations in urban centers including London, Tokyo and Los Angeles, where vehicle traffic is an important contributor to ambient air PM. The samples were analyzed using validated chemical markers for tire tread polymer based on a pyrolysis technique. Results indicated that TRWP concentrations in the PM2.5 fraction were low, with averages ranging from < 0.004 to 0.10 µg/m3, representing an average contribution to total PM2.5 of 0.27%. The TRWP levels in PM2.5 were significantly different between the three cities, with significant differences between London and Los Angeles and Tokyo and Los Angeles. There was no significant correlation between TRWP in PM2.5 and traffic count. This study provides an initial dataset to understand potential human exposure to airborne TRWP and the potential contribution of this non-exhaust emission source to total PM2.5.

1. Introduction

The sources of PM2.5 vary spatially with long-range transport sources generated mainly from secondary PM and local sources generated mainly from combustion processes associated with industrial operations and road transport [1]. A recent literature review of various PM2.5 local source apportionment studies conducted in 51 different countries concluded that 25% of urban ambient air pollution from PM2.5 is contributed by traffic, 15% by industrial activities, 20% by domestic fuel burning, 22% from unspecified sources of human origin, and 18% from natural dust and salt [2]. Both primary and secondary PM were accounted for in the analysis and the contribution was dependent on the source. For example, the researchers generally apportioned traffic sources by primary PM emissions and the unspecified sources of human origin based on secondary PM emissions. PM2.5 also varies spatially and temporally.
Over the last 20 years, environmental agencies worldwide have enacted regulations, including those for motor vehicles, in an effort to reduce the emissions of PM2.5; and, indeed, a decline is observable in areas with established monitoring networks. For example, in the U.S., from 2000 to 2016, the nationwide levels of PM2.5 have decreased 42%; with the vast majority of the measurements below the national standard of 12 µg/m3 since 2012 [3]. In Europe (EU-28), the emissions of primary PM2.5 decreased by 16% from 2003–2012 [4].
Vehicle-related PM emissions may arise from both exhaust and non-exhaust mechanisms, such as brake wear, tire wear, and road pavement abrasion. Several researchers have indicated that the proportion of vehicle traffic attributable to PM2.5 will come increasingly from non-exhaust sources, due to additional regulations limiting vehicle exhaust emissions [5,6]. The current and future contributions of non-exhaust sources have been evaluated primarily through indirect methods such as various receptor-modeling approaches or air dispersion modeling paired with emission inventories. A recent literature review of non-exhaust emissions reported more than 250 estimates of contribution to ambient air PM [7].
When tires interact with the roadway surface, tire and road wear particles (TRWP) are produced, containing both the tread rubber and embedded road material (Figure 1) [8,9].
The contribution of tire wear to ambient PM10 and PM2.5 has been estimated to be between 0.8–8.5% and 1–10% by mass respectively, although the data are sparse and most estimates are indirectly calculated with only a few observational studies [10,11,12,13]. Given the complex composition of the TRWP, a variety of analytical techniques have been proposed, but the only ones with sufficient specificity to the particles are chemical markers associated with the tread rubber, which include monomers styrene and 1,3-butadiene, as well as the dimers vinylcyclohexene and dipentene [14]. Given the predicted increases in non-exhaust emission contributions to PM2.5, the current study was undertaken to measure levels of TRWP in PM2.5 in urban environments where traffic-related PM is significant. Sample locations were chosen to be representative of likely human exposure in various roadside microenvironments. To facilitate comparison to our earlier work and estimates published by others, we present mass-based concentrations and relative contribution to PM2.5 for both TRWP and tread for each sampling location.

2. Materials and Methods

2.1. City Selection

To select the cities for inclusion in this study, data were assembled for large urban areas in Europe, Asia, and the United States. A selection matrix was developed to identify cities based on several criteria including, levels of ambient PM2.5, traffic loads, population density, and local regulatory actions to reduce PM2.5. The data were assembled from the peer-reviewed literature as well as publicly available databases, such as the United States Census, Japan’s Ministry of the Environment Air Pollutants Wide Area Monitoring System, and the European Environment Agency Interactive Air Pollution Database [15,16,17,18,19,20,21,22,23,24]. Based on the literature review, 20 cities were evaluated for inclusion in the sampling program. For logistical reasons, the study had to be limited to sampling in three cities. As such, each city was prioritized based on having a population greater than 1 million people (as an indicator of potential significant traffic impacts), average PM2.5 concentrations > 20 µg/m3, and regulations targeted at reducing PM2.5. In Europe, five cities were considered, including Barcelona, London, Milan, Paris and Rome, with London being ultimately selected. In Japan, six cities were considered, including Nagoya, Osaka, Tokyo, Saitama City, Yokohama, and Kyoto, with Tokyo being ultimately selected. In the U.S., three cities were considered, including Atlanta, Los Angeles and New York City, with Los Angeles ultimately selected.

2.2. Sample Location Selection

Within each city, the specific sampling points were chosen in collaboration with local field sampling teams using geospatial data from Geographical Information System (GIS) as well as other available data, including traffic counts and historical PM2.5 levels. Site selection criteria included the presence of identifiable traffic and historical presence of high PM2.5 levels where possible, approaching an average daily concentration of 20 µg/m3, in order to achieve sufficient mass loading on the sampling filters (i.e., 1 mg in total particulate mass) to provide TRWP detection limits in the range of 260 µg/g [25]. As such, the total PM2.5 concentrations and sampling durations were an important consideration. In addition, to be representative of locations where people are exposed to traffic pollution, the sites were located near homes, parks, schools, and businesses. All air samples were collected near the roadside, and the distance from road was dictated by logistical constraints such as security of the equipment and available power sources. For London only, an urban background site was also included.
In London, the equipment was co-located at established sampling sites, which are part of the London air quality research network. Similarly, in Los Angeles, the South Coast Air Quality Management District (SCAQMD) allowed equipment to be co-located within their existing sampling sites. However, one location, the Exposition Park site, was not part of their network; as such, the sampler was simply placed at the fence line nearest to the roadway. In Tokyo, all samplers were placed roadside on available property after permits were granted; none were co-located with existing monitoring stations.

2.3. Filter-Based Air Sample Collection

Sampling was conducted in July 2014 (Los Angeles), September 2014 (Tokyo), and between February and March 2015 (London). Details of the sampling locations are presented on Table 1. All of the samples were collected using low volume air samplers and in accordance with US EPA reference method 40 CFR part 50, Appendix J [26]. A pilot study was conducted in Los Angeles to understand the volume of air required to optimize PM loading on the air filters. Based on historical PM2.5 data for the locations, it was estimated that 48 h of sampling time would be necessary. As such, in greater Los Angeles the air samples were collected using BGI PQ 200 samplers (Mesa Labs, Butler, NJ, USA) with a PM2.5 inlet, an average flow rate of 16.5 lpm and an average total air volume of 44 m3. Based on results obtained from Los Angeles where TRWP was non-detect in four of six sampling sites, it was evident that the sampling duration of 48 h was insufficient. Therefore, in London and Tokyo, the sample duration was increased to 72 h. The London air samples were collected using Thermo Partisol 2025 samplers (ThermoFisher, Waltham, MA USA) with an average flow rate of 17.4 lpm and an average total air volume of 75.3 m3. Similarly, the samples collected in greater Tokyo were collected Thermo Fisher 2000 FRM samplers (ThermoFisher, Waltham, MA USA) with an average flow rate of 16.7 lpm and an average total air volume of 95.3 m3. Also, PM10 samples were added to several of the sampling locations in London and Tokyo using samplers equipped with PM10 inlets.
All, samples were collected on 47 mm quartz filters, because this type of filter does not interfere with the pyrolysis method used for polymer detection. All filters were acclimatized and weighed, pre and post collection, and shipped to the Chemical Evaluation Research Institute (CERI) in Tokyo, Japan, for TRWP analysis.

2.4. Sample Analysis

The air samples were analyzed for TRWP concentrations using methods described previously [25,27]. The analytical technique is based on the characteristic fragments generated by the thermal decomposition of the tire tread polymers that include styrene butadiene rubber (SBR), butadiene rubber (BR) and natural rubber (NR). Briefly, the method consists of the following steps: the tread rubber polymers in environmental samples undergo thermal decomposition at 670 °C by Curie-point pyrolysis; next, the thermal decomposition products are separated using a gas chromatograph (GC); and finally, the pyrolysis fragments are quantified with mass spectrometry (MS). In Curie-point pyrolysis, the sample is wrapped in a ferromagnetic pyrofoil, heated to temperature by induction heating in less than 0.2 s, and heated for a period lasting 5 s; all conducted in a helium atmosphere. This procedure generates reproducible characteristic fragments of thermal decomposition. The tread polymers are quantified using internal standard calibration of the characteristic fragment ions consisting of dimers formed from the raw polymers through pyrolysis. Dimer fragments are selected because they have good specificity for tread rubber polymers (i.e., SBR, BR and NR), whereas both anthropogenic and natural organic substances are also sources of monomeric fragments. Specifically, pyrolysis of SBR and BR produces the dimer, 4-vinylcyclohexene, which is not known to have other significant environmental sources, and for natural rubber (NR) dipentene, is produced. Although dipentene is the right-handed isomer of (+)-limonene, which is naturally occurring in citrus fruits and used as a fragrance in cleaning and cosmetic products, the dipentene (mixture of isomers) pyrolysis fragment elutes from the GC at a distinctly different time than (+)-limonene and therefore is distinguishable from limonene sources in the environment.
An internal standard is used in the sample analysis to increase the reliability and reproducibility of quantitative pyrolysis-GC/MS analysis compared to the less complex external calibration analysis [28,29]. Calculation of the TRWP concentration based on the polymer markers was conducted based on total tread polymer content of approximately 25% [8]. Tread contains approximately 50% polymer; therefore, tread particle concentration (where calculated) is 2-fold lower that TRWP concentrations.
A method detection limit (MDL) study was completed according to the US EPA standard methods. For air, the detection limit varies with mass of PM collected but was 260 µg/g for whole quartz filter loaded with 1 mg of particulate. Typically during this procedure an aliquot of 1/3 of the filter is analyzed to provide an archive for future analyses with a resultant detection limit of 780 µg/g. In this study, this method was followed for the PM10 filters, as well as for the PM2.5 filters from London and Tokyo. However, due to the small amount of mass collected on the Los Angeles PM2.5 filters, the entire filter was pyrolyzed and a lowered calibration curve used in an effort to detect the polymers at the lower concentrations. For the polymer dimers, the detection limit, on a µg/m3 basis, ranged from 0.001–0.16 (PM2.5 samples) and 0.007–0.18 (PM10 samples). The concentration of the tread in PM was calculated using the dimer concentrations. If both polymers were not detected, the tread concentration was calculated using the sum of the polymer limits of detection (LODs); if one polymer was detected, the tread concentration was calculated using the sum of the measured concentration of the detected polymer and 1/2 LOD for the second polymer.

2.5. Statistical Analysis

The data were evaluated using the Analysis of Variance (ANOVA) and regression models to identify differences among the cities and trends in determinants of TRWP concentrations between sampling locations and cities. The determinants evaluated included: sample location; population density; average daily traffic count; distance from the road, height of sampler from the road; other pollutants such as nitrogen oxides (NO, NOx) and black carbon; as well as weather parameters including average wind speed, wind direction, humidity, temperature, and total precipitation over the sampling period. Significant pairwise differences were identified using the Tukey multiple comparison test. Due to the high percentage of samples that were below the limit of detection (LOD), the regression on order statistics (ROS) method was used to impute values for the censored data based on the assumption of a lognormal distribution using the USEPA (2013) ProUCL version 5.0 software (USEPA, Washington, DC USA). In addition, because the data had lognormal distributions these the ANOVA and Tukey multiple comparison tests were performed on the log transformed data.

3. Results and Discussion

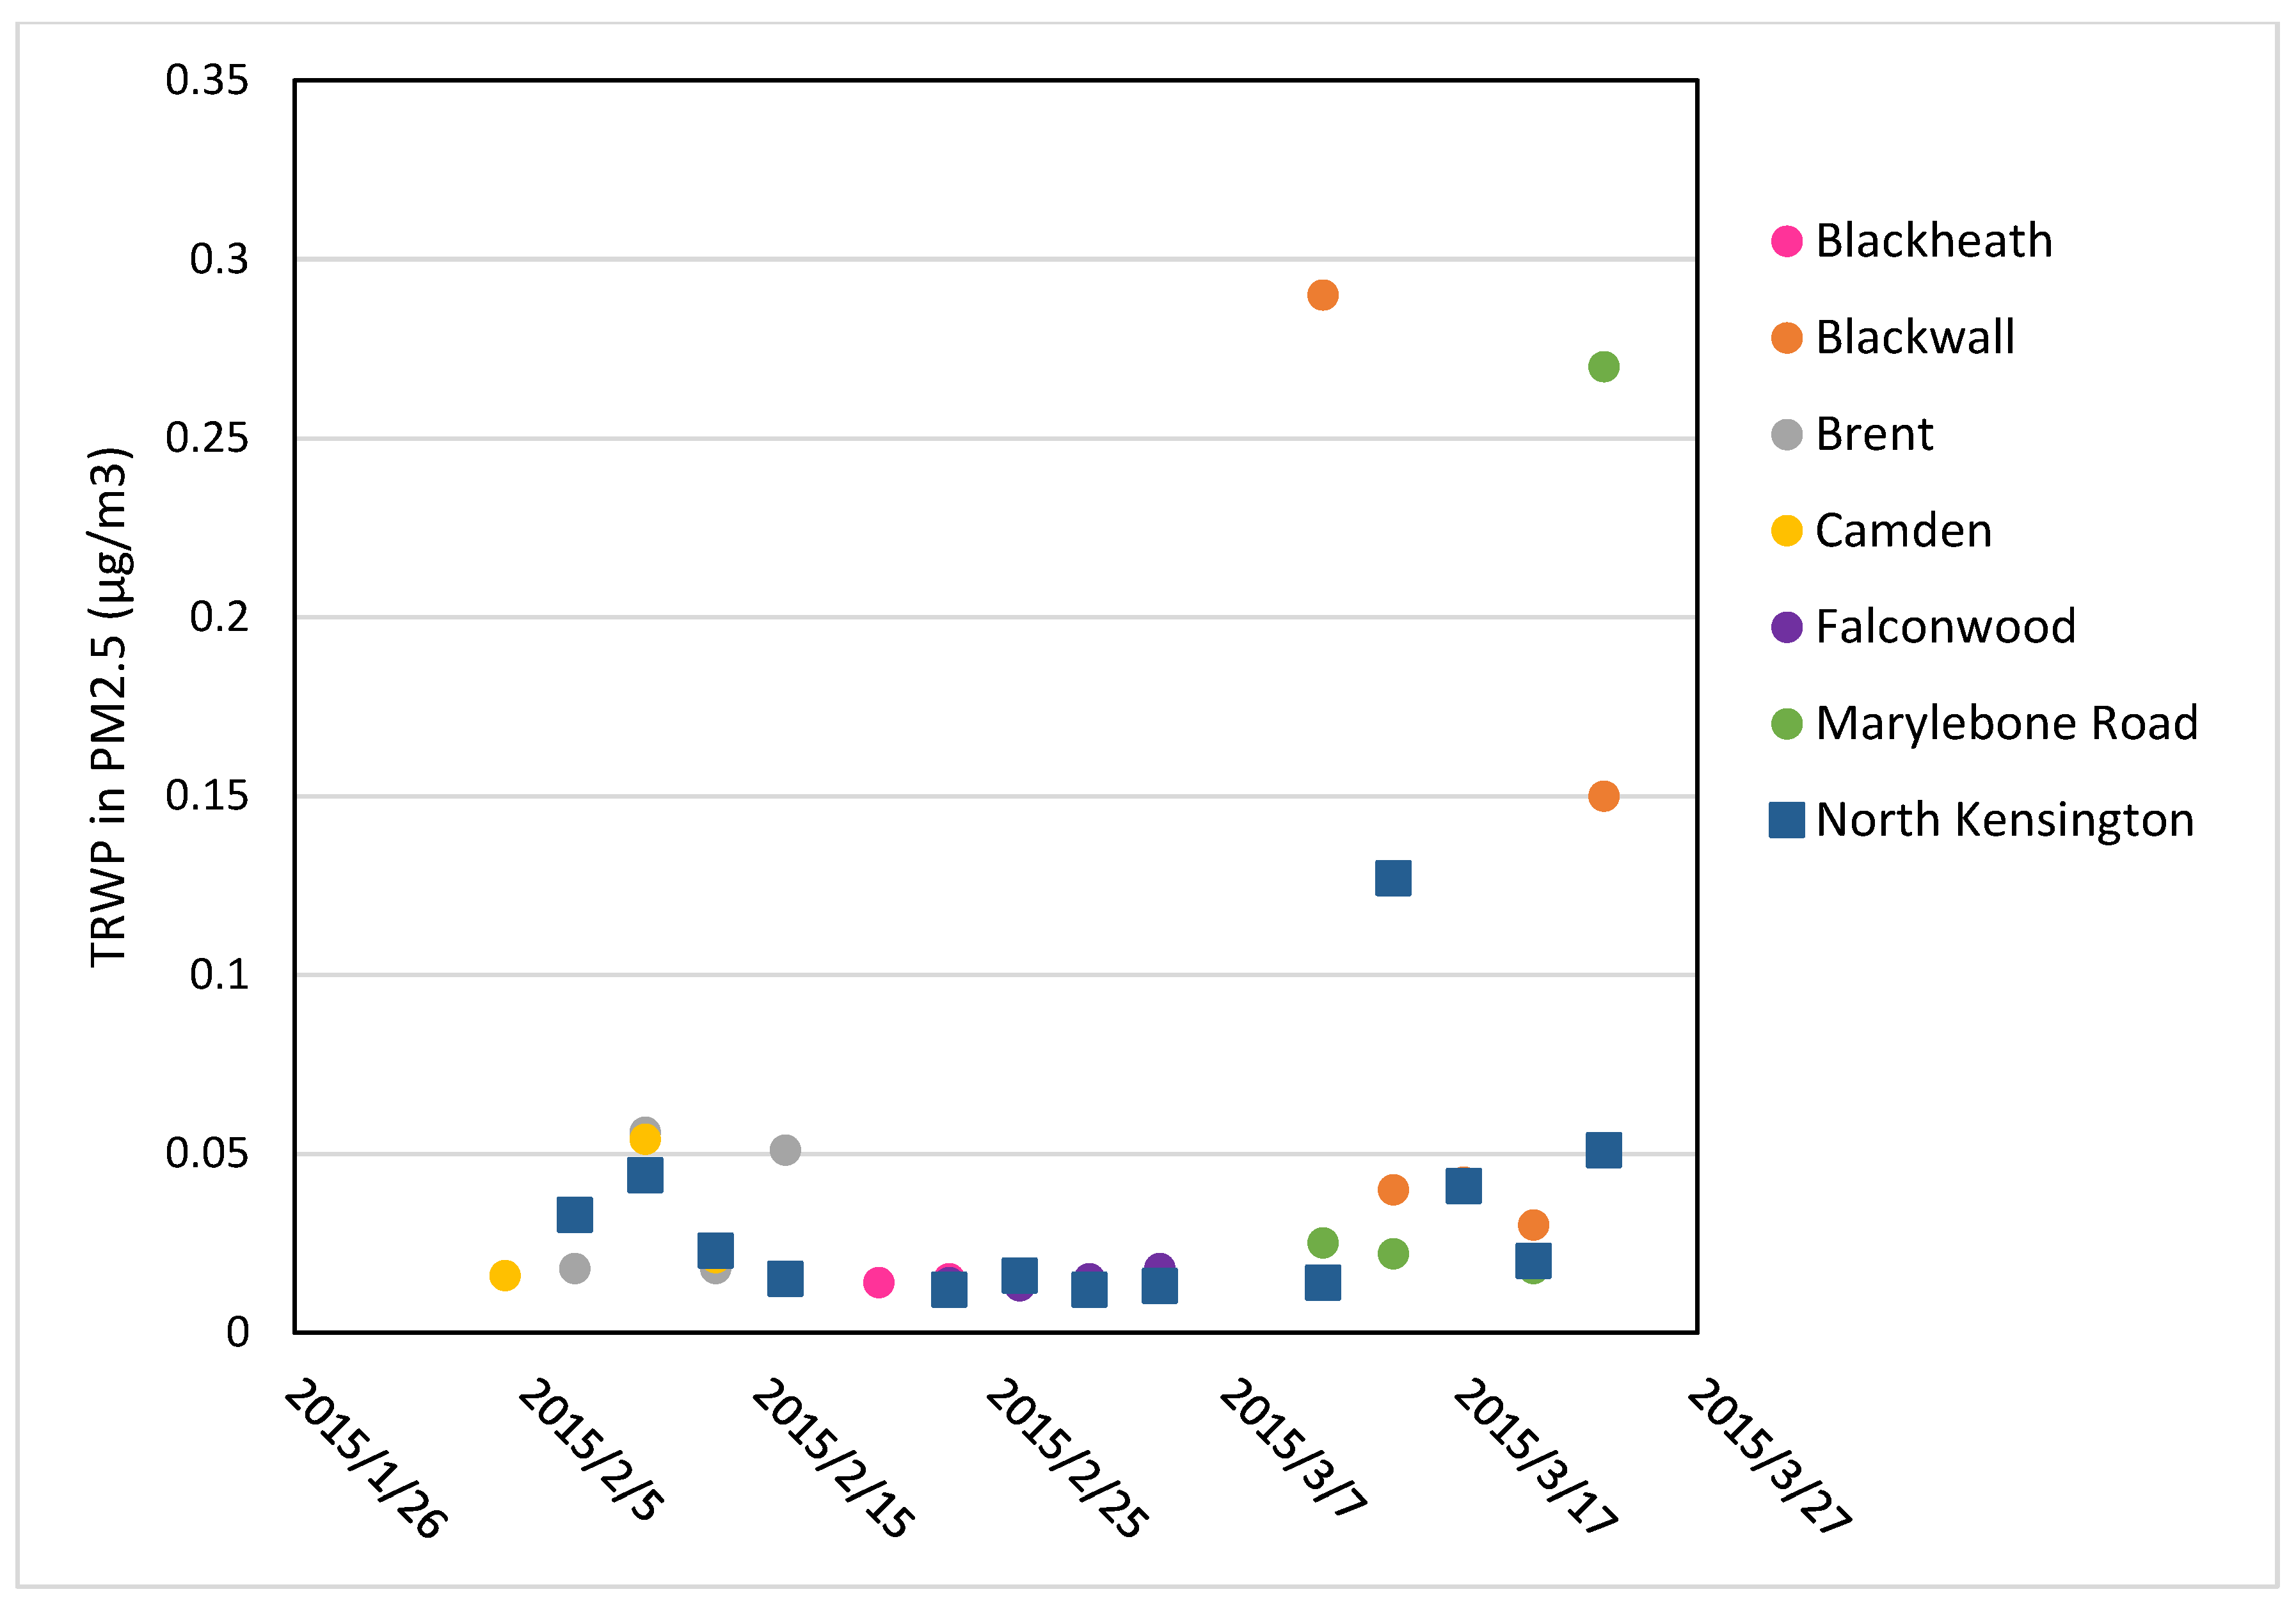
3.1. Air Concentration of TRWP and Tread in PM2.5

The results of the PM2.5 air sampling campaign are presented in Table 2. In total 80 samples were analyzed, and the TRWP detection frequencies ranged from 0–100%. The lowest detection frequencies were recorded in Los Angeles, with four of the six locations showing no detections. Two of the samples (one in Exposition Park and one in Mira Loma) were declared invalid because the samplers shut down soon into the pre-programmed sampling time, and there was insufficient mass on the other filters. The total ambient PM2.5 levels were low in Los Angeles during sampling days, which was surprising due to the historical levels recorded in the area for the same time of year. Nonetheless, the total PM2.5 concentrations measured in this study were similar to those reported by the SCAQMD for the same dates [30]. Based on the Los Angeles sampling results, it was determined that sampling duration should be increased further for Tokyo and London, in order to better ensure sufficient collection of mass for analysis. As a result, the detection frequencies were higher in those two cities.
As shown on Table 2, the TRWP made a small contribution to total ambient PM2.5 levels, representing 0.1–0.68% of the total PM2.5 across all locations. The range of concentrations of TRWP were 0.012–0.29 µg/m3 in London, 0.010–0.1 µg/m3 in Tokyo, and 0.004–0.072 µg/m3 in Los Angeles. The highest concentrations were recorded at the Blackwall Tunnel Approach in London (mean 0.104 µg/m3 and range (0.03–0.29 µg/m3)) where significant braking activity occurs before the tunnel portal which creates more tire wear abrasion than constant speed driving. The highest TRWP PM2.5 concentration measured in Tokyo was at the Kawasaki Industrial Road location, which had the highest traffic count of the Tokyo sites. In both Tokyo and London, the traffic composition was dominated primarily by passenger car and light duty vehicle traffic, with truck traffic generally comprising less than 20% of the total traffic. One exception was Kawaskai Industrial Road, where the truck traffic accounted for nearly 43% of the traffic.
Some researchers report their findings as the amount of tread, not TRWP, in PM. As such, Table 2 also shows the tread contributions. These levels were estimated based on an approximate two-fold difference between polymer content in tread (~50%) and TRWP (~25%) [12]. The averaged contributions of tread to PM2.5, as calculated in our study, ranged from 0.06–0.25% (London); 0.05–0.17% (Tokyo); and 0.05–0.34% (Los Angeles). These values are significantly lower than the 1–3% by mass contribution to PM2.5 estimated by earlier researchers using receptor modeling approaches or extrapolation of elemental composition [10,31,32,33,34,35,36,37,38,39]. Although predictive models are generally developed so as to not underestimate exposures, one to two orders of magnitude difference between measured and modeled values indicates a need for additional empirical data.
Urban background samples were collected in London only, at the North Kensington location. This long-running monitoring site has been used as a representative background monitoring site for London in epidemiological studies, to understand processes affecting London’s air pollution, and assessment of the effectiveness of air quality management policies [40,41,42,43]. Figure 2 shows same day comparisons between the North Kensington site and the other roadside sampling locations. As indicated, there was little difference in TRWP concentrations measured at the roadside locations versus North Kensington. Although considered an urban background location, the site is situated adjacent to a parking lot and therefore subjected to vehicle related emissions. Further, as observed by other researchers, airborne PM2.5 is not necessarily correlated to local traffic volume, rather, regional sources and meteorological conditions are often stronger influences [44,45].

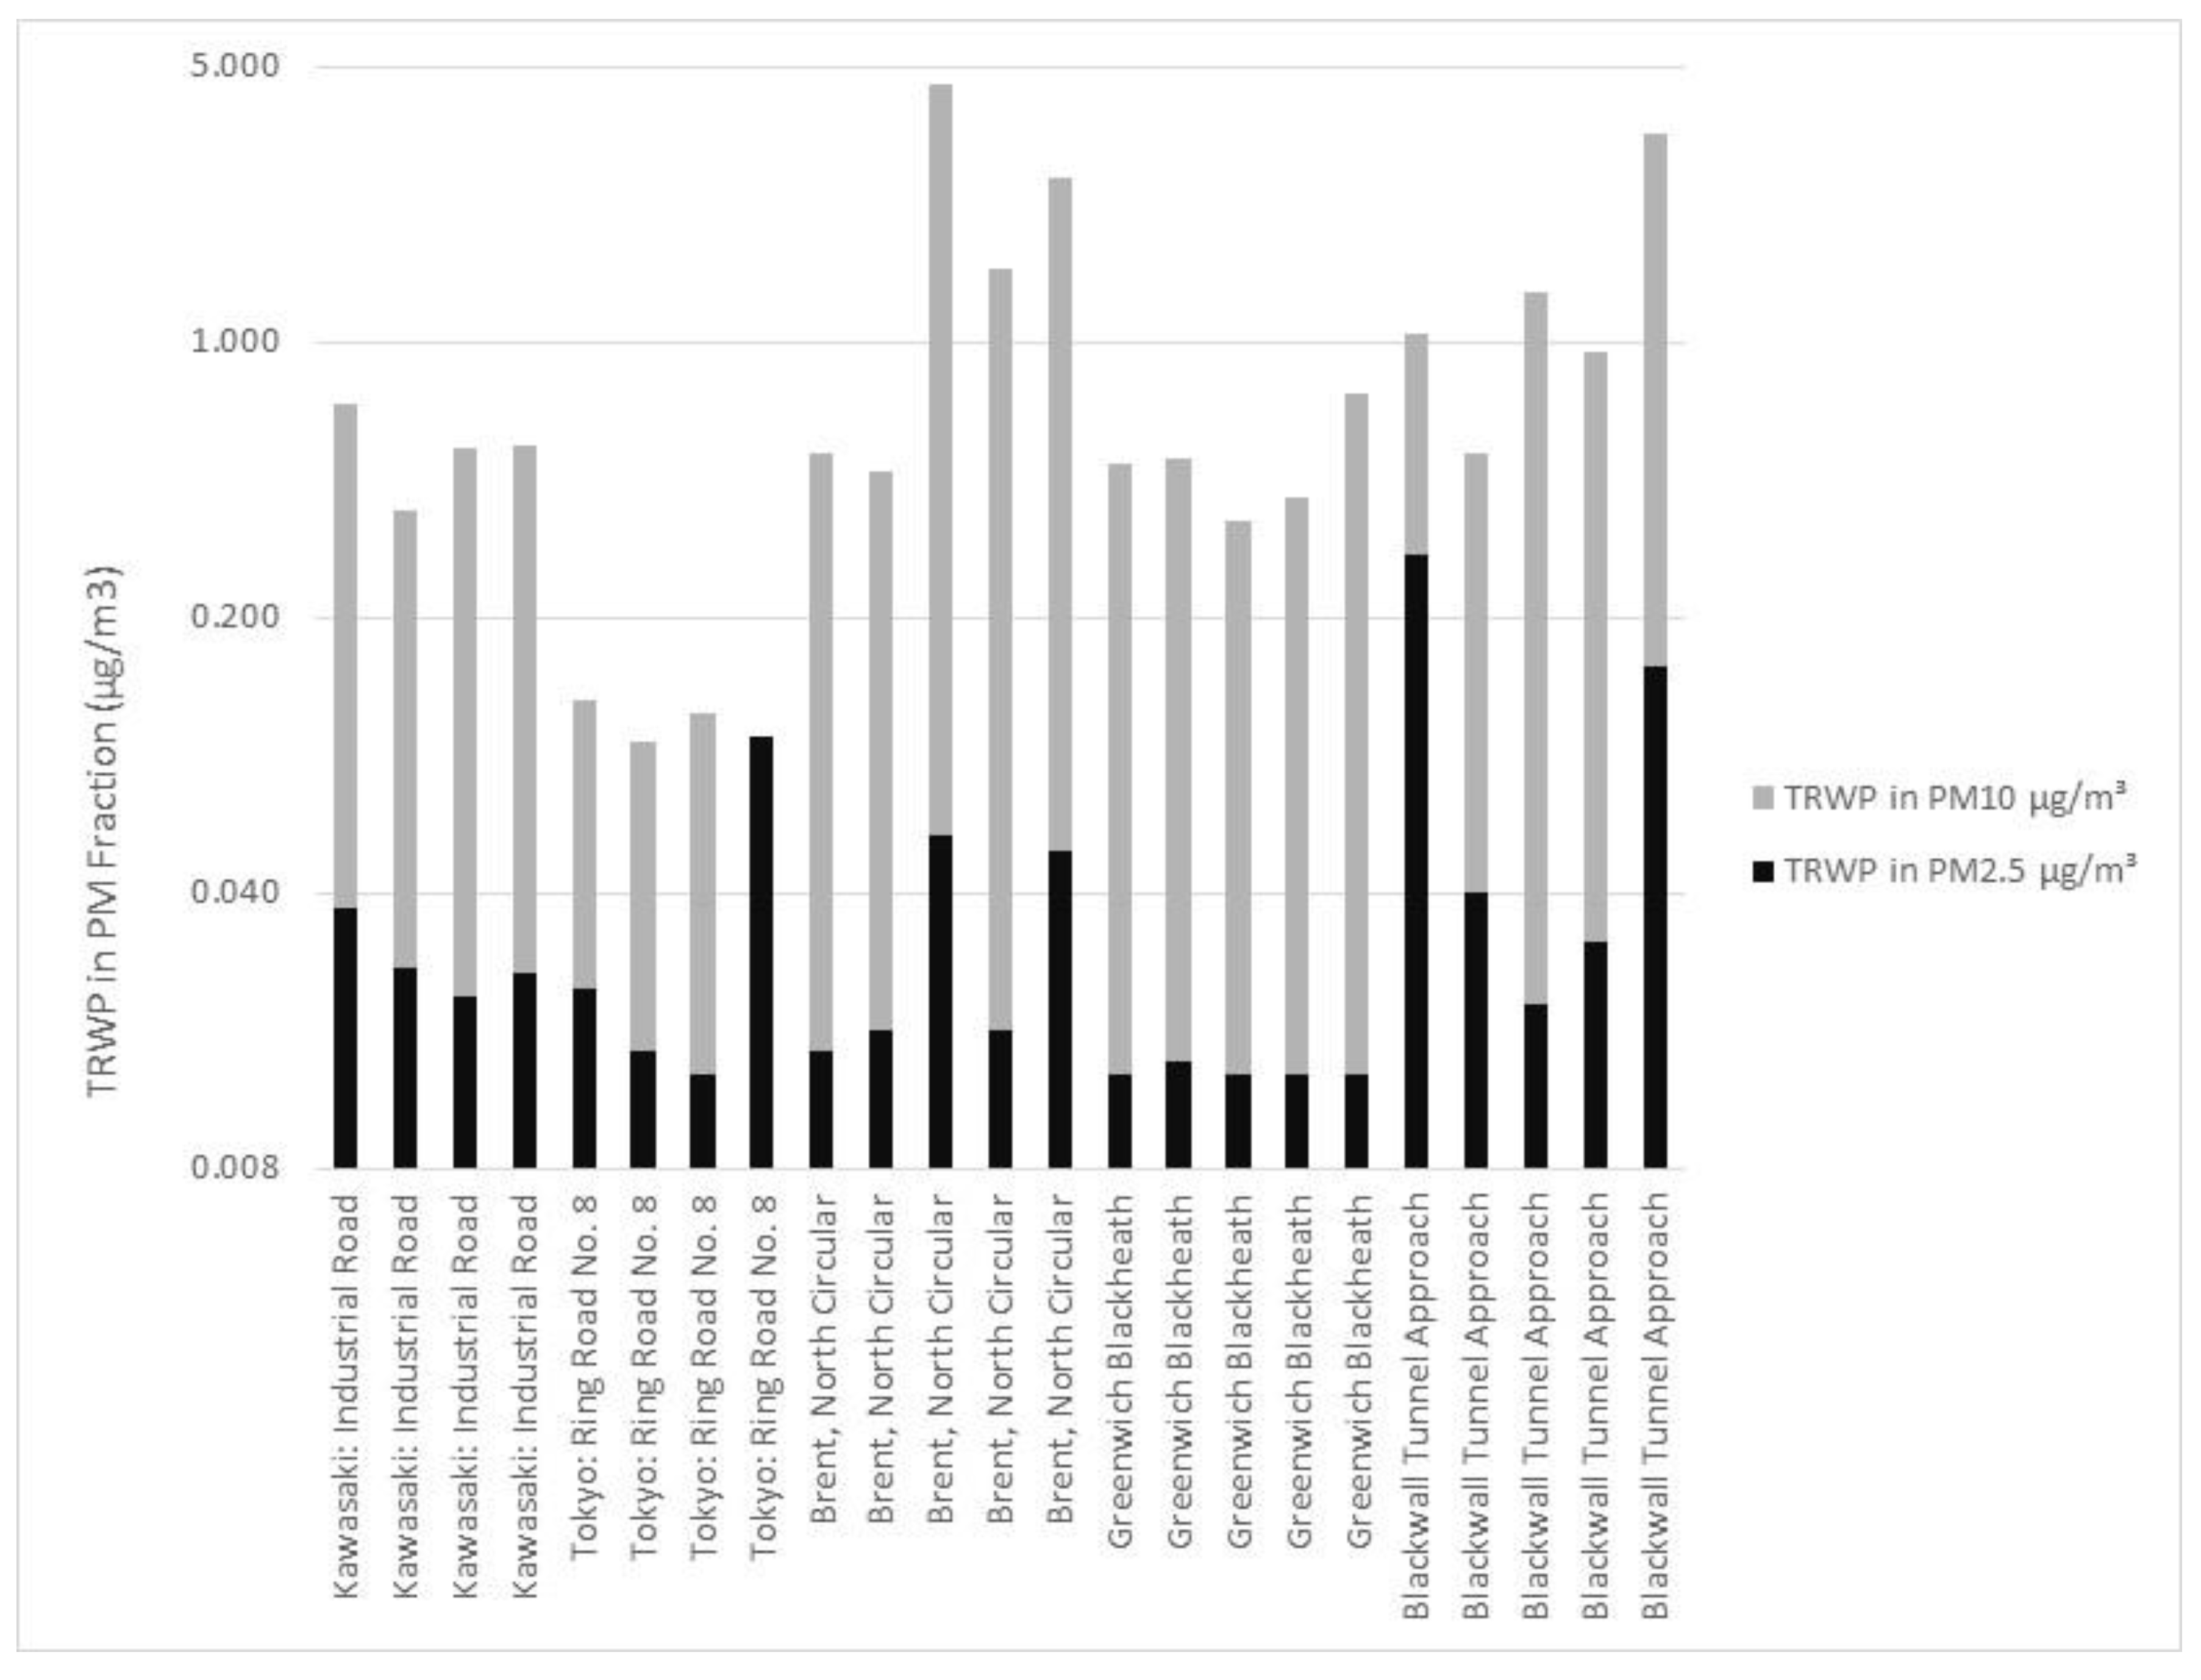
3.2. Air Concentration of TRWP and Tread in PM10

PM10 samples were collected at two sites in Japan, and at three sites in London (Table 3). The TRWP detection frequency was high (100%), and none of the samples were determined to be invalid. This high detection frequency may be explained both by the high levels of PM10 (ranging from 21–53 µg/m3) and by the longer sampling periods used in these cities thereby ensuring the filters were more heavily loaded. Additionally, particles arising from surface abrasion mechanisms are typically found in the coarse fraction, so it is not surprising to detect TRWP in PM10. Overall, the average concentration of TRWP in PM10 was 0.92 µg/m3; with a range of 0.095–1.91 µg/m3. The average contribution to PM10 by TRWP was 1.9%, with a range of 0.45–2.48%. The highest levels of TRWP in PM10 were sampled at Brent, North Circular (4.48 µg/m3) and the Blackwall Tunnel Approach (3.24 µg/m3). These TRWP PM10 concentrations were higher than those measured in our previous studies and although the reason is not clear, we hypothesize that with respect to the Blackwall Tunnel Approach, the higher concentrations may be a result of a combination of both very high traffic counts and the amount of braking that occurs at a tunnel approach [12].

3.3. PM2.5/PM10 Ratios

Examining the PM2.5/PM10 ratio can be useful for source apportionment and also to estimate pollutant concentrations, when one or the other has not been measured. For London and Tokyo, where both PM2.5 and PM10 sampling was conducted, the ratios of total PM2.5 to total PM10 ranged from 0.08 (Greenwich Blackheath) to 0.60 (Tokyo Ring Road No. 8). In general, ratio values lower than 0.6 indicate that re-suspended soil-dust, long distance dust transport, coal mining and processing industries and other mechanical activities were likely to be contributors to the particulate matter levels recorded [46,47]. In examining the ratio of TRWP in PM2.5/TRWP in PM10, the values ranged from 0.01 (Brent North Circular) to 1.00 (Tokyo Ring Road No. 8) (Figure 3). The majority of our calculated ratios were less than 0.2 thus indicating that airborne TRWP are generally in the coarse fraction. However, one ratio (1.00, Tokyo Ring Road No. 8) indicated that the PM10 concentration of TRWP was only in the PM2.5 size fraction during the sampling event. Recently, Grigoratos et al. [48] reported that in a road simulator laboratory where the size distributions of PM emitted during the rolling of tires on pavement were measured in real time using Dust Traks and Aerodynamic Particle Sizer (APS), the PM2.5/PM10 ratios were approximately 0.5. However, these measurements represent all PM in the laboratory air including indoor laboratory air dust, TRWP and pavement particulate.

3.4. Statistical Analysis

Based on the results of ANOVA, the TRWP levels in PM2.5 were significantly different among the three cities (p < 0.00001) with significant pairwise differences between London and Los Angeles (p < 0.00001) and Tokyo and Los Angeles (p = 0.003). When comparing sampling sites within each city, there were no significant differences between sampling sites for London (p = 0.145) and Tokyo (p = 0.071). However, there were significant differences among the sampling sites for Los Angeles (p < 0.00001) with the Pico Rivera sampling site having significantly higher concentrations than the other sampling sites (p = 0.00026 to p = 0.002). This is not surprising given that this is the sampling site with the highest detection frequency (4/4) of all of the Los Angeles sampling sites.
For all three cities, there were no statistically significant correlations between TRWP in PM2.5 and other pollutants such as nitrogen oxides (NO, NOx) and black carbon (p > 0.05) or weather parameters including wind speed, wind direction, humidity, temperature, and precipitation (p > 0.05).
Correlations of average traffic speed and TRWP PM2.5 by city were evaluated for London and Tokyo. There were no significant correlations between TRWP and vehicle speed for either the London (p = 0.245) or Tokyo (p = 0.389) sampling sites. For London, the correlation coefficient for TRWP versus vehicle speed is −0.229 with a 95% confidence interval (CI) of −0.544 to 0.158. For Tokyo, the correlation coefficient for TRWP versus vehicle speed is −0.231, with a 95% CI of −0.652 to 0.299. Similarly, correlations of daily traffic counts and TRWP PM2.5 by city were also evaluated; however, there was no significant correlation. For London, the correlation coefficient was 0.265 with a 95% CI of −0.136 to 0.592 (p = 0.198); for Tokyo, the correlation was 0.407 with a 95% CI of −0.158 to 0.771 (p = 0.15), and for LA, correlation was 0.607 with a 95% CI of −0.592 to 0.970 (p = 0.278). Similar findings regarding lack of correlation between traffic counts and PM2.5 have been reported in studies evaluating personal exposures to PM2.5, as well as ambient air concentrations at roadside [44,45].

3.5. Uncertainties

The data generated from this research provide an initial observation of TRWP in PM2.5 using methods that are specific to tire tread, however, they are site specific and may not be applicable more broadly given the small sample size and consequent low statistical power. The calculation of the TRWP concentration involves the assumption of 50% of the polymer in the tread and 50% of tread in the TRWP. However, the 50% assumption of tread in the TRWP is based on the characterization of bulk TRWP in the size range of 0–150 µm. As such, the composition of the <10 µm fraction has not been specifically characterized. It is currently unknown if the use of the 50% tread assumption overestimates or underestimates that composition in the <10 µm particles. Previously, the tire wear contribution to the PM2.5 fraction was evaluated using Aerosol Time-of-Flight Mass Spectrometer (ATOFMS) and the researchers concluded that there was both a pavement and tread component, although the researchers did not have a quantitative estimate of the amounts [49]. More recently, roadside airborne particulate in the 10–80 µm range was characterized using SEM EDX and the researchers concluded that the amount of pavement encrustation of the surface area of the ‘tire core’ (i.e., tread) ranged from approximately 10% to more than 50% [9]. As such, more research may be needed to refine TRWP composition in the PM10 and PM2.5 fractions. Additionally, although all roads near the sampling sites in this study were made of asphalt, the surface features of the pavements can vary based on local construction requirements including the type of aggregate used in the asphalt mix. As such, specific pavement characteristics may influence the generation of TRWP. However, location specific pavement information was not available and therefore has not been assessed in this study. Lastly, the seasonal variability of TRWP in ambient air is not discernable from this dataset because the samples were only collected during one season at each location. Given that ambient air PM source contribution can vary seasonally, the contribution of TRWP may be higher or lower than that measured in this study. Future research would benefit from larger sampling campaigns designed to characterize TRWP in PM2.5 at a variety of locations, alongside faster roads, and over various seasons.

4. Conclusions

TRWP in the ambient air is measurable in both the ambient air PM2.5 and PM10 fractions using chemical markers specific to the polymer portion of the particles. The overall low contribution of TRWP to the PM2.5 that has been reported in the literature was also observed in the measurements made in this study; albeit this dataset indicated much lower absolute percentage contributions. Nevertheless, additional sampling for TRWP in the ambient air would be helpful to establish a more robust dataset for characterizing the non-exhaust emissions contribution to ambient air particulate from tire wear.

Author Contributions

Conceptualization, J.M.P. and K.M.H.; Data curation, G.W.F. and D.G.; Formal analysis, J.M.P., G.W.F. and D.G.; Investigation, J.M.P., K.M.H., G.W.F. and D.G.; Methodology, J.M.P., K.M.H., G.W.F. and D.G.; Project administration, K.M.H.; Resources, G.W.F.; Supervision, J.M.P.; Writing—original draft, J.M.P., K.M.H., G.W.F. and D.G.

Funding

This research was funded by was funded by the Tire Industry Project, an international consortium of 11 tire manufacturers, collaborating to understand the human health and environmental impact of tires, under oversight of the World Business Council for Sustainable Development.

Acknowledgements

We wish to thank the environmental scientists from AMEC Earth and Environmental, Inc., the Japan Environmental Sanitation Center (JESC), and the King’s College London’s Environmental Research Group for assisting with sample collection in the United States, Japan, and the United Kingdom, respectively. We also wish to thank the scientists at the South Coast Air Quality Management District in California for allowing us access to their monitoring sites and the scientists at CERI Tokyo for assisting with sample analysis for all locations. In addition, we wish to thank Samantha Batdorf, Thales Cheng, Paul K. Scott, Max Priestman, Anja Tremper, and John Casy for their contributions to our analysis.

Conflicts of Interest

Although the sponsors funded the study, they had no role in the design, execution, interpretation, or writing of the study.

References

  1. Kiesewetter, G.; Amann, M. Urban PM2.5 Levels under the EU Clean Air Policy Package; International Institute for Applied Systems Analysis: Laxenburg, Austria, 2014. [Google Scholar]
  2. Karagulian, F.; Belis, C.A.; Dora, C.F.C.; Prüss-Ustün, A.M.; Bonjour, S.; Adair-Rohani, H.; Amann, M. Contributions to cities’ ambient particulate matter (PM): A systematic review of local source contributions at global level. Atmos. Environ. 2015, 120, 475–483. [Google Scholar] [CrossRef]
  3. United States Environmental Protection Agency. Particulate Matter (PM2.5) Trends. Available online: https://www.epa.gov/air-trends/particulate-matter-pm25-trends (accessed on 5 May 2018).
  4. European Environment Agency. Air Quality in Europe—2014 Report; EEA Report 2014, No 5/2014; European Environmental Agency: Copenhagen, Denmark, 2014. [Google Scholar]
  5. Amato, F.; Pandolfi, M.; Moreno, T.; Furger, M.; Pey, J.; Alastuey, A.; Bukowiecki, N.; Prevot, A.S.H.; Baltensperger, U.; Querol, X. Sources and variability of inhalable road dust particles in three European cities. Atmos. Environ. 2011, 45, 6777–6787. [Google Scholar] [CrossRef]
  6. Sundvor, I.; Balaguer, N.C.; Viana, M.; Querol, X.; Reche, C.; Amato, F.; Mellios, G.; Guerreiro, C. Road Traffic’s Contribution to air Quality in European Cities; ETC/ACM Technical Paper 2012/14; European Topic Center and Climate Change Mitigation: Bilthoven, The Netherlands, 2012. [Google Scholar]
  7. Amato, F. Non-Exhaust Emissions—An Urban Air Quality Problem for Public Health; Impact and Mitigation Measures, 1st ed.; Amato, F., Ed.; Academic Press: London, UK, 2018. [Google Scholar]
  8. Kreider, M.L.; Panko, J.M.; McAtee, B.L.; Sweet, L.I.; Finley, B.L. Physical and chemical characterization of tire-related particles: Comparison of particles generated using different methodologies. Sci. Total Environ. 2010, 408, 652–659. [Google Scholar] [CrossRef]
  9. Sommer, F.; Dietze, V.; Baum, A.; Sauer, J.; Gilge, S.; Maschowski, C.; Gieré, R. Tire Abrasion as a Major Source of Microplastics in the Environment. Aerosol Air Quality Res. 2018, 18, 2014–2028. [Google Scholar] [CrossRef]
  10. Fauser, P. Particulate Air Pollution with Emphasis on Traffic Generated Aerosols. Ph.D. Thesis, Technical University of Denmark, Lyngby, Denmark, 1999. [Google Scholar]
  11. Grigoratos, T.; Martini, G. Non-Exhaust Traffic Related Emissions. Brake and Tyer Wear PM; Literature Survey; JRC Science and Policy Reports; EC Joint Research Center: Ispra, Italy, 2014. [Google Scholar]
  12. Panko, J.M.; Chu, J.; Kreider, M.L.; Unice, K.M. Measurement of airborne concentrations of tire and road wear particles in urban and rural areas of France, Japan, and the United States. Atmos. Environ. 2013, 72, 192–199. [Google Scholar] [CrossRef]
  13. Weinbruch, S.; Worringen, A.; Ebert, M.; Scheuvens, D.; Kandler, K.; Pfeffer, U.; Bruckmann, P. A quantitative estimation of the exhaust, abrasion and resuspension components of particulate traffic emissions using electron microscopy. Atmos. Environ. 2014, 99, 175–182. [Google Scholar] [CrossRef]
  14. Wagner, S.; Huffer, T.; Klockner, P.; Wehrhahn, M.; Hofmann, T.; Reemtsma, T. Tire wear particles in the aquatic environment—A review on generation, analysis, occurrence, fate and effects. Water Res. 2018, 139, 83–100. [Google Scholar] [CrossRef]
  15. American Lung Association. State of the Air 2013. Available online: http://www.stateoftheair.org/2013/states/ (accessed on 20 April 2016).
  16. European Environment Agency. Particulate Matter (PM2.5): Annual Mean Concentrations in Europe. Available online: http://www.eea.europa.eu/themes/air/interactive/pm2_5 (accessed on 20 April 2016).
  17. Ministry of the Environment Government of Japan. Atmospheric Environmental Regional Observation System: AEROS. Available online: http://soramame.taiki.go.jp/Index.php (accessed on 20 April 2016).
  18. United States Environmental Protection Agency. Air Quality Statistics Report 2012. Available online: https://www3.epa.gov/airdata/ad_rep_con.html (accessed on 20 April 2016).
  19. United States Census. PEPANNRES: Annual Estimates of the Resident Population: April 1, 2010 to July 1, 2011; U.S. Census Bureau: Washington, DC, USA, 2011.
  20. World Health Organization. Urban Outdoor Air Pollution Database; World Health Organization: Geneva, Switzerland, 2011. [Google Scholar]
  21. European Union. Urban Access Regulation in Europe: Low Emission Zones. Available online: http://urbanaccessregulations.eu/low-emission-zones-main (accessed on 20 April 2016).
  22. United States Department of Transportation. Policy and Governmental Affairs Office of Highway Policy Information. Available online: http://www.fhwa.dot.gov/policyinformation/statistics/2011/hm71.cfm (accessed on 20 April 2016).
  23. United States Environmental Protection Agency. Air Emissions Inventories: 2011 National Emissions Inventory (NEI) Data. Available online: https://www.epa.gov/air-emissions-inventories/2011-national-emissions-inventory-nei-data (accessed on 20 April 2016).
  24. United Nations. UNData: Statistics—City Population by Sex, City and City Type. Available online: http://data.un.org/Data.aspx?d=POP&f=tableCode%3A240 (accessed on 20 April 2016).
  25. Unice, K.M.; Kreider, M.L.; Panko, J.M. Use of a Deuterated Internal Standard with Pyrolysis-GC/MS Dimeric Marker Analysis to Quantify Tire Tread Particles in the Environment. Int. J. Environ. Res. Public Health 2012, 9, 4033–4055. [Google Scholar] [CrossRef] [Green Version]
  26. United States Environmental Protection Agency. 40 CFR Appendix J to Part 50—Reference Method for the Determination of Particulate Matter as PM10 in the Atmosphere; 52 FR 24664, 52 FR 29467; USEPA Federal Registry: Washington, DC, USA, 1987.
  27. ISO. Ambient air—Determination of the mass concentration of tire and road wear particles (TRWP)—Pyrolysis-GC-MS method. In Technical Specification; ISO: Geneva, Switzerland, 2017. [Google Scholar]
  28. Esposito, G.G. Quantitative pyrolytic gas chromatography by internal standard. Anal. Chem. 1964, 36, 2183–2185. [Google Scholar] [CrossRef]
  29. Moldoveanu, S.C. Pyrolysis GC/MS, present and future (recent past and present needs). J. Microcolumn Sep. 2001, 13, 102–125. [Google Scholar] [CrossRef]
  30. United States Environmental Protection Agency. Air Data: Pre-Generated Data Files. Available online: https://aqs.epa.gov/aqsweb/airdata/download_files.html (accessed on 15 May 2018).
  31. Fishman, R.; Turner, J. Tyre Wear Contributions to Ambient Particulate Matter; Washington University: St. Louis, MI, USA, 1999. [Google Scholar]
  32. Schauer, J.J.; Fraser, M.P.; Cass, G.R.; Simoneit, B.R. Source reconciliation of atmospheric gas-phase and particle-phase pollutants during a severe photochemical smog episode. Environ. Sci. Technol. 2002, 36, 3806–3814. [Google Scholar] [CrossRef] [PubMed]
  33. JATMA. Japan Automobile Tire Manufacturers Association; JATMA: Tokyo, Japan, 2001. [Google Scholar]
  34. Annema, J.; Booji, H.; Hesse, J.; van der Meulen, A.; Slooff, W.E. Integrated Criteria Document Fine Particulate Matter; RIVM: Bilthoven, The Netherlands, 1996; Volume 102. [Google Scholar]
  35. Israel, G.; Pesch, M.; Schlums, C. Bedeutung des Reifenabriebs für die Rußemission des Kfz-Verkehrs. Staub-Reinhaltung der Luft 1994, 54, 423–430. (In German) [Google Scholar]
  36. Rauterberg-Wulff, A. Beitrag des Reifen- und Bremsenabriebs zur Rußemission an Straßen; Dissertation am Fachgebiet Luftreinhaltung im Institut für Technischen Umweltschutz der Technischen Universität: Berlin, Germany, 1998. [Google Scholar]
  37. Huglin, C.; Gehrig, R. Contributions of Road Traffic to Ambient PM10 and PM2.5 Concentrations—Chemical Speciation of Fine Particulates and Source Attribution with a Receptor Model; Swiss Transport Conference: Monte Verita, Switzerland, 2000; Volume 14. [Google Scholar]
  38. Gualtieri, M.; Andrioletti, M.; Mantecca, P.; Vismara, C.; Camatini, M. Impact of tire debris on in vitro and in vivo systems. Part. Fibre Toxicol. 2005, 2, 1. [Google Scholar] [CrossRef]
  39. BLIC. BLIC Annual Report 2004–2005; European Tire and Rubber Manufacturers Association: Brussels, Belgium, 2005. [Google Scholar]
  40. Atkinson, R.W.; Analitis, A.; Samoli, E.; Fuller, G.W.; Green, D.C.; Mudway, I.S.; Anderson, H.R.; Kelly, F.J. Short-term exposure to traffic-related air pollution and daily mortality in London, UK. J. Expo. Sci. Environ. Epidemiol. 2015, 26, 125–132. [Google Scholar] [CrossRef] [Green Version]
  41. Atkinson, R.W.; Fuller, G.W.; Anderson, H.R.; Harrison, R.M.; Armstrong, B. Urban Ambient Particle Metrics and Health. Epidemiology 2010, 21, 501–511. [Google Scholar] [CrossRef]
  42. Bohnenstengel, S.I.; Belcher, S.E.; Aiken, A.; Allan, J.D.; Allen, G.; Bacak, A.; Bannan, T.J.; Barlow, J.F.; Beddows, D.C.S.; Bloss, W.J.; et al. Meteorology, Air Quality, and Health in London: The ClearfLo Project. Bull. Am. Meteorol. Soc. 2015, 96, 779–804. [Google Scholar] [CrossRef] [Green Version]
  43. Font, A.; Fuller, G.W. Did policies to abate atmospheric emissions from traffic have a positive effect in London? Environ. Pollut. 2016, 218, 463–474. [Google Scholar] [CrossRef] [PubMed] [Green Version]
  44. Kaur, S.; Nieuwenhuijsen, M.J. Determinants of personal exposure to PM2.5, ultrafine particle counts, and CO in a transport microenvironment. Environ. Sci. Technol. 2009, 43, 4737–4743. [Google Scholar] [CrossRef]
  45. Kendrick, C.M.; Koonce, P.; George, L.A. Diurnal and seasonal variations of NO, NO2 and PM2.5 mass as a function of traffic volumes alongside an urban arterial. Atmos. Environ. 2015, 122, 133–141. [Google Scholar] [CrossRef]
  46. Tolis, E.I.; Saraga, D.E.; Ammari, G.Z.; Gkanas, E.I.; Gougoulas, T.; Papaioannou, C.C.; Sarioglou, A.K.; Kougioumtzidis, E.; Skemperi, A.; Bartzis, J.G. Chemical characterization of particulate matter (PM) and source apportionment study during winter and summer period for the city of Kozani, Greece. Cent. Eur. J. Chem. 2014, 12, 643–651. [Google Scholar] [CrossRef]
  47. Akyüz, M.; Çabuk, H. Meteorological variations of PM2.5/PM10 concentrations and particle-associated polycyclic aromatic hydrocarbons in the atmospheric environment of Zonguldak, Turkey. J. Hazard. Mater. 2009, 170, 13–21. [Google Scholar] [CrossRef]
  48. Grigoratos, T.; Gustafsson, M.; Eriksson, O.; Martini, G. Experimental investigation of tread wear and particle emission from tyres with different treadwear marking. Atmos. Environ. 2018, 182, 200–212. [Google Scholar] [CrossRef]
  49. Dall’Osto, M.; Beddows, D.C.S.; Gietl, J.K.; Olatunbosun, O.A.; Yang, X.; Harrison, R.M. Characteristics of tyre dust in polluted air: Studies by single particle mass spectrometry (ATOFMS). Atmos. Environ. 2014, 94, 224–230. [Google Scholar] [CrossRef]
Figure 1. Scanning electron microscope (SEM) photo of tire and road wear particles (TRWP) with characteristic morphology of tread rubber and mineral incrustations from pavement.
Atmosphere 10 00099 g001
Figure 2. Same day comparison of tire and road wear particles (TRWP) in PM2.5 between urban background site and roadside sites.
Atmosphere 10 00099 g002
Figure 3. Ratio of TRWP in PM2.5 to PM10 at sampling locations in Tokyo and London.
Atmosphere 10 00099 g003
Table 1. Overview of PM2.5 Sampling Locations.
CitySite Name *nDistance from Road (m)Annual Average Daily Traffic CountSpeed Limit (mile/h)Meteorological Conditions (range)
Wind Speed (m/s)Temperature(°C)Humidity (%RH)Precipitation (mm)
Los AngelesAnaheim4738,738351.7 (1.5–2.2)25 (23.0–27.0)61 (55–65)0
Compton4107701302.1 (1.8–2.4)22.3 (21.4–24.1)71 (67–74)0
Exposition Park4732,831351.2 (0.9–1.3)23.9 (22.2–25.7)65 (62–68)0
Long Beach North44032,686352.7 (2.4–3.0)23.6 (22.2–23.9)66 (63–70)0
Mira Loma496284401.8 (1.3–2.1)25.7 (23.3–28.5)54 (44–62)0
Pico Rivera 24711,864452.1 (1.8–2.8)24.8 (22.9–27.4)51 (40–60)0
LondonBlackwall Tunnel Approach (PM2.5)5497,672401.6 (0.9–2.2)7.8 (6.4–9.7)72 (64–81)1.3 (0–4.2)
Blackwall Tunnel Approach (PM10)54
Brent, North Circular (PM2.5)54109,673401.5 (1.9–3.5)5.2 (2.7–6.9)80 (76–88)3.4 (0–8.6)
Brent, North Circular (PM10)54
Camden, Swiss Cottage41.547,250301.5 (0.4–2.7)5.2 (2.7–6.9)80 (76–88)4.2 (0–8.6)
Greenwich Blackheath (PM2.5)51034,377302.5 (1.–3.5)7.0 (5–7.8)71 (63–81)4.4 (0–9.2)
Greenwich Blackheath (PM10)510
Greenwich Falconwood41287,774502.7 (1.9–3.5)7.5 (7.1–7.8)69 (63–77)3.3 (0–7.4)
Marylebone Road51.566,404301.6 (0.9–2.2)7.8 (6.4–9.7)72 (64–81)1.3 (0–4.2)
North Kensington144----1.8 (0.4–2.8)6.8 (2.7–9.7)74 (63–88)2.6 (0–8.6)
Greater TokyoKawasaki: Industrial Road (PM2.5)4636,861370.8 (0.6–1.1)22.5 (21.2–23.6)66 (58–73)1.2 (0–3.7)
Kawasaki: Industrial Road (PM10)46
Tokyo: Ring Road No. 8 (PM2.5)44.566,792251 (0.9–1.1)22.3 (21.0–23.2)59 (52–68)1.3 (0–2.5)
Tokyo: Ring Road No. 8 (PM10)41.5
Tokyo: Suburban Way1016,658251.7 (1.3–2.7)21.8 (20.4–22.6)66 (59–73)3.6 (0–10.4)
Tokyo: Route 1542.452,532311.9 (1.5–2.4)22.9 (22.0–23.4)65 (57–71)5.1 (0–17.1)
n = number of samples collected; *: Pavement on all roads was asphalt.
Table 2. Summary of PM2.5 Air Sampling Results.
City (n)Site (n)Average Total PM2.5 (µg/m3)TRWP Detection Frequency—at least One Polymer Dimer Detected (%)TRWP Air Concentration (µg/m3)Average Contribution to PM2.5
Average *Minimum DetectedMaximum Detected
TRWPTreadTRWPTreadTRWPTreadTRWPTread
Los Angeles (24)7.09210.0120.0060.0040.0020.0720.040.19%0.10%
Anaheim (4)6.000NDNDNDNDNDNDNDND
Compton (4)5.00250.0040.0020.0040.0020.0040.0020.10%0.05%
Exposition Park (4)8.670NDNDNDNDNDNDNDND
Long Beach North (4)6.000NDNDNDNDNDNDNDND
Mira Loma (4)11.000NDNDNDNDNDNDNDND
Pico Rivera #2 (4)7.251000.0440.0220.0100.0050.0720.040.68%0.34%
London (42)18.35930.0420.0210.0120.0060.290.150.27%0.14%
Blackwall Tunnel Approach (5)26.60800.1040.0520.0300.0150.290.150.49%0.25%
Brent, North Circular (5)27.461000.0320.0160.0160.0080.0560.030.11%0.06%
Camden, Swiss Cottage (4)19.691000.0270.0130.0150.0080.0540.030.13%0.06%
Greenwich Blackheath (5)6.231000.0140.0070.0140.0070.0150.010.37%0.19%
Greenwich Falconwood (4)5.871000.0150.0080.0130.0070.0180.010.27%0.14%
Marylebone Road (5)28.38800.0710.0360.0180.0090.270.140.25%0.13%
North Kensington (14)16.09930.0340.0170.0120.0060.1270.060.26%0.13%
Greater Tokyo (16)12.48880.0220.0110.0100.0050.10.050.17%0.09%
Kawasaki: Industrial Road (4)15.201000.0280.0140.0220.0110.0370.020.18%0.09%
Tokyo: Ring Road No. 8 (4)11.551000.0380.0190.0140.0070.10.050.33%0.17%
Tokyo: Route 15 (4)11.95500.0120.0060.0150.0080.0230.010.10%0.05%
Tokyo: Suburban Way (4)11.231000.0120.0060.0100.0050.0160.010.10%0.05%
Overall (82)14.50720.0300.0150.0040.0020.290.150.23%0.12%
n = total; # samples taken; * Non-detect values were imputed using regression on order statistics method; ND = not detected.
Table 3. Summary of PM10 Air Sampling Results.
City (n)Site (n)Average PM10 (µg/m3)TRWP Air Concentration (µg/m3)Average Contribution to PM10
TRWP Detection Frequency—at least One Polymer Dimer Detected (%)AverageMinimum DetectedMaximum Detected
TRWPTreadTRWPTreadTRWPTreadTRWPTread
London (15)47.431001.250.620.340.174.482.242.40%1.20%
Blackwall Tunnel Approach (5)53.101001.350.670.480.243.241.622.48%1.24%
Brent, North Circular (5)67.731001.910.950.450.2254.482.242.46%1.23%
Greenwich Blackheath (5)21.471000.490.240.340.170.730.3652.27%1.13%
Greater Tokyo (8)26.061000.300.150.0810.04050.660.331.07%0.53%
Kawasaki: Industrial Road (4)30.651000.510.260.350.1750.660.331.69%0.84%
Tokyo: Ring Road No. 8 (4)21.481000.0950.050.0810.04050.10.050.45%0.23%
Grand Total (23)40.001000.920.460.0810.04054.482.241.94%0.97%

