Filtration Performance Characteristics of Sticky Aerosol Using Calcium Hydroxide

Abstract
:1. Introduction
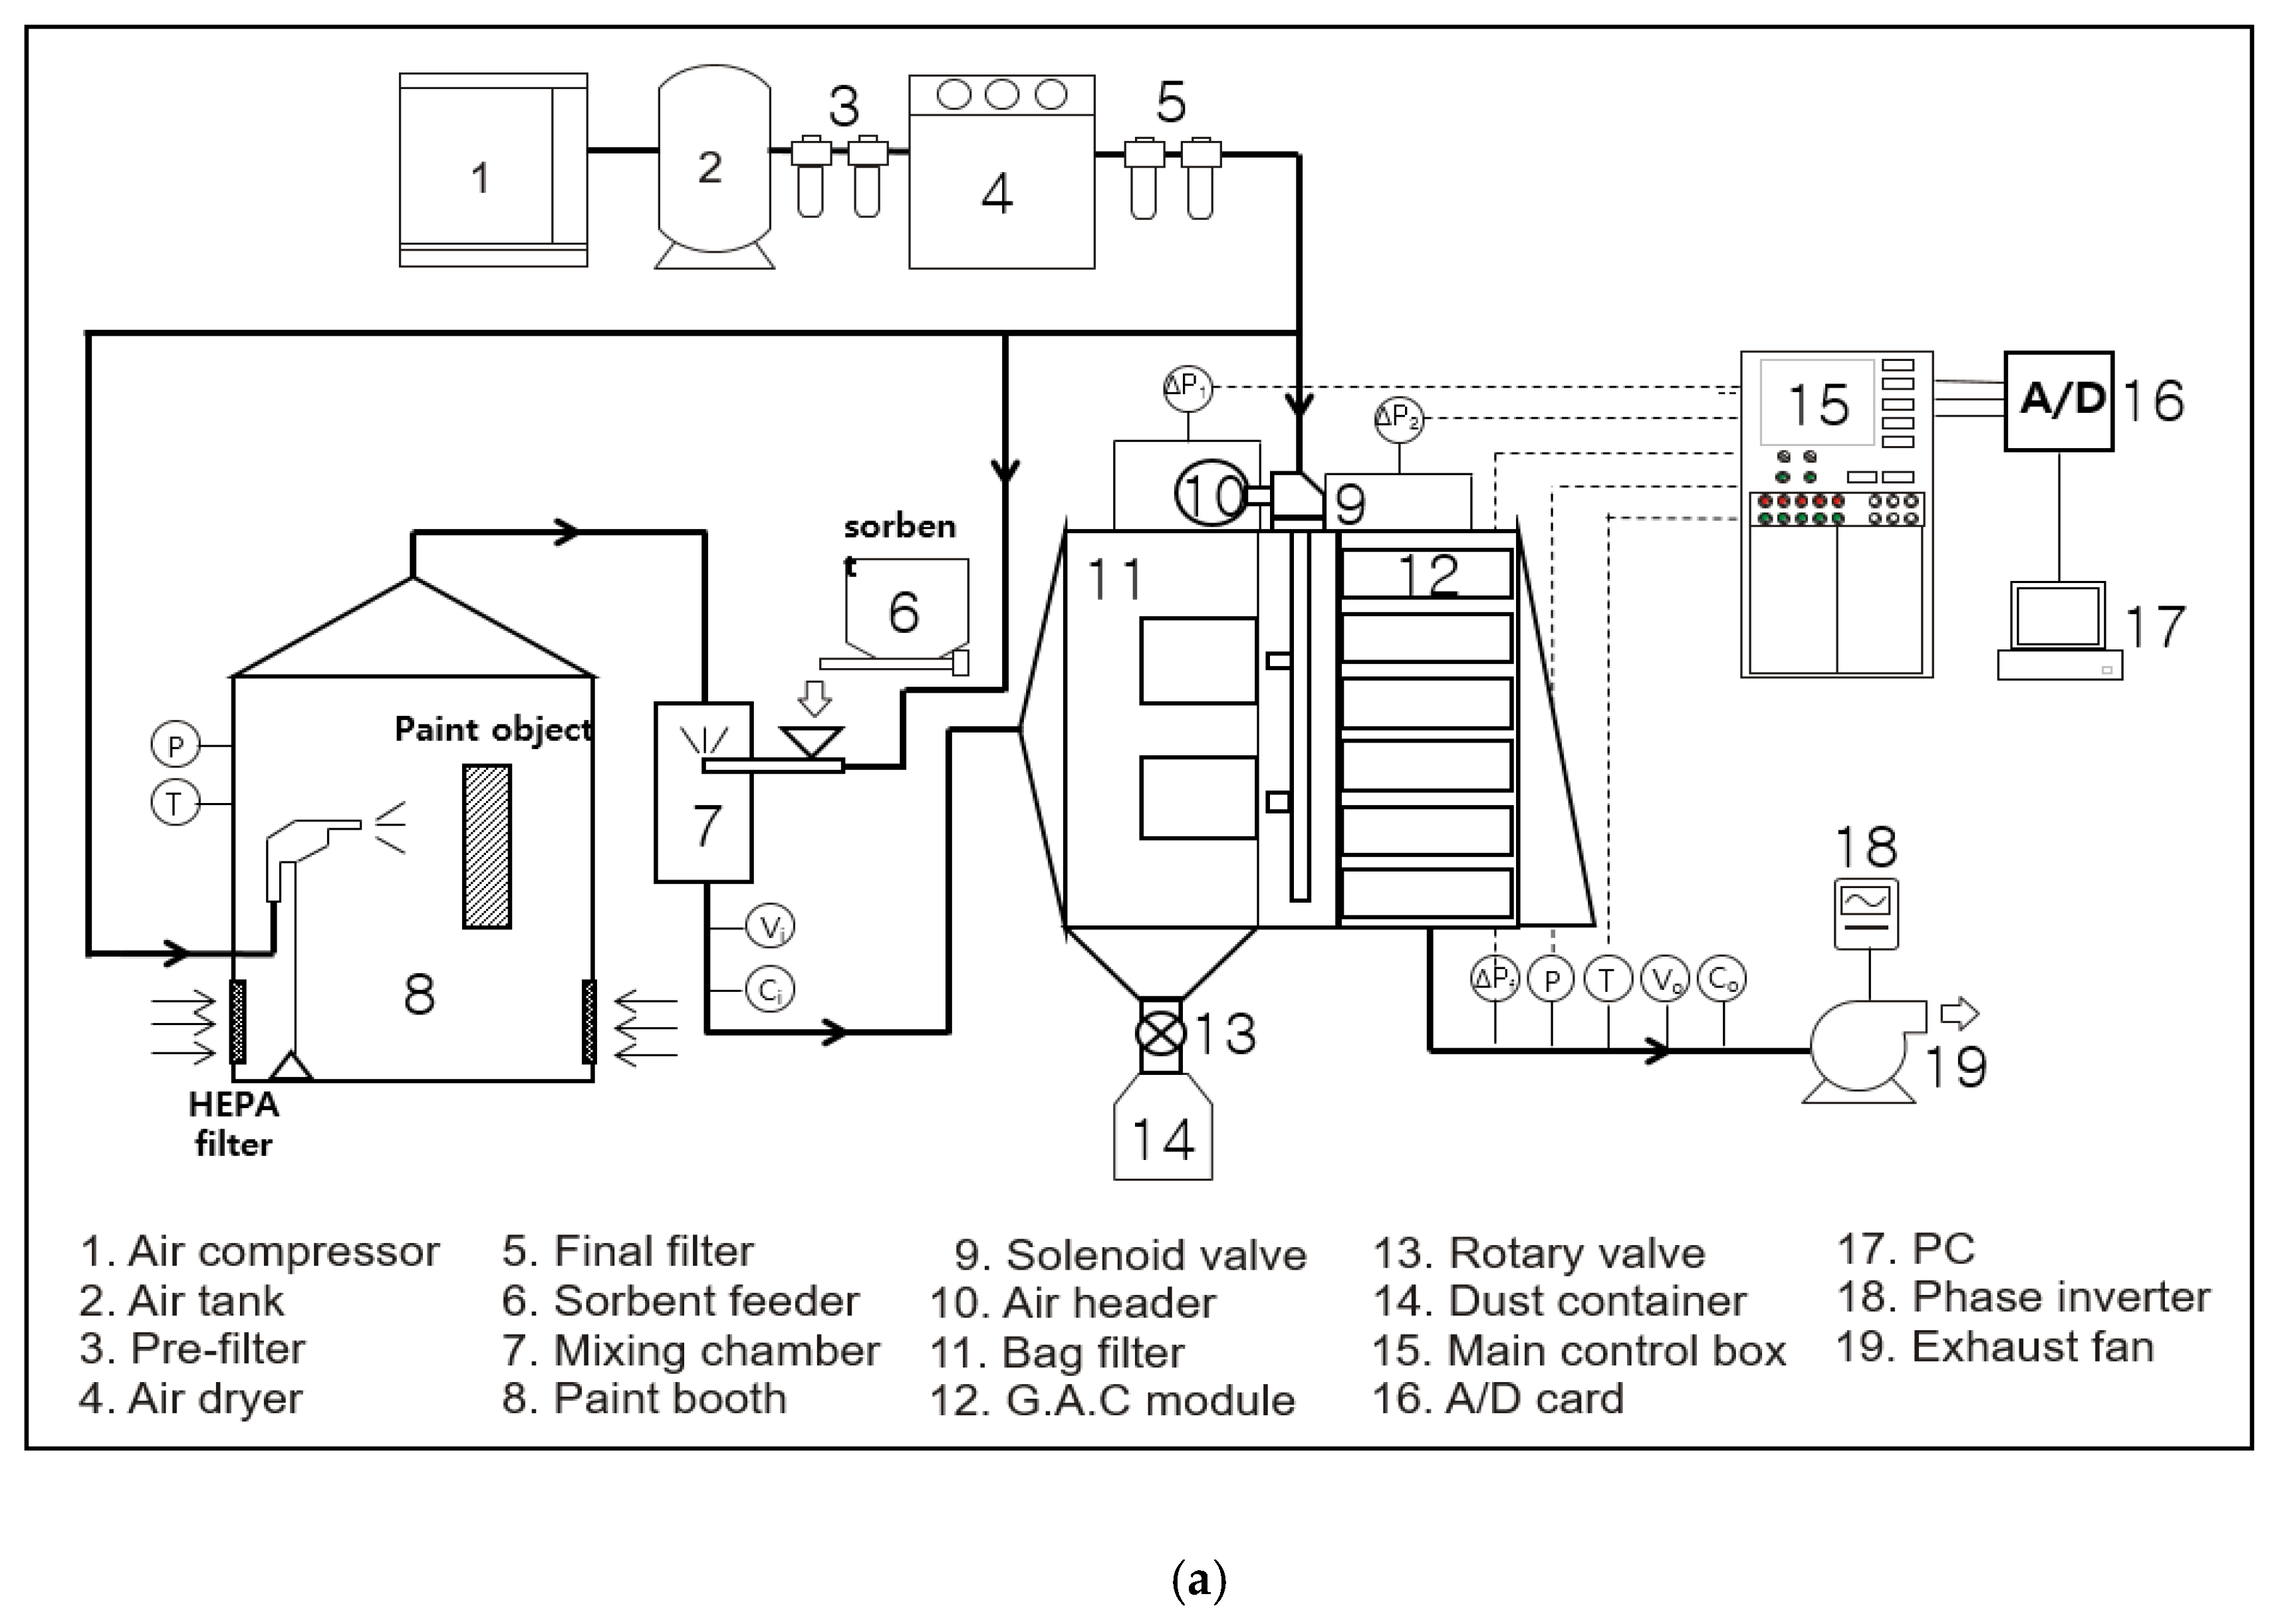
2. Material and Methods
2.1. Paint
2.2. Calcium Hydroxide
2.3. Filter
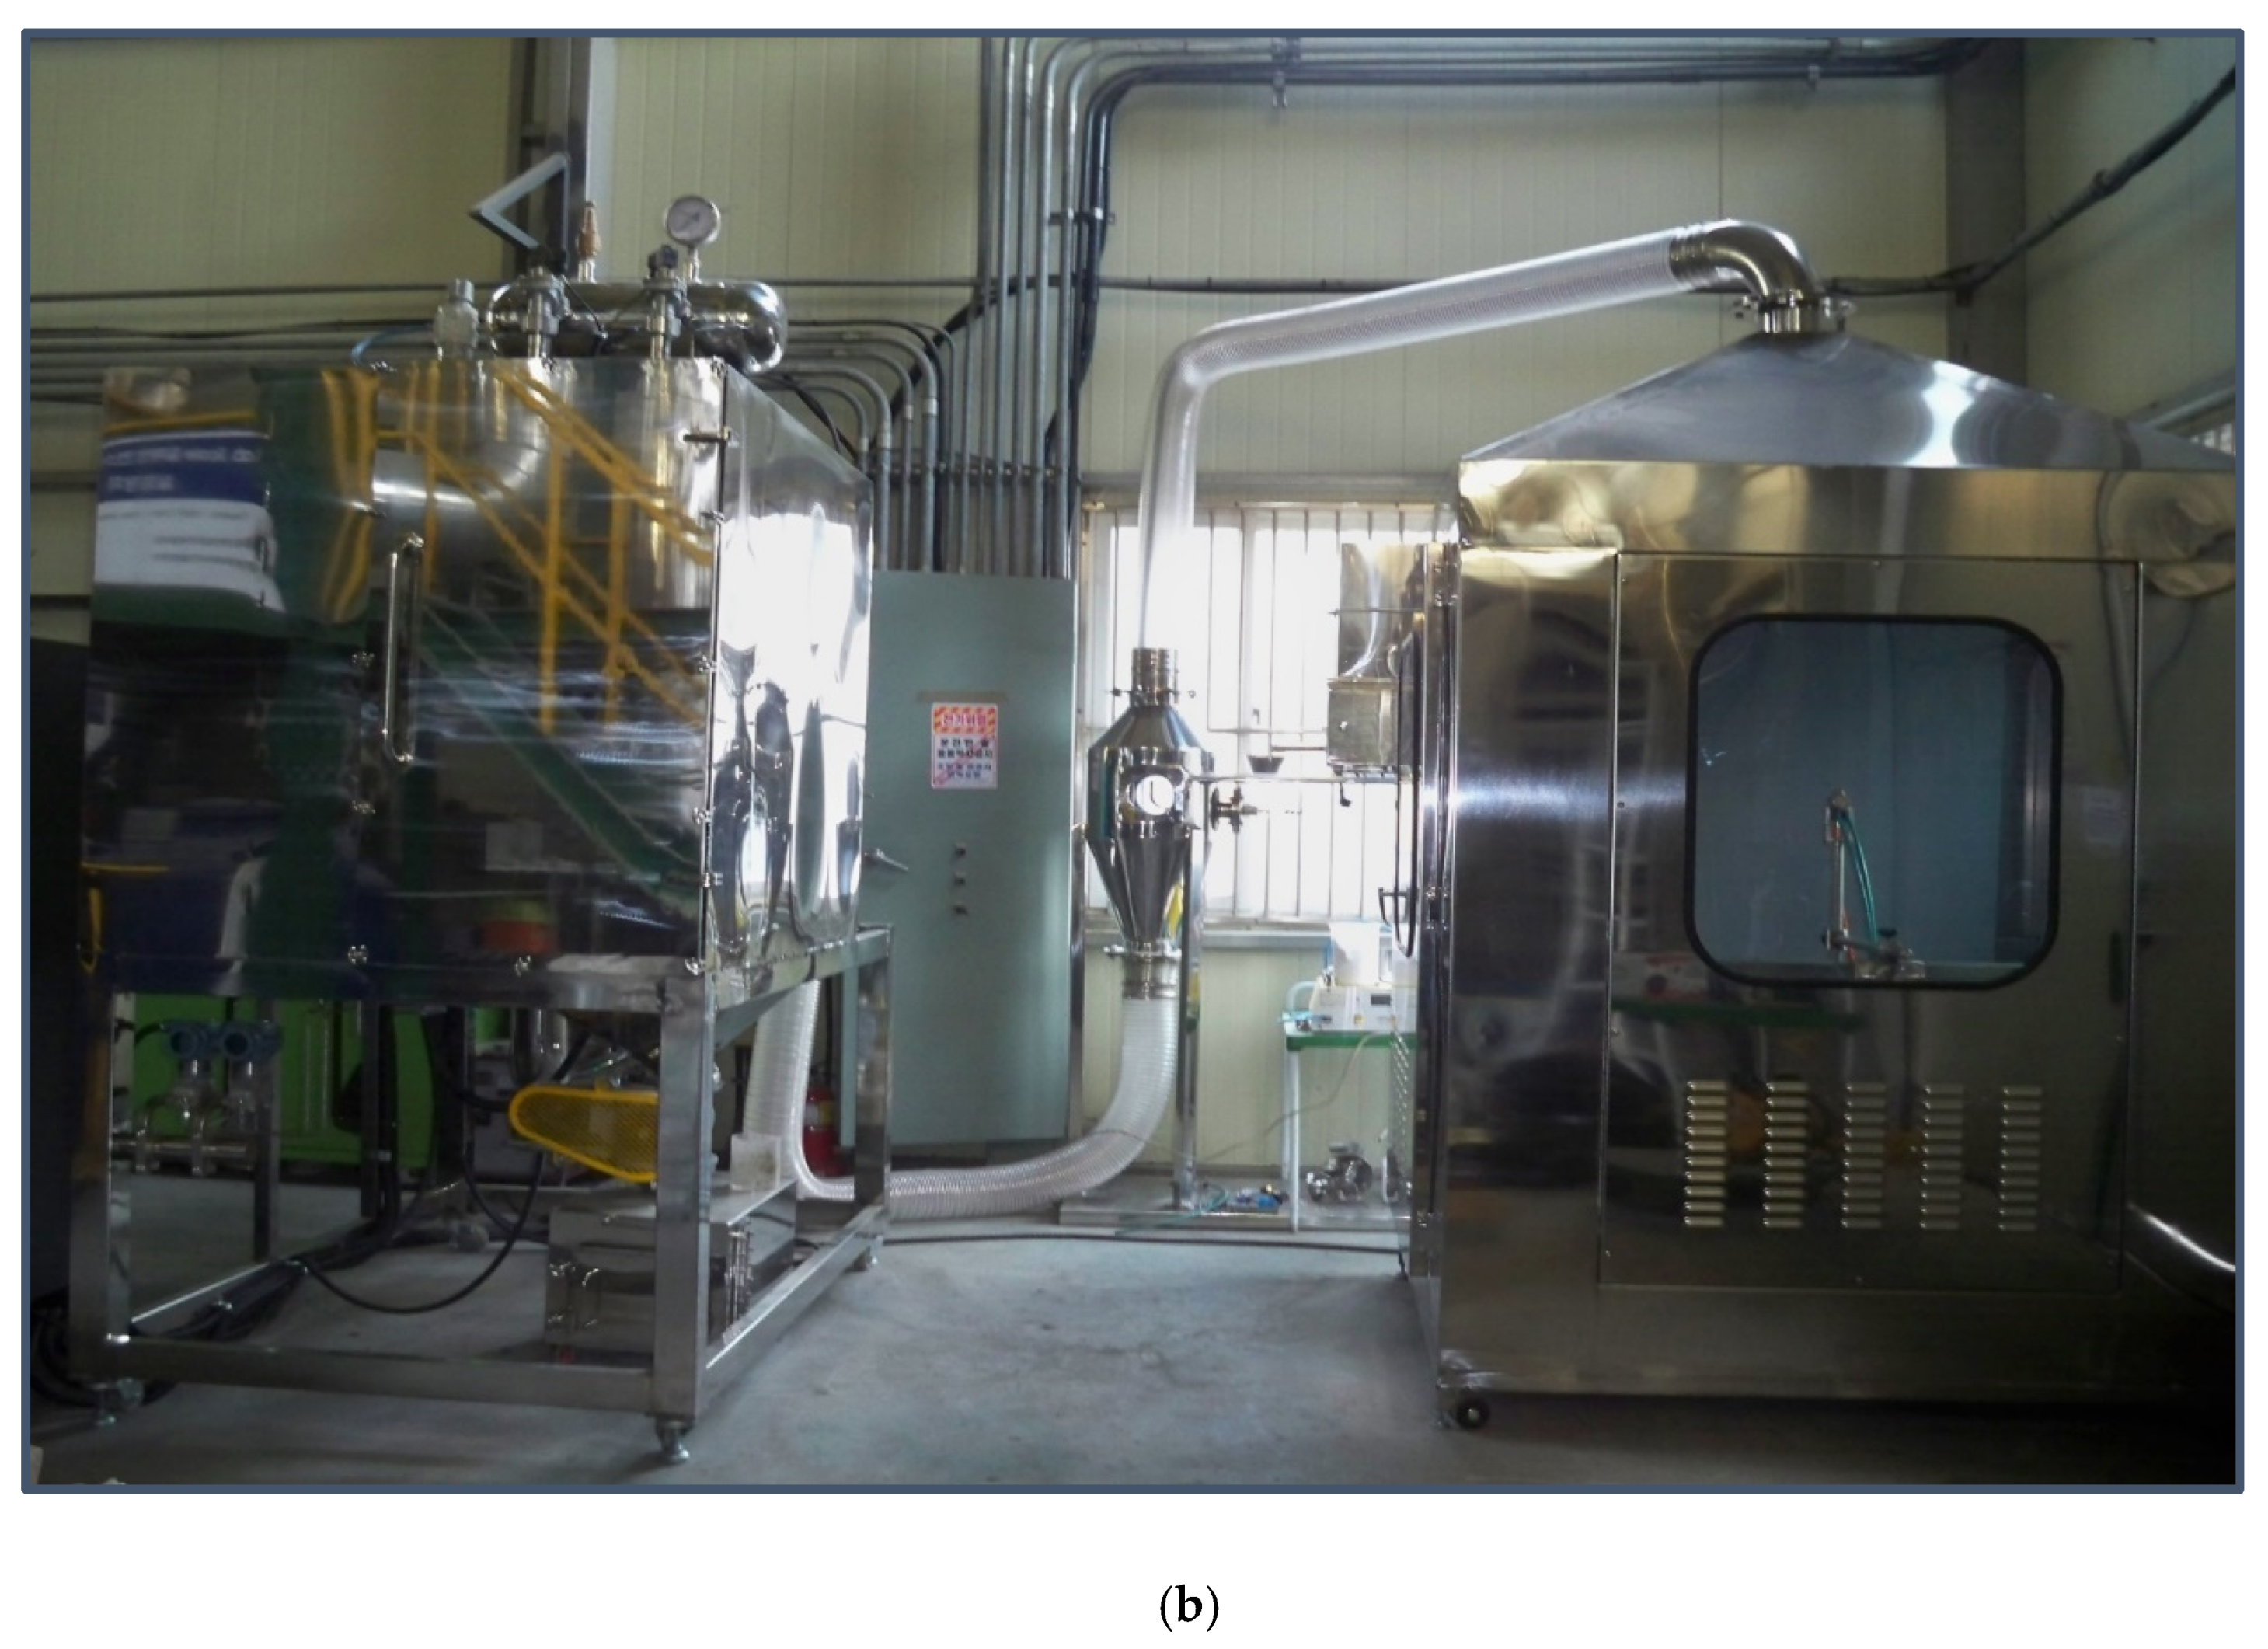
2.4. Procedure
3. Results and Discussion
3.1. Theory
3.2. Cleaning Interval
3.3. Residual Pressure Drop
3.4. Cleaning Efficiency
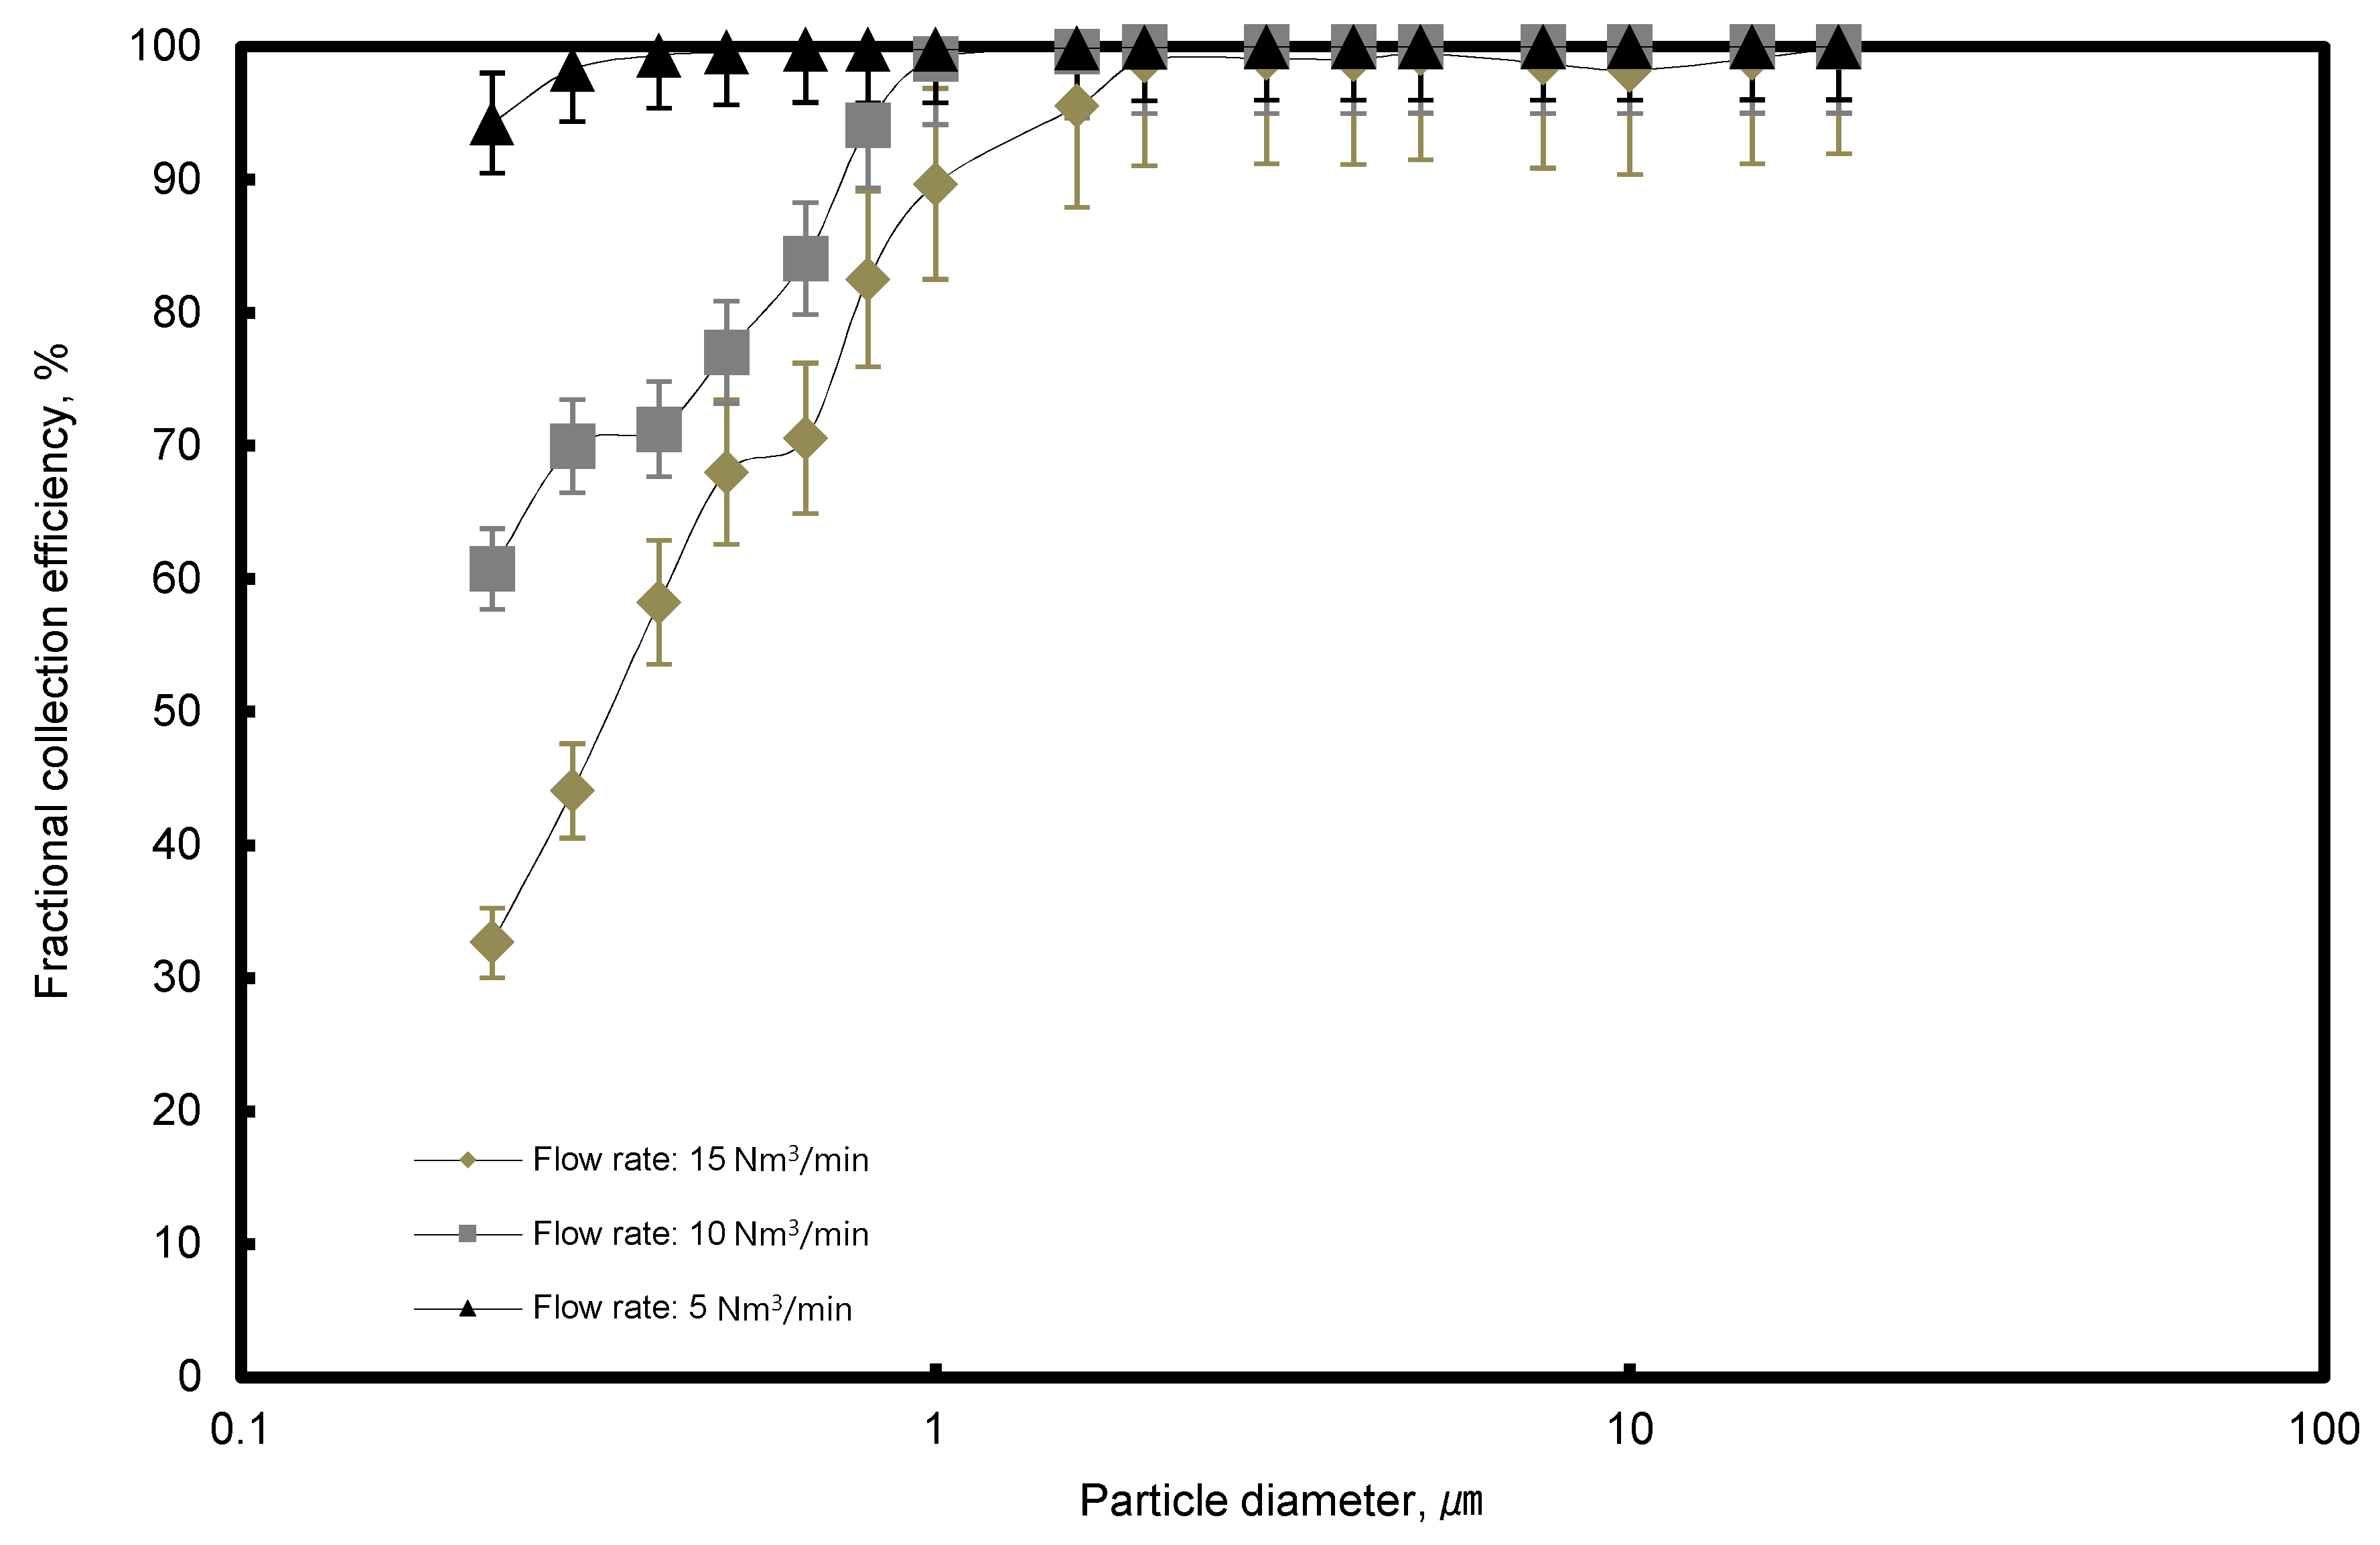
3.5. Collection Efficiency
3.6. Image Analysis
4. Conclusions
Author Contributions
Funding
Conflicts of Interest
References
- Pope, C.A., III; Burnett, R.T.; Thun, M.J.; Calle, E.E.; Krewski, D.; Ito, K.; Thurston, G.D. Lung cancer cardiopulmonary mortality and long-term exposure to fine particulate air pollution. JAMA 2002, 287, 1132–1141. [Google Scholar] [CrossRef]
- Feng, L.; Jianlei, N.; Zhang, L. A physically-based model for prediction of VOCs emissions from paint applied to an absorptive substrate. Build. Environ. 2006, 41, 1317–1325. [Google Scholar]
- Joe, Y.H.; Shim, J.; Shin, W.G.; Park, H.S. Simple self-diagnostic method to identify the abnormal functioning of a scanning mobility particle sizer. J. Aerosol Sci. 2017, 114, 130–138. [Google Scholar] [CrossRef]
- Zhang, G.S.; Li, T.T.; Luo, M.; Liu, J.F.; Liu, Z.R.; Bai, Y.H. Air pollution in the microenvironment of parked new cars. Build. Environ. 2008, 43, 315–319. [Google Scholar] [CrossRef]
- Sibanda, V.; Greenwood, R.W.; Seville, J.P.K. Particle separation from gases using cross-flow filtration. Powder Technol. 2001, 118, 193–202. [Google Scholar] [CrossRef]
- Huang, S.L.; Yin, C.Y.; Yap, S.Y. Particle size and metals concentrations of dust from a paint manufacturing plant. J. Hazard. Mater. 2010, 174, 839–842. [Google Scholar] [CrossRef] [PubMed]
- LaPuma, P.T.; Joseph, M.F.; Edgar, C.K. Chromate concentration bias in primer paint particles. Regul. Toxicol. Pharmacol. 2001, 33, 343–349. [Google Scholar] [CrossRef] [PubMed]
- Gondal, M.A.; Hussain, T. Determination of poisonous metals in wastewater collected from paint manufacturing plant using laser-induced breakdown spectroscopy. Talanta 2007, 71, 73–80. [Google Scholar] [CrossRef] [PubMed]
- Lambourne, R.; Strivens, T.A. (Eds.) Paint and Surface Coatings: Theory and Practice; Elsevier: Amsterdam, The Netherlands, 1999. [Google Scholar]
- Koponen, I.K.; Jensen, K.A.; Schneider, T. Sanding dust from nanoparticle-containing paints: Physical characterisation. J. Phys. Conf. Ser. 2009, 151, 012048. [Google Scholar] [CrossRef]
- Lee, K.S.; Hasolli, N.; Jeon, S.M.; Lee, J.R.; Kim, K.D.; Park, Y.O.; Hwang, H.J. Filter layer structure effect on the most penetrating particle size of multilayered flat sheet filter. Powder Technol. 2019, 344, 270–277. [Google Scholar] [CrossRef]
- Kim, J.H.; Kim, Y.C.; Choi, J.H. Characteristics of pressure drop during the pulse-jet cleaning of a ceramic filter for high temperature and high pressure. Korean J. Chem. Eng. 2016, 33, 726–734. [Google Scholar] [CrossRef]
- Park, Y.O.; Kim, K.S.; Son, J.E.; Rhee, Y.W.; Choi, W.S. Demonstration of a KIER-Type CYBAGFILTER system at the clinker calcination process. Korean J. Chem. Eng. 2000, 17, 579–584. [Google Scholar] [CrossRef]
- Ellenbecker, M.J.; Leith, D. Dust removal characteristics of fabrics used in pulse-jet filters. Powder Technol. 1983, 36, 13–19. [Google Scholar] [CrossRef]
- Lee, K.S.; Sohn, J.R.; Park, Y.O. Filtration performance characteristics of ceramic candle filter based on inlet structure of high-temperature and high-pressure dust collectors. J. Ind. Eng. Chem. 2015, 21, 101–110. [Google Scholar] [CrossRef]
- Shim, J.M.; Joe, Y.H.; Park, H.S. Influence of air injection nozzles on filter cleaning performance of pulse-jet bag filter. Powder Technol. 2017, 322, 250–257. [Google Scholar] [CrossRef]
- Lu, H.C.; Tsai, C.J. A pilot-scale study of the design and operation parameters of a pulse-jet baghouse. Aerosol Sci. Technol. 1998, 29, 510–524. [Google Scholar] [CrossRef]
- Chen, Y.S.; Hsiau, S.S.; Lai, S.C.; Chyou, Y.P.; Li, H.Y.; Hsu, C.J. Filtration of dust particulates with a moving granular bed filter. J. Hazard. Mater. 2009, 171, 987–994. [Google Scholar] [CrossRef] [PubMed]
- Leung, W.W.F.; Hung, C.H.; Yuen, P.T. Effect of face velocity nanofiber packing density and thickness on filtration performance of filters with nanofibers coated on a substrate. Sep. Purify. Technol. 2010, 71, 30–37. [Google Scholar] [CrossRef]
- Kanaoka, C.; Emi, H.; Myojo, T. Simulation of the growing process of a particle dendrite and evaluation of a single fiber collection efficiency with dust load. J. Aerosol Sci. 1980, 11, 377–389. [Google Scholar] [CrossRef]
- Brown, R.C.; Wake, D. Loading filters with monodisperse aerosols: Macroscopic treatment. J. Aerosol Sci. 1999, 30, 227–234. [Google Scholar] [CrossRef]


| Compounds | Mole Fraction |
|---|---|
| Toluene | 0.801 |
| m/p-Xylene | 0.042 |
| Butylacetate | 0.054 |
| Methyl Ethyl Ketone | 0.025 |
| Ethylbenzene | 0.065 |
| o-Xylene | 0.004 |
| Ethylacetate | 0.005 |
| Acetone | 0.004 |
| Parameter | Value |
|---|---|
| Filtration area | 32 m2 |
| Pleat number | 400 |
| Filter media material | Polyester, membrane coating |
| Filter thickness | 550 μm |
| Quality of the filter media | PTFE(Polytetrafluoroethylene) |
| Air permeability | 7.5 cm3/cm2/s |
| Cartridge dimension | 494 mm × 1050 mm |
| Parameter | Value |
|---|---|
| Flow rate | 5, 10, 15 Nm3/min |
| Number of filter elements | 4 |
| Type of filter | Bag filter |
| Dimension of the filter | Depth: 494 mm Height: 1050 mm Thickness: 100 mm |
| Pulsing system unit | T-type pulse injector |
| Cohesive agent type | Calcium hydroxide |
| Feed rate of calcium hydroxide | 10 g/min |
| Feed rate of paint | 10 g/min |
© 2019 by the authors. Licensee MDPI, Basel, Switzerland. This article is an open access article distributed under the terms and conditions of the Creative Commons Attribution (CC BY) license (http://creativecommons.org/licenses/by/4.0/).
Share and Cite
Lee, J.-R.; Hasolli, N.; Jeon, S.-M.; Lee, K.-S.; Gang, J.-H.; Kim, K.-D.; Lee, K.-Y.; Park, Y.-O. Filtration Performance Characteristics of Sticky Aerosol Using Calcium Hydroxide. Atmosphere 2019, 10, 100. https://doi.org/10.3390/atmos10020100
Lee J-R, Hasolli N, Jeon S-M, Lee K-S, Gang J-H, Kim K-D, Lee K-Y, Park Y-O. Filtration Performance Characteristics of Sticky Aerosol Using Calcium Hydroxide. Atmosphere. 2019; 10(2):100. https://doi.org/10.3390/atmos10020100
Chicago/Turabian StyleLee, Jae-Rang, Naim Hasolli, Seong-Min Jeon, Kang-San Lee, Jun-Hyeok Gang, Kwang-Deuk Kim, Kwan-Young Lee, and Young-Ok Park. 2019. "Filtration Performance Characteristics of Sticky Aerosol Using Calcium Hydroxide" Atmosphere 10, no. 2: 100. https://doi.org/10.3390/atmos10020100
APA StyleLee, J.-R., Hasolli, N., Jeon, S.-M., Lee, K.-S., Gang, J.-H., Kim, K.-D., Lee, K.-Y., & Park, Y.-O. (2019). Filtration Performance Characteristics of Sticky Aerosol Using Calcium Hydroxide. Atmosphere, 10(2), 100. https://doi.org/10.3390/atmos10020100