Article

Plum Rain-Season-Oriented Modelling and Intervention of Indoor Humidity with and without Human Occupancy

1
School of Energy and Environment, Southeast University, Nanjing 210096, China
2
Institute of Building Environment and Energy efficiency, China Academy of Building Research, Beijing 100013, China
*
Author to whom correspondence should be addressed.
Atmosphere 2019, 10(2), 97; https://doi.org/10.3390/atmos10020097
Submission received: 25 January 2019 / Revised: 18 February 2019 / Accepted: 19 February 2019 / Published: 22 February 2019

Abstract

:
The plum rain season, caused by precipitation along a persistent stationary Mei-Yu front in East Asia, creates favorable temperatures and relative humidity (RH) for mold growth indoors. This paper investigates the effects of human occupancy on indoor humidity and investigates the efficient RH reduction methods to prevent mold growth in moist climates. The research is carried out based on a case study which compares a family-occupied home and another unoccupied one during typical plum rain season in Nanjing. Firstly, by analyzing the factors that can influence the indoor air RH, this paper develops a comprehensive model to evaluate the efficiency of various RH intervention methods. Secondly, this paper collects the meteorological data in Nanjing at different time scales, from days to hours. Thirdly, a specific case study is carried out based on the model and data. The results show that dehumidification and heating can always reduce RH below the critical value under which the mold growth could be inhibited. However, the effects of ventilation are more sophisticated and depend upon the human occupancy, outdoor air temperature, and air change per hour (ACH). In certain unoccupied cases, the ventilation may be inappropriate and may continuously bring moisture outside into the indoor environment, which has adverse effects on mold suppression. In the occupied cases, the condition changes significantly because the human is deemed as an internal source of heat and moist. Special care should be exercised for occupied ventilation in order to determine the optimal ACH and appropriate outdoor temperatures. Finally, some guidance is given to prevent mold growth in the general area that suffers from the plum rain season.

1. Introduction

The plum rain season, academically known as East Asian rainy season, is a distinctive phenomenon in East Asia, especially representative in the middle and lower reaches of the Yangtze River, China [1]. It is caused by heavy precipitation along a persistent stationary Mei-Yu front, usually lasting from June to July, with frequent rainfalls after a slowly drifting cold front meets a moist and stable subtropical air mass. Due to the sustained rainy days in the plum rain season, high temperature and high relative humidity (RH) appear simultaneously in both indoor and outdoor environments, creating a favorable condition to promote mold growth [2], which is recognized as a major health hazard for occupants in indoor environments [3]. The adverse health effects associated with exposure to indoor mold contaminants and their metabolites by means of inhalation, ingestion, and dermal contact [4] have been supported by many clinical and epidemiological studies, including asthma, allergy, cough, and other respiratory symptoms [5,6,7,8].
The mold growth in building environments is determined by various factors: the moisture content, the surface air temperature, the substrate type, the nutrients, etc. [9,10,11]. Among these, the indoor air RH is revealed as a key element [12,13,14]. Molds were found to grow rampantly in environments with simultaneous high temperature and high RH [2,15], such as the plum rain season. Liu et al. [16] conducted a study on bio-aerosols in the university dormitory during the plum rain season, showing that the concentration of fungi was considerably higher than that of bacteria. The prevalence of indoor molds ranges from 5% to 10% in a cold climate, while the estimates have been between 10–30% in residential environments in moderate or warm climate [17]. It is noted that a comfortable thermal and moisture environment that favors occupants also facilitates mold growth [2].
The critical relative humidity (RHcrit), proposed in the widely used VTT model (developed at VTT Technical Research Centre of Finland) [15,18], is a decisive parameter which is defined as the minimum RH suitable for mold growth. The RHcrit applied in the VTT model corresponds to mold index (MI) = 1, also referring to the initial stages of mold growth [15]. It indicates the necessity and timing for avoiding mold growth. Specifically, the mold index, ranging from 0 to 6, was defined to evaluate the total growth activity of different mixed mold species, while 0 was for no spores activated and 6 was for a very heavy and tight mold growth [18]. The humidity requirement for the onset of mold growth was discussed under varying climate conditions and materials [10,11,19]. Maintaining the indoor thermal conditions (i.e., temperature and RH) is a simple but effective way to avoid mold growth in existing buildings during the plum rain season, which still remains to be addressed practically.
The indoor thermal environment is affected by indoor heat sources, moisture sources, outdoor ventilation, occupants and their activities, etc. As described in previous studies, the indoor air temperature is determined by the thermal conservation equation, where heat source, heat sink, thermal capacity, and ventilation rate are crucial factors [20]. For humidity control, the general mass conservation equation has been employed widely and presented in previous literature [21], indicating the crucial role of ventilation in transporting moisture between indoor and outdoor environments [22]. It is noted that heat and moisture are concurrently induced by outdoor ventilation and could remarkably affect the indoor air RH and temperature for mold growth [23,24]. In respect to the indoor thermal environment, occupants contribute themselves as an indispensable component of indoor heat and moisture sources. Both heat and moisture generated by humans depend on their activities, such as working status and cleaning activities [25], which have a significant effect on the indoor thermal conditions.
In this paper, a case study was carried out based on the proposed model, and the climate data was collected in Nanjing, China. It is revealed that the role of human occupancy has great effects on the means to avoid mold growth during the plum rain season. An ordinary three persons’ family (parents and one child) was chosen to compare the occupied home with the unoccupied one to investigate the difference of indoor air RH. The VTT model was employed to identify the critical RH for mold growth. Ventilation, dehumidification, and heating methods were discussed in both unoccupied and occupied homes, so as to effectively avoid mold growth during the plum rain season and other high humidity climates.

2. Problem Formulation

2.1. Assumptions and Specifications

The following assumptions are employed to simplify and facilitate the model and subsequent analysis:
(1)
The building envelope is made of concrete blocks with thickness 0.2 m.
(2)
The combined thermal mass consists of the external wall and indoor air, whose temperatures are equal.
(3)
The indoor air is well mixed, indicating that air temperature and RH are uniform in the room.
(4)
The ventilation rate is a constant and described by different ACH (h−1).
(5)
The combined convective heat transfer coefficient between the building envelope and the outdoor air is 5W/(m2·°C) [26].
(6)
The initial indoor air temperature and RH equal to the average outdoor meteorological parameters during the plum rain season.
(7)
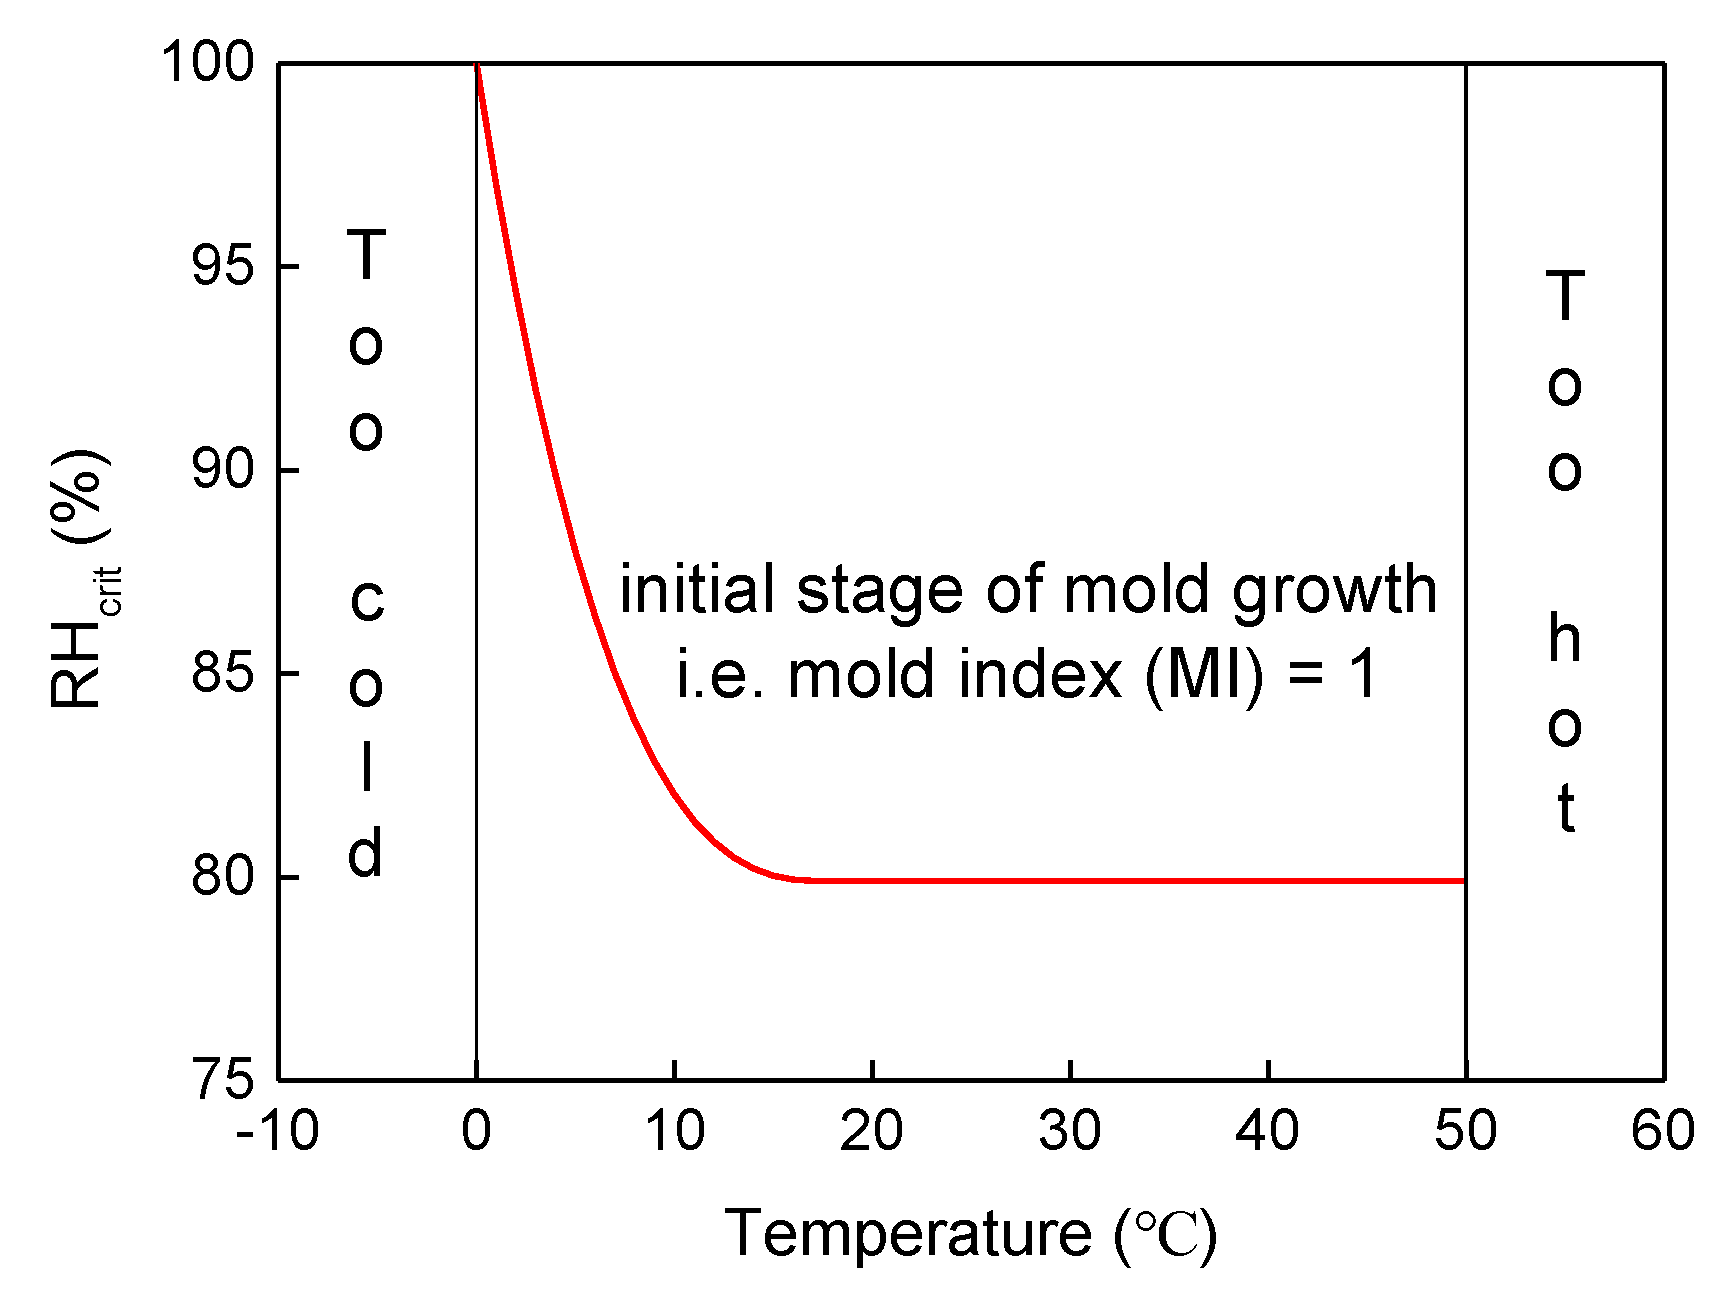
Mold grows only on the wooden building structures and materials.
The physical parameters of the building envelope and air employed in this study are summarized in Table 1.

2.2. Model Equations
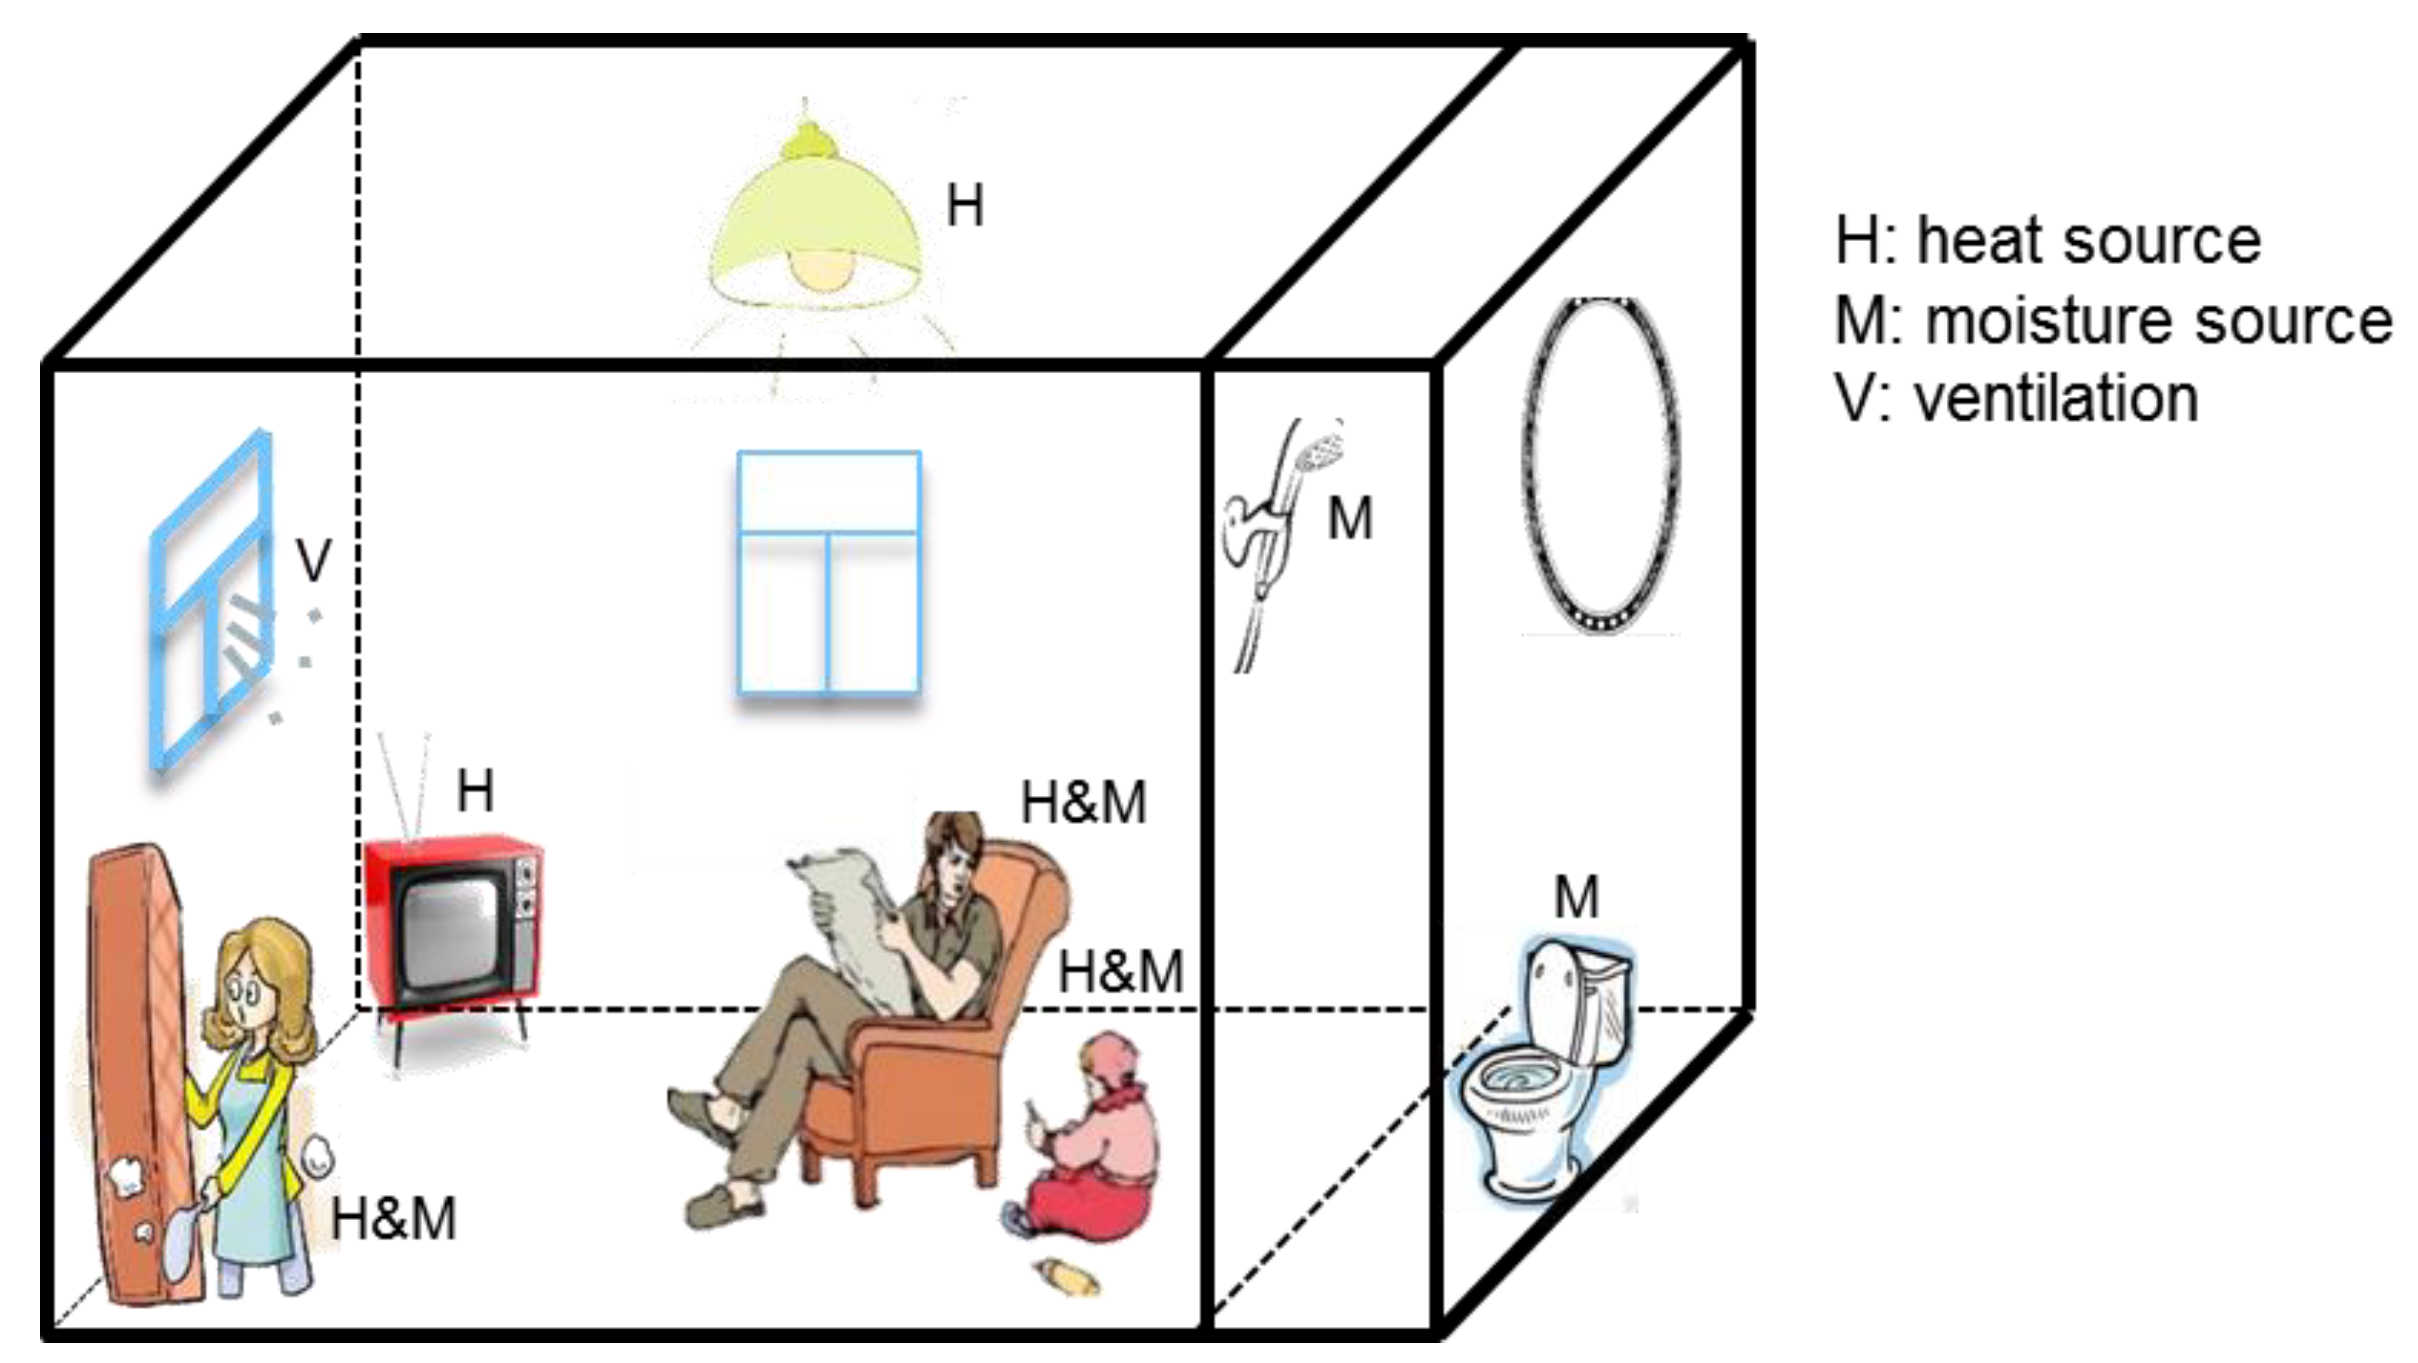
The critical relative humidity, RHcrit (%), originating from the widely used VTT model, was employed in this study. Similarly, Alev et al. [23] carried out a study on avoiding mold growth in an interiorly insulated log wall in a cold climate, where no mold was accepted (i.e., MI < 1). As displayed in Figure 1, the RHcrit suggests the lowest humidity required for mold growth on wooden materials.
Corresponding to Figure 1, the RHcrit follows the polynomial function of the temperature, which is written as [9]:
R H c r i t = { 0.00267 T 3 + 0.16 T 2 3.13 T + 100 , T < 20   ° C 80 % , T > 20   ° C
where RHcrit is the critical RH, %, and T is the surface air temperature, °C.
When the outdoor fresh air is introduced inside, both heat and moisture of outdoor air are transferred into the indoor environment, influencing both temperature and RH indoors. The indoor thermal and humidity environment is dominated by the heat and mass conservation equations. According to the first law of thermodynamics, the heat balance equation for the building can be written as below:
c m d T d t = ρ c p q ( T o T ) + h A ( T o T ) + Q
where cm is the combined thermal mass of the external wall and indoor air, J/°C; ρ is the air density, kg/m3; cp is the air heat capacity, J/(kg∙°C); q is the ventilation rate, m3/s; T is the indoor air temperature, °C; To is the outdoor air temperature, °C; h is the combined heat transfer coefficient for the external wall, W/(m2∙°C); A is the area of the external wall, m2; and Q is the heat source (positive) or sink (negative), W.
The general mass conservation of pollutants in a tow-zone building was presented by previous authors [22], which is also adoptable for other non-pollutants, e.g., air moisture. The moisture transferring from the external wall is considered as the moisture source or sink, and the mass conservation equation of indoor air moisture is simplified to:
M d D d t = ρ q ( D o D ) + W
where M is the mass of indoor air, kg; D is the indoor air moisture content, g/kg; Do is the outdoor air moisture content, g/kg; and W is the moisture source (positive) or sink (negative), g/s.
The RH can be described as:
R H = D D b × 100 %
where Db is the saturated moisture content, g/kg.
The saturated moisture content is obtained empirically [27]:
D b = 3.7 + 0.286 T + 9.164 × 10 3 T 2 + 1.446 × 10 4 T 3 + 1.741 × 10 6 T 4 + 5.195 × 10 8 T 5

2.3. Case Scenario

Based on the report issued by Nanjing Meteorology, the plum rain season in Nanjing in 2015 lasted from 24 June 2015 to 13 July 2015, showing typical rich rainfall of the plum rain season. During this period, the rainfall in the main urban area was up to 374.7 mm. Meteorological parameters were measured by a Vantage Pro2 weather station (DAVIS Inc., Hayward, CA, USA) every half an hour during this typical plum rain season in 2015.
To compare the effects of human occupancy on humidity control, a typical Chinese apartment was chosen when it is unoccupied or occupied by parents and one child. The residence size is assumed to be 10 m (long) × 10 m (wide) × 2.7 m (high) according to normal construction conditions for homes in China.
To simplify the calculation, the activity of occupants in the indoor environment is assumed to be sitting quietly. In respect to the normal settings of the most families in Nanjing, the heat sources consist of occupants, lamps, electric devices, etc., while the moisture sources include the occupants, toilet, and probably a wet floor caused by swapping or other household cleanings. The total heat source is set to be 325 W, including heat generated from occupants, lights, and equipment. The moisture source is dominated by occupants. The combined moisture originating from a woman and a child is simplified to be equal with that originating from a male adult, whose strength is 0.019 g/(s∙person) [25]. The sketch map of an ordinary home is shown in Figure 2.

3. Results

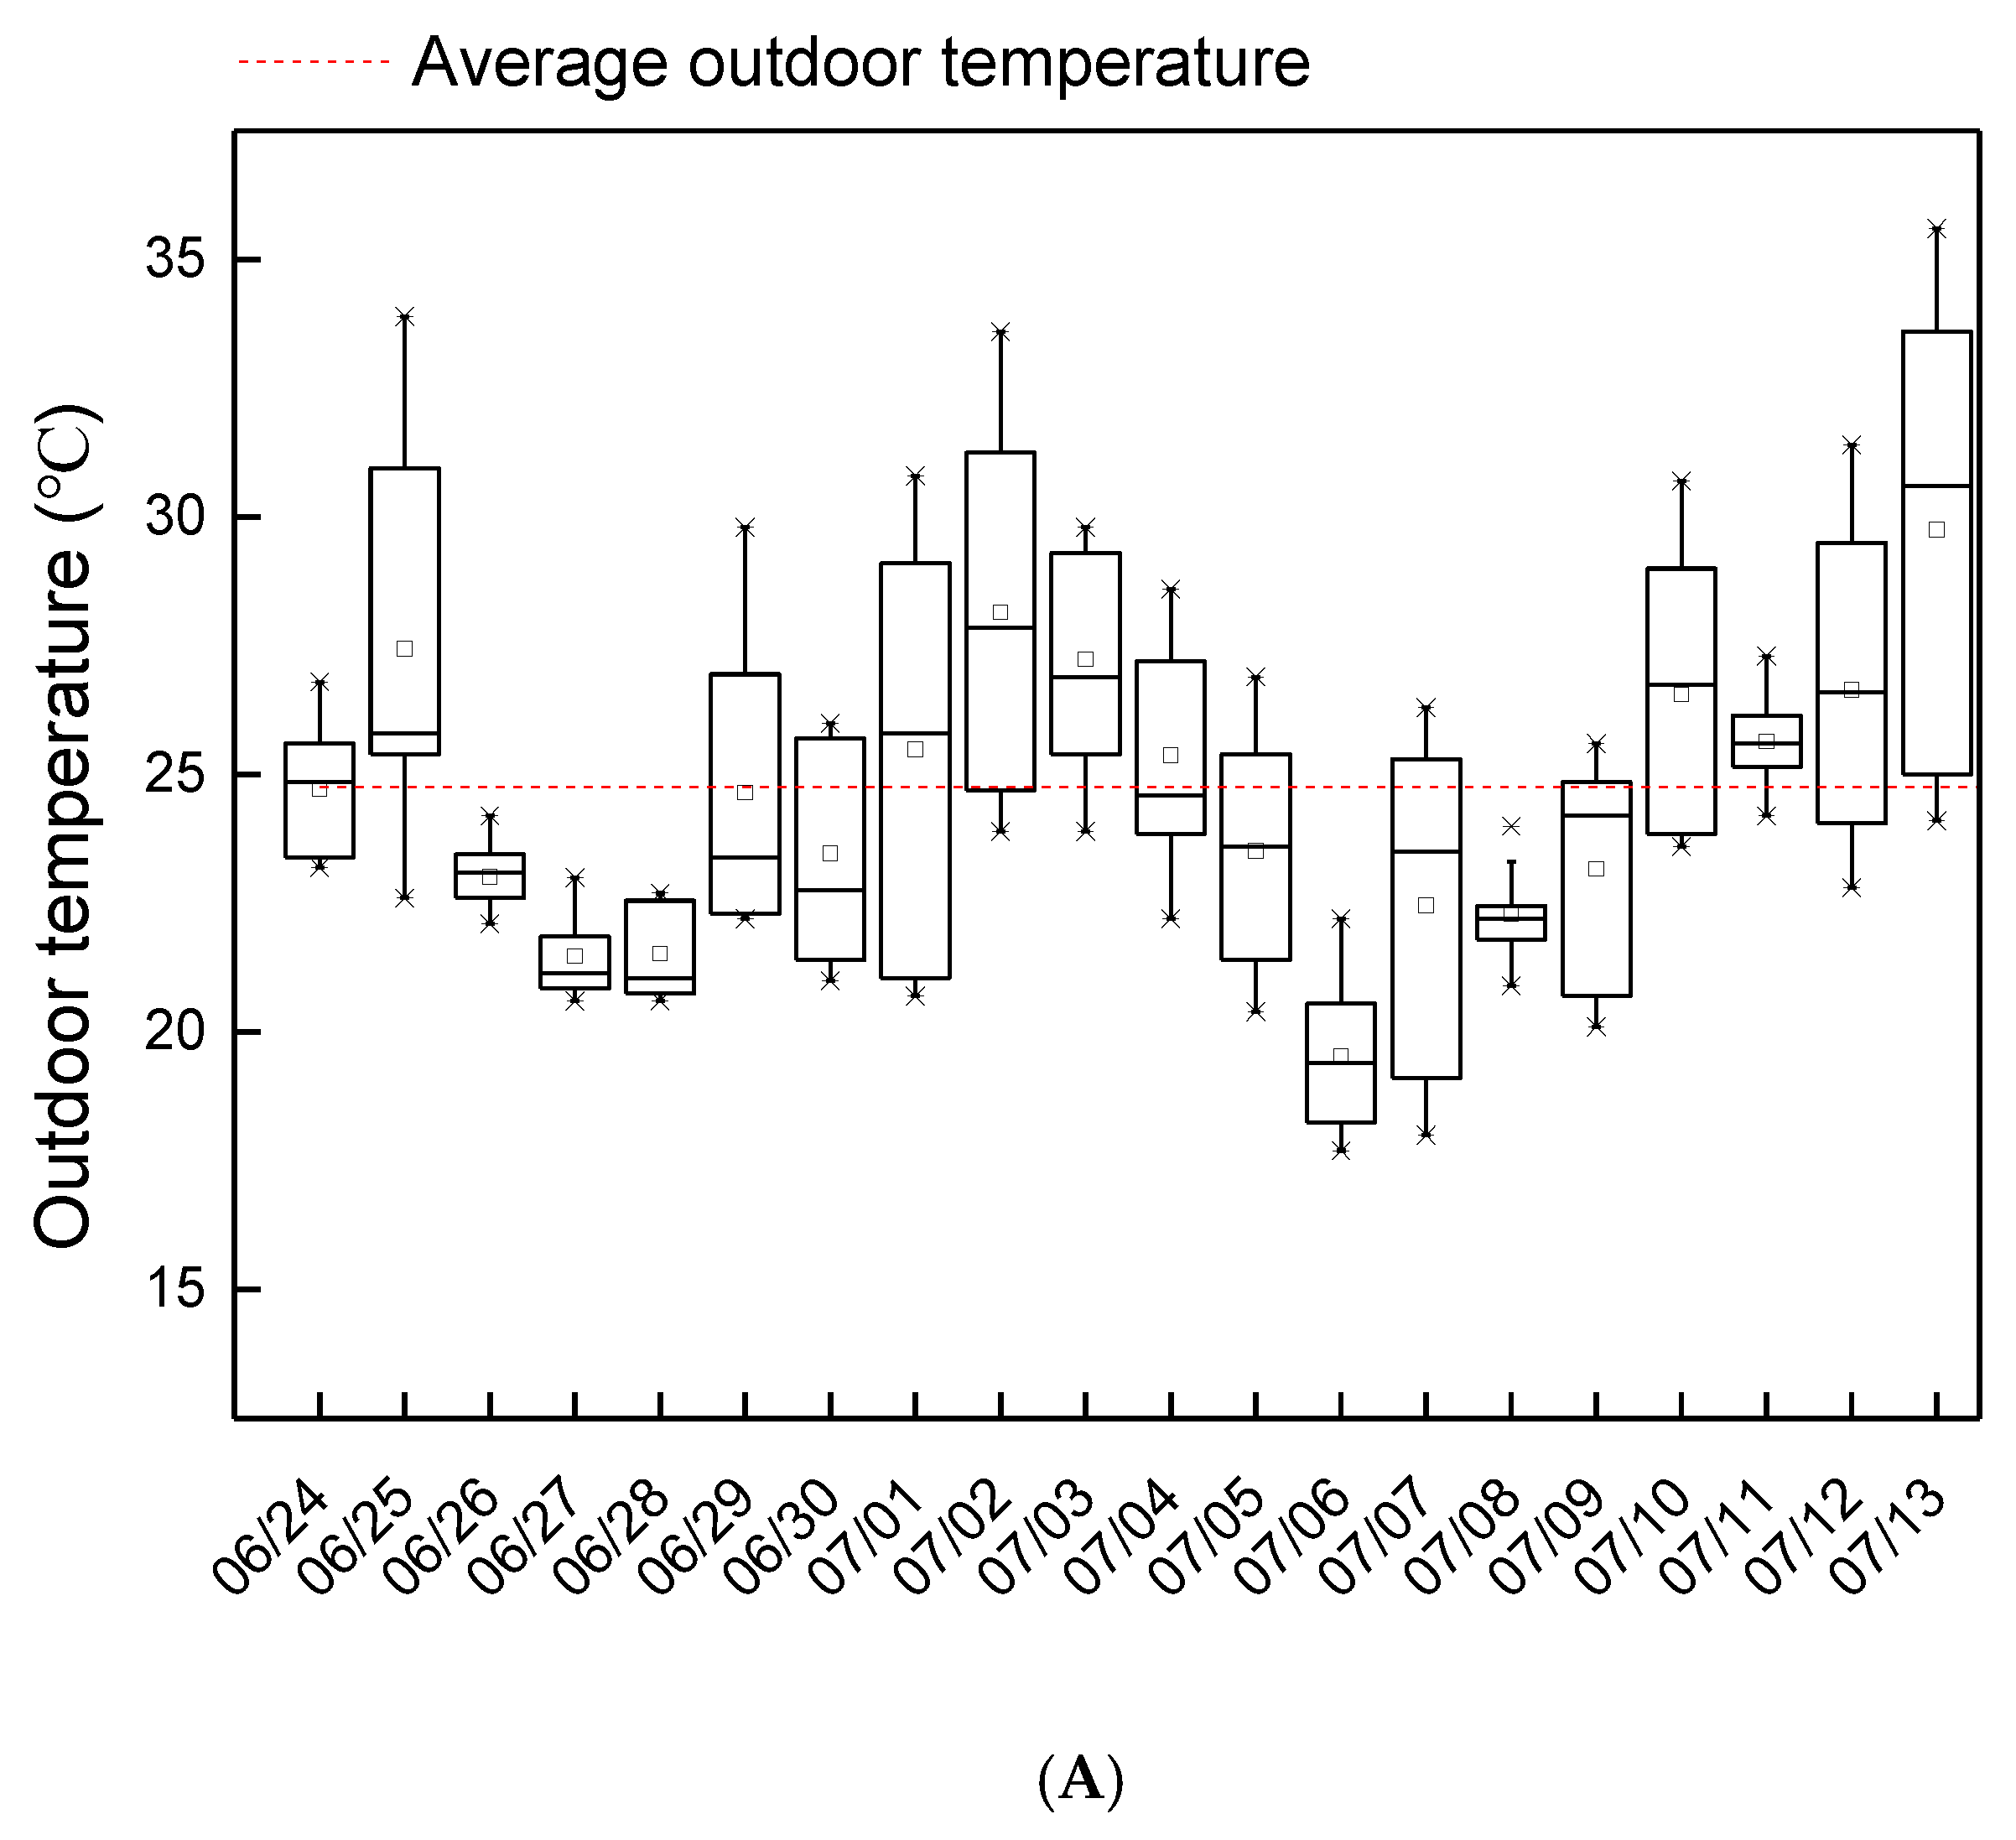
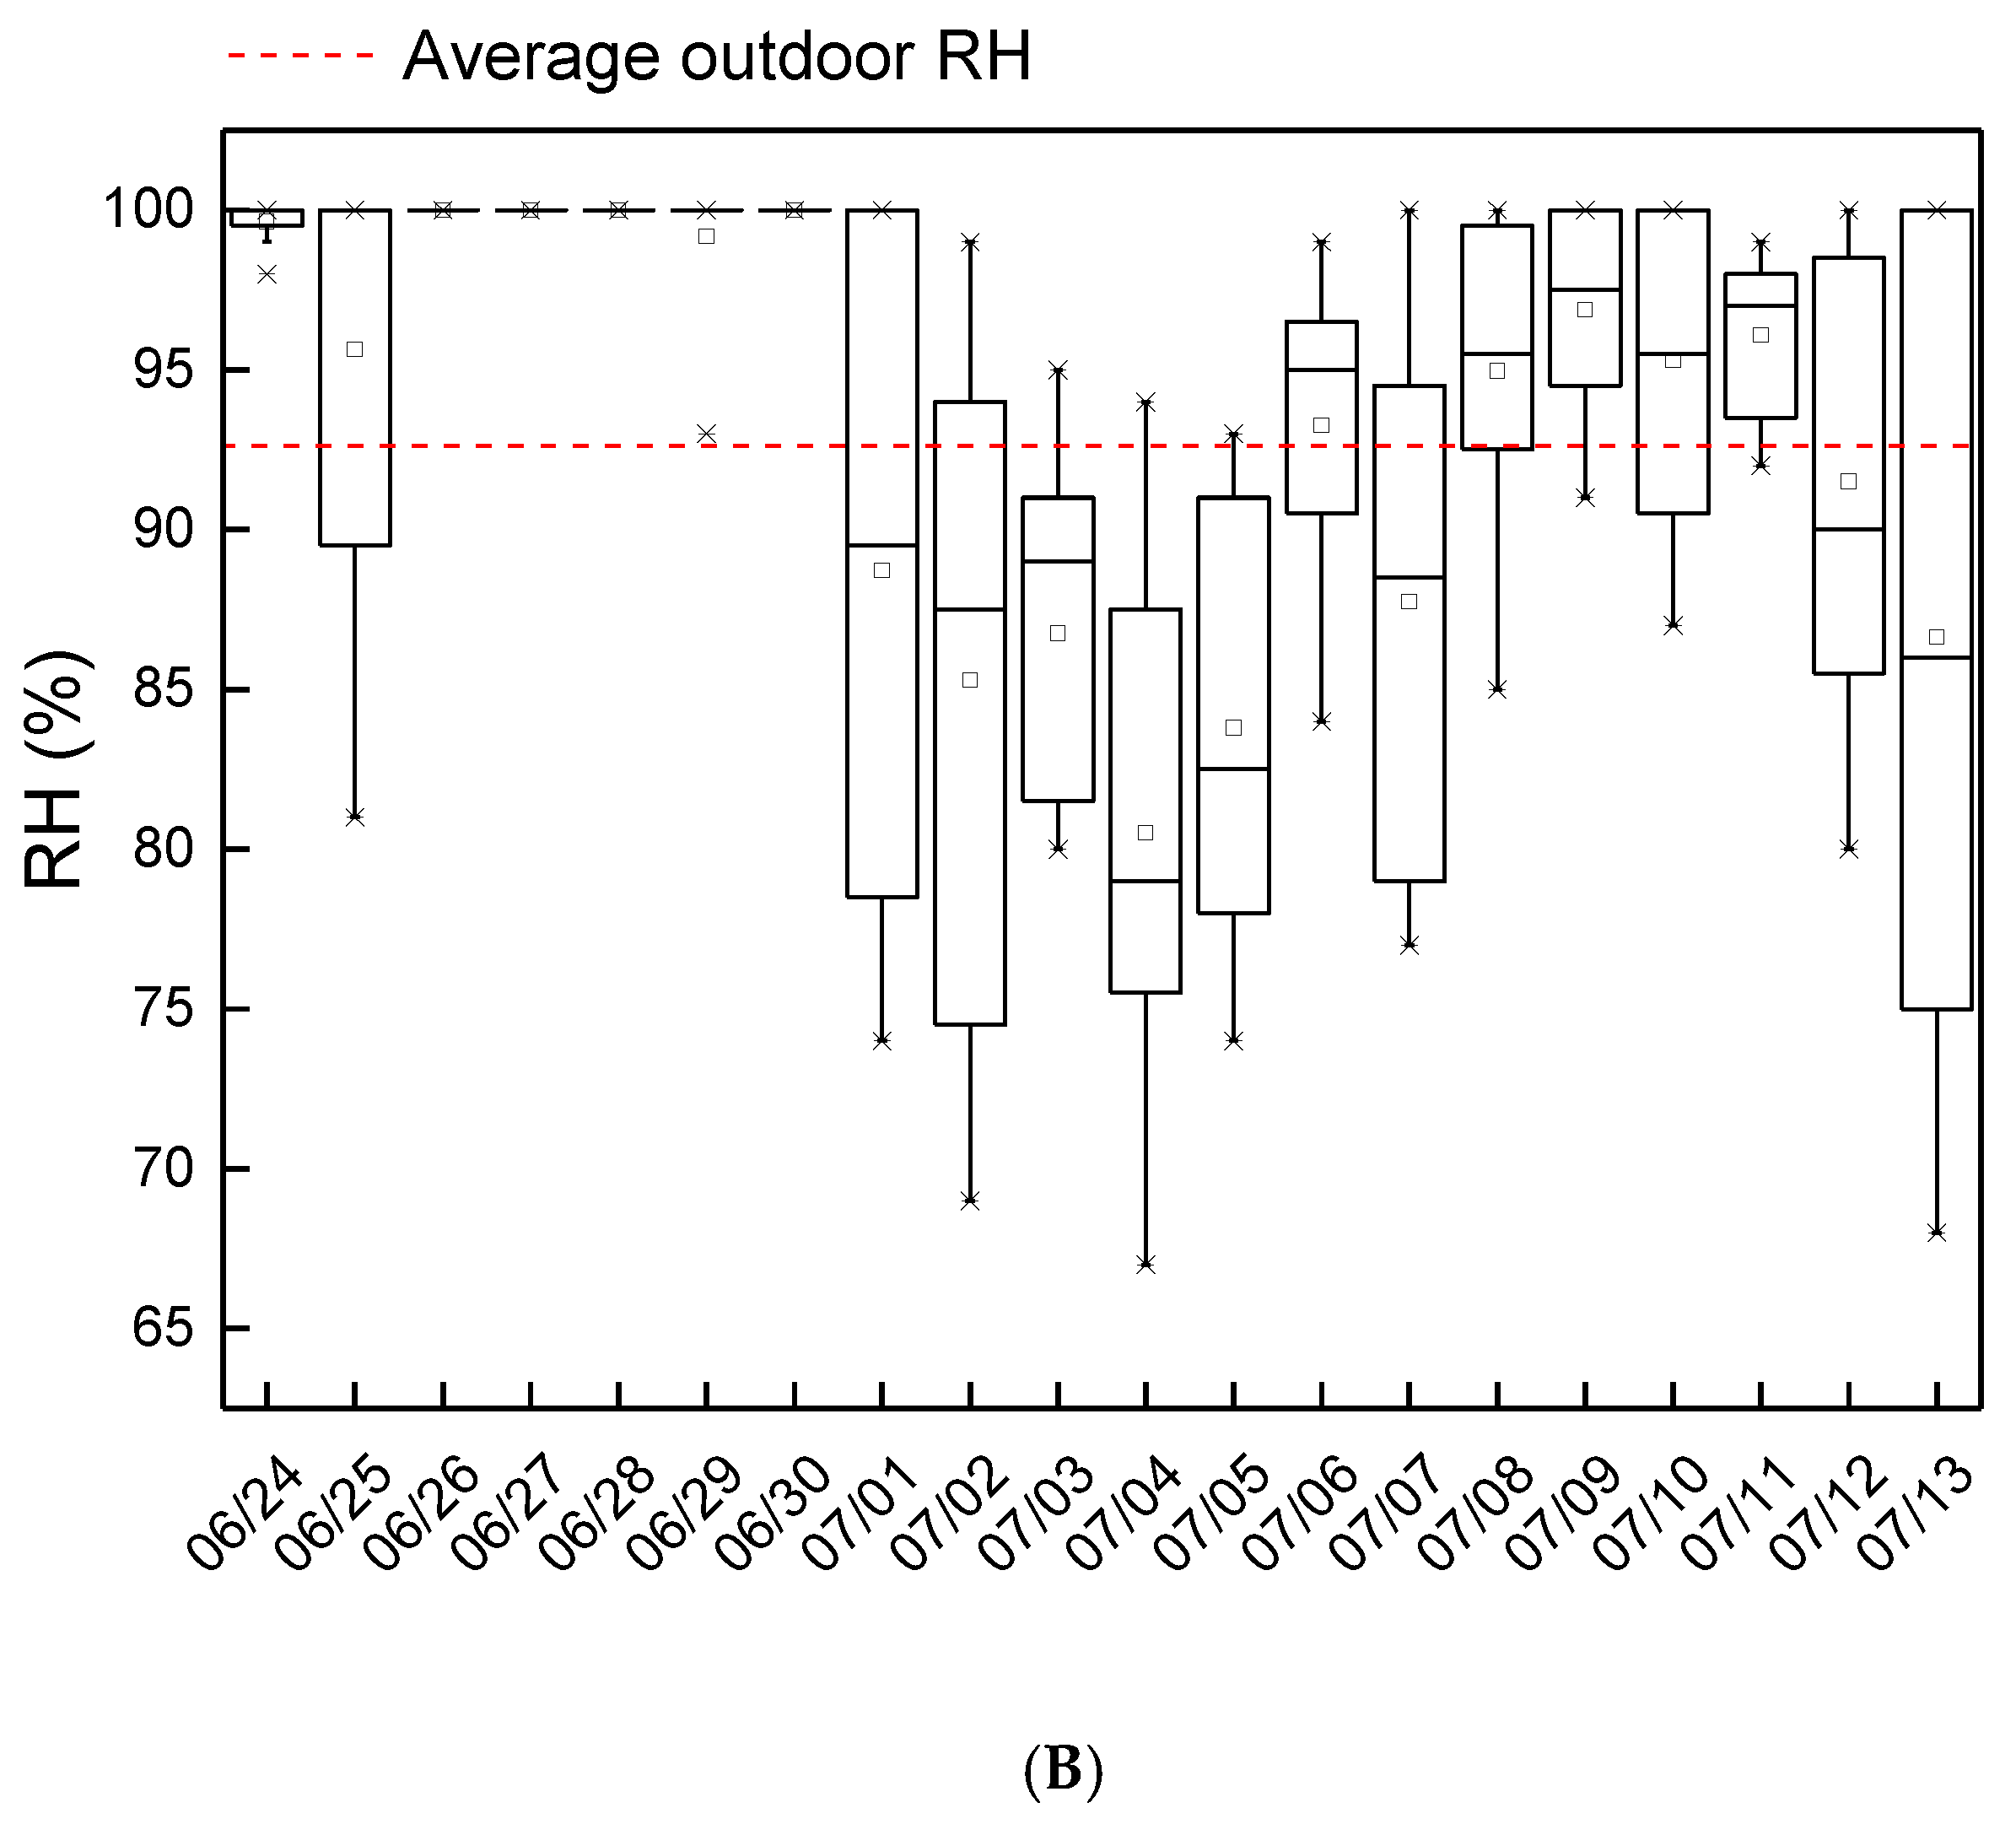
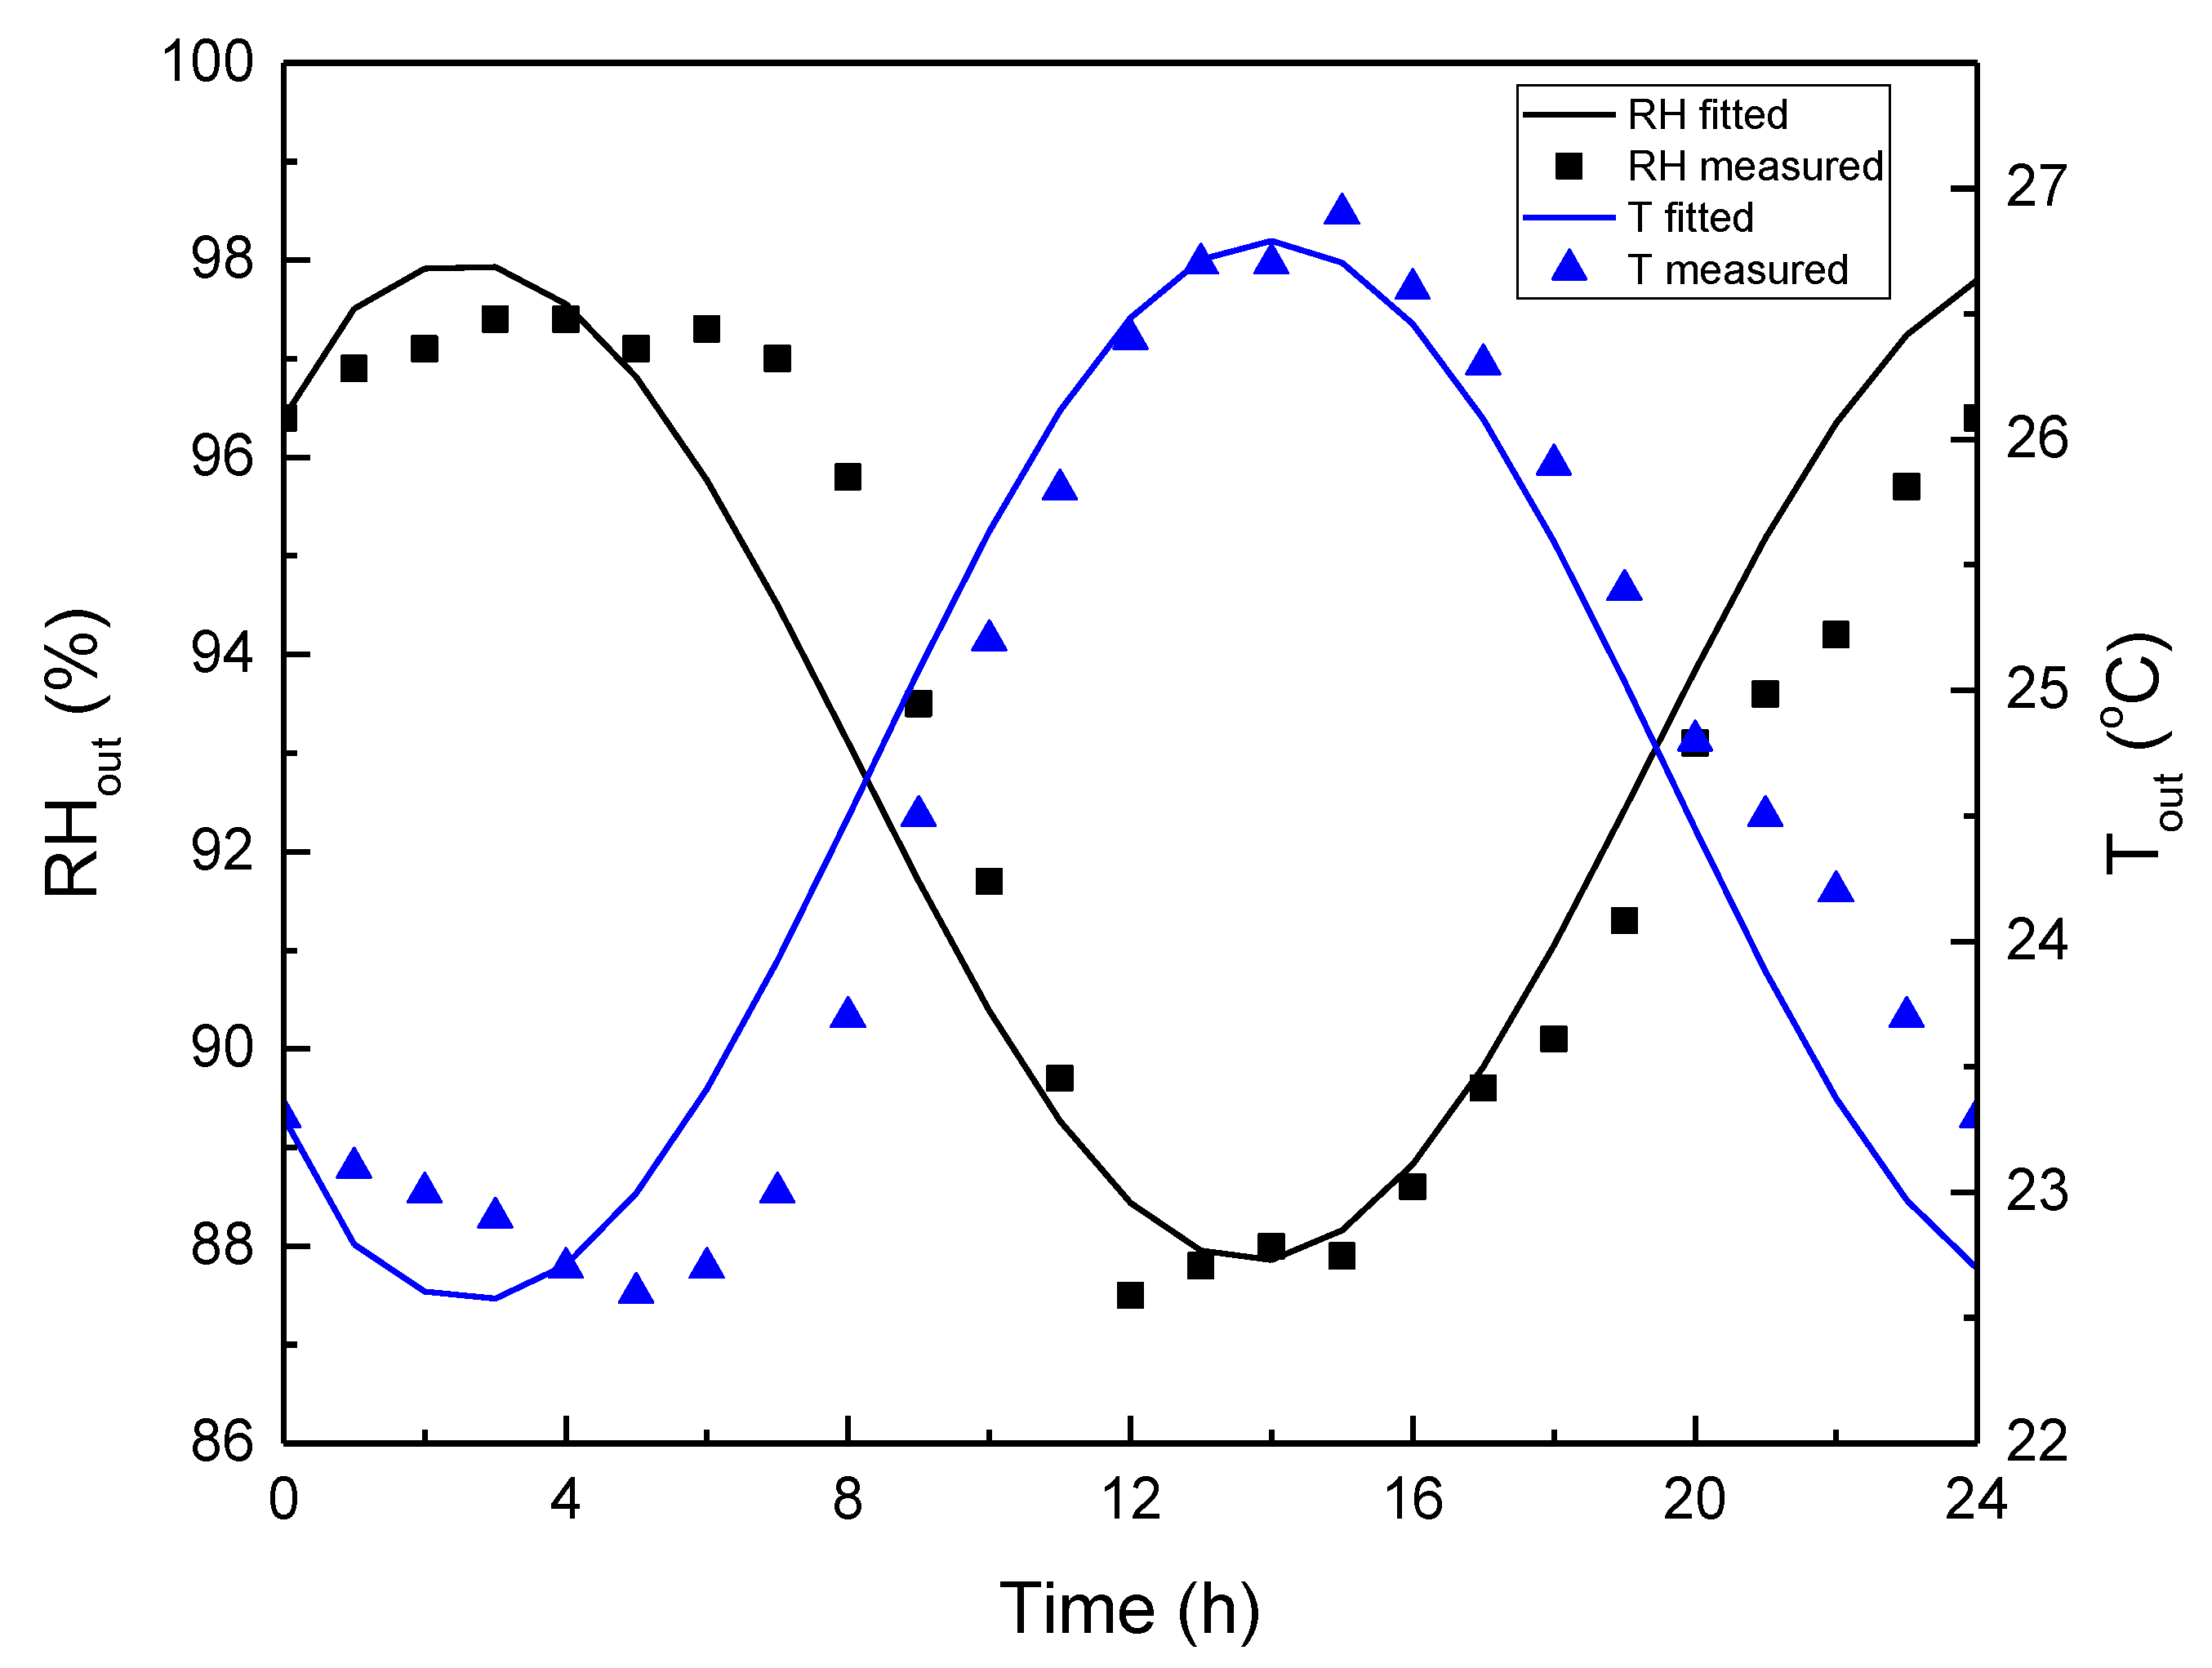
3.1. Data Collection and Fitting

The atmospheric temperature and RH during the plum rain season were shown in Figure 3. High temperature and RH were observed with average values of 24.7 °C and 92.6% in the whole plum rain season, respectively, displayed through the dash line.
The diurnal outdoor meteorological parameters during the plum rain season are fitted for analysis on a typical plum rain day, as shown in Figure 4.
The diurnal outdoor air temperature is fitted as:
T o = 24.68 1.10 cos ( 0.28 t ) 1.80 sin ( 0.28 t )
The diurnal outdoor air RH is fitted as:
R H = 92.91 + 2.76 cos ( 0.28 t ) + 4.24 sin ( 0.28 t )
The outdoor air temperature and RH show opposite change trends, with their highest and lowest values almost appearing at the same time. The diurnal outdoor air temperature appeared relatively lower in the early morning and evening but higher in the afternoon, while the RH showed exactly the opposite change trend in the plum rain season.

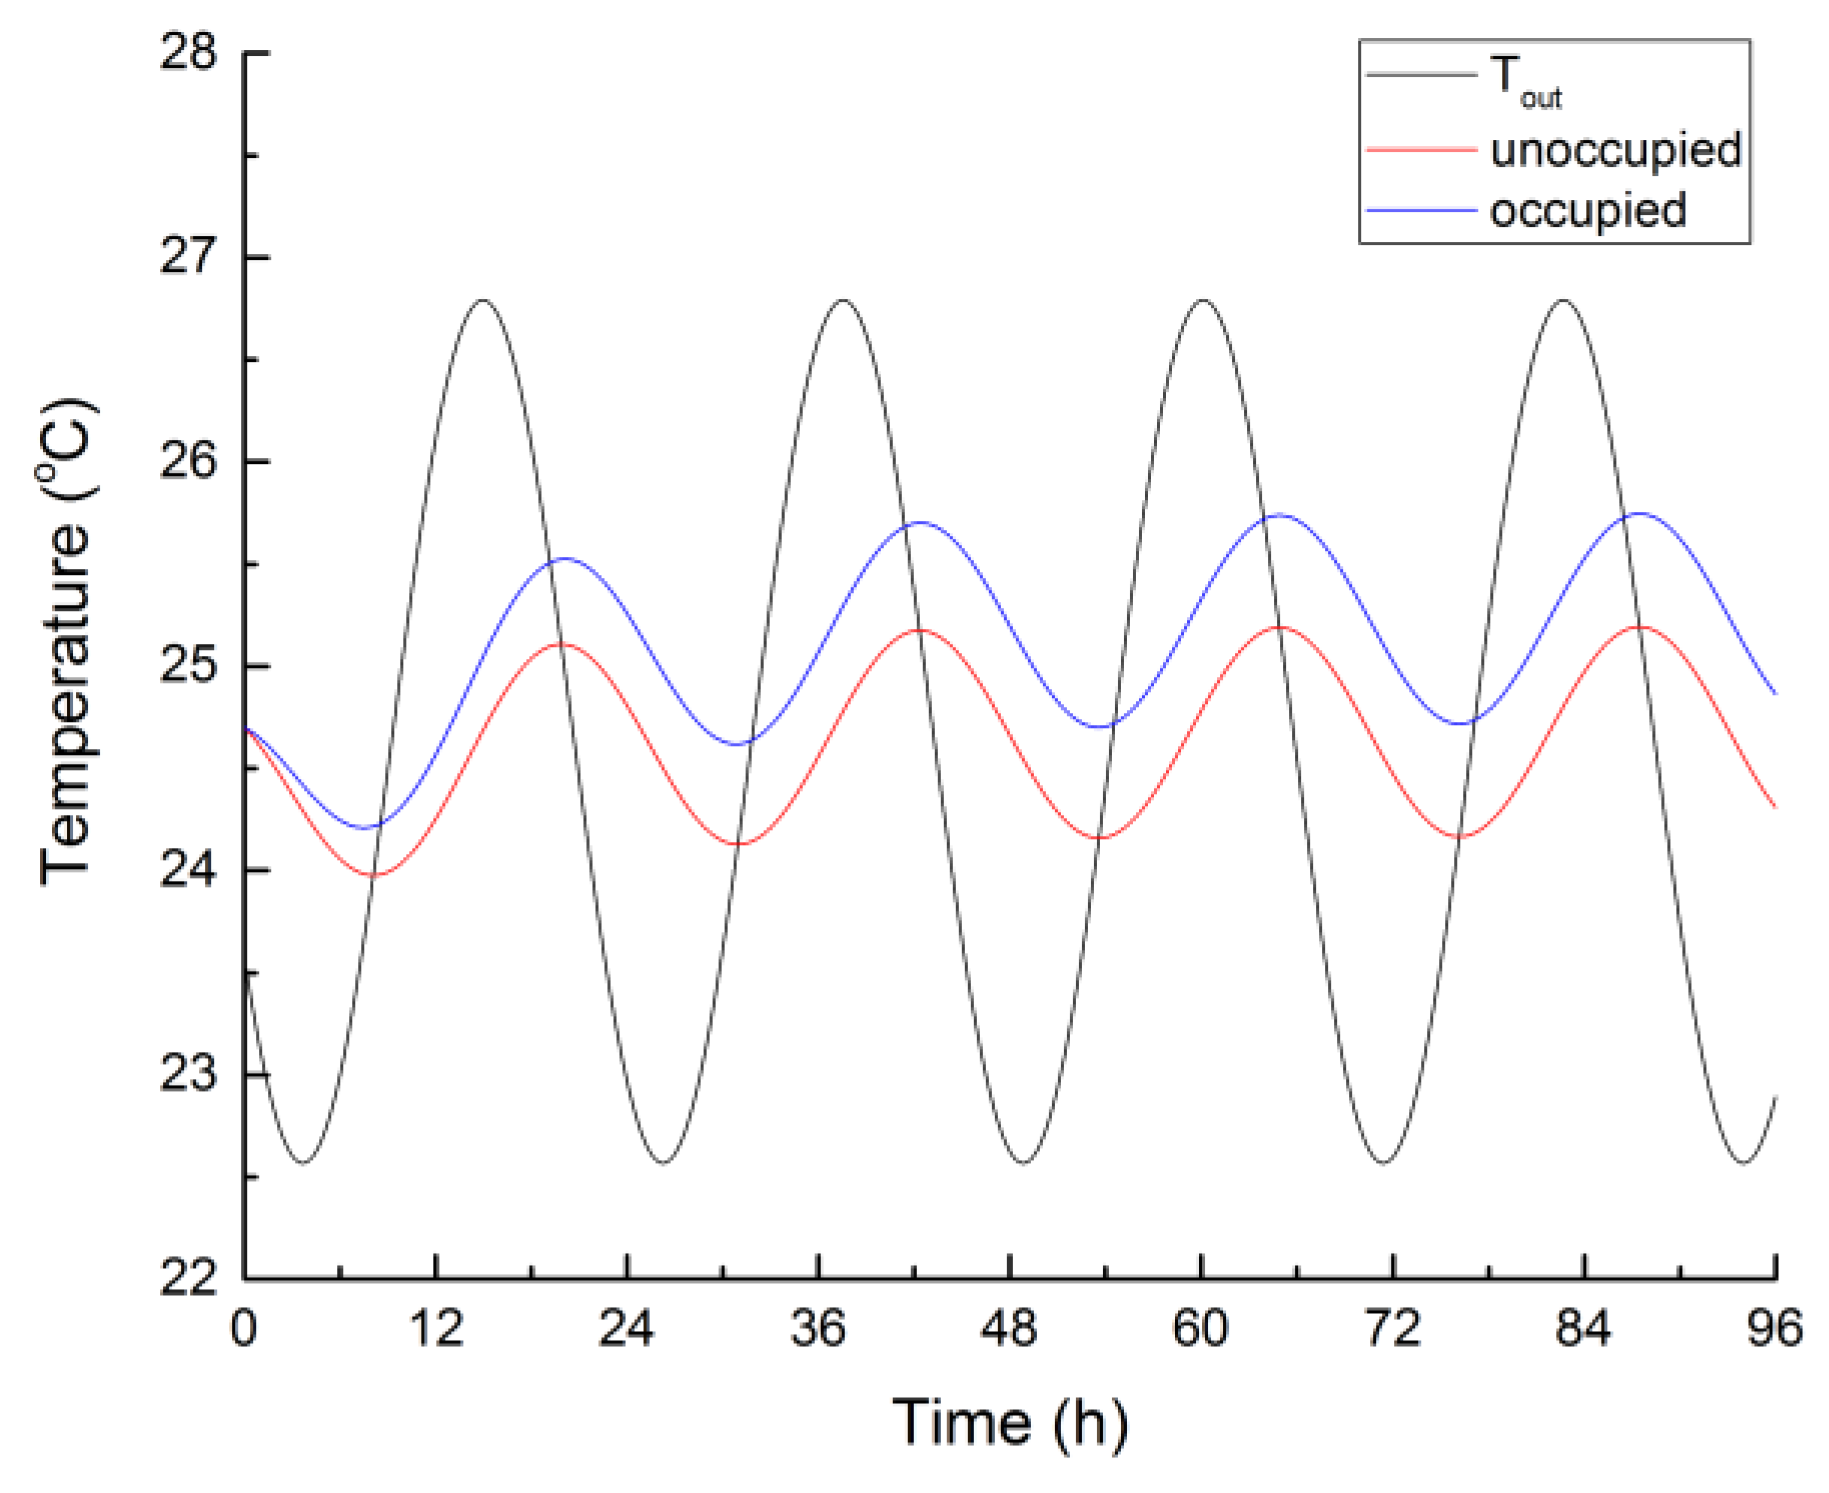
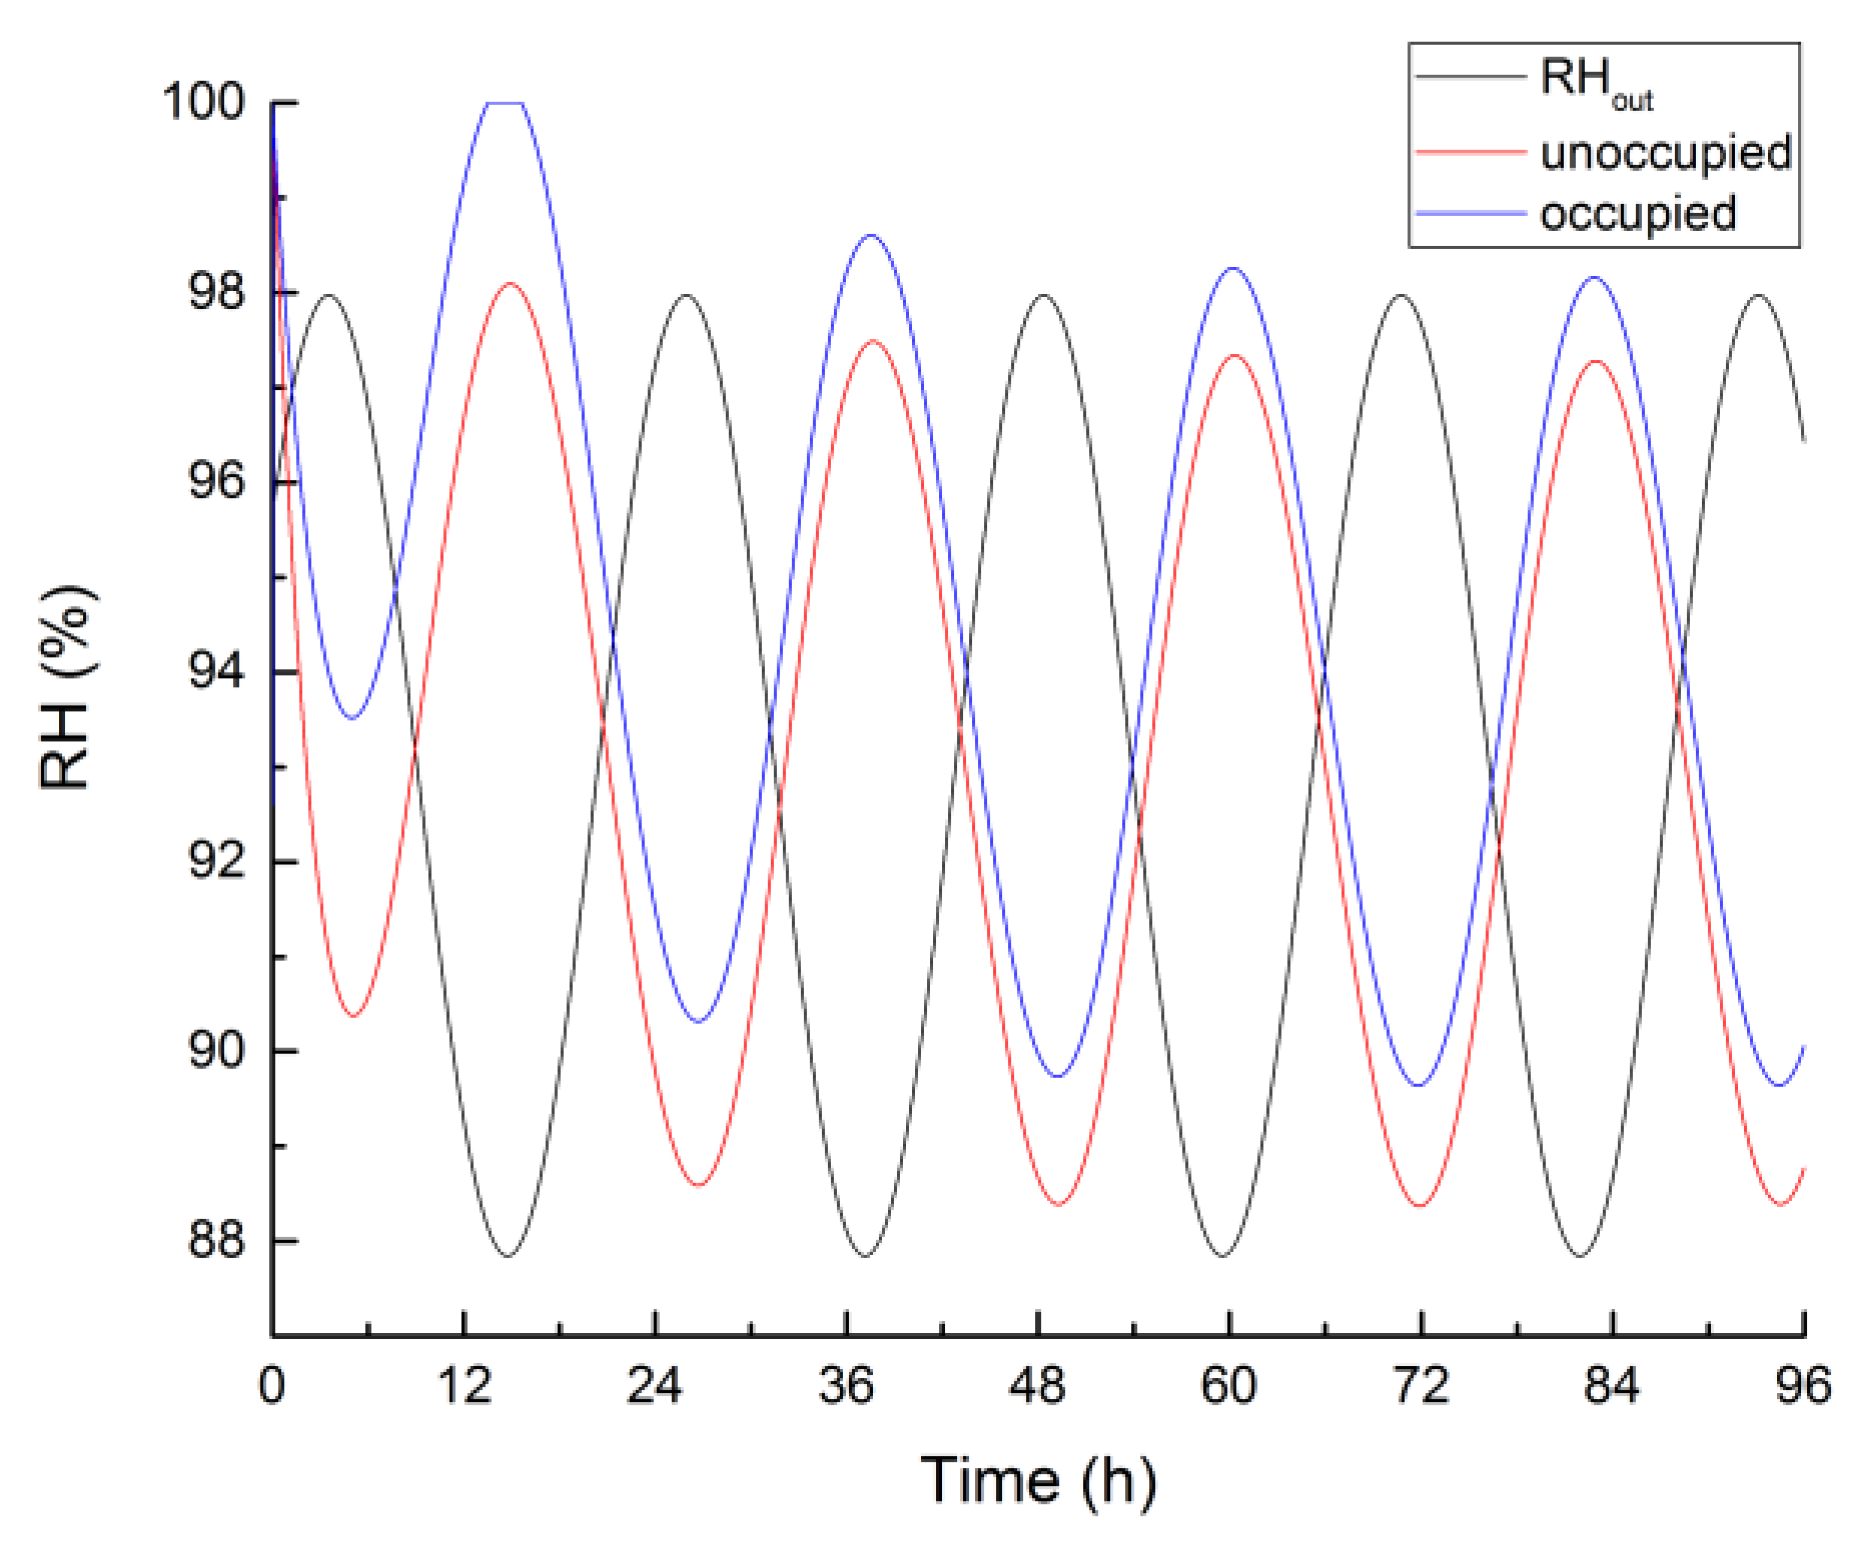
3.2. Indoor Air Temperature and RH Without Ventilation

Figure 5 and Figure 6 show the indoor air temperature and RH without ventilation and the infiltration rate is set to be 0.5 ACH. The indoor air temperature in the unoccupied home and occupied home shown in Figure 5 follows the sine function like the outdoor temperature. There is attenuation and delay of the indoor air temperature compared to the outdoor temperature, with 6 h delay because of the thermal inertia of the envelope. The cycle of the indoor air temperature is the same as the outdoor temperature, i.e., 24 h. Whether the home is unoccupied or occupied, the indoor air temperature is always higher than 20 °C, indicating that the RHcrit keeps a constant, i.e., 80%. In the unoccupied home, the indoor air temperature ranges from 24.2 °C to 25.2 °C, and its centerline overlaps to the centerline of the outdoor temperature. While in the occupied home, the indoor air temperature ranges from 24.7 °C to 25.7 °C, and its centerline is above the centerline of the outdoor temperature.
Figure 6 shows the indoor air RH in the unoccupied home and occupied home. The indoor air RH fluctuates strongly at the beginning, and then it becomes stable after 48 h, following the sine function like the outdoor air RH. Therefore, the indoor air RH discussed in this study is between 72 h and 96 h, which corresponding to the fourth day away from the initial calculation day. The indoor air RH lags about 12 h behind the outdoor air RH, and it is higher than the RHcrit. In the unoccupied home, the indoor air RH ranges from 88.4% to 97.3%, and its centerline overlaps to the centerline of the outdoor air RH. While in the occupied home, the indoor air RH is higher than that in the unoccupied home due to the moisture source of human occupancy. The indoor air RH in the occupied home ranges from 89.6% to 98.1%, and its centerline is above the centerline of the outdoor air RH.

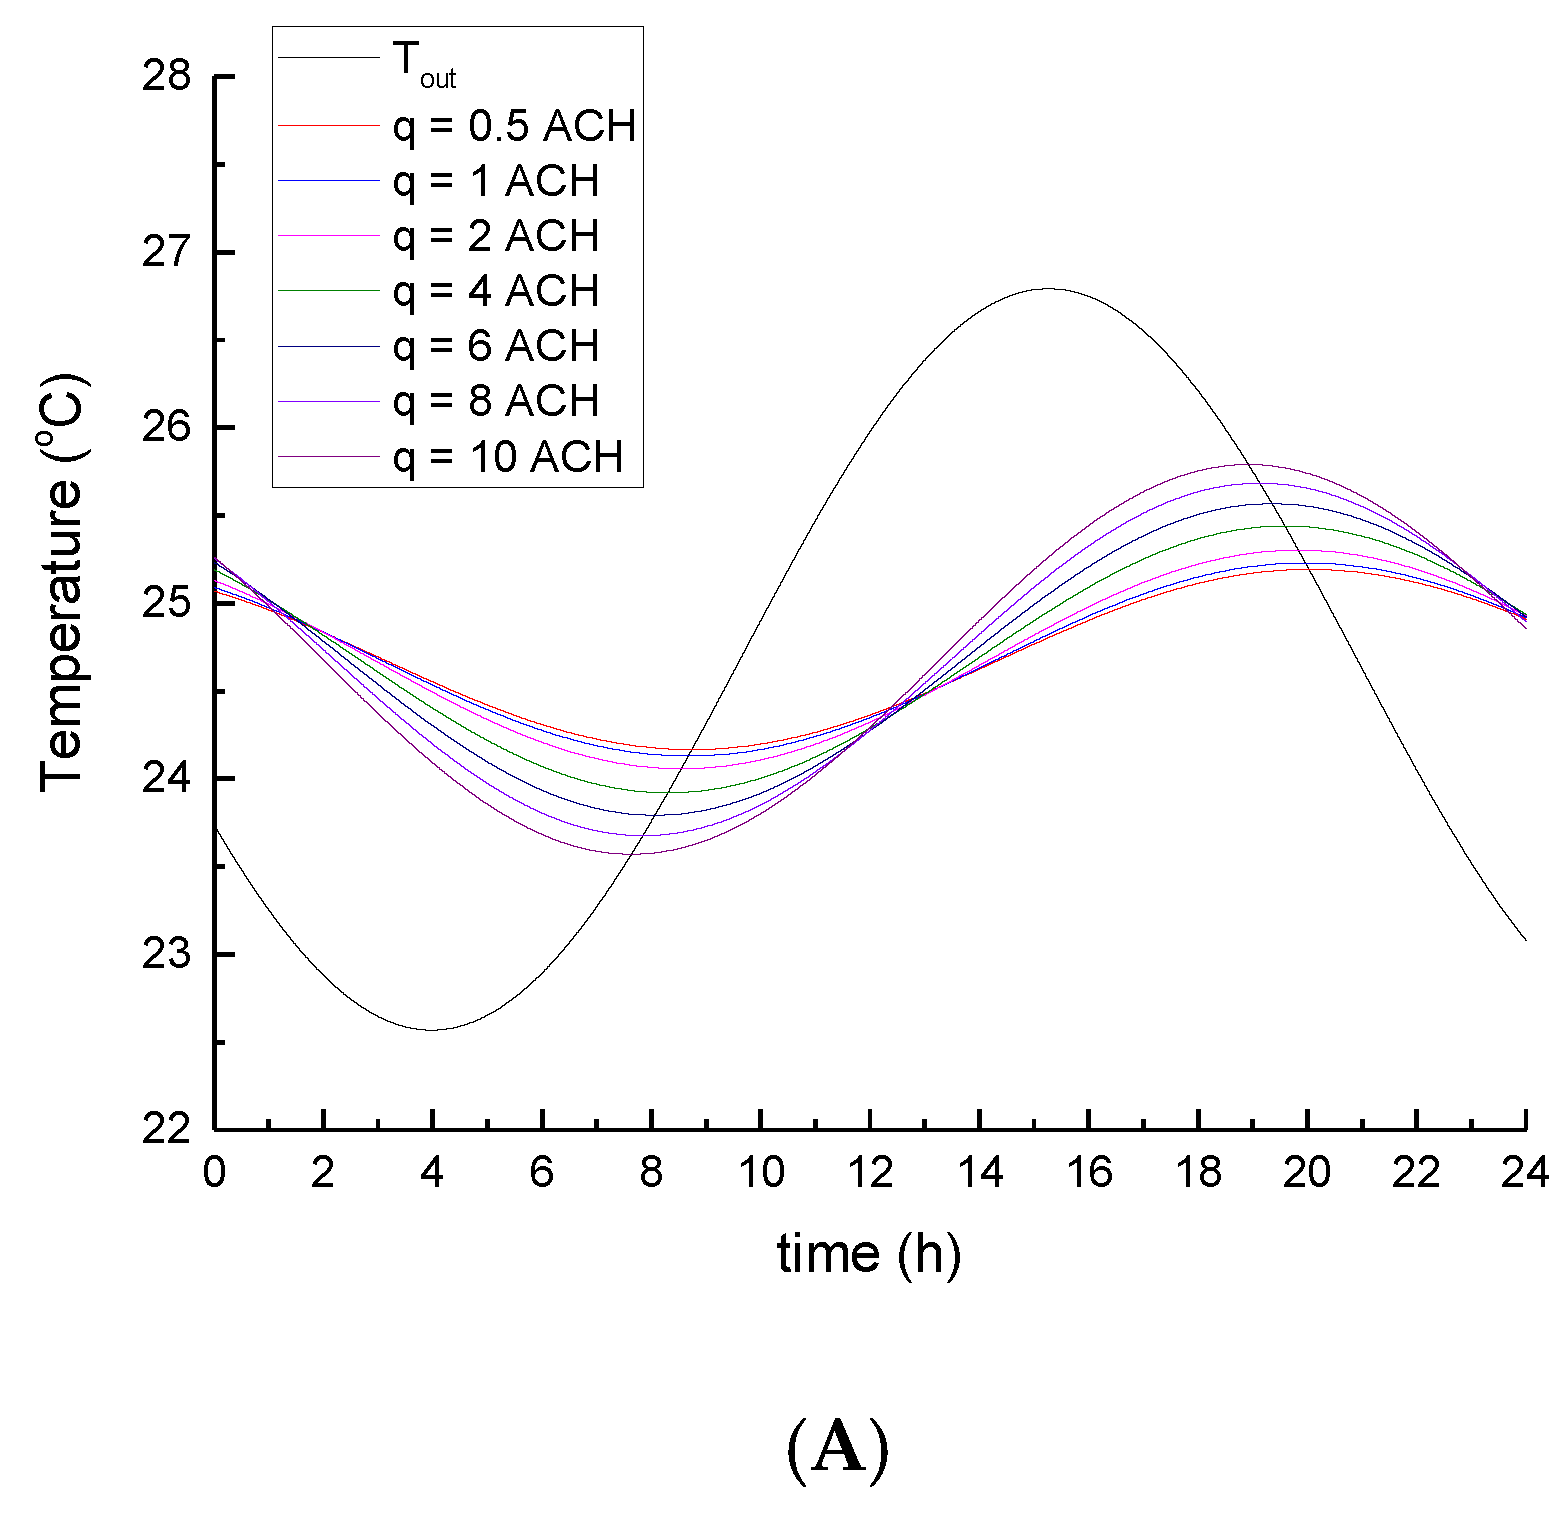
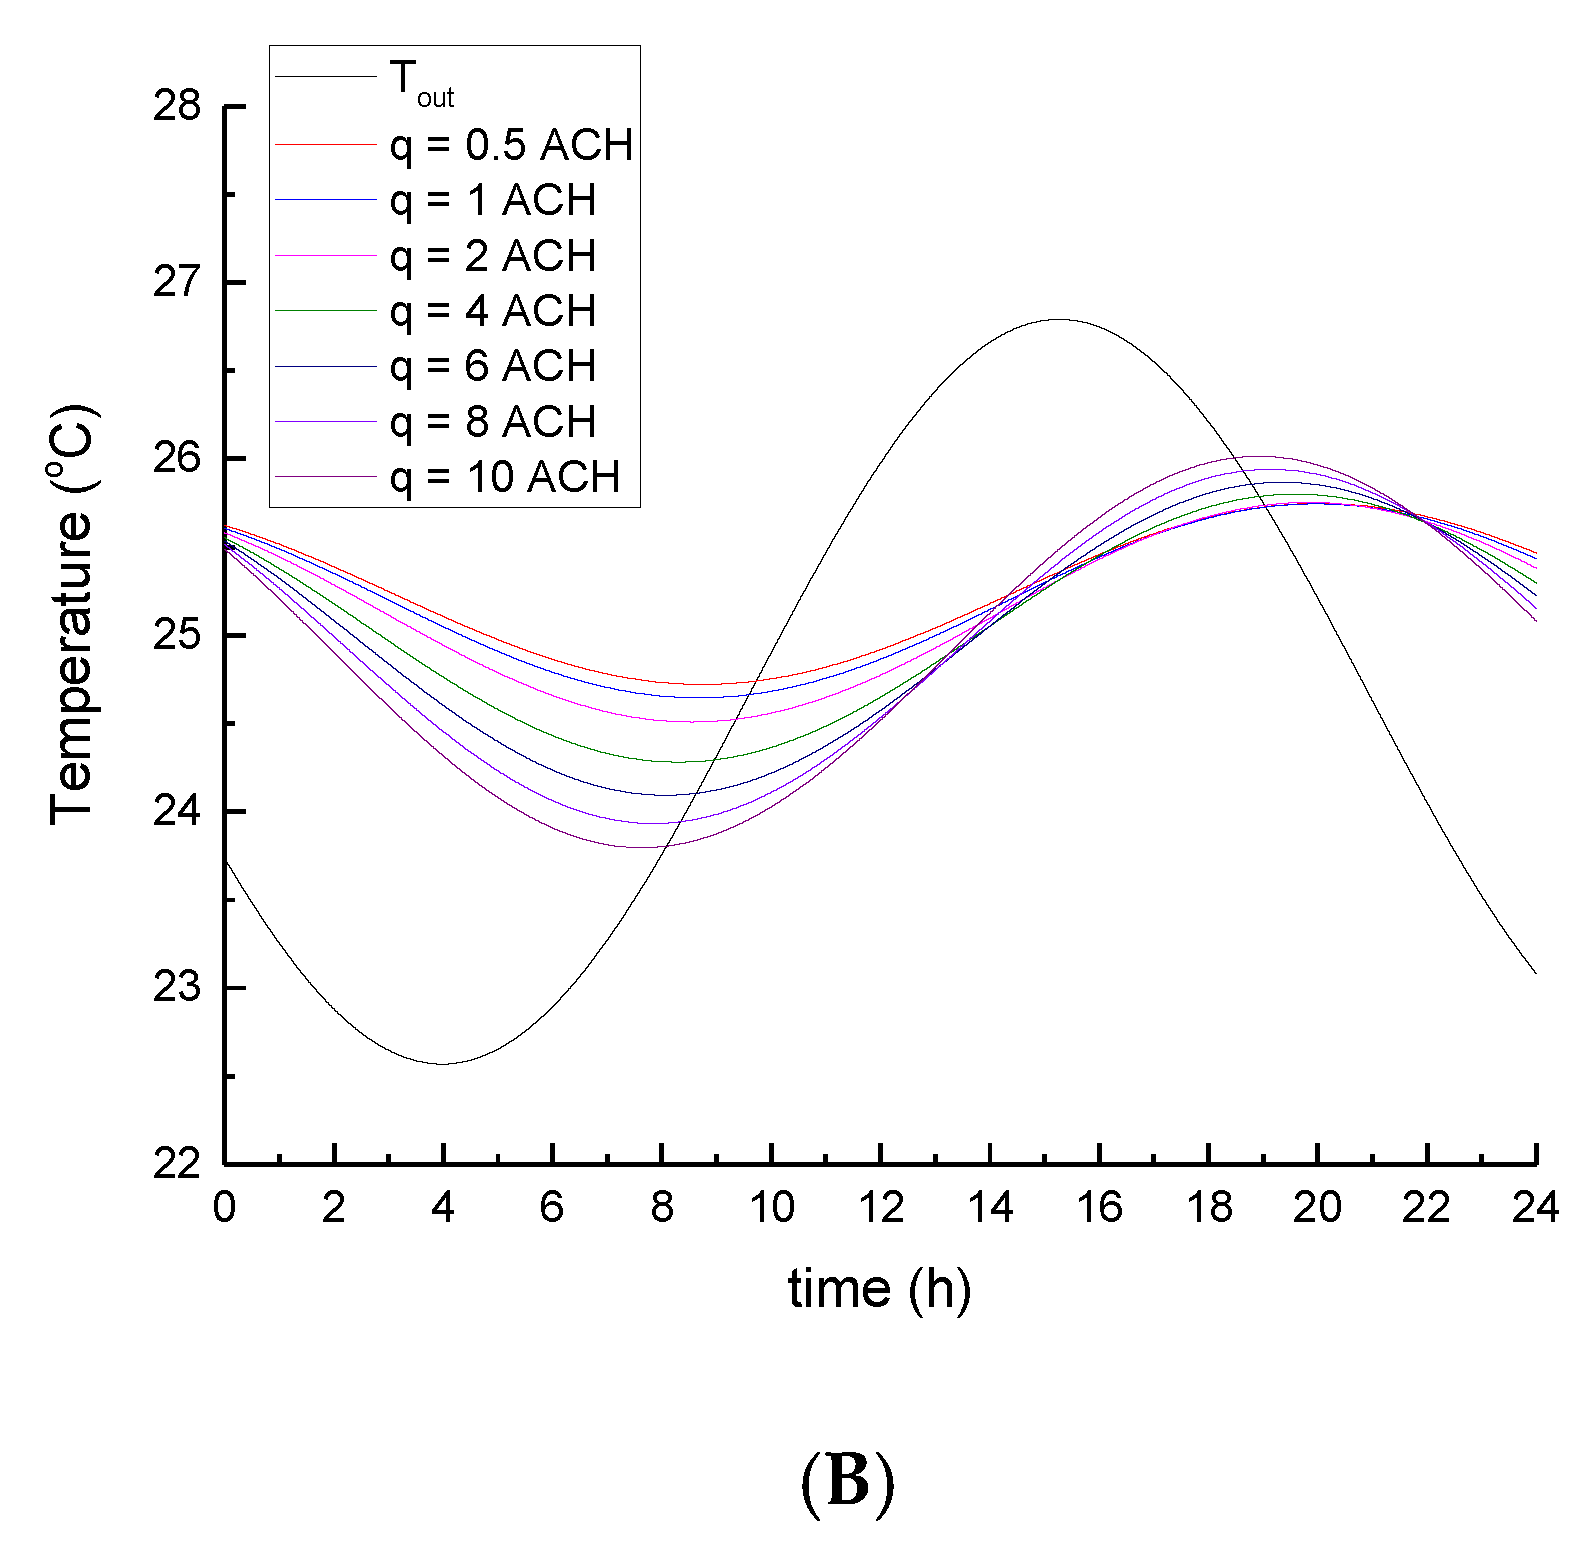
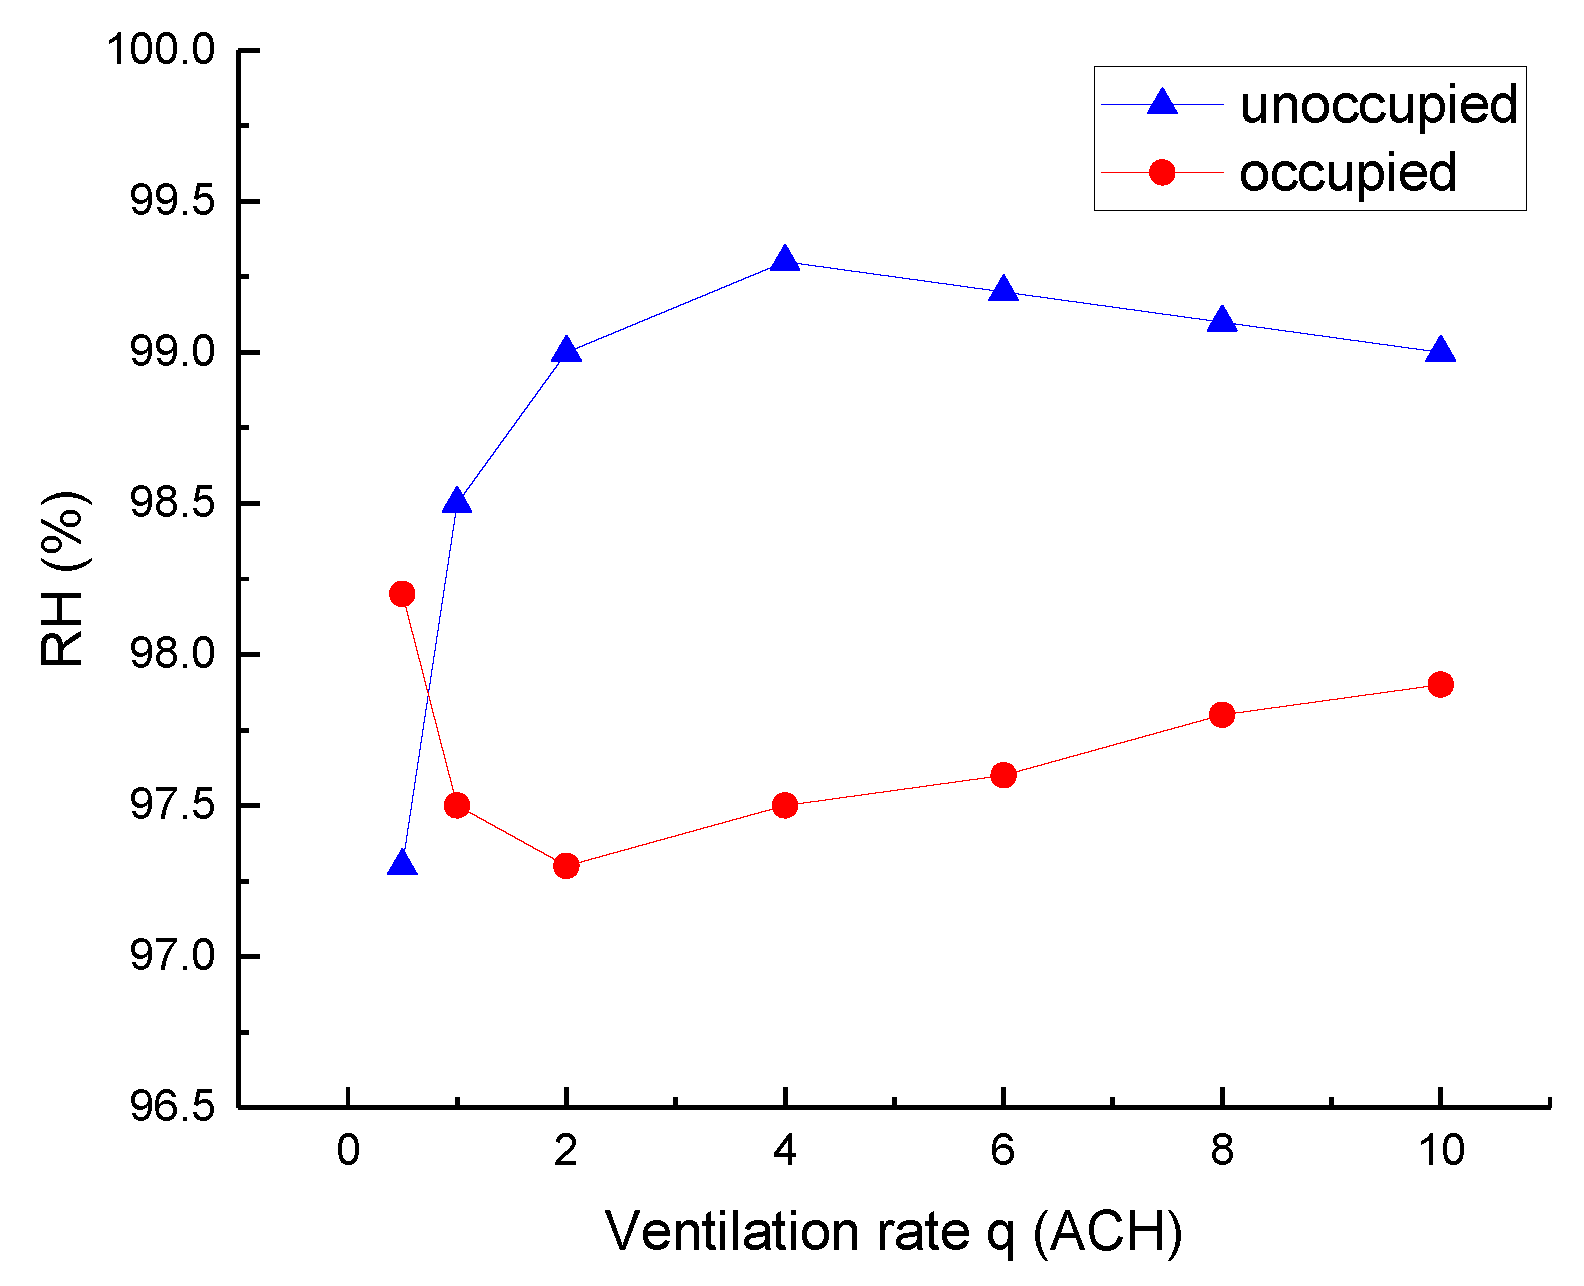
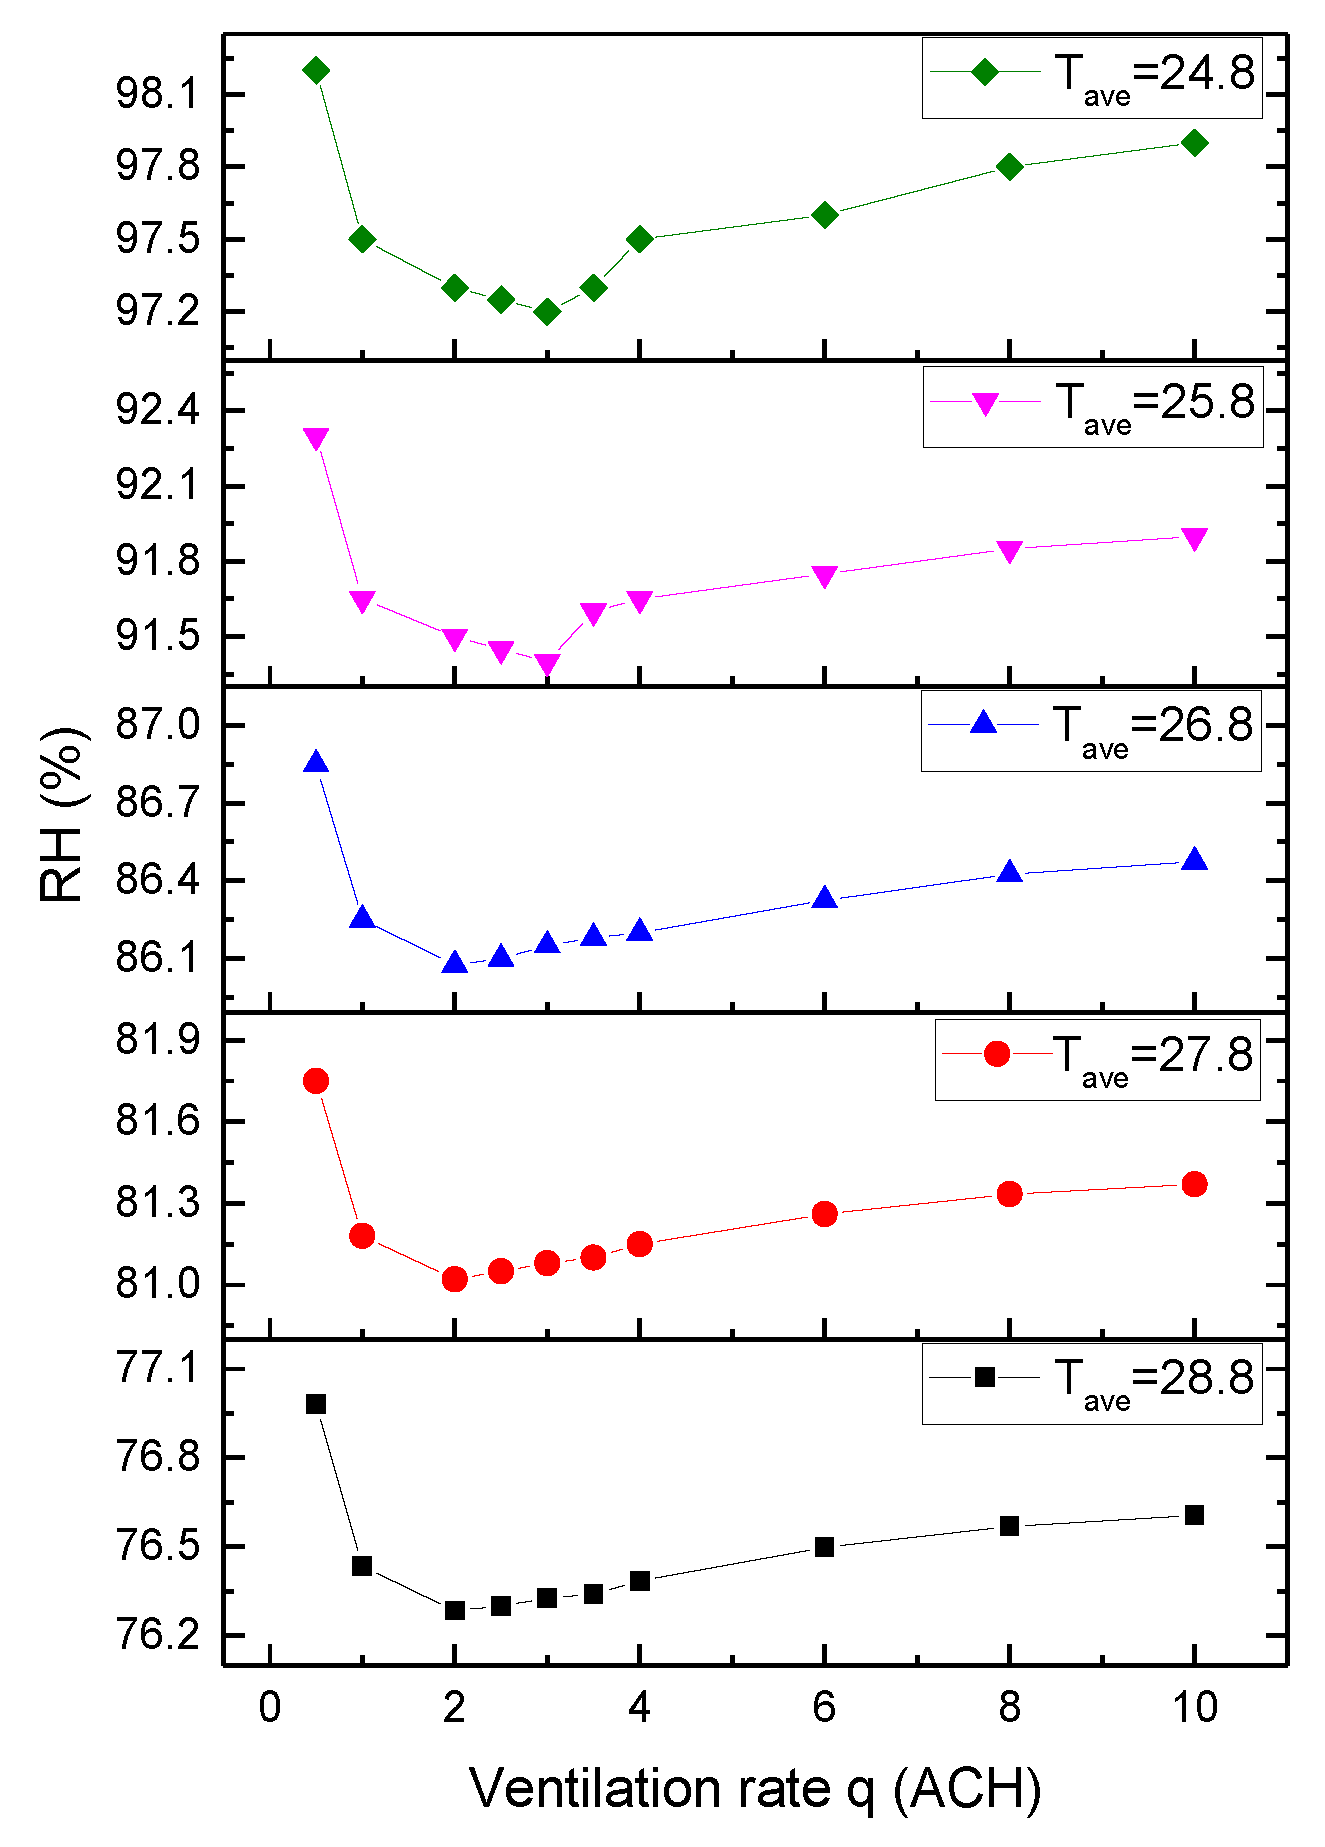
3.3. The Effect of Ventilation in Unoccupied and Occupied Home

Figure 7 shows the diurnal variation of indoor air temperature on a stable day. As the ventilation rate increases, the indoor air temperature becomes closer to the outdoor temperature. Both in the unoccupied home and occupied home, when the ventilation rate rises up from 0.5 ACH to 10 ACH, the delay time decreases from 4.8 h to 3.6 h. In the unoccupied home, the effect of ventilation rate on the highest indoor air temperature is the same as that on the lowest indoor air temperature, and the centerline of the indoor air temperature is kept constant. When the ventilation rate increases from 0.5 ACH to 10 ACH, the highest indoor air temperature increases by 0.5 °C, i.e., from 25.3 °C to 25.8 °C, and the lowest indoor air temperature decreases by 0.5 °C, i.e., from 24.1 °C to 23.6 °C. On the contrary, in the occupied home, the effect of ventilation rate on the highest indoor air temperature is weaker than that on the lowest indoor air temperature, and the centerline of the indoor air temperature moves down. When the ventilation rate increases from 0.5 ACH to 10 ACH, the highest indoor air temperature increases by 0.3 °C, i.e., from 25.7 °C to 26.0 °C and the lowest indoor air temperature decreases by 0.9 °C, i.e., from 24.7 °C to 23.8 °C.
Figure 8 shows the effect of ventilation rate on the highest indoor air RH in an unoccupied home and an occupied home. The highest indoor air RH is higher than the RHcrit when the ventilation rate increases from 0.5 ACH to 10 ACH in both an unoccupied and an occupied home. However, ventilation has an opposite effect on the highest indoor air RH in the occupied home compared to that in the unoccupied home, as shown in Figure 8. In the unoccupied home, the highest indoor air RH increases first and then decreases slightly along with the increasing ventilation rate. As the ventilation rate is less than 4 ACH, the indoor air RH ranges more widely with the increases in the ventilation rate. In addition, when the ventilation rate increases from 0.5 ACH to 1 ACH, the indoor air RH ranges from 88.4%~97.3% to 87.2%~98.5%. However, as the ventilation rate is larger, the increasing ventilation rate has little effect on the indoor air RH. Specifically, when the ventilation rate increases from 4 ACH to 10 ACH, the indoor air RH ranges from 86.7%~99.2% to 87%~99%. In contrast, the highest indoor air RH in the occupied home decreases first and then increases slightly along with the increasing ventilation rate. Similar to the indoor air temperature, ventilation plays a more important role in the lowest indoor air RH than in the highest indoor air RH. The centerline moves down with increases in the ventilation rate. As the ventilation rate is less than 4 ACH, the indoor air RH ranges more widely with increases in the ventilation rate. In addition, when the ventilation rate increases from 0.5 ACH to 1 ACH, the indoor air RH ranges from 89.6%~98.2% to 86.6%~97.5%. Specifically, when the ventilation rate increases from 4 ACH to 10 ACH, the indoor air RH ranges from 85.4%~97.4% to 86%~97.8%.
Figure 9 shows the highest indoor air RH in the occupied home with a different ventilation rate under various outdoor air temperatures. Based on the meteorological parameters in the plum rain season in 2015, whose average outdoor air temperature is 24.8 °C, the various outdoor air temperature is described by average outdoor air temperature, i.e., 24.8 °C, 25.8 °C, 26.8 °C, 27.8 °C, and 28.8 °C. Interestingly, the highest indoor air RH first decreases and then increases with the increasing ventilation rate for different average outdoor air temperatures, indicating the optimal ventilation rate. The optimal ventilation rate decreases with increases in the outdoor air temperature. When the average outdoor air temperature is 24.8 °C and 25.8 °C, the optimal ventilation rate is about 3 ACH. When the outdoor air temperature is 26.8 °C, 27.8 °C, and 28.8 °C, the optimal ventilation rate is 2 ACH. It can be found from Figure 10 that the highest indoor air RH decreases significantly with an increasing outdoor air temperature. When the average outdoor air temperature is 24.8 °C, the highest indoor air RH ranges from 97.2% to 98.2% when the ventilation rate increases from 0.5 ACH to 10 ACH. When the average outdoor air temperature is 28.8 °C, the highest indoor air RH ranges from 76.3% to 79.0%, which is lower than the RHcrit, i.e., 80%. However, the effect of the ventilation rate on the indoor air RH is weaker than the effect of outdoor air temperature. For the specific outdoor air temperature described by the average outdoor air temperature ranging from 24.8 °C to 28.8 °C, the indoor air RH at the optimal ventilation rate only decreases by about 1% compared with indoor air RH at the ventilation rate 0.5 ACH.

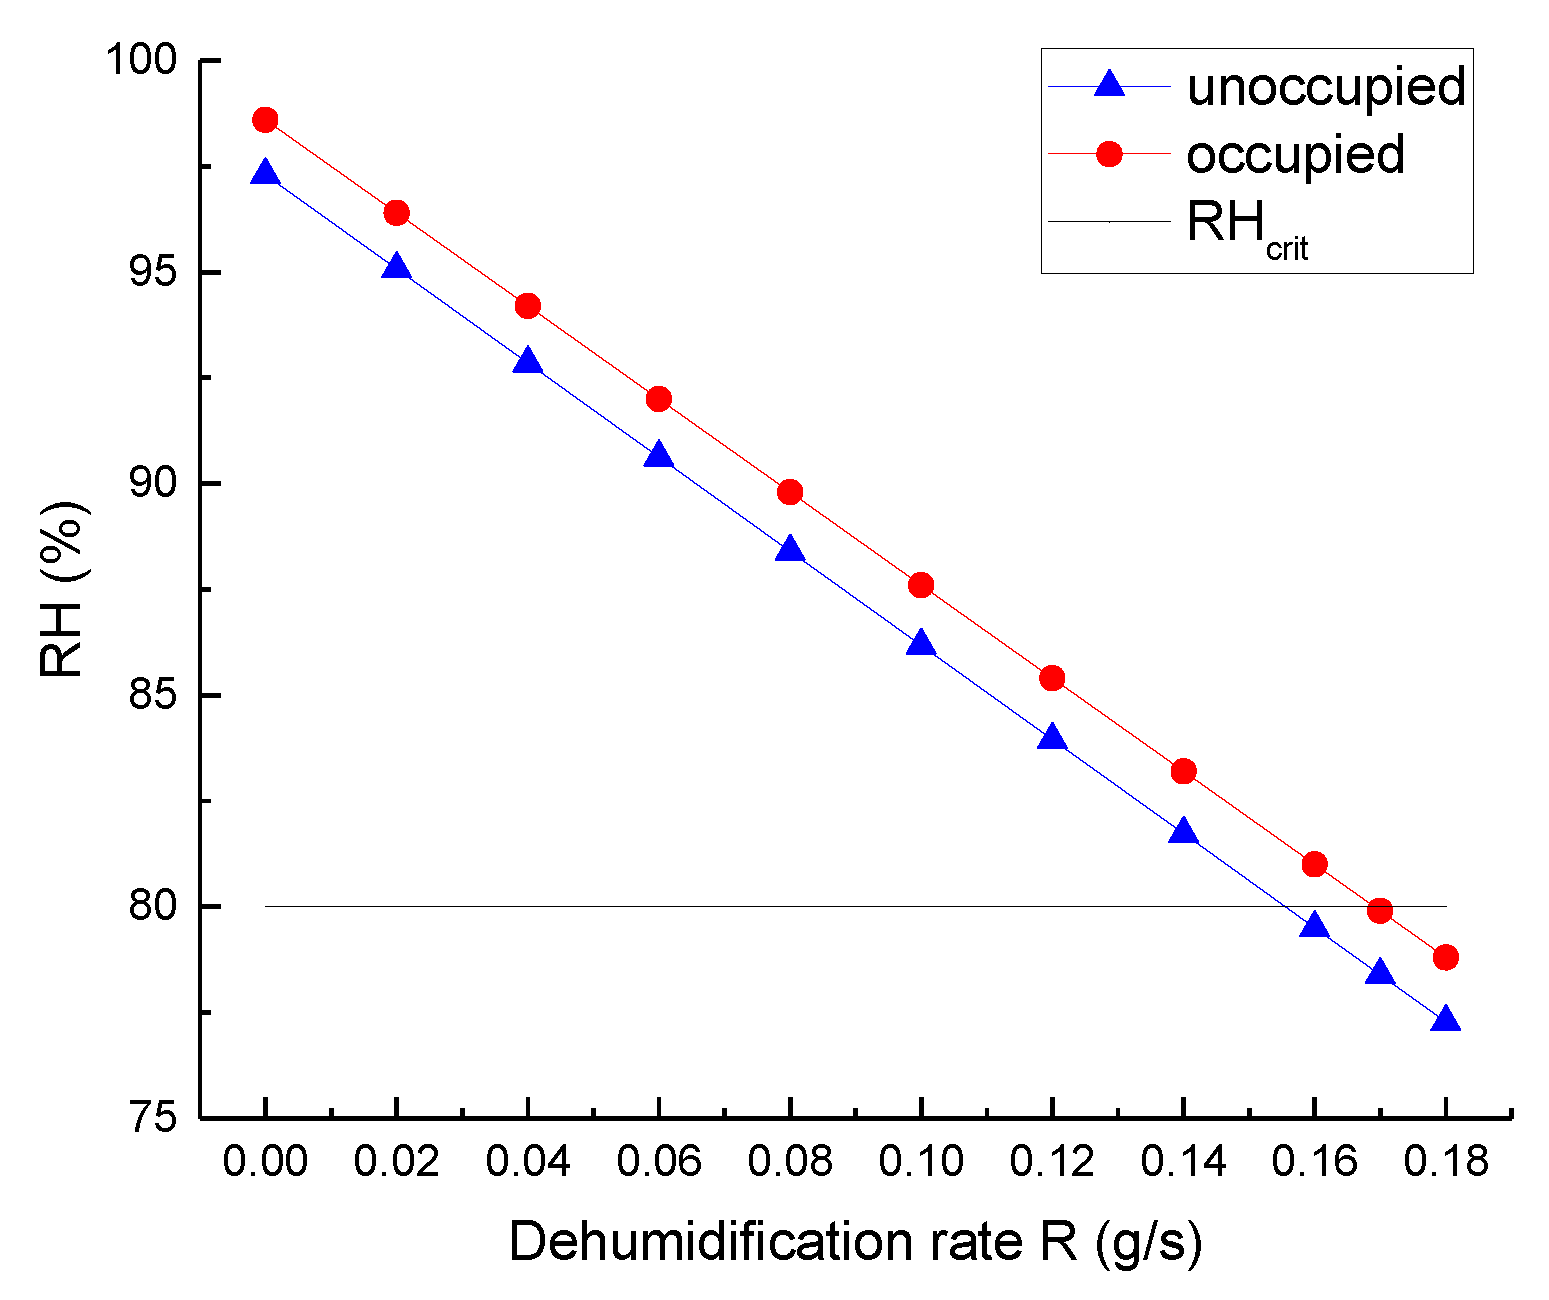
3.4. The Effect of Dehumidification in Unoccupied and Occupied Home

Figure 10 shows the effects of dehumidification on the highest indoor air RH in the unoccupied home and occupied home. The indoor air temperature is independent of dehumidification, and it is the same as that shown in Figure 5, which is higher than 20 °C. The indoor air RH is found to decrease significantly with an increasing dehumidification rate. Compared to the unoccupied home, the indoor air RH in the occupied home is slightly higher at the same dehumidification rate. As shown in Figure 10, when the dehumidification rate rises up by 0.02 g/s, both of the indoor air RH in the unoccupied home and occupied home drop down by 2.2%. As the dehumidification rate increases to 0.16 g/s, the highest indoor air RH in the unoccupied home decreases to 79.0%, while the highest indoor air RH in the occupied home decreases to 81.0%, which is still higher than the RHcrit, i.e., 80%. In the occupied home, the highest indoor air RH exactly reaches the RHcrit when the dehumidification rate rises up to 0.17 g/s.

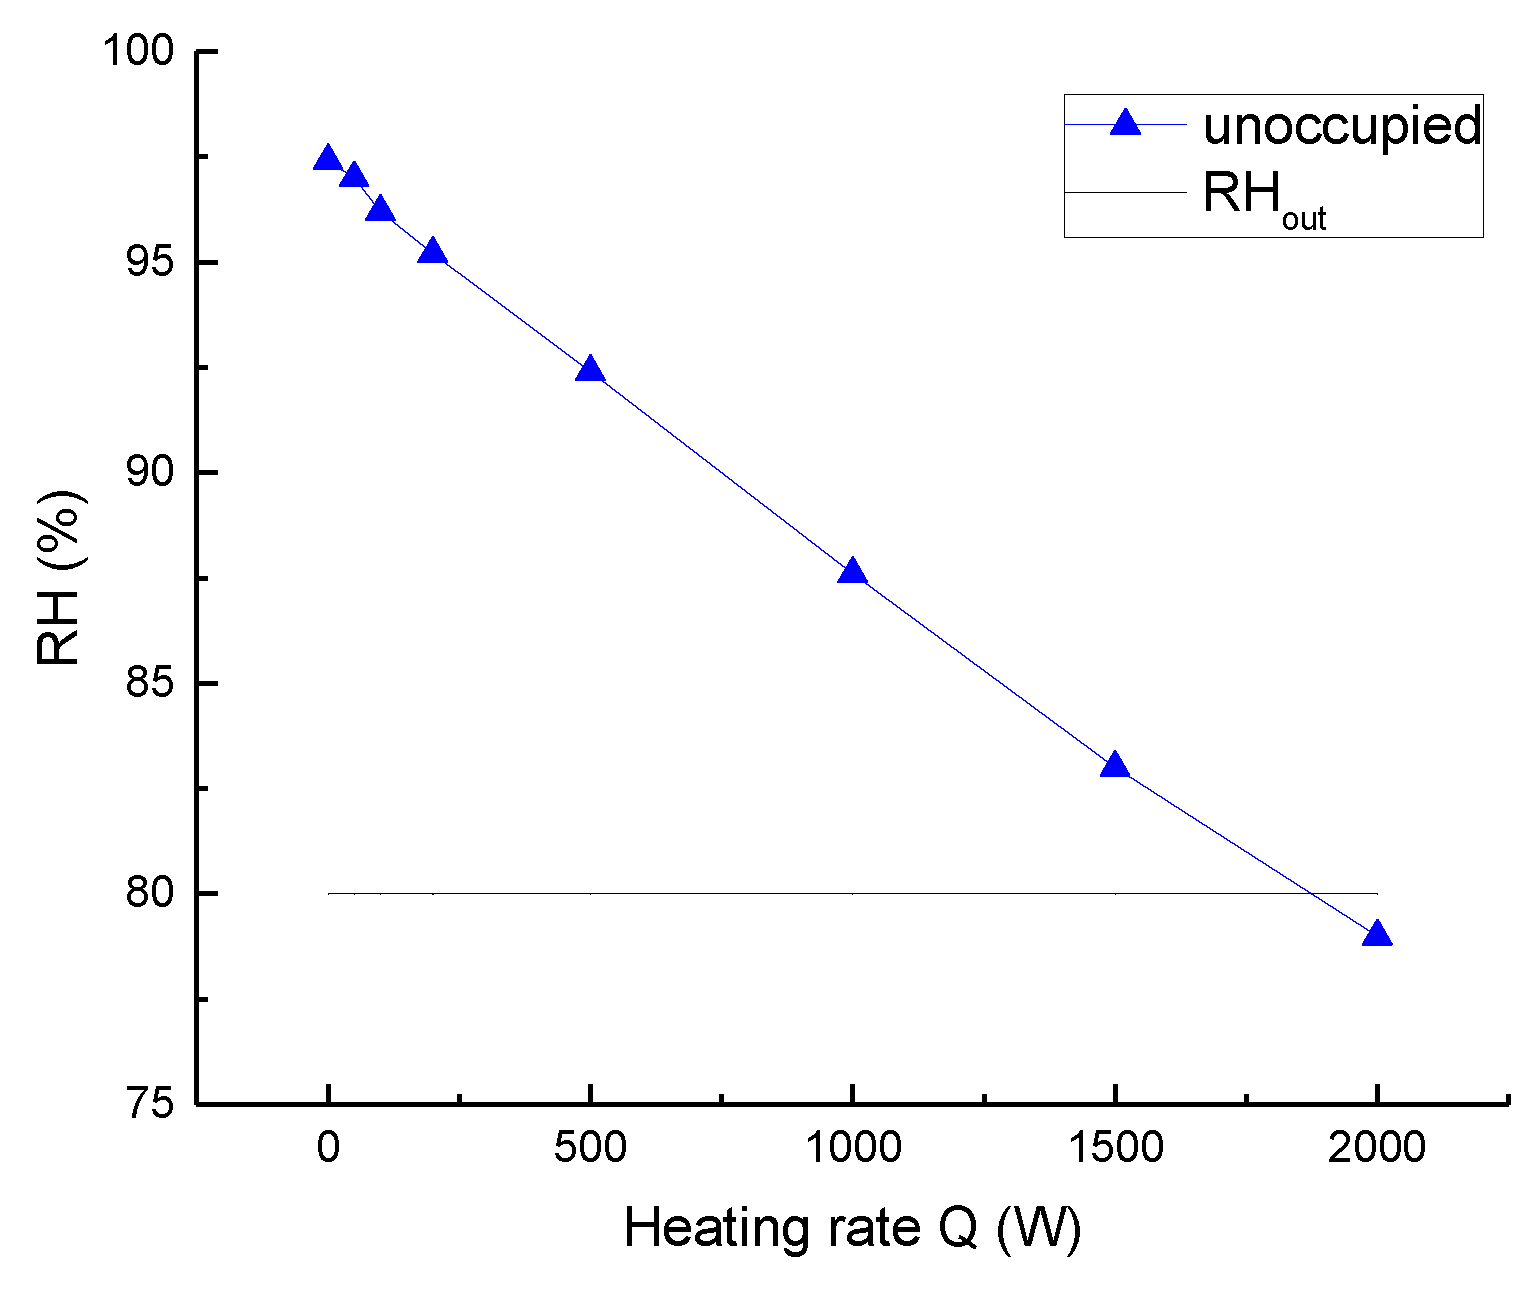
3.5. The Effect of Heating in Unoccupied Home

Figure 11 shows the effect of heating on indoor air RH in the unoccupied home. The indoor air temperature in the home with heating is higher than that without heating, as shown in Figure 5, indicating the indoor air temperature is higher than 20 °C, and the RHcrit is maintained at 80%. As shown in Figure 11, when the heating rate rises up by 250 W, the indoor air RH in the unoccupied home drops down by 2.2%. When the heating rate rises up to 1000 W, the lowest indoor air RH decreases significantly to 79.5%, which is lower than the RHcrit. However, the highest indoor air RH is higher than the critical RH. When the heating rate rises up to 2000 W, the lowest indoor air RH decreases significantly to 72%, and the highest indoor air RH is 79%, indicating that the indoor air RH is lower than the RHcrit.

4. Discussion

RHcrit is found to be a constant in this study, i.e., 80%, because the indoor air temperature is normally higher than 20 °C during the plum rain season. Dehumidification is indispensable for controlling indoor air RH in both the unoccupied home and the occupied home. It is noted that removing moisture is crucial in humidity control in an indoor environment, especially in humid climates [28]. When the dehumidification rate rises up by 0.02 g/s, both of the indoor air RH in the unoccupied home and occupied home drop down by 2.2%, which could be achieved by various dehumidification methods. For instance, a solid desiccant dehumidification system [29] and a liquid desiccant dehumidification system [30] could be combined with the air conditioning system, or a high-efficiency household dehumidifier could also be used in homes [31]. In recent years, hygroscopic building materials have drawn increasing interest from researchers for its virtue of adjusting indoor RH without energy consumption [32]. In an unoccupied home, heating could be an alternative choice, though it may not be as efficient as dehumidification measures. What’s more, the indoor air temperature increases significantly by heating, which reduces the thermal comfort and further influence occupants’ work efficiency.
Human occupancy plays an important role in indoor air RH and its intervention methods in plum rain season. Ventilation is undesirable in an unoccupied home. For unoccupied home without heat and moisture source, ventilation plays a more important role in bringing moisture than bringing heat into an indoor environment when the ventilation rate is lower. With the ventilation rate increasing, the contribution of ventilation on heat intake becomes dominant, resulting in a significant decrease in indoor air RH, which finally reaches the outdoor air RH. In the occupied home, the requirement of ventilation rate depends on the outdoor air temperature. For a specific outdoor air temperature, there exists the optimal ventilation rate at which the indoor air RH reached the minimum value. When the ventilation rate is lower, the effect of ventilation on moisture moving out is stronger than that on heat moving out, contributing to a decrease in the indoor air RH. Then, the indoor air RH becomes higher when the ventilation rate increases due to the role of ventilation in lowering indoor air temperature. The optimal ventilation rate is able to create favorable indoor air RH that is lower than RHcrit at a higher outdoor air temperature. In the specific case discussed in this study, the indoor air RH is lower than RHcrit, i.e., 80% at the outdoor air temperature 28.8 °C. Similarly, the acceptable outdoor air temperature and its corresponding optimal ventilation rate could be identified in other building conditions and the indoor environment.
The indoor air RH and its intervention methods in the unoccupied home and occupied home have been discussed in this preliminary study, though the heat and moisture source of human occupancy are certain, and people indoors are simplified to be sitting quietly. Further studies could investigate different activity types, and field measurements of mold growth indoors may be carried out.

5. Conclusions

The heat source and moisture source of humans is revealed as a predominant factor influencing the indoor air RH and its intervention methods. The tightness of the home also is a significant influencing factor during the plum rain season, especially for the unoccupied home. In the unoccupied home, ventilation is unnecessary. Modest amounts of heating or dehumidification measures are helpful in reducing the indoor air RH for occupied and unoccupied homes. In the occupied home, the effects of ventilation depends heavily on the outdoor temperature due to the coupling between the temperature and humidity. Since heating is not suitable for the occupied home during summer, dehumidification measures are indispensable to control indoor humidity. This study provides general guidelines for residents about preventing mold growth in East Asia during the plum rain season.

Author Contributions

Data curation, formal analysis and writing—original draft, J.Y.; methodology and supervision, H.Q.; Writing—review & editing, X.Z., G.C.

Funding

This research was funded by National Key R&D Program of China, grant No. 2017YFC0702800.

Acknowledgments

This research was also supported by Jan Sundell from Tsinghua University and Cong Liu from Southeast University.

Conflicts of Interest

The authors declare that they have no conflict of interest.

References

  1. He, H.; Lee, H. Yangtze floods recorded on Mt. Mufu and Swallow Cliff in Nanjing, China. Geomatics. Nat. Hazards Risk 2017, 8, 905–917. [Google Scholar] [CrossRef]
  2. Lotz, W.A. Moisture problems in buildings in hot humid climates. ASHRAE J. 1989, 31, 26–27. [Google Scholar]
  3. Dearborn, D.G.; Yike, I.; Sorenson, W.G.; Miller, M.J.; Etzel, R.A. Overview of investigations into pulmonary hemorrhage among infants in Cleveland, Ohio. Environ. Health Perspect. 1999, 107, 495–499. [Google Scholar] [CrossRef] [PubMed]
  4. Menetrez, M.Y.; Foarde, K.K. Emission exposure model for the transport of toxic mold. Indoor Built Environ. 2004, 13, 75–82. [Google Scholar] [CrossRef]
  5. Mussalorauhamaa, H.; Nikulin, M.; Koukilakähkölä, P.; Hintikka, E.L.; Malmberg, M.; Haahtela, T. Health effects of residents exposed to Stachybotrys in water-damaged houses in Finland. Indoor Built Environ. 2010, 19, 476–485. [Google Scholar] [CrossRef]
  6. Gutarowska, B.; Kosmowska, M.; Wiszniewska, M.; Pałczyński, C.; Walusiak-Skorupa, J. An investigation of allergenic proteins produced by moulds on building materials. Indoor Built Environ. 2012, 21, 253–263. [Google Scholar] [CrossRef]
  7. Mendell, M.J.; Mirer, A.G.; Cheung, K.; Tong, M.; Douwes, J. Respiratory and allergic health effects of dampness, mold, and dampness-related agents: a review of the epidemiologic evidence. Environ. Health Perspect. 2011, 119, 748. [Google Scholar] [CrossRef]
  8. Sharpe, R.A.; Le Cocq, K.; Nikolaou, V.; Osborne, N.J.; Thornton, C.R. Identifying risk factors for exposure to culturable allergenic moulds in energy efficient homes by using highly specific monoclonal antibodies. Environ. Res. 2016, 144, 32–42. [Google Scholar] [CrossRef] [Green Version]
  9. Viitanen, H. Improved model to predict mold growth in building materials. In Proceedings of the Thermal Performance of the Exterior Envelopes of Whole Buildings X, Clearwater Beach, FL, USA, 2–7 December 2007. [Google Scholar]
  10. Isaksson, T.; Thelandersson, S.; Ekstrand-Tobin, A.; Johansson, P. Critical conditions for onset of mould growth under varying climate conditions. Build. Environ. 2010, 45, 1712–1721. [Google Scholar] [CrossRef]
  11. Johansson, P.; Svensson, T.; Ekstrand-Tobin, A. Validation of critical moisture conditions for mould growth on building materials. Build. Environ. 2013, 62, 201–209. [Google Scholar] [CrossRef]
  12. Johansson, P.; Ekstrand-Tobin, A.; Svensson, T.; Bok, G. Laboratory study to determine the critical moisture level for mould growth on building materials. Int. Biodeterior. Biodegrad. 2012, 73, 23–32. [Google Scholar] [CrossRef]
  13. Heo, K.J.; Kim, H.B.; Lee, B.U. Concentration of environmental fungal and bacterial bioaerosols during the monsoon season. J. Aerosol Sci. 2014, 77, 31–37. [Google Scholar] [CrossRef]
  14. Yang, J.; Qin, M. Indoor thermal conditions in residential buildings during the plum rain season in East China. J. Civ. Archit Environ. Eng. 2015, 37, 40–46. [Google Scholar]
  15. Viitanen, H.; Vinha, J.; Salminen, K.; Ojanen, T.; Peuhkuri, R.; Paajanen, L.; Lähdesmäki, K. Moisture and bio-deterioration risk of building materials and structures. J. Build. Phys. 2010, 33, 201–224. [Google Scholar] [CrossRef]
  16. Liu, T.; Li, L.; Zhang, J.; Zhan, C.L.; Liu, H.X.; Zhang, J.R.; Yao, R.Z.; Cao, J.J. Concentration and size distribution of bioaerosols in indoor environment of university dormitory during the plum rain period. Huan Jing Ke Xue 2016, 37, 1256–1263. [Google Scholar] [PubMed]
  17. Quansah, R.; Jaakkola, M.S.; Hugg, T.T.; Heikkinen, S.A.; Jaakkola, J.J. Residential dampness and molds and the risk of developing asthma: a systematic review and meta-analysis. PLoS ONE 2012, 7, e47526. [Google Scholar] [CrossRef] [PubMed]
  18. Hukka, A.; Viitanen, H.A. A mathematical model of mould growth on wooden material. Wood Sci. Technol. 1999, 33, 475–485. [Google Scholar] [CrossRef]
  19. Pasanen, A.-L.; Kalliokoski, P.; Pasanen, P.; Jantunen, M.; Nevalainen, A. Laboratory studies on the relationship between fungal growth and atmospheric temperature and humidity. Environ. Int. 1991, 17, 225–228. [Google Scholar] [CrossRef]
  20. Varodompun, J.; Navvab, M. Hvac ventilation strategies: the contribution for thermal comfort, energy efficiency, and indoor air quality. J. Green Build. 2007, 2, 131–150. [Google Scholar] [CrossRef]
  21. Turner, W.J.N.; Logue, J.M.; Wray, C.P. A combined energy and IAQ assessment of the potential value of commissioning residential mechanical ventilation systems. Build. Environ. 2013, 60, 194–201. [Google Scholar] [CrossRef]
  22. Adams, R.I.; Bhangar, S.; Pasut, W.; Arens, E.A.; Taylor, J.W.; Lindow, S.E.; Nazaroff, W.W.; Bruns, T.D. Chamber bioaerosol study: outdoor air and human occupants as sources of indoor airborne microbes. PloS ONE 2015, 10, e0128022. [Google Scholar] [CrossRef] [PubMed]
  23. Alev, Ü.; Kalamees, T. Avoiding mould growth in an interiorly insulated log wall. Build. Environ. 2016, 105, 104–115. [Google Scholar] [CrossRef]
  24. Johansson, S.; Wadsö, L.; Sandin, K. Estimation of mould growth levels on rendered façades based on surface relative humidity and surface temperature measurements. Build. Environ. 2010, 45, 1153–1160. [Google Scholar] [CrossRef]
  25. Zhao, R.; Fan, C.; Xue, D.; Qian, Y. Air Conditioning, 3rd ed.; China Archit Build Press: Beijing, China, 1994; pp. 52–53. [Google Scholar]
  26. Li, Y.; Xu, P. Thermal mass design in buildings–heavy or light? Int. J. Vent. 2006, 5, 143–150. [Google Scholar] [CrossRef]
  27. Li, S. Empirical formula of temperature and saturated humidity ratio. HV & AC 2003, 33, 112–113. [Google Scholar]
  28. Rudd, A. Measure Guideline: Supplemental Dehumidification in Warm-Humid Climates; US Department of Energy, Energy Efficiency & Renewable Energy: Somerville, MA, USA, 2014. [CrossRef]
  29. Hourani, M.E.; Ghali, K.; Ghaddar, N. Effective desiccant dehumidification system with two-stage evaporative cooling for hot and humid climates. Energy Build. 2014, 68, 329–338. [Google Scholar] [CrossRef]
  30. Yin, Y.; Zhang, X.; Chen, Z. Experimental study on dehumidifier and regenerator of liquid desiccant cooling air conditioning system. Build. Environ. 2007, 42, 2505–2511. [Google Scholar] [CrossRef]
  31. Arlian, G.L.; Neal, J.S.; Morgan, M.S.; Vyszenski-Moher, D.L.; Rapp, C.M.; Alexander, A.K. Reducing relative humidity is a practical way to control dust mites and their allergens in homes temperate climates. J. Allergy Clin. Immunol. 2001, 107, 99. [Google Scholar] [CrossRef]
  32. Xie, H.; Gong, G.; Wu, Y.; Liu, Y.; Wang, Y. Research on the hygroscopicity of a composite hygroscopic material and its influence on indoor thermal and humidity environment. App. Sci. 2018, 8, 430. [Google Scholar] [CrossRef]
Figure 1. The critical relative humidity (RH) for mold growth on a wooden material [9].
Atmosphere 10 00097 g001
Figure 2. The sketch map of an ordinary home occupied with parents and one child.
Atmosphere 10 00097 g002
Figure 3. Outdoor air temperature (A) and RH (B) during the plum rain season in Nanjing in 2015.
Atmosphere 10 00097 g003aAtmosphere 10 00097 g003b
Figure 4. The diurnal variation of outdoor air temperature and RH on a plum rain day.
Atmosphere 10 00097 g004
Figure 5. Diurnal variation of outdoor and indoor air temperature.
Atmosphere 10 00097 g005
Figure 6. Diurnal variation of outdoor and indoor air RH.
Atmosphere 10 00097 g006
Figure 7. Indoor air temperature in the unoccupied home (A) and occupied home (B).
Atmosphere 10 00097 g007aAtmosphere 10 00097 g007b
Figure 8. The highest indoor air RH with different ventilation rates.
Atmosphere 10 00097 g008
Figure 9. The highest indoor air RH under various outdoor air temperatures in the occupied home.
Atmosphere 10 00097 g009
Figure 10. The highest indoor air RH under different dehumidification rates.
Atmosphere 10 00097 g010
Figure 11. The highest indoor air RH under different heating rates in the unoccupied home.
Atmosphere 10 00097 g011
Table 1. A summary of physical parameters of the building envelope and air [26].
ItemsDensity (kg/m3)Heat Capacity (J/(kg °C))Combined Convective Heat Transfer Coefficient (W/(m2 °C))Volume (m3)Area (m2)
Concrete blocks14001000521.6108
Air1.21005 270

