Abstract
This research analyzed the spatiotemporal patterns of drought in Xinjiang (northwestern China) between 1961 and 2015 using the standardized precipitation evapotranspiration index (SPEI). Furthermore, the correlations between Atlantic Multidecadal Oscillation (AMO)/El Niño–Southern Oscillation (ENSO) events and drought were explored. The results suggested an obvious trend toward aggravated drought, with a significant inflection point in 1997, after which the frequency of drought increased sharply. Spatially, the increase in drought occurred largely in southern and eastern Xinjiang, where occurrences of moderate and extreme drought have become more frequent during the last two decades, whereas northwestern Xinjiang and the Pamir Plateau showed wetting trends. Empirical orthogonal function analysis (EOF) of drought patterns showed a north–south antiphase and an east–west antiphase distribution. The positive (negative) phase of the AMO was related to increased (decreased) drought in Xinjiang, particularly after 1997. During a warm phase (El Niño), major droughts occurred over northern Xinjiang, but they lagged by 12 months. However, not all El Niño and La Niña events were responsible for drought events in northern Xinjiang during this period, and other drivers remain to be identified. This study suggests the possibility of AMO and ENSO links to drought in Xinjiang, but further analysis is needed to better understand such mechanisms.
1. Introduction
Drought is one of the most serious, most widespread, and costliest natural disasters, with impacts on agriculture, ecosystems, hydrology, the economy, and social activities [1,2,3]. Long-lasting droughts have occurred on all continents, including Asia, Africa, Europe, South America, and Australia [4,5,6]. Drought is driven by many climatic factors, particularly precipitation, temperature, and evapotranspiration. Recently, severe droughts have occurred more frequently due to global temperature rise, which can increase atmospheric evaporative demand [7,8,9]. Vicente-Serrano et al. [9] verified that temperature rise resulted in more frequent and severe droughts in southern Europe. Hence, a better understanding of drought is of primary importance for drought planning and risk management of drought disasters, especially under global warming.
To monitor drought events more effectively, various indices have been developed to depict drought. Among them, the standardized precipitation evapotranspiration index (SPEI) takes into account the monthly climatic water balance (the difference between precipitation and reference evapotranspiration, i.e., precipitation over potential evapotranspiration (P-PET), combining the multiscale character of the standardized precipitation index (SPI) and the sensitivity of the Palmer drought severity index (PDSI) to changes in evaporative demand [1,2]. SPEI is widely used in the meteorological community to monitor drought severity, to quantify and analyze drought, and to determine drought impacts in a variety of systems [10,11]. Hence, SPEI has become an effective tool to monitor and assess droughts under global warming [12].
Surface air temperature has experienced rapid warming in mid-latitude central Asia, including Xinjiang [13,14,15,16]. Xinjiang is located in the arid region of northwestern China. A climatic transition from warm–dry to warm–wet has been reported in Xinjiang based on observed data [17]. Most evidence for hydroclimatic and environmental change in Xinjiang has given strong support to this observation [18,19,20,21]. Dramatic changes in climatic conditions can bring about adverse effects, and drought is one of them.
In Asia, most drought studies have concentrated on the eastern monsoon region, but central Asia is rarely studied as a drought-prone region [7,22]. Drought is a key process for regional management in water-stressed regions. Dryland expansion has accelerated under climate change [23]. Li et al. [24] found that 65% of the land area in central Asia has shown a drying trend over the past decade (2000–2014), especially in southern Xinjiang. Similarly, northwestern China has also sustained severe droughts in the past few decades [25]. Drought-affected and damaged area has increased over the past two decades [25]. Li et al. [26] found that drought severity decreased in Xinjiang using four drought indices (the United Nations Environment Programme (UNEP) index, Erinç’s aridity index, Sahin’s aridity index, and SPEI) from 1961 to 2012. Zhang et al. [27] reported that the severity and duration of drought decreased in northern Xinjiang but increased in southern Xinjiang from 1957 to 2009. Wang et al. [25] analyzed drought conditions in northwestern China (including Xinjiang) and found the highest drought activity period (1973–1983) during 1960–2010. Mahmood et al. [28] showed that severe drought occurred from 1983 to 1986 over western Xinjiang. Previous studies have reported that droughts are showing a tendency to weaken but that the changes are different in different regions of Xinjiang and using different drought indices. These contradictory results indicate that spatial patterns of drought vary within a larger region, and given the variations in the evolution and spatiotemporal patterns of drought in Xinjiang, regional drought severity research is still needed.
Given this controversy, what is the real image of drought variability, and what are the spatial patterns of drought? To this end, the present study focuses on long-term drought variability in Xinjiang using large-scale patterns. It aims to evaluate spatiotemporal patterns of drought during the past half-century and to explore possible links between drought and large-scale ocean–atmospheric circulation patterns.
2. Study Area, Data Sources, and Methodology
2.1. Study Area and Data Sources
The study region corresponds to Xinjiang, which is located in the Eurasian hinterland, covering an area of 1.66 × 10⁶ km2. In general, the region is characterized by “three mountains and two basins” [29]. Three mountain ranges—the Tianshan, Altai, and Kunlun Mountains—are surrounded by vast desert basins—the Tarim Basin and the Junggar Basin (Figure 1) [27]. Xinjiang is divided by the Tianshan Mountains into northern and southern Xinjiang, resulting in mountain–basin systems with different hydrological conditions. It is far from any maritime influences, with annual precipitation of 158 mm (only 25% of the annual precipitation in the eastern monsoon area), and is one of the driest areas in the world. Because wet marine air rarely reaches inland, the ecosystems in this region is very fragile [20]. The subsurface of the Gobi Desert responds quickly to solar heating, resulting in major evaporation of ground moisture and thus increased drying [27]. The region is also quite sensitive to global climate change [29,30].
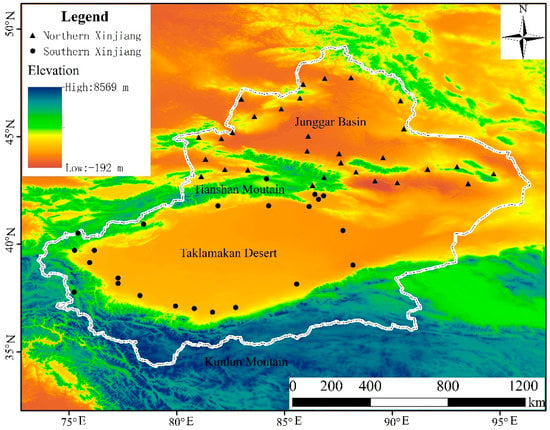
Figure 1.
Study area and meteorological stations in Xinjiang.
Continuously observed monthly climate variables during 1961–2015 from 55 stations in Xinjiang were provided by the China Meteorological Administration (CMA). The homogeneity and reliability of the monthly meteorological data were checked and controlled by the CMA before their release. The original datasets were tested for inhomogeneities using the standard normal homogeneity test.
2.2. Methodology
2.2.1. Standardized Precipitation Evapotranspiration Index (SPEI)
SPEI, which was first described by Vicente-Serrano et al. [1,2], is estimated by the climatic balance between monthly precipitation and atmospheric evaporative demand (monthly potential evapotranspiration, or PET) [10]. Vicente-Serrano et al. [31] provided the contribution of precipitation and evaporative demand to drought indices for different climates, and SPEI reflects the most evident sensitivity to PET, which is mainly controlled by aridity. Hence, SPEI has become an effective tool to monitor and assess droughts under global warming. SPEI includes multiscale characteristics to determine drought variability and is calculated for each month of the year. Time scales of 1 to 24 months are selected for analysis.
SPEI combines precipitation and PET data, with the Thornthwaite model approach used to calculate PET. Following this approach, the monthly PET (mm) can be calculated as follows:
where N is the maximum number of hours of sunlight per day, NDM is the number of days in the month, T is the average air temperature (°C), I is the heat index, which is calculated as the sum of the 12 monthly index values:
and m is a coefficient that depends on I:
The deficit or surplus accumulation of a climate water balance at different time scales is calculated by the difference between precipitation (P) and PET for month i:
The calculated Di values are aggregated into different time series, following the same procedure as for SPI. The difference in a given time n depends on the chosen time scale k (months):
Next, the water balance is normalized into a log-logistic probability distribution to obtain the SPEI index series. The probability density function of a three-parameter log-logistic distributed variable can be expressed as follows:
where α, , and are the scale, shape, and origin parameters, respectively, for D values in the range ( > D < ∞). Hence, the probability distribution function of the D series is given by the following equation:
The F(x) value is then transformed to a normal variable by means of the following approximation:
where W is a probability-weighted moment, for p ≤ 0.5 is the probability of exceeding a given D value, p = 1 − F(x). If P > 0.5, then P is replaced by 1 − p, and the sign of the resulting SPEI is reversed. The constants are C0 = 2.515517, C1 = 2.515517, C2 = 2.515517, d1 = 2.515517, d2 = 2.515517, and d3 = 2.515517.
Di = Pi − PETi
In this study, SPEI values were calculated for each month of the year, and time scales of 12 months (referred to as “12-month SPEI”) were selected for analysis. The annual SPEI index was calculated at each station for each of the 12-month SPEI index values. Spatially, the regional SPEI index was calculated on the average of all stations in Xinjiang. The latitude, longitude, and elevation information at 55 selected meteorological stations are listed in Table 1. The World Geodetic System 1984 (WGS84) coordinates was used. The SPEI drought categories are listed in Table 2.

Table 1.
Basic information about the 55 selected meteorological stations in Xinjiang.

Table 2.
Drought classifications of standardized precipitation evapotranspiration index (SPEI).
Individual drought events were identified in Xinjiang by the 12-month SPEI (< −1.5) and were characterized based on duration, magnitude, intensity, and percentage of stations affected to determine drought severity. These variables were determined as follows: duration (D) was calculated as the time length of a drought event; magnitude (M) was obtained by summing all the SPEI values during every event; intensity (I) was the ratio of a drought’s event magnitude to its duration; and the percentage of stations affected (A, unit: %) was defined using the ratio of the number of stations where drought occurred to the total number of stations. The drought frequency was defined as the number of drought events in a given period, and the average of all stations was used for the regional analysis. Drought frequency difference (DFD) was defined as the average annual number of drought months with a category different from the average.
2.2.2. Links to Large-Scale Ocean–Atmospheric Circulation Patterns
Drought is often associated with indices of long-distance connection [8]. Hence, the performance of the SPEI as a measure of drought can be evaluated by correlating area-averaged SPEI with large-scale modes of variation in Xinjiang. In arid central Asia, the Atlantic Multidecadal Oscillation (AMO) mode has been linked to precipitation patterns on a decadal time scale [32], and it was therefore included in the present study. The AMO is a coherent mode of natural variability occurring in the North Atlantic Ocean with an estimated period of 60–80 years. It is defined in terms of detrended 10-year low-pass filtered annual mean sea surface temperature (SST) anomalies over the North Atlantic (0° N–65° N, 80° W–0° E) [33,34]. The El Niño Southern Oscillation (ENSO) phenomenon is considered to be one of the most influential long-distance connection patterns on a global scale and has a large influence on the occurrence of drought [35,36]; it was therefore included in the present study. The Niño3.4, was used as the index describing the ENSO phenomenon. The Niño3.4 is the mean SST anomaly in the region bounded by 5° N and 5° S from 170° W to 120° W. Monthly AMO and El Niño (La Niña) were obtained from the China National Climate Centre (http://cmdp.ncc.cma.gov.cn/cn/ download.htm).
2.2.3. Trend Analysis
The nonparametric Mann–Kendall method (M–K) recommended by the World Meteorological Organization (WMO) [37,38] was used to assess the significance of changes in climate and drought from 1961 to 2015. This method has been used to investigate the significance of trends in various hydrometeorological factors, including drought indices.
2.2.4. Empirical Orthogonal Function Analysis (EOF)
The empirical orthogonal function (EOF) decomposes climate data from different locations into a set of orthogonal spatial patterns (EOF modes) together with a set of associated uncorrelated temporal variations (principal components) [32]. North’s law [39] was used to investigate the number of significant orthogonal functions. This method has been widely used to determine the spatial and temporal characteristics of hydrometeorological factors, including drought [22,36]. Hence, the EOF method was used here to determine the spatial patterns of drought using the 12-month SPEI in Xinjiang from 1961 to 2015.
3. Results
3.1. Changes in the Magnitude and Frequency of SPEI
The temporal variability and spatial distribution of annual SPEI trends in Xinjiang are shown in Figure 2. It can be seen that the annual SPEI clearly exhibited a decreasing trend and greater decadal fluctuations, with a trend magnitude of −0.12/decade (p < 0.05) during 1961–2015 (Figure 2a). A significant change point occurred in 1997 (Figure 2b), consistent with inflection points found for temperature in central Asia [16]. Table 3 shows that about 75% of stations had drying (decreasing) trends, especially in southern Xinjiang and along the western Tianshan Mountains. Stations in eastern Xinjiang displayed wetting (increasing) trends that were statistically insignificant (Table 3). The seasonal variability of SPEI was the same as that of annual SPEI (data not shown). This indicates an increased drought trend in Xinjiang based on the SPEI.

Figure 2.
(a) Temporal variability (straight lines denote linear trend) and (b) M–K test of annual SPEI for 1961–2015 in Xinjiang. The UF curve indicates the statistical series of the standard normal distribution, and the UB curve indicates the reverse statistical series. Because the line UF is above the confidence line (p = 0.05, green line), the crossing point of UF and UB is the start of abrupt change in this series.

Table 3.
Spatial trend analysis for the annual SPEI at 55 meteorological stations.
Figure 3 shows the variability of monthly SPEI at different timescales (1 to 24 months) from 1961 to 2015 in Xinjiang. The variability of SPEI at the 24 time scales all exhibited a drying trend in South Xinjiang (Table 4). The SPEI values were different before and after 1997, especially in 2005. Normal and wet conditions were observed before 1997, whereas droughts occurred frequently after 1997.
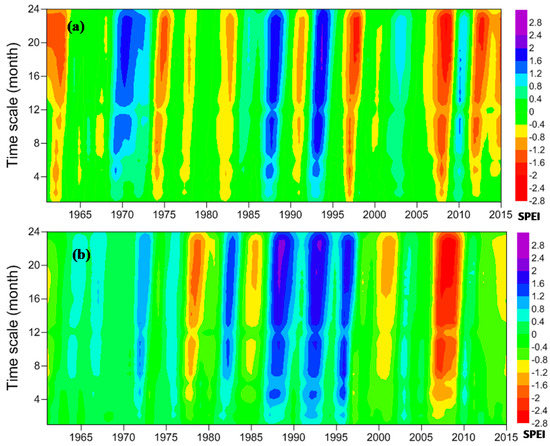
Figure 3.
Interannual variability of SPEI at different timescales in (a) North Xinjiang and (b) South Xinjiang (the vertical axis represents the timescale from 1 to 24 months, and the horizontal axis represents the year from 1961 to 2015).

Table 4.
Trend analysis for annual SPEI in Xinjiang and its regions.
Figure 4 displays the drought frequency variability and the spatial distributions of DFD for various categories over all stations for 1997–2015 and 1961–1996. All drought frequencies were found to have increased severalfold, whereas all wetness categories decreased by half during 1997–2015 (Figure 4a). For mild drought, the frequency increased to 18.02 occurrences/decade during 1997–2015 compared with 9.65 occurrences/decade in 1961–1996, giving a proportional change of 1.9. For moderate drought, the frequency increased significantly to 13.44 occurrences/decade during 1997–2015 compared with 4.60 occurrences/decade during 1961–1996, giving a proportional change of 2.9. For extreme drought, the frequency rose rapidly to 7.89 occurrences/decade over 1997–2015 compared with only 1.69 occurrences/decade for 1961–1996, giving a proportional change of 4.7.
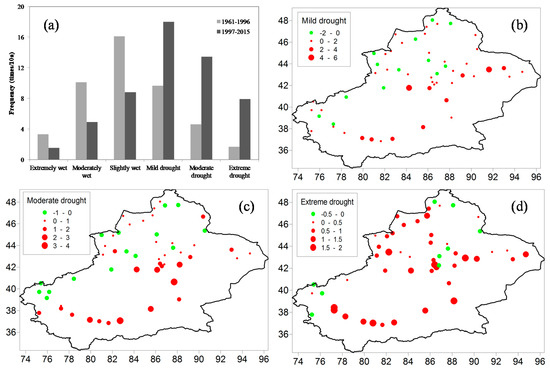
Figure 4.
(a) Frequency of drought and wetness variability before and after 1997. Spatial distributions of drought frequency difference (DFD) between 1997–2015 and 1961–1996 in Xinjiang: (b) mild drought, (c) moderate drought, and (d) extreme drought. DFD is defined as the average annual number of drought months with a category different from the average (units: times per year, 1997–2015 minus 1961–1996).
Spatial distributions of DFD for different drought categories in 1997–2015 and 1961–1996 are plotted in Figure 4b–d. These figures show that increased drought occurred primarily in the southern and eastern parts of Xinjiang. However, mild and moderate DFD decreased in the northwestern parts of Xinjiang and the Pamir Plateau (Figure 4b,c). As for extreme drought, the DFD decreased only in the Pamir Plateau, the central Tianshan Mountains, and the Altai Mountains (Figure 4d). The analysis demonstrates that moderate and extreme drought occurrences have become more frequent during the last two decades, especially in the southern and eastern parts of Xinjiang, and that the climate is becoming drier over all of Xinjiang except for the Pamir Plateau.
3.2. Spatial Patterns of Drought by EOF
Figure A1 shows a plot of the eigenvalues and eigenvectors of the annual SPEI based on EOF analysis and North’s law. It illustrates that the first three factors explained more than 64% of the total variance in SPEI. The first three EOFs and their corresponding PCs can therefore be used to identify the primary features of drought patterns.
For annual SPEI, EOF1 explained 37.1% of the total variance, reflecting the evolution of regional dry conditions and coherent drought over Xinjiang (Figure 5a1). This region is mainly dominated by a westerly circulation. Because the high values in EOF1 regions were positive, the valleys in PC1 corresponded to dry years. This shows that the climate was relatively wet before 1997 but became dry after 1997. The linear PC1 time series also exhibited a decreasing trend, which means that drought severity has become aggravated over the past 55 years (Figure 5a2).
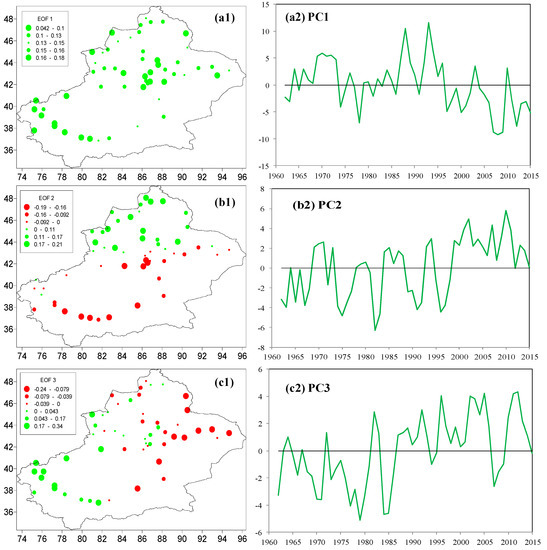
Figure 5.
First three loading vectors and their corresponding principal component (PC) series for 1961–2015. (a1–c1) empirical orthogonal function (EOF) analysis for annual SPEI; (a2–c2) corresponding PCs for annual SPEI.
The second component, EOF2, accounted for 15.4% of the total variance and clearly reflected the antiphase distribution corresponding to southern and northern Xinjiang (Figure 5b1). This pattern is mainly affected by topography and atmospheric circulation, reflecting the fact that Xinjiang is divided by the Tianshan Mountains, which form northern and southern parts and result in different climate conditions. Combined with the positive EOF in northern Xinjiang, 1997–2015 was dominated by a wet trend in northern Xinjiang but by a dry period in southern Xinjiang (Figure 5b2). PC2 displayed an increasing trend, that is, northern Xinjiang became wetter, and the southern part became drier, which is consistent with preliminary studies of the climatic transition from warm–dry to warm–wet in northwestern arid regions of China [17,20,21]. EOF3 mainly revealed the eastern and western parts of the antiphase distribution (Figure 5c1). This factor explained 11.4% of the total variance and represented the climate transition after 1986. The PC3 line epitomized an increasing trend, which meant that southwestern Xinjiang experienced a wet trend during 1961–2015 (Figure 5c2).
The aforementioned analysis shows that 1997–2015 was the driest period over the past 55 years. To capture more accurate information, EOF was used to determine the spatial and temporal modes for 1997–2015. EOF1 accounted for 34.6% of the total variance and denoted drought in the Tianshan Mountains (Figure A2a1). PC1 showed wet/dry fluctuations (Figure A2b1). The second pattern (16.9% of the total variance) mainly indicated the antiphase distribution corresponding to northwestern Xinjiang and the Tianshan Mountains (Figure A2a2). PC2 displayed a decreasing trend, showing northwestern Xinjiang has become wetter (Figure A2b2). EOF3 (Figure A2c1) explained 12.5% of the total variance and revealed the wet/dry antiphase fluctuation between southern and northern Xinjiang.
3.3. Major Drought Events Identified over the Past 55 Years
Table 5 lists the top 10 drought events ordered by their intensity. The most severe drought was observed from May 2008 to December 2009. This drought occurred near the eastern Tianshan Mountains and southern Xinjiang from July 2008 to April 2009, with the affected area increasing by 30% and the intensity increasing by 40% (Figure A3). It was reported that this drought caused the loss of 1.22 million hectares of crops and 28 million hectares of grasslands, resulted in one billion yuan in direct economic losses, and caused the Tarim River, China’s longest inland river, to run dry over more than 1100 km [40,41].

Table 5.
Top 10 drought events ranked by intensity in Xinjiang, China.
The means of magnitude, intensity, and percentage of stations affected for different drought durations were used to understand the variation in drought severity with duration. Figure 6 plots the relationships of drought magnitude, intensity, and percentage of stations affected with duration. Drought magnitude followed an exponential curve with duration, as illustrated by the exponential functions associated with the M–D curves and with a coefficient of determination (R2) of 0.98. This means that drought magnitude increased exponentially with duration. Intensity displayed a linear relationship with duration, with a coefficient of determination of 0.58. This implies that drought intensity may increase with duration. A log function was used to determine the A–D relationship, with R2 = 0.92. This implies that the drought-affected area decreases logarithmically with duration. These relationships would also be useful for drought frequency analysis and drought impact assessment.
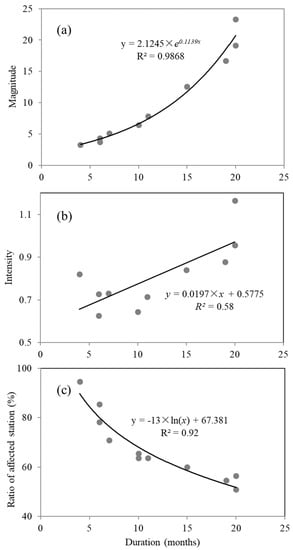
Figure 6.
Changes in (a) magnitude, (b) intensity, and (c) percentage of stations affected with duration of drought events.
3.4. Correlations and Possible Link between Large-Scale Patterns and Drought Events
Two major internal variability patterns at multidecadal time scales include AMO and PDO [42,43,44]. An obvious inverse relationship was found between AMO and SPEI, with AMO+ (AMO−) corresponding to a dry (normal) period in Xinjiang, particularly after 1997 (Figure 7). Pearson correlation analysis revealed that the monthly (annual) SPEI drought index had a robust and significant correlation with AMO from 1961 to 2015, with a correlation coefficient of −0.23 (−0.32, p < 0.05). The evolution of the phase transition in the 60-year AMO oscillation, which occurred about 1996/97, accords well with the timing of SPEI.
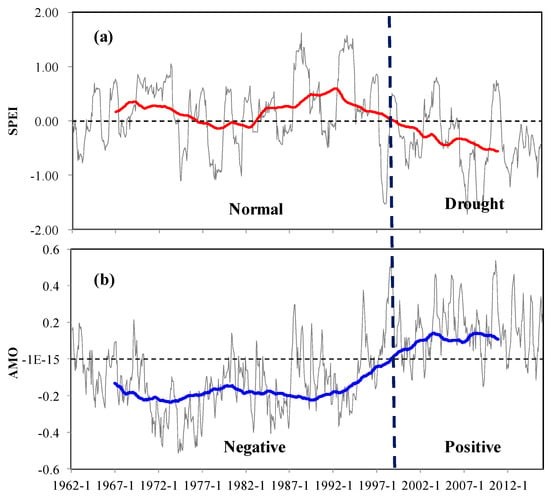
Figure 7.
1962–2015 monthly SPEI at 12 time scales (a, red line indicates the 121 month smoothed SPEI index) and the Atlantic Multidecadal Oscillation (AMO) index (b, blue line indicates the 121 month smoothed AMO index).
The correlations from 1997 to 2015 were positive and higher than 1961–1996, with correlation coefficients of 0.25 and 0.44 for monthly and annual SPEI drought, respectively. The correlation coefficient between PC1 and AMO for 1961–2015 (1997–2015) was −0.35 (0.45), which was consistent with the original SPEI series (Figure A4a). PC2 and AMO had a statistically significant positive relationship for 1961–2015, but the phase of AMO was quite different from that of SPEI for 1997 to 2015 (Figure A4b). Huang et al. [32] argued that excessive precipitation in arid central Asia (ACA, including Xinjiang) is linked to negative phases of the “Silk Road pattern”, which is a part of the circumglobal teleconnection (CGT) pattern [45]. The North Atlantic plays an important role in generating the CGT [46], and AMO is the multidecadal fluctuation pattern of variations in North Atlantic SST [34]. Hence, an anomalous AMO may play an important role in ACA summer precipitation patterns on a decadal time scale [32].
An inverse relationship is obvious between ENSO and dry/wet conditions during 1997–2015 in Xinjiang, which also reveals that the EOF2 mode interacts with ENSO (Figure A4b). The results indicate that drought in northern Xinjiang is closely related with ENSO events. The relationship between the SST anomaly (for Niño3.4) and SPEI for northern Xinjiang was not strong before 1997, but it then became undeniable (Figure A5). Indications are clear that the drought epochs were caused by the negative SST anomaly associated with Niño3.4 during 1997–2015 and had delayed effects. Cross-correlation analysis was used to estimate the lag time between the onsets of the two events (ENSO and drought). Figure 8 shows the cross-correlation between SPEI for northern Xinjiang and the SST anomaly for Niño3.4 at different lag times. The results indicated that the lag time was 12 months, that is, the drought in northern Xinjiang lagged the Niño3.4 SST anomaly by 12 months. Note that most of the well-known drought events in northern Xinjiang that have also been precisely indicated by SPEI (such as 1965, 1977, 1982, 1991, 1997, and 2015) occurred with El Niño events (Table 6). However, drought epochs corresponding to the negative SST anomaly (Figure 8) and severe drought occurrences following La Niña events occurred only in 1975, 2008, and 2011 (Table 6). These previous analyses indicate that not all ENSO events are responsible for drought events in northern Xinjiang, which means that these droughts apparently cannot be explained solely by ENSO events, and other drivers remain to be discovered.
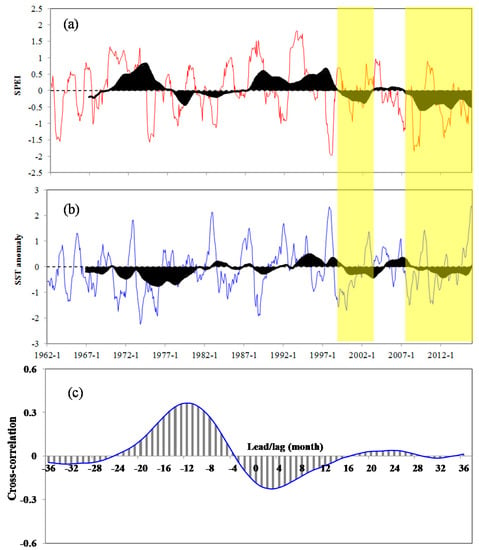
Figure 8.
(a) 1962–2015 monthly SPEI at 12 time scales and (b) sea surface temperature (SST) anomaly (for Niño3.4) and their low-pass variability after applying a 60-month (5-year) running mean (shaded). Yellow areas correspond to periods of drought and negative SST anomaly. (c) Cross correlation between Niño 3.4 SST anomaly and SPEI with negative lags for SST leading SPEI.

Table 6.
Correspondence between El Niño and La Niña events and drought events in North Xinjiang, China.
4. Discussion
Several authors—Zhang et al. [27], Tao et al. [11], and Li et al. [26,29]—have reported a trend toward drought alleviation in Xinjiang based on precipitation-based drought indices from 1961 to 2009 (2012). These suggestions were correlated with an increase in precipitation during the same period [20,47]. However, it should be noted that precipitation, even without the continuously increasing trends in the 1990s, exhibited a slight decreasing trend in the 21st century. In addition, the temperature rise accelerated sharply in 1997, and since then, temperature has remained high. Undoubtedly, precipitation is the most critical meteorological variable affecting drought, but the effect of rising temperature on increased drought severity is not negligible [9]. Vicente-Serrano et al. [9] reported that increased drought severity in southern Europe was a consequence of temperature rise. Sun and Ma [48] also suggested that increasing drought over the Loess Plateau in China is occurring because of the combined effects of a significant increase in average temperature and an insignificant decrease in precipitation.
This paper suggests an obvious decreasing trend of annual SPEI in Xinjiang for 1961–2015. Furthermore, aggravated droughts occurred frequently after 1997, and the frequency of drought increased manyfold after the change, along with a temperature rise (1.1 °C) in Xinjiang [49]. This result is coherent with significant decreases in vegetation NDVI and soil moisture loss in Xinjiang after 1997 [19]. Li et al. [26] also found a drying trend over central Asia during the past decade (2004–2014).
Spatially, the increase in droughts occurred primarily in the southern and eastern parts of Xinjiang, where moderate and extreme drought occurrences have become more frequent during the last two decades. Conversely, northwestern Xinjiang and the Pamir Plateau revealed wetting trends. The EOF mode for annual SPEI exhibited coherent drought conditions from 1961 to 2015. The drought pattern showed a coherent distribution as well as spatial differences, which can be divided into a north–south antiphase distribution and an east–west antiphase distribution. Northern Xinjiang has become wetter, and southern Xinjiang has become drier, which is consistent with preliminary results for climatic transition in northwestern China [17,20,21].
Large-scale ocean–atmospheric circulation patterns can establish favorable conditions for drought, which can be induced by SST anomalies. In this study, the relationship between drought variability and SST anomalies shows that annual SPEI is closely related with AMO and ENSO events. AMO+ (AMO−) corresponded to a dry (normal) period in Xinjiang, particularly after 1997. McCabe et al. [50] also found that AMO+ (AMO−) was related to increased drought in the north-central and southwestern United States and decreased drought across Florida.
ENSO is the common cause of global precipitation variability and has a large effect on episodic drought [35]. During a warm phase (El Niño), major droughts occurred over Australia, Indonesia, Southeast Asia, parts of Africa, and northeastern Brazil [51]. Benitez and Domecq [52] suggested a strong coincidence between drought occurrence and La Niña events in Paraguay. Barlow et al. [53] also suggested ENSO as a major source of summer droughts in the United States. Mo et al. [54] confirmed that cold ENSO events favor drought over the United States. In this study, the drought EOF2 pattern interacted with ENSO, which can be taken to indicate that drought epochs in northern Xinjiang occurred because of the positive SST anomaly of Niño3.4 (El Niño conditions) during 1997–2015 with delayed effects. However, not all El Niño and La Niña events are responsible for drought events in northern Xinjiang, and other drivers remain to be discovered. Unfortunately, fewer droughts occurred globally under La Niña conditions [51].
However, this study has certain limitations. SPEI is coupled with climatic water supply (P) and demand (PET), which makes SPEI sensitive to changes in PET. The PET calculated by the Thornthwaite model can exaggerate drought severity because it overestimates the impact of temperature rise. In addition, the role of natural variability, especially ENSO, was found to correspond to wetter conditions instead of drought. This study neglected the possible detailed AMO and ENSO mechanisms linking drought variability with large-scale patterns. Mo et al. [54] confirmed that AMO modulates and amplifies the impact of ENSO on drought over the United States. Therefore, further studies are needed to combine the impacts of large-scale atmospheric circulation on drought variability in Xinjiang, China.
5. Conclusions
This study used the SPEI drought indices to assess the spatiotemporal patterns of drought in Xinjiang (northwestern China) from 1961 to 2015. The results are as follows:
(1) For the entire Xinjiang region, droughts tended to be aggravated, with a significant change point in 1997, after which the frequency of drought increased sharply. Spatially, the increase in drought occurred largely in southern and eastern Xinjiang, where occurrences of moderate and extreme drought have become more frequent during the last two decades, whereas northwestern Xinjiang and the Pamir Plateau showed wetting trends.
(2) EOF was used to detect the spatiotemporal patterns of SPEI in Xinjiang, China. Drought patterns in Xinjiang showed a north–south antiphase and an east–west antiphase distribution. These distributions are mainly affected by topography and atmospheric circulation, reflecting the different climate conditions in the northern and southern parts of Xinjiang.
(3) The relationship between drought variability and SST anomalies showed that the annual SPEI over Xinjiang was closely related to AMO and ENSO events. The positive (negative) phase of the AMO was related to increased (decreased) drought in Xinjiang, particularly after 1997. During a warm phase (El Niño), major droughts occurred over northern Xinjiang, but they lagged by 12 months. However, not all ENSO events were responsible for drought events in northern Xinjiang during this period, and other drivers remain to be identified.
Author Contributions
Conceptualization, J.Y. and W.H. (Wen Huo); methodology, T.D.; formal analysis, J.Y.; investigation and resources, W.H. (Wenfeng Hu); writing—original draft preparation, J.Y. and J.C.; writing—review and editing, J.Y. and T.D.
Funding
This research was funded by the National Key Research and Development Program of China (2018YFC1507101), the National Natural Science Foundation of China (grant numbers: 41605067, 41875102), the Open Fund of the State Key Laboratory of Desert and Oasis Ecology, Xinjiang Institute of Ecology and Geography, CAS (G2018-02-02), Basic Research Operating Expenses of the Central Level Non-Profit Research Institutes (grant number: IDM201506), and the China Postdoctoral Science Foundation (grant number: 2016M592915XB). The author, Junqiang Yao, gives thanks for financial support from the “Tianshan Youth Talents (Xinjiang)” Plan Project (2017Q092).
Acknowledgments
Meteorological data over China in this study were provided by the China Meteorological Data Service Center (http://data.cma.cn/). Monthly AMO and El Niño (La Niña) data were obtained from the China National Climate Centre (http://cmdp.ncc.cma.gov.cn/cn/ download.htm).
Conflicts of Interest
The authors declare no conflict of interest.
Appendix A

Figure A1.
Scale plot of annual eigenvalues versus eigenvector number for annual SPEI: (a) 1961–2015; (b) 1997–2015.
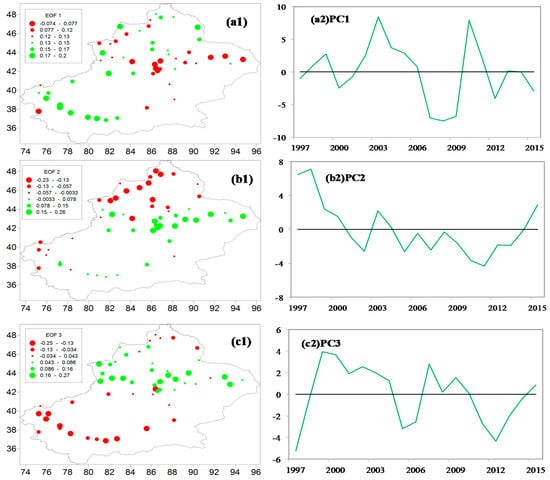
Figure A2.
First three loading vectors and their corresponding PCs series for 1997–2015: (a1–c1) EOF analysis for annual SPEI; (a2–c2) corresponding PCs for annual SPEI.

Figure A3.
(a) Spatial distribution of the cumulative SPEI value and the intensity; (b) percentage of stations affected from May 2008 to December 2009.
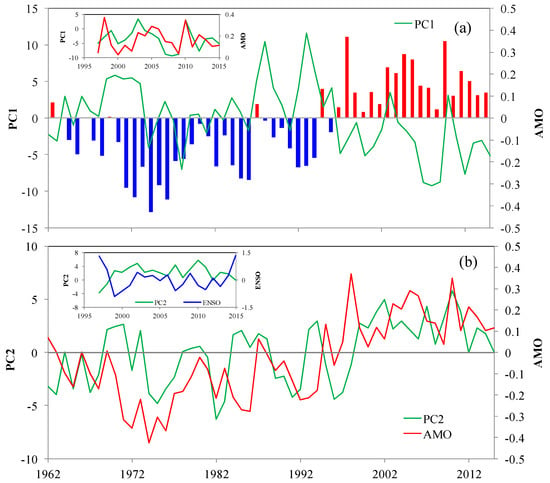
Figure A4.
(a) Temporal variation of AMO and PC1 during 1961–2015, where the red histogram represents the positive phase of AMO (AMO+) and the blue histogram represents the negative phase (AMO−); (b) temporal variation of the AMO and PC2 during 1961–2015.
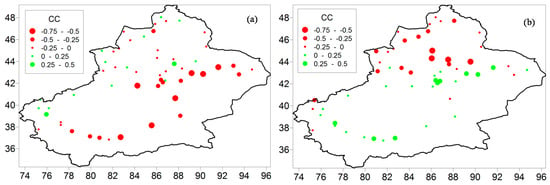
Figure A5.
Spatial distribution of the correlation coefficient (CC) between (a) AMO and SPEI for 1961–2015 and (b) between ENSO and SPEI during 1997–2015.
References
- Vicente-Serrano, S.M.; Beguería, S.; López-Moreno, J.I. A multiscalar drought index sensitive to global warming: The standardized precipitation evapotranspiration index. J. Clim. 2010, 23, 1696–1718. [Google Scholar] [CrossRef]
- Vicente-Serrano, S.M.; Beguería, S.; López-Moreno, J.I.; Angulo, M.; El Kenawy, A. A new global 0.5 gridded dataset (1901–2006) of a multiscalar drought index: Comparison with current drought index datasets based on the Palmer Drought Severity Index. J. Hydrometeorol. 2010, 11, 1033–1043. [Google Scholar] [CrossRef]
- Gouveia, C.M.; Trigo, R.M.; Beguería, S.; Vicente-Serrano, S.M. Drought impacts on vegetation activity in the Mediterranean region: An assessment using remote sensing data and multi-scale drought indicators. Glob. Planet. Chang. 2017, 151, 15–27. [Google Scholar] [CrossRef]
- Verdon-Kidd, D.C.; Scanlon, B.R.; Ren, T.; Fernando, D.N. A comparative study of historical droughts over Texas, USA and Murray-Darling Basin, Australia: Factors influencing initialization and cessation. Glob. Planet. Chang. 2017, 149, 123–138. [Google Scholar] [CrossRef]
- Spinoni, J.; Naumann, G.; Vogt, J.; Barbosa, P. European drought climatologies and trends based on a multi-indicator approach. Glob. Planet. Chang. 2015, 127, 50–57. [Google Scholar] [CrossRef]
- Mishra, A.K.; Singh, V.P. A review of drought concepts. J. Hydrol. 2010, 391, 204–216. [Google Scholar] [CrossRef]
- Zhang, L.; Zhou, T. Drought over East Asia: A review. J. Clim. 2015, 28, 3375–3399. [Google Scholar] [CrossRef]
- Dai, A.G. Drought under global warming: A review. Wiley Interdiscip. Rev. Clim. Chang. 2011, 2, 45–65. [Google Scholar] [CrossRef]
- Vicente-Serrano, S.M.; Lopez-Moreno, J.I.; Beguería, S.; Lorenzo-Lacruz, J.; Sanchez-Lorenzo, A.; García-Ruiz, J.M.; Azorin-Molina, C.; Morán-Tejeda, E.; Revuelto, J.; Trigo, R.M.; et al. Evidence of increasing drought severity caused by temperature rise in southern Europe. Environ. Res. Lett. 2014, 9, 044001. [Google Scholar] [CrossRef]
- Beguería, S.; Vicente-Serrano, S.M.; Reig, F.; Latorre, B. Standardized Precipitation Evapotranspiration Index (SPEI) revisited: Parameter fitting, evapotranspiration models, kernel weighting, tools, datasets and drought monitoring. Int. J. Clim. 2014, 34, 3001–3023. [Google Scholar] [CrossRef]
- Tao, H.; Borth, H.; Fraedrich, K.; Su, B.; Zhu, X. Drought and wetness variability in the Tarim River Basin and connection to large-scale atmospheric circulation. Int. J. Climatol. 2014, 34, 2678–2684. [Google Scholar] [CrossRef]
- Stagge, J.H.; Kingston, D.G.; Tallaksen, L.M.; Hannah, D.M. Observed drought indices show increasing divergence across Europe. Sci. Rep. 2017, 7, 14045. [Google Scholar] [CrossRef] [PubMed]
- Ji, F.; Wu, Z.H.; Huang, J.P.; Chassignet, E.P. Evolution of land surface air temperature trend. Nat. Clim. Chang. 2014, 4, 462–466. [Google Scholar] [CrossRef]
- Zhao, Y.; Zhang, H. Impacts of SST Warming in tropical Indian Ocean on CMIP5 model-projected summer rainfall changes over Central Asia. Clim. Dyn. 2016, 46, 3223–3238. [Google Scholar] [CrossRef]
- Chen, F.; Wang, J.; Jin, L.; Zhang, Q.; Li, J.; Chen, J. Rapid warming in mid-latitude central Asia for the past 100 years. Front. Earth Sci. China 2009, 3, 42–50. [Google Scholar] [CrossRef]
- Li, Z.; Chen, Y.N.; Li, W.; Deng, H.; Fang, G. Potential impacts of climate change on vegetation dynamics in Central Asia. J. Geophys. Res. Atmos. 2015, 120, 12345–12356. [Google Scholar] [CrossRef]
- Shi, Y.; Shen, Y.; Kang, E.; Li, D.; Ding, Y.; Zhang, G.; Hu, R. Recent and future climate change in northwest China. Clim. Chang. 2007, 80, 379–393. [Google Scholar] [CrossRef]
- Li, Z.; Chen, Y.; Shen, Y.; Liu, Y.; Zhang, S. Analysis of changing pan evaporation in the arid region of Northwest China. Water Resour. Res. 2013, 49, 2205–2212. [Google Scholar] [CrossRef]
- Yao, J.Q.; Chen, Y.N.; Zhao, Y.; Mao, W.; Xu, Z.; Liu, Y.; Yang, Q. Response of vegetation NDVI to climatic extremes in the arid region of Central Asia: A case study in Xinjiang, China. Theor. Appl. Climatol. 2017. [Google Scholar] [CrossRef]
- Chen, Y.N.; Li, Z.; Fan, Y.; Wang, H.; Deng, H. Progress and prospects of climate change impacts on hydrology in the arid region of northwest China. Environ. Res. 2015, 139, 11–19. [Google Scholar] [CrossRef] [PubMed]
- Fang, S.; Yan, J.; Che, M.; Zhu, Y.; Liu, Z.; Pei, H.; Zhang, H.; Xu, G.; Lin, X. Climate change and the ecological responses in Xinjiang, China: Model simulations and data analyses. Quat. Int. 2013, 311, 108–116. [Google Scholar] [CrossRef]
- Dai, A.G. Characteristics and trends in various forms of the Palmer Drought Severity Index during 1900–2008. J. Geophys. Res. 2011, 116, D12115. [Google Scholar] [CrossRef]
- Huang, J.; Yu, H.; Guan, X.; Wang, G.; Guo, R. Accelerated dryland expansion under climate change. Nature Climate Change. Nat. Clim. Chang. 2016, 6, 166–171. [Google Scholar] [CrossRef]
- Li, Z.; Chen, Y.N.; Fang, G.H.; Li, Y.P. Multivariate assessment and attribution of droughts in Central Asia. Sci. Rep. 2017, 7, 1316. [Google Scholar] [CrossRef] [PubMed]
- Wang, H.; Chen, Y.; Pan, Y. Characteristics of drought in the arid region of northwestern China. Clim. Res. 2015, 62, 99–113. [Google Scholar] [CrossRef]
- Li, Y.; Yao, N.; Sahin, S.; Appels, W.M. Spatiotemporal variability of four precipitation-based drought indices in Xinjiang, China. Theor. Appl. Climatol. 2017, 129, 1017–1034. [Google Scholar] [CrossRef]
- Zhang, Q.; Li, J.; Singh, V.P.; Bai, Y. SPI-based evaluation of drought events in Xinjiang, China. Nat. Hazards 2012, 64, 481–492. [Google Scholar] [CrossRef]
- Mahmood, R.; Lin, L.S.; Khan, B. Causes of recurring drought patterns in Xinjiang, China. J. Arid Land 2010, 2, 279–285. [Google Scholar]
- Li, Y.; Chen, C.; Sun, C. Drought severity and change in Xinjiang, China, over 1961–2013. Hydrol. Res. 2017, 48, 1343–1362. [Google Scholar] [CrossRef]
- Deng, H.; Chen, Y.; Shi, X.; Li, W.; Wang, H.; Zhang, S.; Fang, G. Dynamics of temperature and precipitation extremes and their spatial variation in the arid region of northwest China. Atmos. Res. 2014, 138, 346–355. [Google Scholar] [CrossRef]
- Vicente-Serrano, S.M.; Van der Schrier, G.; Beguería, S.; Azorin-Molina, C.; Lopez-Moreno, J.I. Contribution of precipitation and reference evapotranspiration to drought indices under different climates. J. Hydrol. 2015, 526, 42–54. [Google Scholar] [CrossRef]
- Huang, W.; Chen, J.H.; Zhang, X.J.; Feng, S.; Chen, F. Definition of the core zone of the “westerlies-dominated climatic regime”, and its controlling factors during the instrumental period. Sci. China Earth Sci. 2015, 58, 676–684. [Google Scholar] [CrossRef]
- Enfield, D.B.; Mestas-Nunez, A.M.; Trimble, P.J. The Atlantic multidecadal oscillation and its relation to rainfall and river flows in the continental U.S. Geophys. Res. Lett. 2001, 28, 2077–2080. [Google Scholar] [CrossRef]
- Knight, J.R.; Allan, R.J.; Folland, C.K.; Vellinga, M.; Mann, M.E. A signature of persistent natural thermohaline circulation cycles in observed climate. Geophys. Res. Lett. 2005, 32, L20708. [Google Scholar] [CrossRef]
- Dai, A.; Trenberth, K.E.; Karl, T.R. Global variations in droughts and wet spells 1900–1995. Geophys. Res. Lett. 1998, 25, 3367–3370. [Google Scholar] [CrossRef]
- Wang, H.; Chen, Y.; Pan, Y.; Li, W. Spatial and temporal variability of drought in the arid region of China and its relationships to teleconnection indices. J. Hydrol. 2015, 523, 283–296. [Google Scholar] [CrossRef]
- Mann, H.B. Non-parametric tests against trend. Econometrica 1945, 13, 245–259. [Google Scholar] [CrossRef]
- Kendall, M.G. Rank-Correlation Measures; Charles Griffin: London, UK, 1975. [Google Scholar]
- North, G.R.; Bell, T.L.; Cahalan, R.F.; Moeng, F.J. Sampling errors in the estimation of empirical orthogonal functions. Mon. Weather Rev. 1982, 110, 699–706. [Google Scholar] [CrossRef]
- Cao, Y.P.; Nan, Z.T.; Cheng, G.D. GRACE gravity satellite observations of terrestrial water storage changes for drought characterization in the arid land of northwestern China. Remote Sens. 2015, 7, 1021–1047. [Google Scholar] [CrossRef]
- CMA. Atlas of Meteorological Drought in China; China Meteorological Press: Beijing, China, 2010; pp. 50–108. (In Chinese) [Google Scholar]
- Schlesinger, M.E.; Ramankutty, N. An oscillation in the global climate system of period 65–70 years. Nature 1994, 367, 723–726. [Google Scholar] [CrossRef]
- Minobe, S. A 50–70 year climatic oscillation over the North Pacific and North America. Geophys. Res. Lett. 1997, 24, 683–686. [Google Scholar] [CrossRef]
- Qian, C.; Zhou, T. Multidecadal Variability of North China Aridity and Its Relationship to PDO during 1900–2010. J. Clim. 2014, 27, 1210–1222. [Google Scholar] [CrossRef]
- Enomoto, T.; Hoskins, B.J.; Matsuda, Y. The formation mechanism of the Bonin high in August. Q. J. R. Meteorol. Soc. 2003, 129, 157–178. [Google Scholar] [CrossRef]
- Ding, Q.H.; Wang, B. Circumglobal teleconnection in the Northern Hemisphere summer. J. Clim. 2005, 18, 3483–3505. [Google Scholar] [CrossRef]
- Yao, J.Q.; Yang, Q.; Mao, W.; Zhao, Y.; Xu, X. Precipitation trend–Elevation relationship in arid regions of the China. Glob. Planet. Chang. 2016. [Google Scholar] [CrossRef]
- Sun, C.; Ma, Y. Effects of non-linear temperature and precipitation trends on Loess Plateau droughts. Quat. Int. 2015, 372, 175–179. [Google Scholar] [CrossRef]
- Yao, J.Q.; Zhao, Y.; Chen, Y.N.; Yu, X.J.; Zhang, R.B. Multi-scale assessments of droughts: A case study in Xinjiang, China. Sci. Total Environ. 2018. [Google Scholar] [CrossRef]
- McCabe, G.J.; Palecki, M.A.; Betancount, J.L. Pacific and Atlantic Ocean influences on multi-decadal drought frequency in the United States. Proc. Natl. Acad. Sci. USA 2004, 101, 4136–4141. [Google Scholar] [CrossRef]
- Trenberth, K.E.; Dai, A.; van der Schrier, G.; Jones, P.D.; Barichivich, J.; Briffa, K.R.; Sheffield, J. Global warming and changes in drought. Nat. Clim. Chang. 2014, 4, 17–22. [Google Scholar] [CrossRef]
- Benitez, J.B.; Domecq, R.M. Analysis of meteorological drought episodes in Paraguay. Clim. Chang. 2014, 127, 15–25. [Google Scholar] [CrossRef]
- Barlow, M.; Nigam, S.; Berbery, E.H. ENSO, Pacific decadal variability, and the U.S. summertime precipitation, drought, and streamflow. J. Clim. 2001, 14, 2105–2128. [Google Scholar] [CrossRef]
- Mo, K.C.; Schemm, J.K.E.; Yoo, S.H. Influence of ENSO and the Atlantic multidecadal oscillation on drought over the United States. J. Clim. 2009, 22, 5962–5982. [Google Scholar] [CrossRef]
© 2019 by the authors. Licensee MDPI, Basel, Switzerland. This article is an open access article distributed under the terms and conditions of the Creative Commons Attribution (CC BY) license (http://creativecommons.org/licenses/by/4.0/).