Abstract
The effects of urbanization over eastern China on the East Asian summer monsoon (EASM) under different sea surface temperature background are compared using a Community Atmosphere Model (CAM5.1). Experiments of urbanization investigated by comparing two climate simulations with and without urban land cover under both positive and negative phases of Pacific Decadal Oscillation (PDO) show the spatial distribution of precipitation with ‘southern flood and northern drought’ and weakening status of EASM. The climate effect of urbanization in eastern China is significantly different from north to south. Anomalous vertical ascending motion due to the role of urbanization in the south of 30° N have induced an increase in convective available potential energy (CAPE) and precipitation increase over southern China. At the same time, the downward vertical motion occurs in the north of 30° N which cause warming over northern China. Due to the anti-cyclonic anomalies in the upper and lower layers of the north, the monsoon circulation is weakened which can reduce the precipitation. However, urbanization impact under various phases of PDO show different effect. In the 1956–1970 urbanization experiments of negative PDO phase, the downward vertical motion and anti-cyclonic anomalies in the north of 30° N are also weaker than that of positive phase of PDO in 1982–1996. In terms of this situation, the urbanization experiments of negative phase of PDO reveal that the range of the warming area over the north of 40° N is small, and the warming intensity is weak, but the precipitation change is more obvious compared with the background of positive phase of PDO.
1. Introduction
East Asia is located in the eastern side of Eurasia and along the Pacific coast which causes a unique climate feature, i.e., the East Asian monsoon. The formation the East Asian monsoon is the result of forcing from annual changes in sunshine, large-scale sea-land thermal differences, and topographical forces. Among these factors, the large-scale sea-land thermal difference is the main driving force of the East Asian monsoon [1].
A large number of observation cases show that the East Asian summer monsoon (EASM) and China’s summer precipitation have significant interdecadal variations, the most significant of which is the attenuation in the late 1970s [2,3]. With the weakening of EASM circulation, the spatial distribution changes of summer precipitation in eastern China occurred in the mid and late 1970s. Precipitation increased in the middle and lower reaches of the Yangtze River, while precipitation in northern China and southern China decreased. The simulation results of Li, et al. [4] showed that the warming of the Middle East Pacific in the Pacific Decadal Oscillation (PDO) positive phase from the late 1970s to the 1990s was an important reason for the weakening of EASM circulation and its corresponding ‘southern flood and northern drought’. Zhu, et al. [5] pointed out that the spatial distribution of summer precipitation in eastern China changed significantly after 2000, precipitation in the Yangtze River Basin decreased, and precipitation in central northern China increased. Zhu, Yali, Wang, Huijun, Zhou, Wen, Ma and Jiehua [5] also pointed out that the PDO was in a negative phase after 2000, which caused the warming of Lake Baikal and the weakening of the westerly jet, and further affected precipitation in eastern China. There are many opinions on the causes of the interdecadal variations of EASM. Numerical model and reanalysis data indicate that PDO transitioned from a cold to a warm phase from the late 1970s to 2000, with warming on the equatorial surface (especially the equatorial Middle East Pacific) and cooling in the mid-latitude North Pacific. This reduces the sea-land thermal contrast in the Asian summer monsoon region, largely explaining the reasons for the weakening of EASM found in the observations [4,5]. Above all, there is a clear relationship between PDO and precipitation in summer over East Asia [2,5,6,7].
China has the fastest growing economy in the world and is in the process of rapid urbanization [8]. Since the reform and opening-up, China has formed three major urban agglomerations: Beijing-Tianjin-Hebei, Yangtze River Delta, and Pearl River Delta [9]. The rapid development of urban agglomerations not only affects people’s economic and political life, but also has an important impact on climate. Chen and Ye [10] found that large-scale urbanization would lead to a significant increase of surface temperature in winter over most parts of eastern China. Shao, et al. [11] showed that urbanization in eastern China would enhance the strength of EASM. Feng, et al. [12] pointed out that urbanization would strengthen the intensity of EASM after analyzing the summer monsoon index based on regional model. Therefore, the large-scale urbanization over eastern China can affect the adjustment of land surface energy, and may even cause the change of EASM circulation.
An array of studies has focused on the impact of urbanization on EASM over eastern China [12,13]. However, the simulation results are still uncertain, and some natural variability (such as PDO) cannot be ruled out. The aim of this study is to use Community Atmosphere Model (CAM5.1) to reveal the urbanization impact on EASM under various phases of PDO.
The structure of the paper is arranged as follows. Model, experiment design, analysis methods, and data are described in Section 2. In Section 3 the results of climatic effects of China large-scale urbanization on EASM under different phases PDO are provided. Finally, Section 4 presents the conclusions.
2. Model, Experiment Design, Analysis Methods, and Data
2.1. Numerical Model
Community Atmosphere Model Version 5.1 (CAM5.1) is a global atmospheric model constructed by US Center for Atmospheric Research (NCAR). It is one of the main modules of Community Earth System Model (CESM) and can operate independently or in a coupled Earth system model as part of CESM. When CAM is operated independently, atmospheric model is coupled with land surface mode (CLM), thermodynamic sea ice mode (CICE), and data ocean mode (DOCN), and ocean and sea ice data are used as boundary conditions for the model to be provided by observational data [14]. CAM5.1 has made substantial progress in the description of physical processes than the old version, especially the combination of physical parameterization processes. The parameterization scheme includes the interaction of cloud droplet aerosol and cloud, which can simulate the precipitation process. The amount of precipitation is controlled by the size of the aerosol particles and describes the radiation effects of the droplets in more detail [15]. The land model CLM4 in CAM5.1 contains urban modules [16]. The main parameters include: the spatial extent of city, the morphological characteristics of city, the thermal and radiative characteristics of building materials, and the related processes of urban canopy which are described in detail. The global city types datasets required for the model are the default setting and are from Jackson, et al. [17] based on inversions from LandScan 2004. It is worth mentioning that in this database, urban types are divided into four categories: high building areas, high density areas, medium density areas, and low-density areas. Also, anthropogenic heating related to urban land surface has been considered in Community Land Model Urban (CLMU) which means that the urban impact in this study includes the effect of anthropogenic heating.
2.2. Experiment Design
Many studies have shown that PDO can affect the summer precipitation in East Asia by modulating EASM circulation system [2,5,7]. Therefore, in order to investigate the climate response of urban surface changes under different PDO phases, we used observational monthly sea surface temperature (SST) and sea ice concentration for the ocean boundary condition in the simulations [14]. In the experiment, we run CAM5.1 model with the period of 1977–1996 and 1951–1970 to get the positive and negative phase of PDO, respectively. Also, in order to study the urbanization effect of eastern China on EASM, we designed two sets of experiments with urban changes under different PDO phases (Figure 1).
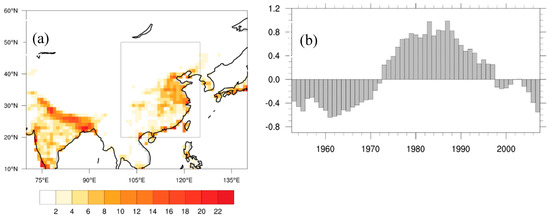
Figure 1.
(a) Percentage distribution of urban land-cover fraction in control runs of CAM5.1 model (unit: %). The black rectangle shows the major urban agglomeration over eastern China. The urban land cover were removed in experiments of NoU_P and NoU_N; (b) The meta data of PDO index derived as the leading principle component (PC) of monthly SST [14] anomalies in the North Pacific Ocean, poleward of 20° N. The monthly mean global average SST anomalies were removed to separate this pattern of variability from any “global warming” signal that may be present in the data. Here shows the JJA (June, July, and August) average which is the result of 15-year running mean.
As shown in Table 1, two sets of sensitivity experiments were designed using CAM model with resolution of 0.9 × 1.25. CTL_N and NoU_N experiments used the SST (1951–1970) of PDO negative phase to force model, whereas CTL_P and NoU_P experiment used the SST (1977–1996) of PDO positive phase to force model. Each set of experiments was integrated for 20 years, and only the results of the last 15 years of summer (from June to August) were analyzed. The experimental parameters of the two groups were the same except for the SST. The CTL_N and CTL_P experiments kept the default land cover data (Figure 1a), while in the NoU_N and NoU_P experiments, all conditions were the same as CTL_N and CTL_P, except in eastern China (the black rectangle in Figure 1: 20–50° N, 100–125° E), where urban land cover per grid unit was substituted by the dominant land cover type. To examine the possible impact of urbanization, differences of major climate variables between CTL_P and NoU_P (CTL_N and NoU_N) were evaluated.

Table 1.
Design of experiments. The land cover of CTL_P and CTL_N were the current surface in the CAM5.1 model, urban surface was removed in the experiment of NoU_P and NoU_N. Changes were made only in the domain of 20–50° N, 100–125° E.
2.3. Analysis Methods
Some studies designed a series of indexes to measure the strength of EASM. Wang, et al. [18] found the index of shear vorticity from Wang and Fan [19] is best correlated with the leading principle component (PC) of EASM multivariate Empirical Orthogonal Function (EOF) analysis on a set of six meteorological fields (the correlation coefficient is −0.97). Therefore, we adopt the negative of the Wang and Fan [19] index (WFN).
Baroclinic instability is measured by the Eady growth rate () [20] with units in s−1
where N is the Brunt frequency [21]
where
and
where f is the coriolis parameter, v is the horizontal wind speed, z is the height, g is the gravitational acceleration, is the dry adiabatic lapse rate, is the virtual temperature, is the air temperature, is the water vapor mixing ratio, and is the specific humidity. The Eady growth rate is computed between 850 and 700 hPa, and is then averaged for the months June to August.
2.4. Data Description
The monthly 2-m air temperature and precipitation data was derived from NCEP-NCAR Reanalysis Version 1 with a spatial resolution of 1.9° × 1.9° and 2.5° × 2.5°, respectively, which are available on http://www.esrl.noaa.gov/psd/data/gridded/data.ncep.reanalysis.derived.html. The circulation data was also derived from NCEP-NCAR Reanalysis datasets. The variables included the u and v components of wind at 17 pressure levels from 1000 to 100 hPa, with a spatial resolution of 1.2° × 2.5°.
3. Experiment Results
3.1. Evaluation of Simulations
To evaluate the performance of CAM5.1 on the simulation of East Asian climate, the results of the CTL_N and CTL_P experiments were compared with the observations (or reanalysis data) to assess CAM5.1 model on the simulation ability of climate over East Asia region.
Figure 2 shows Taylor assessment chart on 2-m air temperature, precipitation, meridional, and zonal circulation on 850 hPa over 20–60° N, 110–140° E. For CTL_N, it can be seen that the simulation of the surface air temperature is closest to the observation compared with other variables. The spatial correlation coefficient of temperature is 0.96 and the normalized deviation is 0.80. Secondly, the low-level circulation on 850 hPa has a spatial correlation coefficient of 0.8–0.9. The simulation results of the model for precipitation show that the spatial correlation coefficient is 0.61. For CTL_P, the Taylor chart shows that the zonal wind on 850 hPa is more similar to observation compared with CTL_N by spatial correlation coefficient.
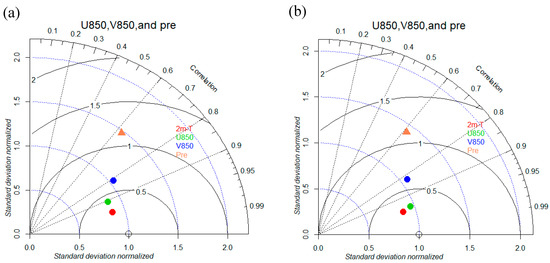
Figure 2.
Taylor assessment chart (model results and observations). (a) CTL_N; (b) CTL_P. The red dots represent the 2-m air temperature, green dots represent zonal wind in 850 hPa, blue dots represent meridional wind in 850 hPa, and orange dots represent precipitation. The domain for East Asia is 20–60° N, 110–140° E.
Figure 3 shows the spatial evaluation of temperature, precipitation, and low-level circulation between model and observations. For the temperature simulation, compared with reanalysis data, the CAM5.1 model can reproduce the character of spatial distribution during 1982–1996 (Figure 3a–c) and 1960–1970 (not shown) over East Asia. The biases between the model results and the observations (Figure 3c) show that the temperature biases from CAM5.1 model over most parts of eastern China are between 0 and 4 degrees Celsius.
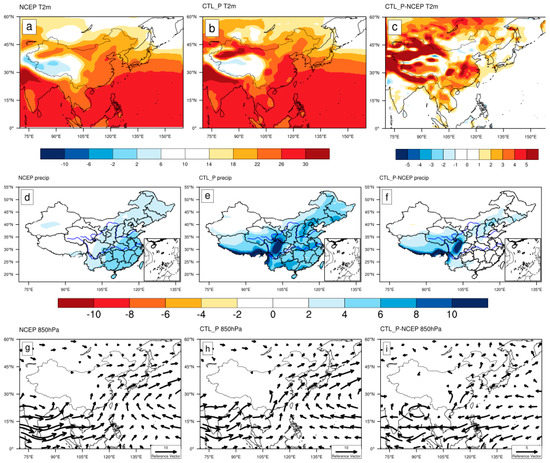
Figure 3.
Spatial evaluation between observation and CAM output over 1982–1996. (a,d,g), (b,e,h) represent the result of observation (model output) for temperature (units: °C), precipitation (units: mm/day), and low-level circulation (units: m/s). (a,d,g) were based on NCEP1 reanalysis data. (c,f,i) show the difference between CAM5.1 output and observation.
For the precipitation simulation, the CAM5.1 model can basically simulate the spatial distribution characteristics of precipitation in summer over East Asia (Figure 3e). In the area of northwestern China and the Yangtze River region, the simulation error is smaller compared with other region in East Asia, and the regional average error does not exceed 2 mm/d (both in CTL_N and CTL_P, Figure 3f).
For the simulation ability on circulation, the model can simulate the location and intensity of the low-level southwesterly circulation over southeast China and a strong anti-cyclone over west Pacific both in CTL_N (not shown) and CTL_P (Figure 3h). Compared with the observation data, the model results show stronger summer monsoon circulation which lead to a positive effect of precipitation increase in north-eastern China (Figure 3i). Also, the difference between the model and the observation shows that there is an anomalous cyclonic shear (near 25° N, 110° E) on the southern slope of the Qinghai–Tibet Plateau, which induces more precipitation in southwestern China. Overall, For the two periods studied in this paper, the CAM5.1 model can reproduce the basic characteristics of large-scale summer circulation as well as temperature and precipitation over East Asia.
3.2. Effects of PDO Phases on Large Scale Circulation
By comparison between CTL_P and CTL_N, the changes of EASM strength can be clearly displayed. Table 2 shows the different response of EASM to negative and positive phases of PDO. Some major climate index was calculated to reveal the difference. The difference of precipitation between CTL_N and CTL_P shows increase over south part of China. This shows the phenomenon of ‘southern flood and northern drought’ which is consistent with observation. The strength of meridional velocity on 850 hPa over eastern China weaken (decrease 0.23 m/s over northern China) under positive phase of PDO. Also, to measure the strength of EASM, the WFN was calculated index according to Formula 1. The difference between CTL_N and CTL_P is −1.59 which is statistically significant at the 10% level. This also reveal that the strength of EASM experienced an obvious decrease from the experiment of CTL_N to CTL_P.
Table 2.
Climate response of EASM-relevant quantities to different PDO phases. The differences were compared by the experiment between CTL_P and CTL_N which is related to SST of positive and negative phase. The quantities include precipitation (Pre), meridional wind of 850 hPa (V850), sea level pressure (SLP), vertical velocity on 500 hPa (), convective available potential energy (CAPE), and the Eady growth rate (Eady). Their differences between the experiments were averaged over Eastern China (EC, 20–45° N, 105–122° E), Northern China (NC,32.5–45° N, 105–122° E), and Southern China (20–32.5° N, 105–122° E). The numbers in boldface are statistically significant at the 10% level.
As shown in Table 2, The difference between CTL_P and CTL_N of the Eady growth rate shows a significant Eady negative (positive) area over North China which reveals a weakening (enhancing) of atmospheric baroclinicity over northern (southern) China. It is also found that convective available potential energy (CAPE) for CTL_P–CTL_N significantly increases over SC (increase by 1822.82 Jkg−1) which corresponds to enhanced moisture convergence in the lower troposphere south of 30° N and decreases over northern China which restrains convection activity. Therefore, there is a clear link between phases of PDO and EASM circulation: The positive phase of PDO usually relates to weak monsoon circulation and can lead to the precipitation distribution of ‘southern flood and northern drought’ compared with that of negative phase of PDO.
3.3. Changes of Urbanization Effect on Large-Scale Circulation Under Different PDO Phases
Due to the close relationship between PDO and EASM circulation, it is necessary to analyze the climate results of urbanization effects under different phases of PDO. Figure 4 shows the difference distribution of 2-m air temperature and precipitation in summer obtained from the experiments (CTL_P minus NoU_P and CTL_N minus NoU_N) with period 1982–1996 and 1956–1970. Under the background of different phases of PDO, the urbanization effect causes a significant increase of 2-m temperature in northern China by 0–1.5 °C, and the warming appears in the vast area north of 40° N (Figure 4a). However, the warming range of 1956–1970 urbanization experiments are significantly smaller than that of the 1982–1996, and the intensity is also weaker compared with 1982–1996. The warming in northern China is not obvious, and there is even a weak cooling (Figure 4b).
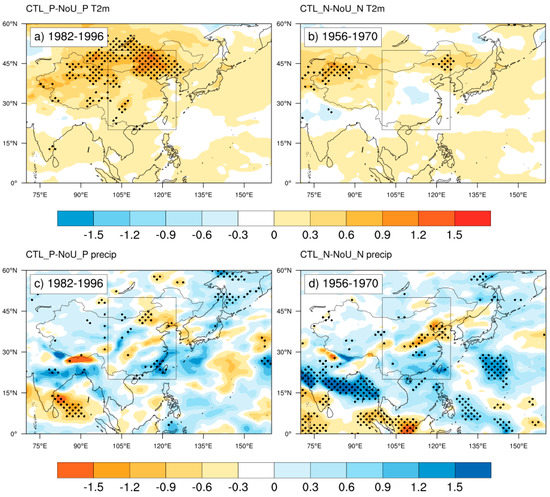
Figure 4.
The difference fields (CTL_P minus NoU_P and CTL_N minus NoU_N) for 2-m air-temperature (a,b; units: °C) and precipitation (c,d; units: mm/day). (a,b) use the SST of 1982–1996 (CTL_P minus NoU_P), and (c,d) use the SST of 1956–1970 (CTL_N minus NoU_N). The stippled area indicates above 90% confidence level, and relatively concentrated urban area is marked by the black rectangle.
As shown in Figure 4c,d, the difference of precipitation shows the spatial distribution of ‘southern flood and northern drought’, but the precipitation over southern China in 1956–1970 increase significantly which shows the larger rainy belt compared with the experiment of 1982–1996. Obviously, there are some differences in intensity and distribution for 2-m air temperature and precipitation between different periods, however, the two periods experiments show consistent characteristics: due to urbanization, significant warming will occur in northeastern China. Also, precipitation will increase in the south of the Yangtze River, and will decrease in the north of the Yangtze River.
3.4. Changes of Urbanization Effects on EASM Under Different PDO Phases
The changes on temperature and precipitation show different urbanization effects from various periods. In order to explain these differences, we compared the effects of urbanization on circulation between different PDO phases. Figure 5 shows the circulation difference at 850 hPa and 200 hPa because of urbanization during different periods. The results of different periods all show that the northerly airflow occurs in eastern China at 850 hPa (Figure 5a,b) which means EASM circulation has been weakened by urbanization effect. Meanwhile, anomalous cyclonic circulation occurs in the lower troposphere over southern China and the South China Sea, accompanied with the enhanced of low-level convergence. Anticyclonic circulation on upper layer of 200 hPa occurs over the northeastern China (Figure 5c,d), and the northerly and northeastern southerly winds are weakened, which reduces the water vapor transport to the high latitude and suppresses precipitation in the north. However, compared with the results of different periods of PDO, the 1982–1996 experiments simulated a very strong anticyclonic circulation over northern China and Mongolia. It is not a significant change and the geometrical center will move to 130° E in 1956–1970 experiments. The obvious anticyclonic circulation in 1982–1996 can induce the warm advection over northern China and Mongolia. In southern China, the anomalous cyclonic on 850 hPa of period 1956–1970 is located northward compared with that of period 1982–1996. Therefore, precipitation will get northward shift in the urbanization experiment of positive phase of PDO.
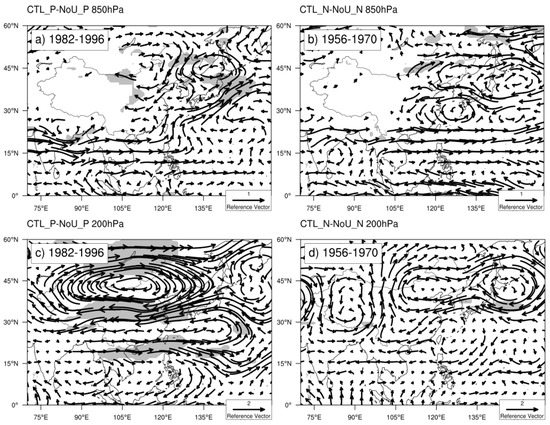
Figure 5.
Difference fields (CTL_P minus NoU_P and CTL_N minus NoU_N) of wind vectors on 850 hPa (a,b; units: m/s) and 200 hPa (c,d; units: m/s). (a,b) use the SST of 1982–1996, and (c,d) use the SST of 1956–1970. Above 90% confidence level of wind speed has been shaded.
For both two sets of experiments, the urban surface can reduce surface wind because of increased frictional drag which lead to the convergence near surface over SC (Figure 5a,b and Figure 6a,b). With the increased convergence over low-level troposphere in SC, the ascending motion occurs which increases more cloud amount (see total cloud increase over SC in Table 3). The release of latent heating from ascending motion heats the middle to upper layer of troposphere over SC, which can intensify the convergence near surface over SC (Figure 5a,b). These mechanisms also comply with the study from (Liu, et al. [22]), which means that the structure of diabatic heating can lead to the occurrence of cyclone on low layer and anticyclone on upper layer. Therefore, over SC region, the typical upward motion accompanied by convergence on low layer troposphere and divergence on upper troposphere will remain and cause downward motion over NC. The downward vertical structure suppresses the convective activity, resulting in a decrease of specific humidity (Q). In addition, the anomalous downward motion causes dry adiabatic heating to warm the atmosphere (Figure 6c,d). In the 1982–1996 experiment (Figure 6e), over the region between 20° and 30° N in eastern China, the low-level convergence is more obvious due to the increase of urban roughness which can cause cyclone anomalies in the lower layer of the region. As a result, more water vapor convergence occurs.
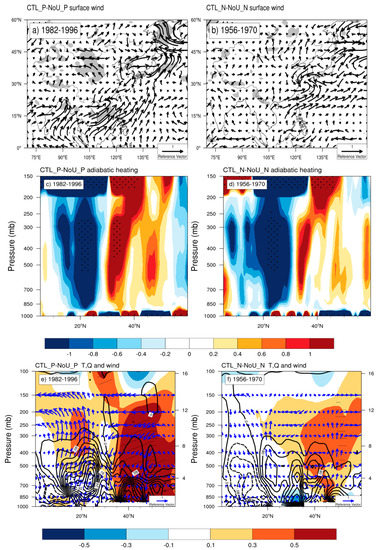
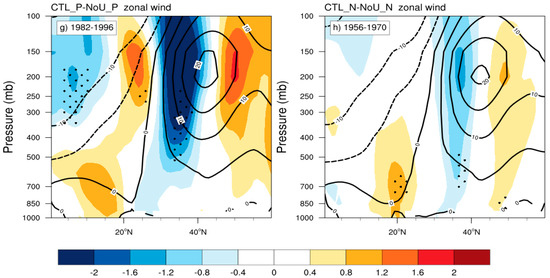
Figure 6.
Possible mechanism of urbanization impact on climate based on different PDO phases. Left column: 1982–1996; right column: 1956–1970. (a,b) show the surface wind of difference between CTL_P and NoU_P, and CTL_N and NoU_N, respectively. (c–h) show vertical-meridional cross-sections of the difference between CTL_P and NoU_P, and CTL_N and NoU_N, respectively. (c,d) show adiabatic heating of dry air (shading; K day−1). (e,f) show temperature (shading; °C), specific humidity (contour; g/kg) and vertical velocity (vector; revealed by (v, −ω), where v (m s−1) is meridional velocity and –ω (10−2 Pa s−1) represents vertical pressure velocity) averaged over 110°–122° E. (g,h) show the difference field between CTL and NOURBAN of zonal wind (shading; m/s) and climatological zonal wind which is averaged over 110°–122° E. Above 90% confidence level of wind speed has been shaded. The stippled area shows above 90% confidence level of adiabatic heating of dry air, ω, and zonal velocity. The slash lines show above 90% confidence level of temperature. The horizontal lines show above 90% confidence level of specific humidity.
Table 3.
Changes in EASM-relevant quantities that are influenced by urban land use: surface air temperature at 2-m (T2); precipitation (Pre); sensible (SH) and latent heat (LH) fluxes; total cloud; surface net radiation (Rnet); sea level pressure (SLP); vertical velocity on 500 hPa (); zonal wind on 200 hPa (U200); and convective available potential energy (CAPE). Their differences between the experiments were averaged over EC (20–45° N, 105–122° E), NC (32.5–45° N, 105–122° E), and SC (20–32.5° N, 105–122° E). The numbers in boldface are statistically significant at the 10% level.
For the 1956–1970 experiment (Figure 6f), although the changes of vertical motion are insignificant, an anomalous upward motion also occurs near 20° N, and an anomalous downward motion occur near 35° N. However, the 1982–1996 experiment shows stronger downward airflow in the north of the 35° N, and the warming response of the atmosphere is more obvious which can suppress precipitation in northern China. In addition, the occurrence of 200 hPa anomalous anticyclone in the two sets of experiments can cause southward shifting and weakening of EASM (especially in the experiment of 1982–1996). As shown in Figure 6g, East Asian subtropical jet (EASJ) shows a southward shift with the corresponding vertical motion change in urbanization experiment of positive PDO phase which induces a decrease in precipitation over 30–40° N of China, while there is no obvious change of EASJ position in urbanization experiment of negative PDO phase (Figure 6h)
In order to further compare the quantitative effects of urbanization at different sea surface temperatures on the main circulation systems in East Asia, this study gave a quantitative analysis. As shown in Table 3, the occurrence of anticyclones in the upper troposphere over central Mongolia enhances the warm advection north of 50° N by its southwestern airflow on the northwest side (see air temperature increase over NC in Table 3). Under the control of this kind of warm anticyclonic circulation, the amount of cloud in most parts of northern China and north-eastern China is reduced (not statistically significant at the 10% level), and the surface temperature in the north of East Asia 30° N also increases significantly. In addition, along with the downward airflow over northern China, there is an insignificant decrease of precipitation over northern China.
It is also found that CAPE for the experiments of positive and negative phases significantly decreases over northern China which corresponds to decreases of moisture convergence over NC and restrains convection activity. Overall, the urbanization in different PDO phases have similar effects on EASM: the urbanization can weaken the intensity of the monsoon circulation and enhance the phenomenon of ‘southern flood and northern drought’. However, the climatic effects of 1956–1970 urbanization experiment have a weaker impact on EASM circulation especially on the changes of northern China.
4. Conclusions
This study focusses on the climatic impact of large-scale urbanization under different phases of PDO using CAM 5.1. Firstly, there are some similarities of urbanization impact on EASM with different PDO phases. On the one hand, the urbanization frictional drag weakens the southwest wind flow in the lower troposphere over south-eastern China and can induce the convergence (divergence) increase over lower (upper) troposphere in southern China, which make the downward vertical motion occur in northern China. In northern China, the downward vertical motion leads to warming the middle and high layer of troposphere because of dry air adiabatic heating. The warm and stable status of troposphere can induce the occurrence of barotropic structure of high pressure which reduces the strength of EASM. Therefore, the urbanization can enhance the precipitation distribution of ‘southern flood and northern drought’.
However, the simulation of urbanization impact with various phases of PDO also reveals different climate response. The positive (negative) PDO phases relate to weak (strong) intensity of EASM circulation. For the urbanization experiments of negative PDO phase, the convergence area tends to move northward and locates near Yangtze River Delta compared with background of positive PDO phase, which pushes the increasing area of precipitation more northward. Also, because of strong background of EASM in negative PDO phase, the urbanization signal on climate system is weaker which can reveal on the response of surface energy adjustment and vertical structure.
Note that this study mainly focuses on the urbanization effect (especially the climatic effect of urban land cover change) over East Asia. There are also other factors related to urbanization (such as aerosol emissions) in eastern China can affect surface energy balance by radiative forcing which may also affect the East Asian monsoon system. We are studying on these, and will present these works in the future.
Author Contributions
Climate modelling, Y.L.; Formal analysis, Y.L.; Funding acquisition, P.X.; Methodology, Y.L. and P.X.; Resources, P.X.; Supervision, P.X.; Writing—Original draft, Y.L.; Writing—Review & editing, P.X.
Funding
This work was supported by the National Natural Science Foundation of China (grant no. 41671344 and 41871235).
Acknowledgments
We are grateful to the High-Performance Computing Center (HPCC) of Nanjing University for implementing the numerical calculations on its blade cluster system.
Conflicts of Interest
The authors declare no conflict of interest.
References
- Webster, P.J.; Magaña, V.O.; Palmer, T.N.; Shukla, J.; Tomas, R.A.; Yanai, M.; Yasunari, T. Monsoons: Processes, predictability, and the prospects for prediction. J. Geophys. Res. 1998, 103, 14451–14510. [Google Scholar] [CrossRef]
- Huijun, W. The weakening of the Asian monsoon circulation after the end of 1970’s. Adv. Atmos. Sci. 2001, 18, 376–386. [Google Scholar] [CrossRef]
- Si, D.; Ding, Y. Oceanic forcings of the interdecadal variability in East Asian summer rainfall. J. Clim. 2016, 29, 7633–7649. [Google Scholar] [CrossRef]
- Li, H.; Dai, A.; Zhou, T.; Lu, J. Responses of East Asian summer monsoon to historical SST and atmospheric forcing during 1950–2000. Clim. Dyn. 2008, 34, 501–514. [Google Scholar] [CrossRef]
- Zhu, Y.; Wang, H.; Zhou, W.; Ma, J. Recent changes in the summer precipitation pattern in East China and the background circulation. Clim. Dyn. 2010, 36, 1463–1473. [Google Scholar] [CrossRef]
- Yu, R.; Wang, B.; Zhou, T. Tropospheric cooling and summer monsoon weakening trend over East Asia. Geophys. Res. Lett. 2004, 31, 22212. [Google Scholar] [CrossRef]
- Ding, Y.; Wang, Z.; Sun, Y. Inter-decadal variation of the summer precipitation in East China and its association with decreasing Asian summer monsoon.Part I: Observed evidences. Int. J. Climatol. 2008, 28, 1139–1161. [Google Scholar] [CrossRef]
- Xun, L.I. The effects of economic growth on chinese urbanization: Panel data approach. Geogr. Res. 2005, 24, 421–431. [Google Scholar]
- Xiao, P.; Wang, X.; Feng, X.; Zhang, X.; Yang, Y. Detecting China’s Urban Expansion Over the Past Three Decades Using Nighttime Light Data. IEEE J. Sel. Top. Appl. Earth Obs. Remote Sens. 2014, 7, 4095–4106. [Google Scholar] [CrossRef]
- Chen, H.; Zhang, Y. Sensitivity experiments of impacts of large-scale urbanization in East China on East Asian winter monsoon. Chin. Sci. Bull. 2012, 58, 809–815. [Google Scholar] [CrossRef]
- Shao, H.; Song, J.; Ma, H. Sensitivity of the East Asian Summer Monsoon Circulation and Precipitation to an Idealized Large-Scale Urban Expansion. J. Meteorol. Soc. Jpn. Ser. II 2013, 91, 163–177. [Google Scholar] [CrossRef]
- Feng, J.-M.; Wang, Y.-L.; Ma, Z.-G. Long-term simulation of large-scale urbanization effect on the East Asian monsoon. Clim. Chang. 2013, 129, 511–523. [Google Scholar] [CrossRef]
- Chen, H.; Zhang, Y.; Yu, M.; Hua, W.; Sun, S.; Li, X.; Gao, C. Large-scale urbanization effects on eastern Asian summer monsoon circulation and climate. Clim. Dyn. 2015, 47, 117–136. [Google Scholar] [CrossRef]
- Hurrell, J.W.; Hack, J.J.; Shea, D.; Caron, J.M.; Rosinski, J. A New Sea Surface Temperature and Sea Ice Boundary Dataset for the Community Atmosphere Model. J. Clim. 2008, 21, 5145–5153. [Google Scholar] [CrossRef]
- Song, X.; Zhang, G.J.; Li, J.-L.F. Evaluation of Microphysics Parameterization for Convective Clouds in the NCAR Community Atmosphere Model CAM5. J. Clim. 2012, 25, 8568–8590. [Google Scholar] [CrossRef]
- Oleson, K.; Lawrence, D.M.; Bonan, G.B.; Flanner, M.G.; Kluzek, E. Technical description of an urban parameterization for the community land model. Ncar Tech. Note 2010, 15, 178. [Google Scholar]
- Jackson, T.L.; Feddema, J.J.; Oleson, K.W.; Bonan, G.B.; Bauer, J.T. Parameterization of Urban Characteristics for Global Climate Modeling. Ann. Assoc. Am. Geogr. 2010, 100, 848–865. [Google Scholar] [CrossRef]
- Wang, B.; Wu, Z.; Li, J.; Liu, J.; Chang, C.-P.; Ding, Y.; Wu, G. How to Measure the Strength of the East Asian Summer Monsoon. J. Clim. 2008, 21, 4449–4463. [Google Scholar] [CrossRef]
- Wang, B.; Fan, Z. Choice of South Asian Summer Monsoon Indices. Bull. Amer. Meteor. Soc. 1999, 80, 629–638. [Google Scholar] [CrossRef]
- Hoskins, B.J.; Valdes, P.J. On the existence of storm-tracks. J. Atmos. Sci. 1990, 47, 1854–1864. [Google Scholar] [CrossRef]
- Stull, R.B. Meteorology Today for Scientists and Engineers: A Technical Companion Book to Meteorology Today by C. Donald Ahrens; West Publishing Company: Minneapolis, MN, USA; St. Paul, MN, USA, 1995. [Google Scholar]
- Liu, J.; Xu, H.; Deng, J. Projections of East Asian summer monsoon change at global warming of 1.5 and 2 °C. Earth Syst. Dynam. 2018, 9, 427–439. [Google Scholar] [CrossRef]
© 2019 by the authors. Licensee MDPI, Basel, Switzerland. This article is an open access article distributed under the terms and conditions of the Creative Commons Attribution (CC BY) license (http://creativecommons.org/licenses/by/4.0/).