Article

Spatiotemporal Patterns and Evolution of Storm Surge Threats along the Southeastern Coastline of China

1
Key Laboratory of Land Surface Pattern and Simulation, Institute of Geographical Sciences and Natural Resources Research, Chinese Academy of Sciences, Beijing 100101, China
2
University of Chinese Academy of Sciences, Beijing 100049, China
*
Author to whom correspondence should be addressed.
Atmosphere 2019, 10(2), 61; https://doi.org/10.3390/atmos10020061
Submission received: 17 December 2018 / Revised: 23 January 2019 / Accepted: 26 January 2019 / Published: 1 February 2019
(This article belongs to the Special Issue Climate Change Impacts on Coastal Areas)

Abstract

:
The variability of storm surge poses a significant threat to coastal areas. A new metric named Accumulated Storm surge Potential Impact (ASPI) is proposed based on a new intensity parameter that removes other components from storm surge-induced water level rise. This new metric quantifies storm surge threat by combining frequency and intensity. The results show that storm surge threat has increased since the late 1990s due to greater general storm surges. The extreme storm surge threat did not follow the increasing trend until the mid-2000s. Different regional distribution patterns are found along this coast. The storm surge threat exhibited a -++ zonal tripole pattern, the negative phase was along the north coastline of Hangzhou Gulf and the positive phase was from the center to southern coast area of Zhejiang province and along the eastern coast area of Leizhou Peninsula. Long-term storm surge threats change spatial distribution pattern in three periods. More precarious threats from the center to southern coast areas of Zhejiang province illustrated a poleward shift of storm surge threats consistent with the trend of long-term tropical cyclone landfall. Meanwhile, the strong threat along the eastern coast line of Leizhou Peninsula was sustained from 1960 to 1995, then became weaker from 1996 to 2015. The evolution pattern of storm surge threat along the southeastern coastline of China could be applied for coastal adaptation research under climate change scenarios.

1. Introduction

Tropical cyclone (TC-induced storm surges have major social and economic impacts on the southeastern coast of China. Storm surges caused economic losses greater than 307 billion (RMB), 163 deaths, and affected approximately 13.4 million people from 1989 to 2017 [1]. The Chinese coastal area is one of the most vulnerable areas under climate change scenarios [2], and future storm surge risk is expected to increase by approximately 39.4% in China [3]. Theoretical, statistical and simulation research on storm surge threat has focused mostly on single parameter assessment, which substantially restricts the integration of results. In addition, the evolution of spatiotemporal patterns and trends of storm surge threat under global climate change remain unclear. Previous studies about the effect of climate change on storm surges remains to be investigated [4]. The long-term trend of storm surge threat could be an indicator of potential changes resulting from climate change [5]. Thus, an improved understanding of the evolution patterns and trends of storm surge threat is essential for coastal protection and development planning.
There are three parameters widely used in previous studies for assessing storm surge threat. The first is intensity, which usually uses an intensity index, such as maximum high water level [6], nontidal residual [7], or skew surge [8,9], to evaluate storm surge induced water level rise. These intensity indexes are extracted from sea level data [9,10,11,12,13,14] or simulated by hydrodynamic models [13,15,16]. The second is frequency, which records the number of storm surges of different intensities to assess the extent of storm surge activity at particular areas or tide-gauge stations [17]. The third is the return period, which is the probability of storm surge occurring at a particular intensity [13]. However, assessing storm surge threats in coastal areas depends not only on their intensity but also on their frequency. The single measurement of intensity, frequency, or return period alone results in insufficient temporal resolution and information on the evolution of storm surge threat patterns [7,18]. The lack of an appropriate method to combine frequency and intensity information to quantify storm surge threat is due to inconsistencies in annual data and the different dimensions of these two parameters. Therefore, the characteristics and trends of storm surge threat in the context of climate change are still not comprehensively evaluated. In addition, the uncertainties in intensity index calculation methods [10,16,19], length of recorded time series [20,21] and density of tide-gauge stations [6,18,22] may lead to inaccurate results for analyses of storm surge spatiotemporal evolution patterns.
The storm surge threat along coastal areas depends on where the TC center makes landfall, determined by the underlying dominant storm track across the North Pacific that directs storms to particular coastal locations. Thus, the spatial distribution of storm surge extremes along the northeastern Pacific coast is an important consideration in identifying changes in the spatial distribution of storm landfalls in this coastal region [5]. Based on the International Best Track Archive for Climate Stewardship (IBTrACS) [23] data set, the TC peak intensity exhibits a poleward migration and a reduced translation speed in the western North Pacific under global climate change [24,25,26]. The location of intense storm surges showed a poleward shift based on the tide-gauge observations, consistent with the TC trend [22]. Also, the warm climate would lead more frequent extreme storm surges [10,27]. Most studies of storm surges along the coast line of China have been focused on the return period or the extreme high sea level of storm surge at individual tide stations [20,21,22,28,29].
In the present work, we collected the highest density of tide-gauge station records available at this time along the coast line of China. Based on the observed tide data during the TC landfall period, we calculated a different intensity parameter, named the anomaly nontidal impact level, to represent the extent of storm surge impact. Meanwhile, a metric called Accumulated Storm surge Potential Impact (ASPI) is proposed based on anomaly nontidal impact level to investigate the long-term evolution of storm surge threat. ASPI considers both intensity and frequency of storm surge and thus is unbiased and more accurate than single parameter analysis. The metric used herein to represent storm surge threat is devised to provide a context for assessing future responses to climate change. The uniqueness of this work is the evolution of storm surge threat from 1960 to 2015. Because of the higher density of tide-gauge records in present work, the spatial distribution of storm surge threat exhibited similar characteristics with the former studies and showed some discrepancies on particular areas along the southeastern coast line of China. Policy and planning measures attempt to mitigate storm surge threat consequences through coastal planning and engineering [30]. Comprehensive analysis of the evolution of storm surge threat in the context of climate change can provide important information to emergency managers and policy makers.

2. Data and Methodology

In this paper, considering Western North Pacific TC prevail landfall tracks, we selected the study area as encompassed by 18°52′N and 34°45′N, 108°37′E and 121°43′E (include 56 national and 6 international tide-gauge stations) along southeastern coast line of China. This specific coast line is above 13,000 km, which is the most affected by TCs along the entire coast line of China, An average of eight TCs make landfall in this area each year (see Figure 2b, black dotted line).

2.1. Tide-Gauge Data and TC Best Tracks Dataset

Primary tide-gauge data were collected from the Annual Hydrological Report [31]. The national tide-gauge stations in the study area measured 4 tide records per day from 1960–1989 and 2002–2015. The above data only recorded the highest and the lowest tide level in one or two tide cycle. We filled the data gap with data of 6 standard international tide stations from the University of Hawaii Sea Level Center (UHSLC) records from 1990–2001 [32]. The data from UHSLC have 24 h data per day (we chose one highest tide level datum within a tidal cycle). In addition, we also collected records from academic publications, including books and journal articles, that generally provide long-term storm surge histories in our study area [33,34]. In the present study area, from north to south, the semidiurnal tide component is the dominant tide in the Yellow Sea and the East China Sea. Mixed diurnal tide dominates most of the coastline of the South China Sea. Diurnal tide component is only in the Beibu Gulf. In the present work, we extract the highest tide level from one tidal cycle during the days when a TC made landfall, and then, the same procedure was applied to the days before and after landfall day. Therefore, taking the TC landfall characteristics into consideration, the tide-gauge data used in this work contained the highest tide data for each tidal cycle within three to four days.
The TC best tracks datasets were obtained from the Regional Specialized Meteorological Center Tokyo of the Japan Meteorological Agency (RSMC of JMA) [35]. It contained data for 6 h center location (the latitude and longitude), time, center maximum sustained wind speed, and center pressure from 1951 to 2015. Landfall location and time were obtained from the intersection of TC tracks across the coastline, which is the basic time requirement of surge tide data selection. All the storm surges in the present work were associated with a landfall TC event. The tide-gauge stations within 500 km from the TC center were considered to be influenced by the TC induce storm surge activates.

2.2. Metric of Storm Surge Potential Impact

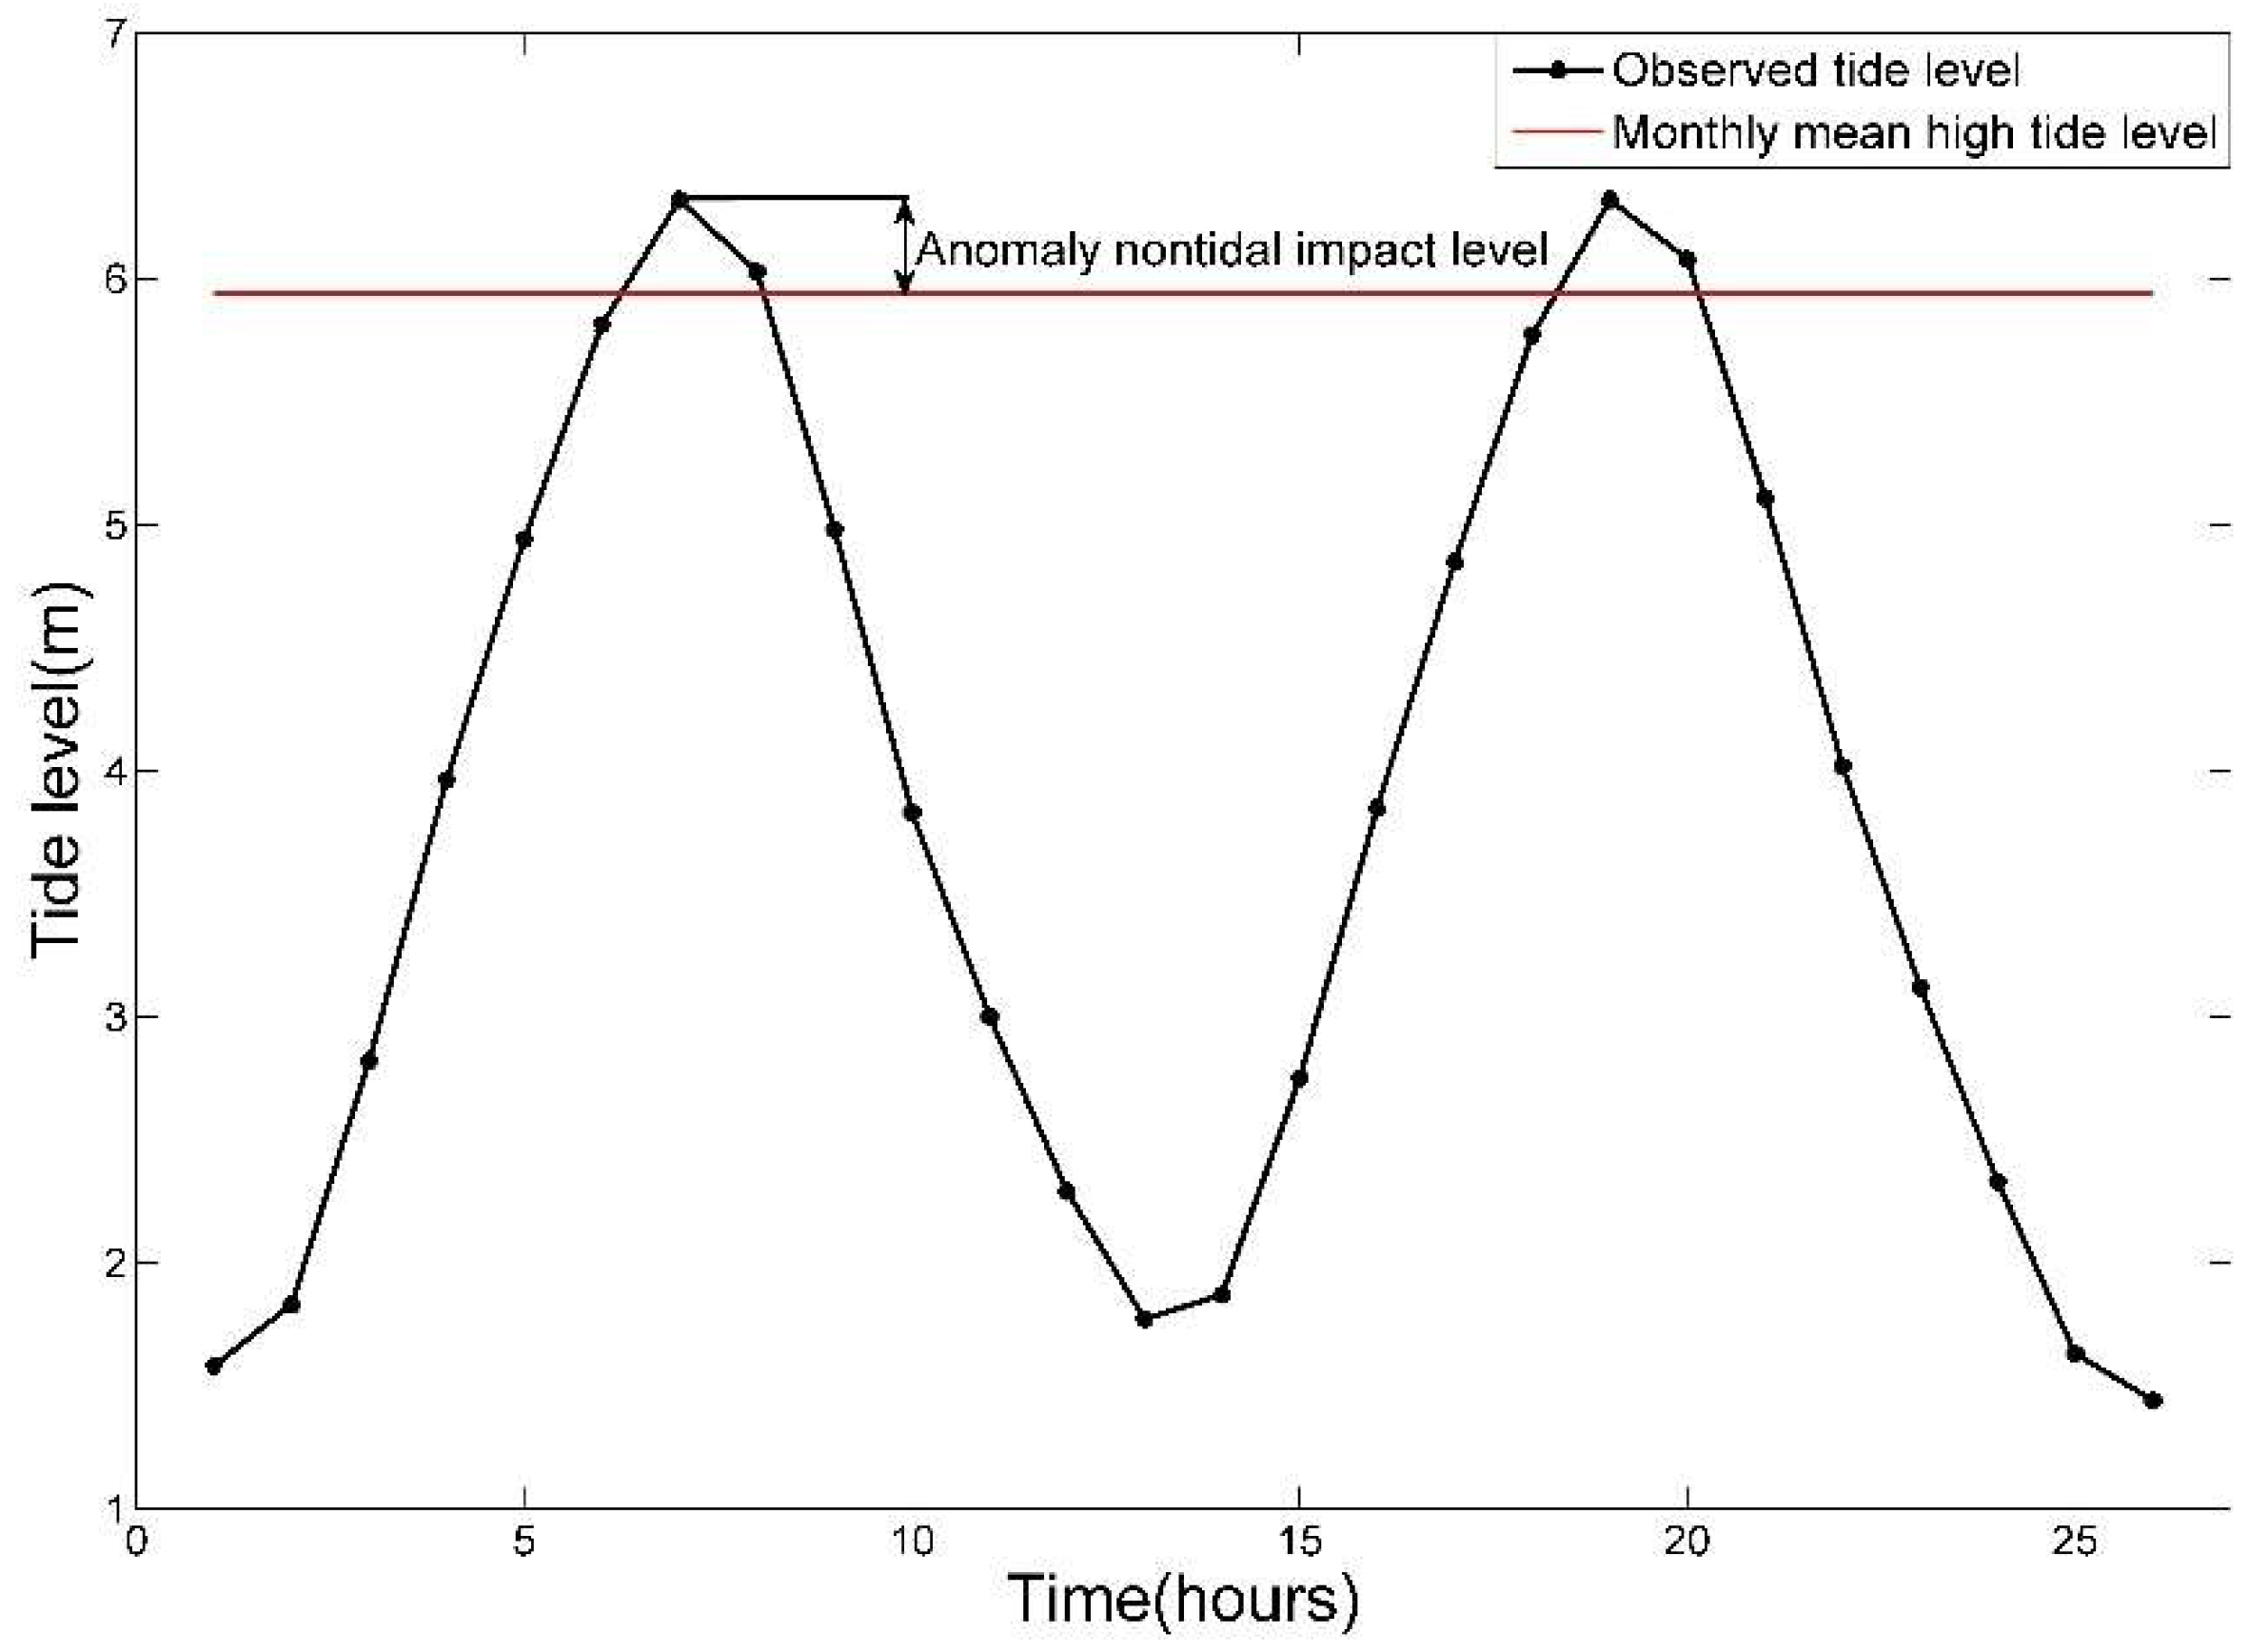
2.2.1. Anomaly Nontidal Impact Level

Storm surges are primarily caused by sea surface wind and the mean sea level pressure [36]. The intensity of a storm surge is associated with landfall TC factors and is still controlled by many other factors such as local coastal topography and bathymetry [9]. It is necessary to remove the contribution of the astronomical tide component from storm surge-induced elevated water level in order to detect and analyze historical changes in severity of storm surges [37,38]. Tide data were recorded in tide-gauge stations during the TC landfall period combined with the signals of storm surge-induced water rise level, mean sea level, local topography, and regional marine dynamic system impact.
Here we need to acquire the impact level caused by storm surge in coastal areas. Surge is a generalized definition of TC-induced anomaly sea level fluctuation, which is usually quantified by three intensity indexes: maximum high water level, nontidal residual, and skew surge. The calculation function of these indexes considers the general storm surge-induced water level rise. However, because of the limits of calculation function, they cannot directly show the impacts of storm surge-induced water level rise. Therefore, we defined ‘anomaly nontidal impact level’ at each tide-gauge station during TC landfall period for the analysis of storm surge effects on coastal area. An anomaly nontidal impact level at TC landfall day is the difference between the maximum tide level within a tide cycle recorded by the tide-gauge stations at the day that TC landfall and the monthly mean astronomical high tide level (see Figure 1). Positive surge events are added to tidal levels, increasing the risk of coastal flooding by extreme water levels [39]. The observed sea level variation is considered as the sum of a mean sea level, an astronomical tidal component and a nontidal residual [14]. The monthly mean high tide level refers to the calendar month when the TC made landfall. It is the combination of astronomical tidal component, the mean sea level, and other influencing components. If the storm surge-induced tide level was higher than the monthly mean high tide level, it would cause more damage than if the tide level was not lower than average high tide level. In present work, we focus on the storm surge threat and positive storm surge activities. Therefore, this extraction method of anomaly nontidal impact level eliminates local coastal topography influence and mean sea level change from storm surge-induced water level fluctuations. It can directly indicate the characteristics of elevated water level caused by storm surge. In the present study, we calculate anomaly nontidal impact level within a tide cycle and select the data above zero for one day (can obtain one or two data, even no data). The data selection needs to take TC tracks into consideration. In general, during a TC landfall period, we chose three or four days of anomaly nontidal impact level, which refer to the landfall day and the day before and after landfall day (or the days TC stalled near coastline).

2.2.2. Accumulated Storm Surge Potential Impact (ASPI)

Although the anomaly nontidal impact level could be a storm surge intensity parameter, it is not by itself an optimal way for storm surge threat assessment. The actual long-term destructiveness of storm surge in coastal areas should integrate frequency, duration, and intensity during the TC landfall period. Considering the tide data availability and time series, we defined the Accumulated Storm surge Potential Impact (ASPI) based on the anomaly nontidal impact level during the TC landfall period. The ASPI is defined as:
ASPI a n n u a l = j = 1 m i = 1 n ( h m a x h m a h ) 2
where: i = 1 , , n is the number of anomaly nontidal impact levels during TC landfall periods, j = 1 , , m is the storm surge frequency in particular time (e.g., annual, decade or a given time phase). h m a x is the maximum height of observed tide level induced by storm surge during TC landfall period at one tide-gauge station. h m a h is the monthly average high tide level in TC landfall calendar month. In this paper, we analysis the positive surges may cause damage to coastal area. The chosen anomaly nontidal impact levels h m a x h m a h here are all above zero at all tide-gauge stations during each TC landfall period. If the data was smaller than or equal to zero, the data would not been chosen for this calculation.
This metric is similar to the TC index ‘accumulated cyclone energy’ (ACE) [40]. In the present work, we analyze the sum ASPI for each station. The calculation of the ASPI for all 56 tide-gauge stations from 1960 to 2015 exhibits long-term spatial distribution patterns and temporal evolution.
The measure of annual storm surge threat is referred to as the annual-sum ASPI. Annual accumulate value is the basic unit of ASPI calculation. Annual accumulated value involves adding all the squares of anomaly nontidal impact levels in every single storm surge activity, then summate all values of storm surge activities over one year. The basic unit of annual calculation can avoid the small number of storm surge events hindering the computation of robust statistics of temporal evolution.

3. Results

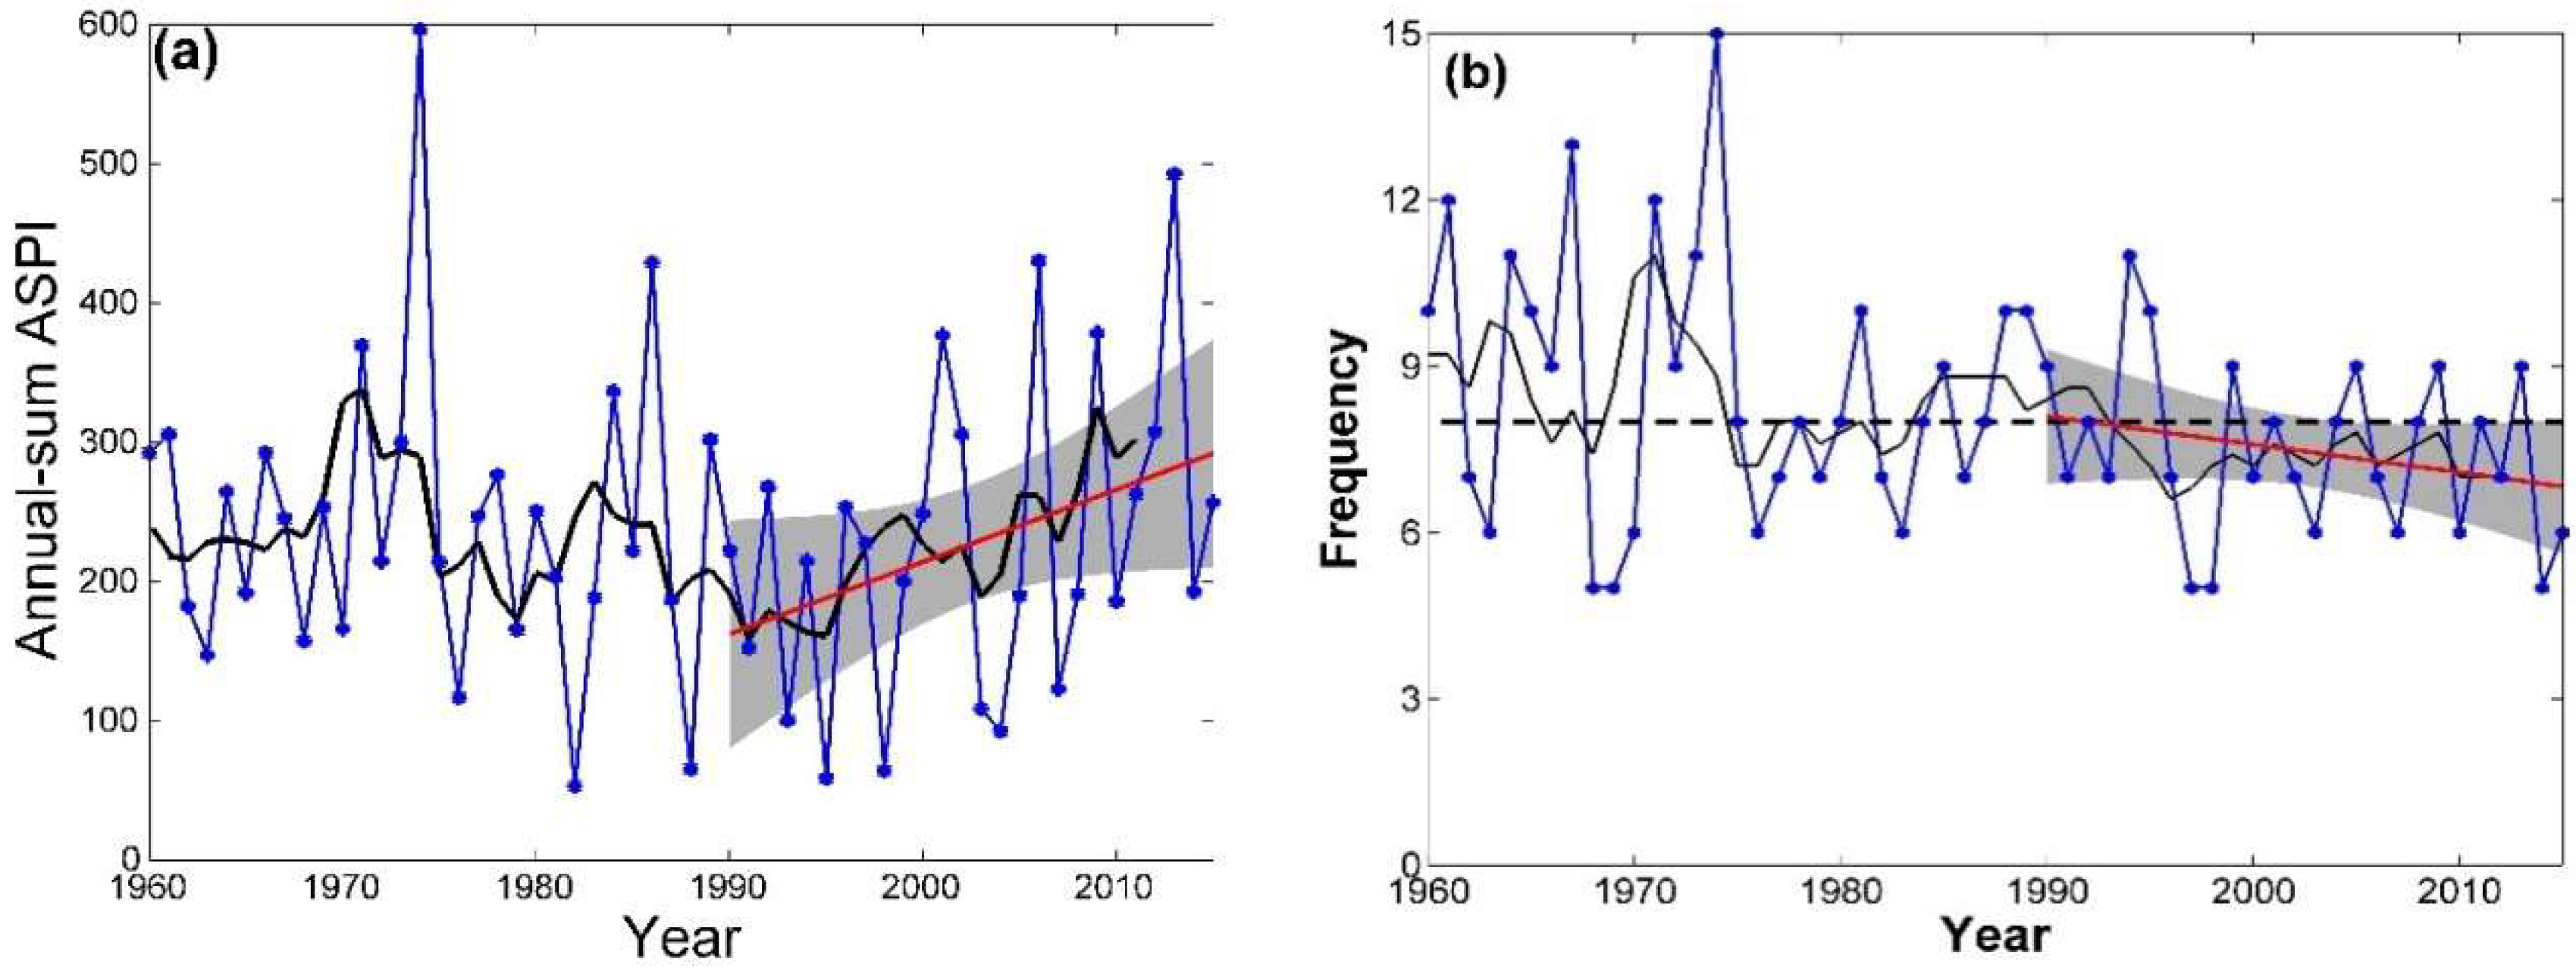
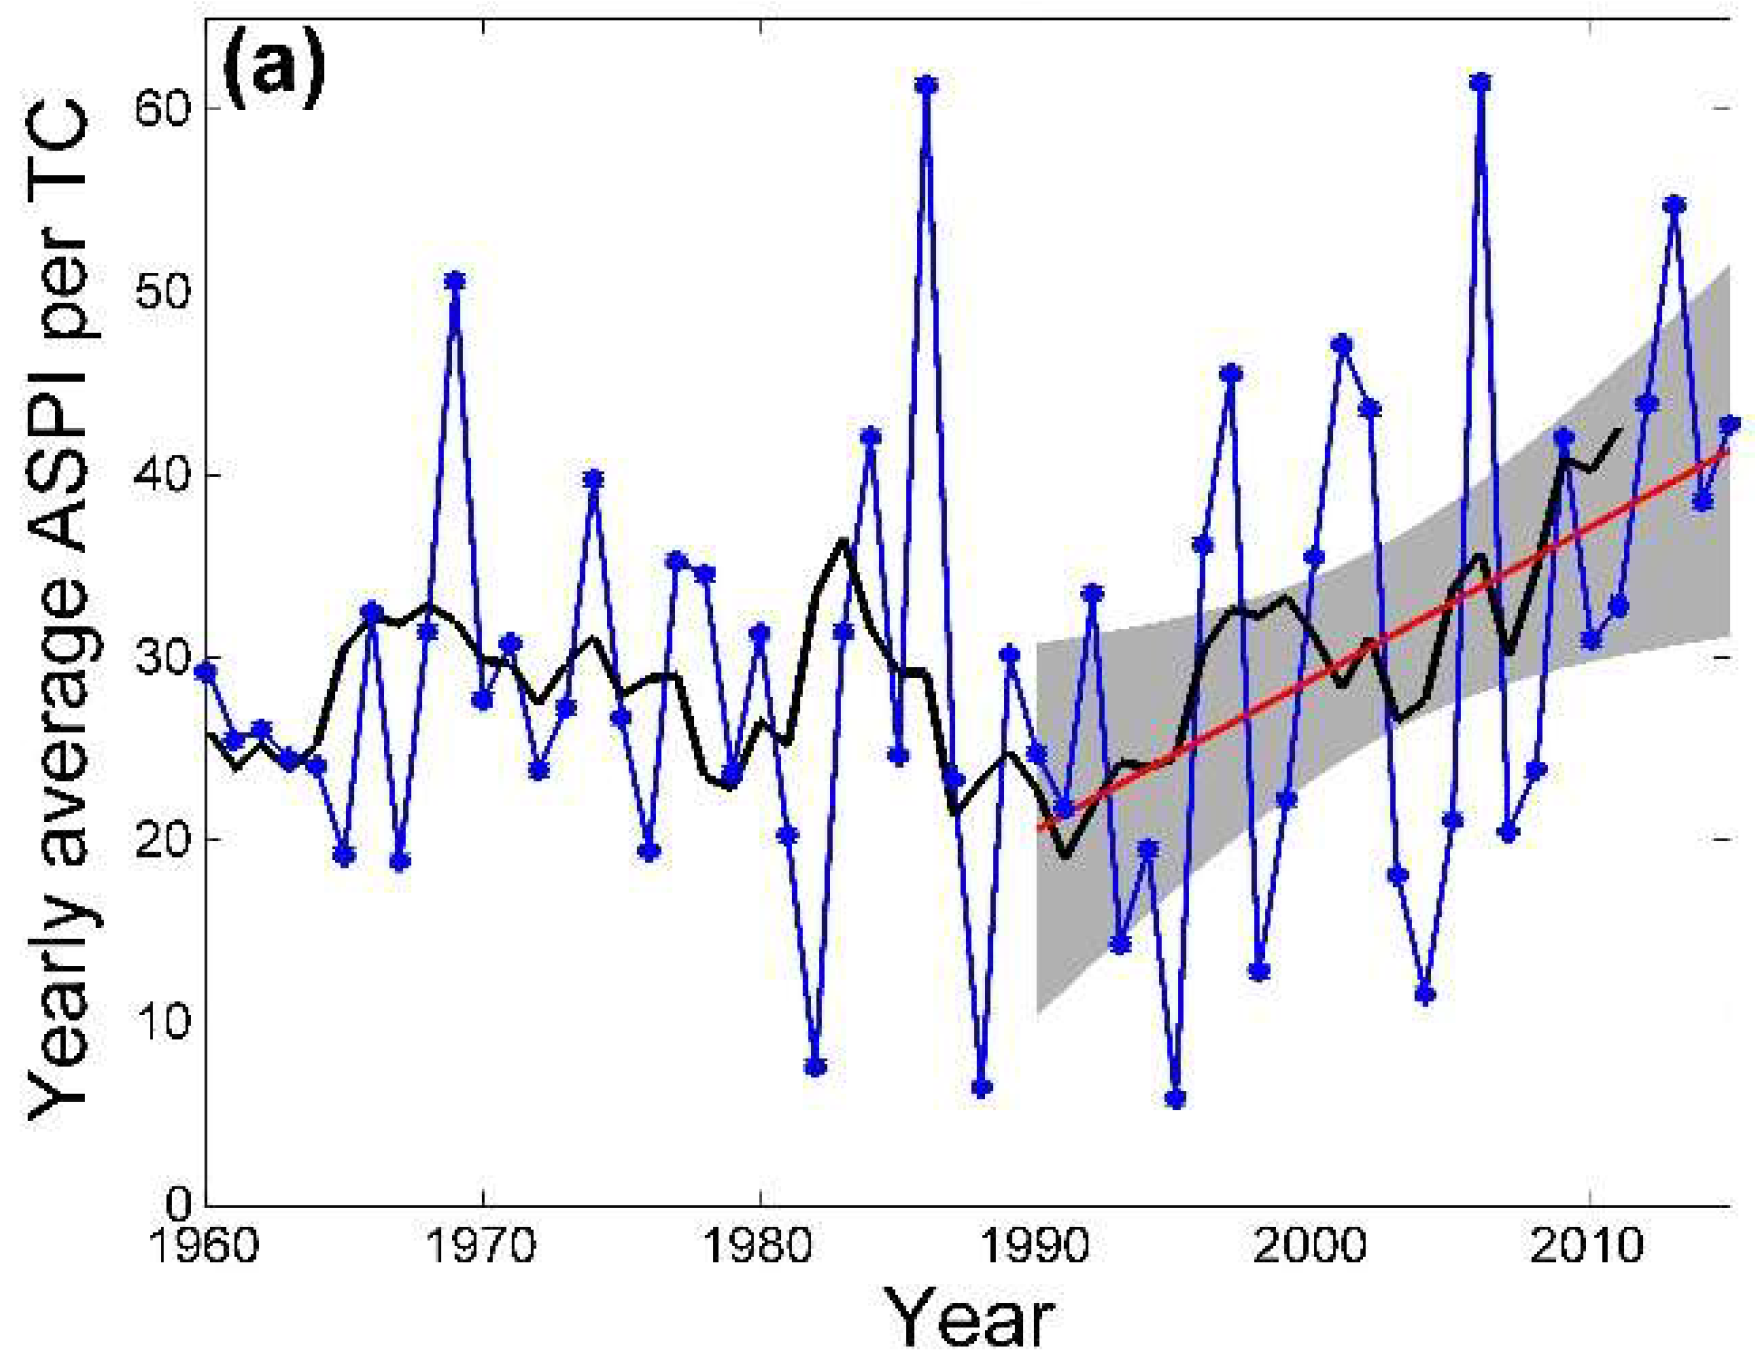
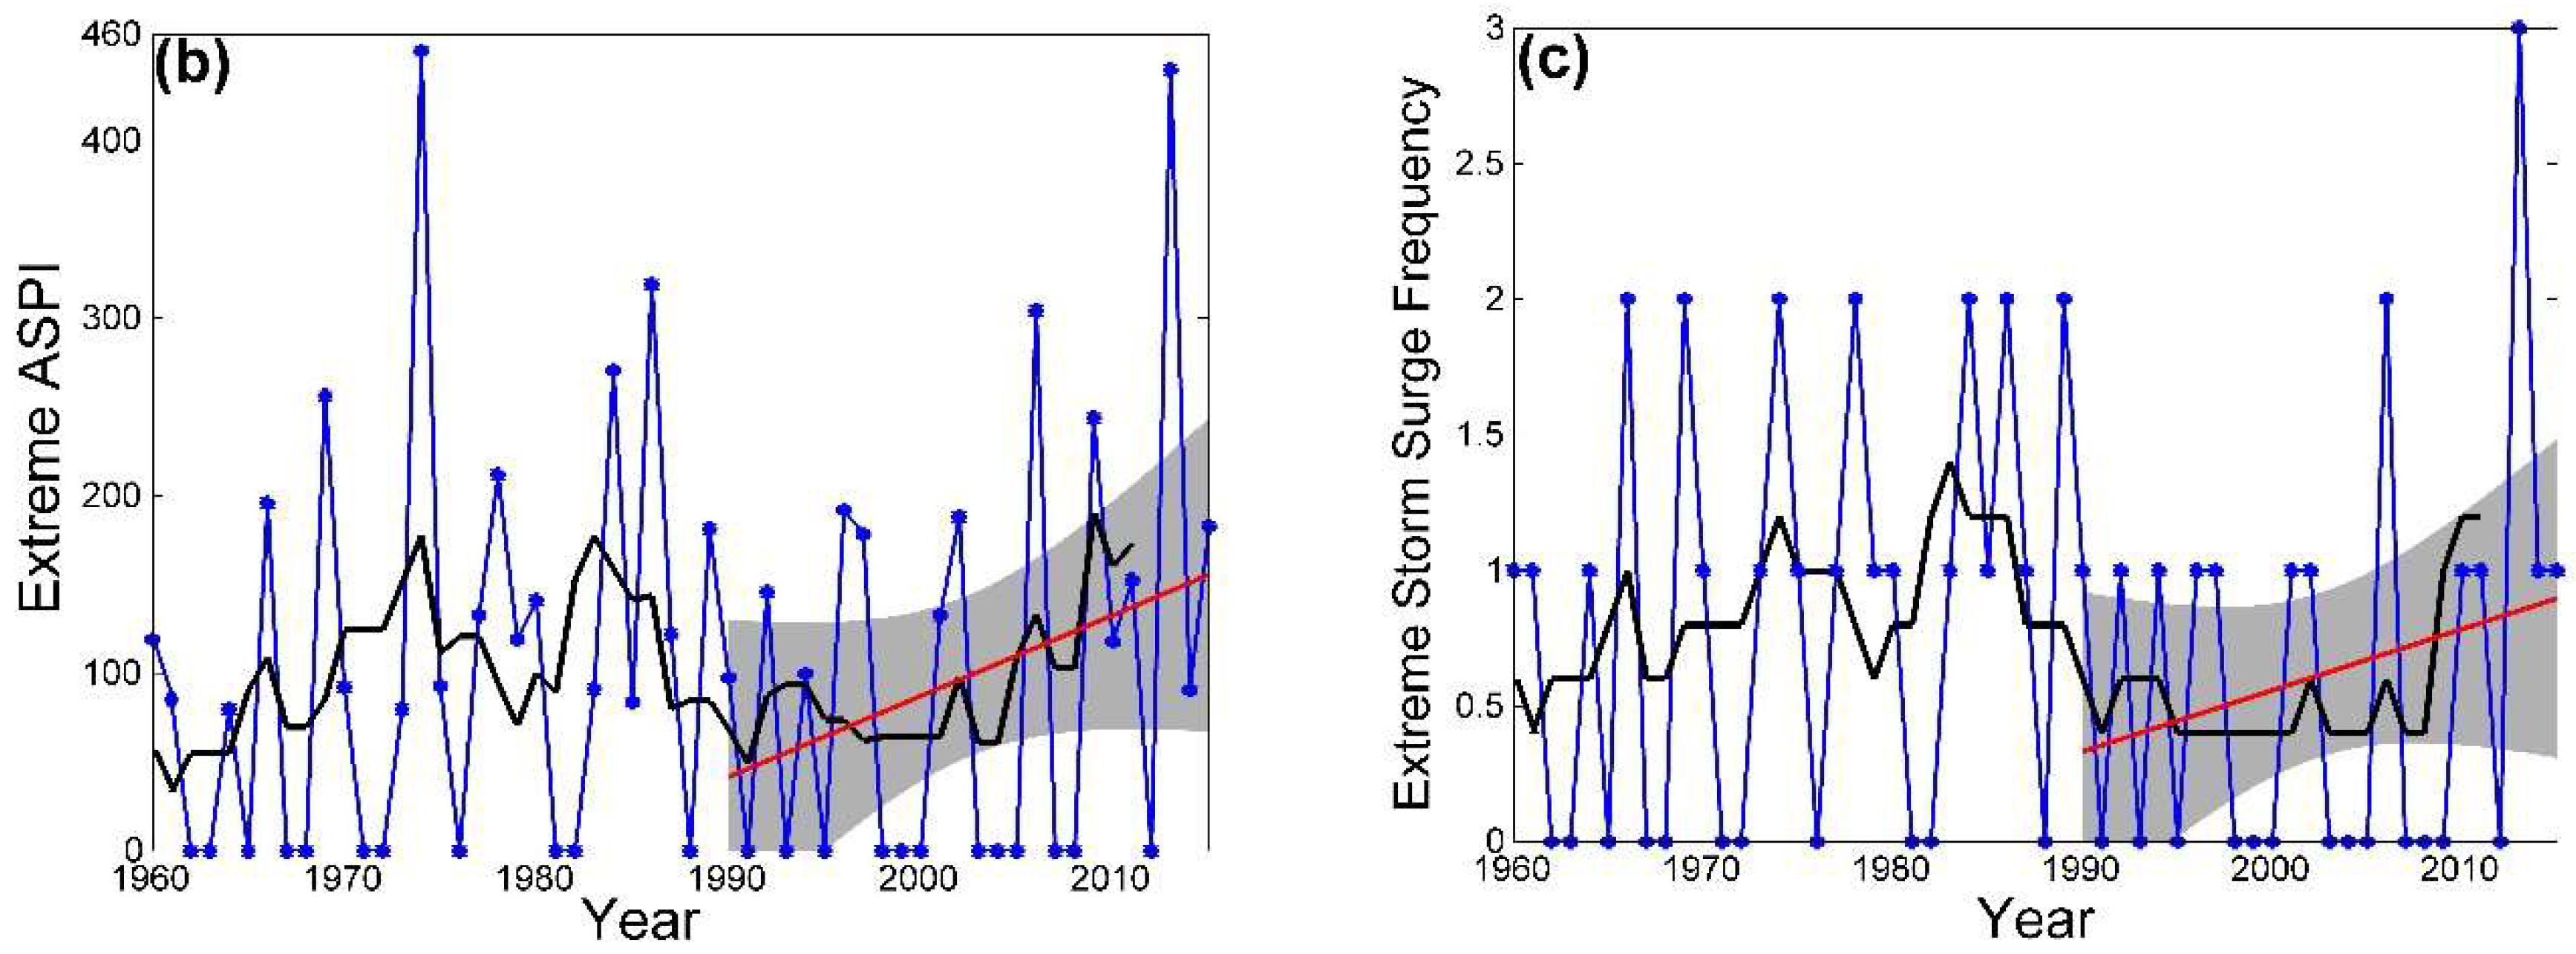
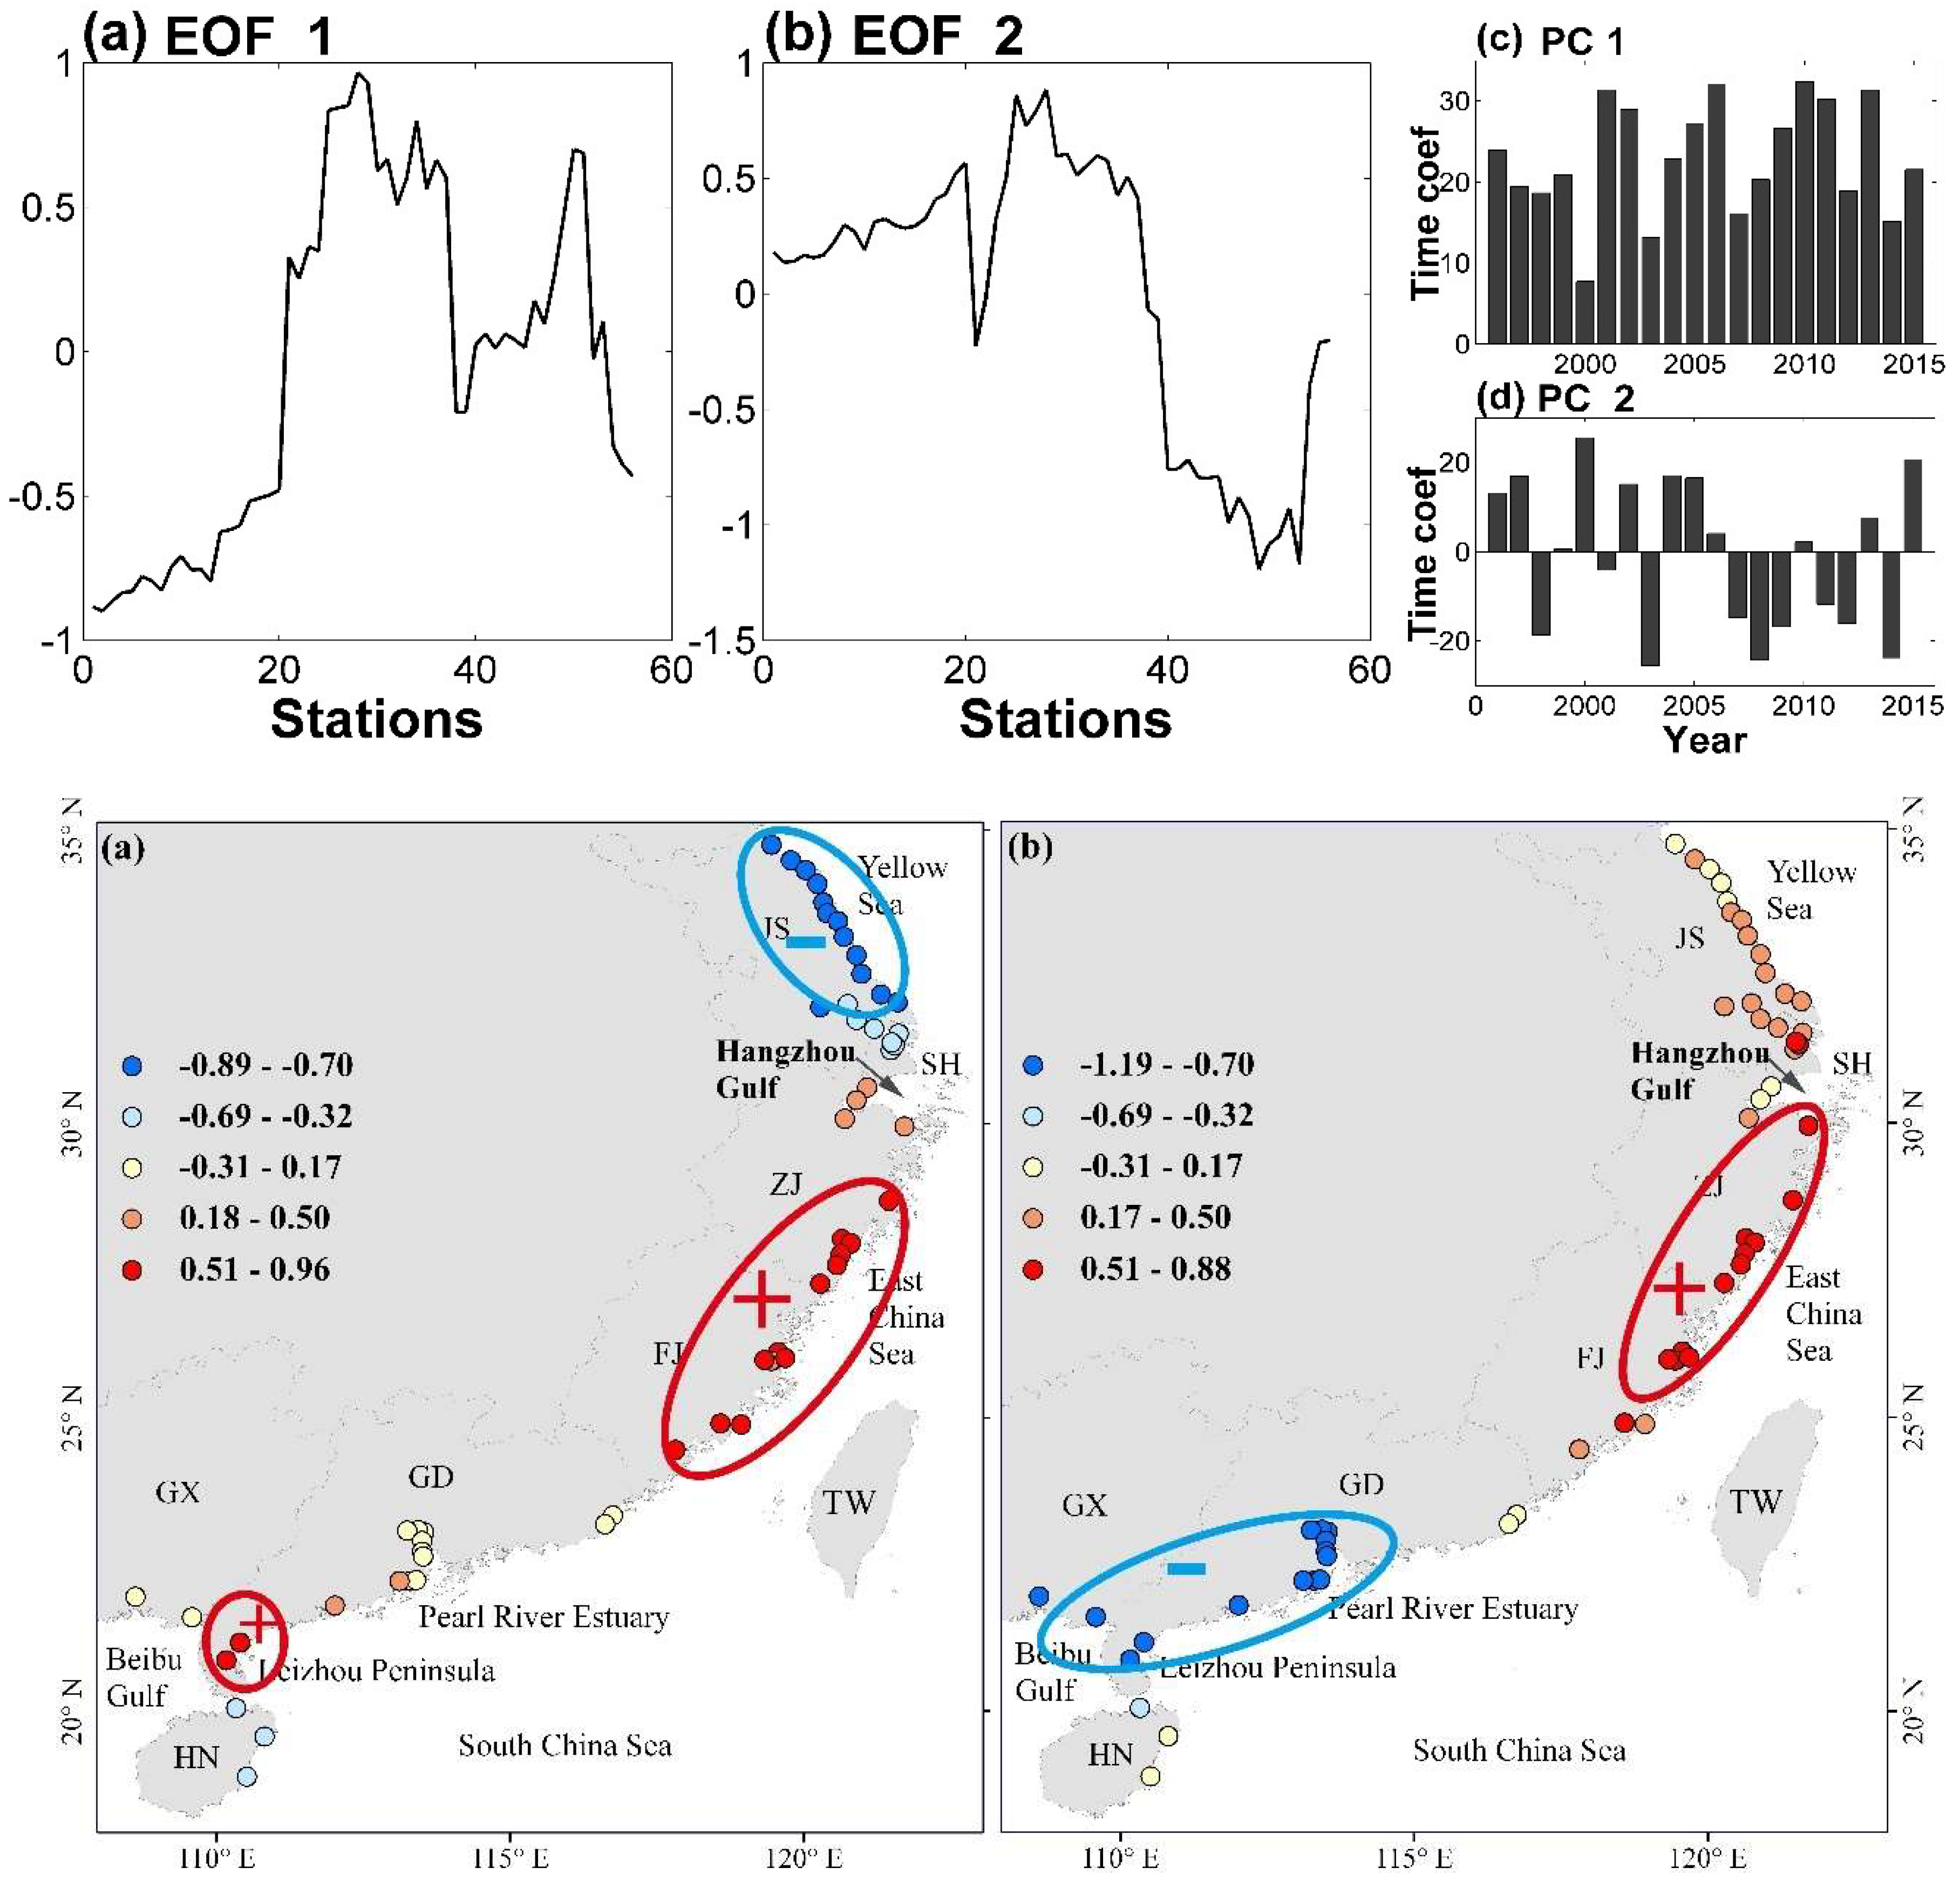
3.1. Variability of Storm Surge Potential Impact

Figure 2a indicates the annual-sum ASPI for all of China’s coastline from 1960 to 2015, which exhibits obvious decadal fluctuation, and a significant increasing trend at the 0.05 significance level from the end of 1990s. The annual-sum ASPI reached the highest level in history in the mid-1970s. Figure 2b shows the time series of the frequency of TCs that made landfall in mainland China from 1960 to 2015.
The yearly average ASPI per TC from 1960–2015 represents the annual-sum ASPI divided by the TC frequency in the respective year. It exhibited decadal variation and a significant increasing trend from mid-1990s (Figure 3a). Figure 3b illustrates the annual-sum ASPI of extreme storm surges. Extreme storm surge, in our case, meant it fell in the 90th percentile of all ASPIs. The ASPI was at the lowest level from the 1990s to 2000s and the upswing began from the late 2000s, increasing at a rate of 41%. Figure 3c shows the frequency of extreme storm surges from 1960 to 2015, which exhibited multidecadal variability. The slight increasing trend is similar with the annual-sum ASPI of extreme storm surges beginning from the late 2000s.
In conclusion, the frequency of landfall TCs was low. On the contrary, the annual-sum ASPI was inconsistent with frequency, showing a significant increasing trend at the same time. The annual-sum ASPI showed that storm surge potential impact had a significant increasing trend with an increasing rate over 20% over the past 15 years. This was not caused by the increasing frequency of landfall TCs in recent decades. Meanwhile, the annual mean value of ASPI per TC increased by over 19%. The annual-sum ASPI of extreme storm surges did not exhibit the same upward trend in the late 1990s, but a significant upswing occurred around 2006. As discussed above, the increasing trend of storm surge potential impact was mainly due to the greater threat of general storm surge (stronger normal storm surges) since the mid-1990s. However, the pronounced increasing trend of storm surge potential impact from the late 2000s was caused by extreme storm surge activities. Both the frequency and intensity of extreme storm surge activities showed significant increasing trend. This is consistent with the intensifying landfall of TCs over the northwest Pacific and the more frequent category 4–5 TCs in recent years [41].

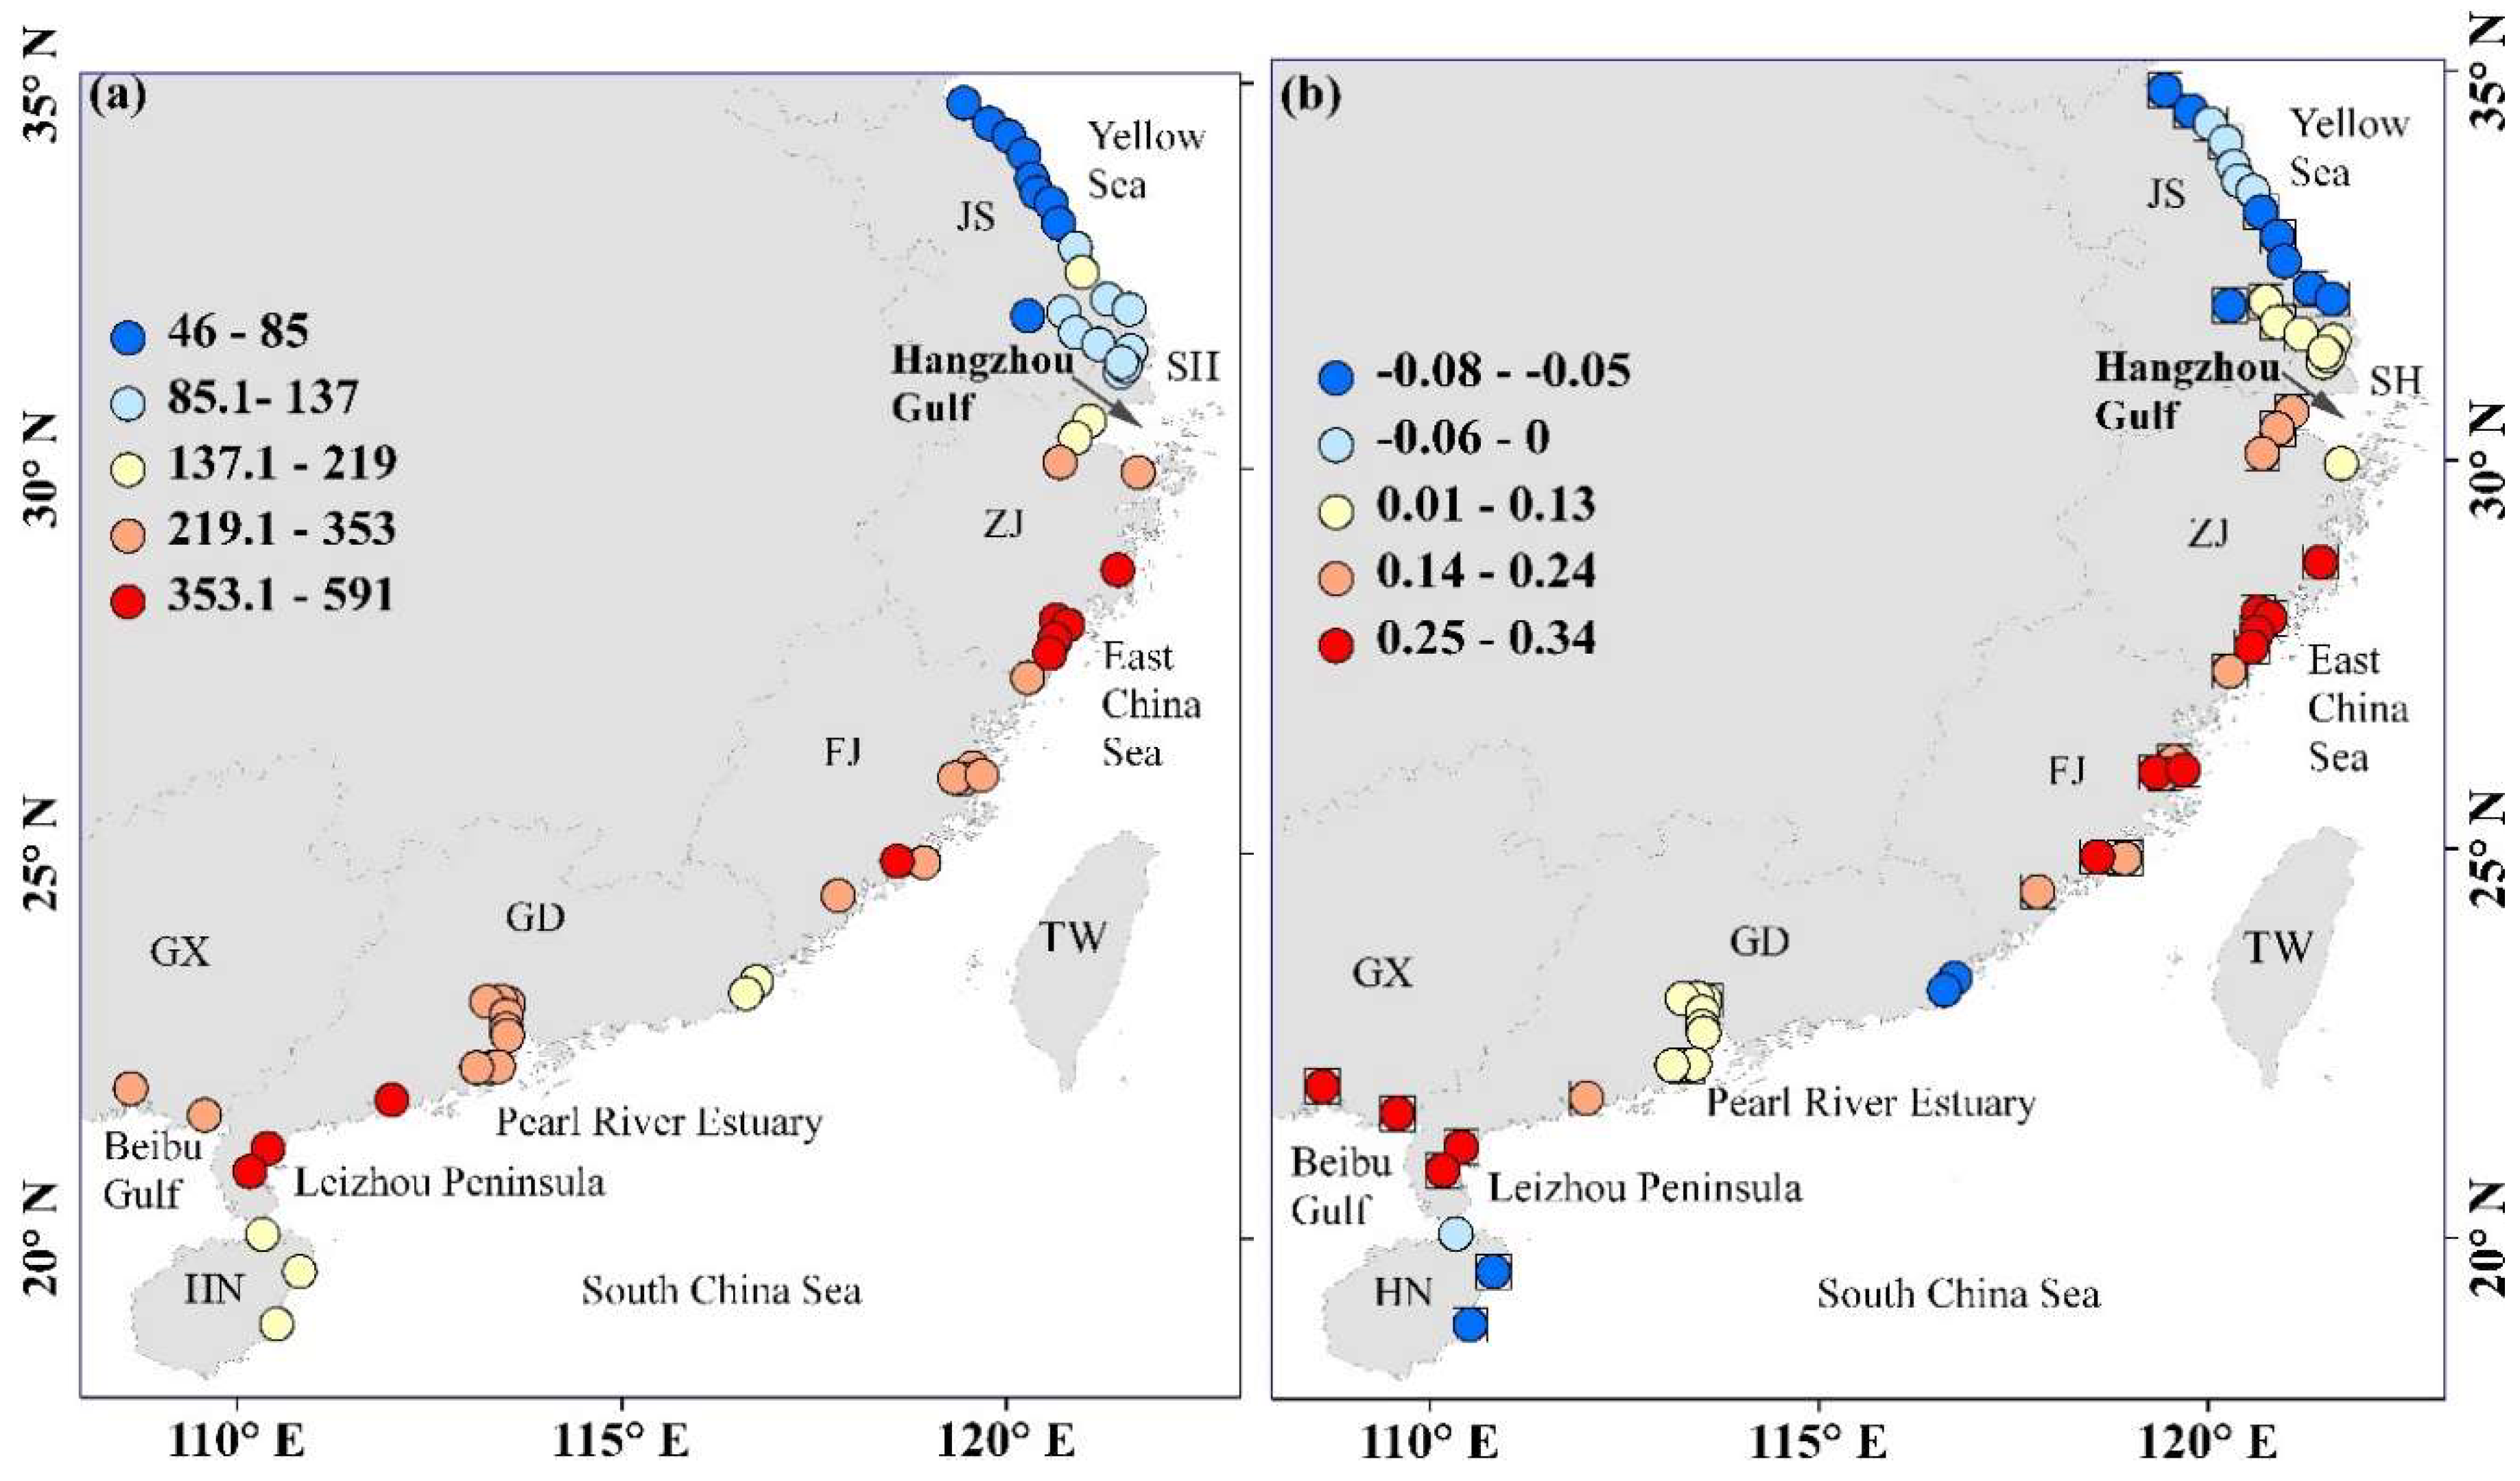
3.2. Spatial Distribution of Storm Surge Potential Impact

Storm surges were caused primarily by wind stress at the sea surface and the horizontal gradient of atmospheric pressure [36]. The long-term spatial distribution pattern of storm surge threat is significantly associated with the prevailing TC landfall locations and induced atmospheric forcing field areas in coastal regions [5].
Figure 4a illustrates the spatial distribution of the sum ASPI for each of the 56 tide-gauge stations along the southeastern coastline of China from 1960 to 2015. The long-term storm surge pattern showed regional spatial distribution. The highest storm surge potential impact occurred over the northwestern coast area of the South China Sea (SCS), located on the southwestern coastline of Guangdong province, Leizhou Peninsula. The second highest storm surge potential impact was from the northwestern to center and southwestern coast area of the East China Sea (ECS), located from the center Zhejiang province to the center of Fujian province. The lowest storm surge potential impact occurred over the western coast line of the Yellow Sea (YS), located from the north to the center coast line of Jiangsu province. The northeastern coast area of the SCS (the southeastern coastline of Guangdong province) and the eastern coast line of the Hainan Island also showed lower levels than other coastal areas. Figure 4b showed the ASPI trend of individual tide-gauge stations since the mid-1990s. The storm surge potential impact exhibited different regional evolution patterns. The increasing trend along the eastern coast line of Leizhou Peninsula showed the most significant increasing trend of 32% over the last 15 years. The large area along the coastline from the center Zhejiang province to the center of Fujian province also showed an increasing trend of 26%. Meanwhile, the storm surge threat along the coastline along the north to the center of Jiangsu province and the eastern coastline of Hainan Island exhibited a slightly decreasing trend.
In conclusion, the highest value of storm surge potential impact is distributed on the eastern coastline of Leizhou Peninsula, which has a significant increasing trend. Although TC prevailing tracks over the central SCS have persistently decreased in last decade [42], the TCs’ influence in this area has intensified. Stronger TCs occur more frequently, causing extreme storm surge activities [41]. Storm surge potential impact along the coast line from the center of Zhejiang province to the center of Fujian province illustrated the second highest intensification rate. The results might be caused by increasing intensity and intensification rates of landfall TCs in this area, and the landfall locations that are shifted polewards along the coastline of China in recent decades might induce more storm surge activities in this area [22,41]. The storm surge potential impact showed a slight decreasing trend at the coastline along the north to the center of Jiangsu province, the southeastern coastline of Guangdong province, and the eastern coastline of Hainan Island. In these areas, the changing trend was not significant. This might be an interdecadal fluctuation of storm surge potential impact.
The above results are evaluated as the basic spatiotemporal distribution of long-term storm surge threat along the entire southeastern coastline of China. Here, we use the EOF function to analyze the evolution pattern of the annual-sum ASPI in individual tide-gauge stations from 1960 to 2015. The principal components of spatial distribution and temporal fluctuation pattern can evaluate the evolution of storm surge threat along the southeastern coastline of China.

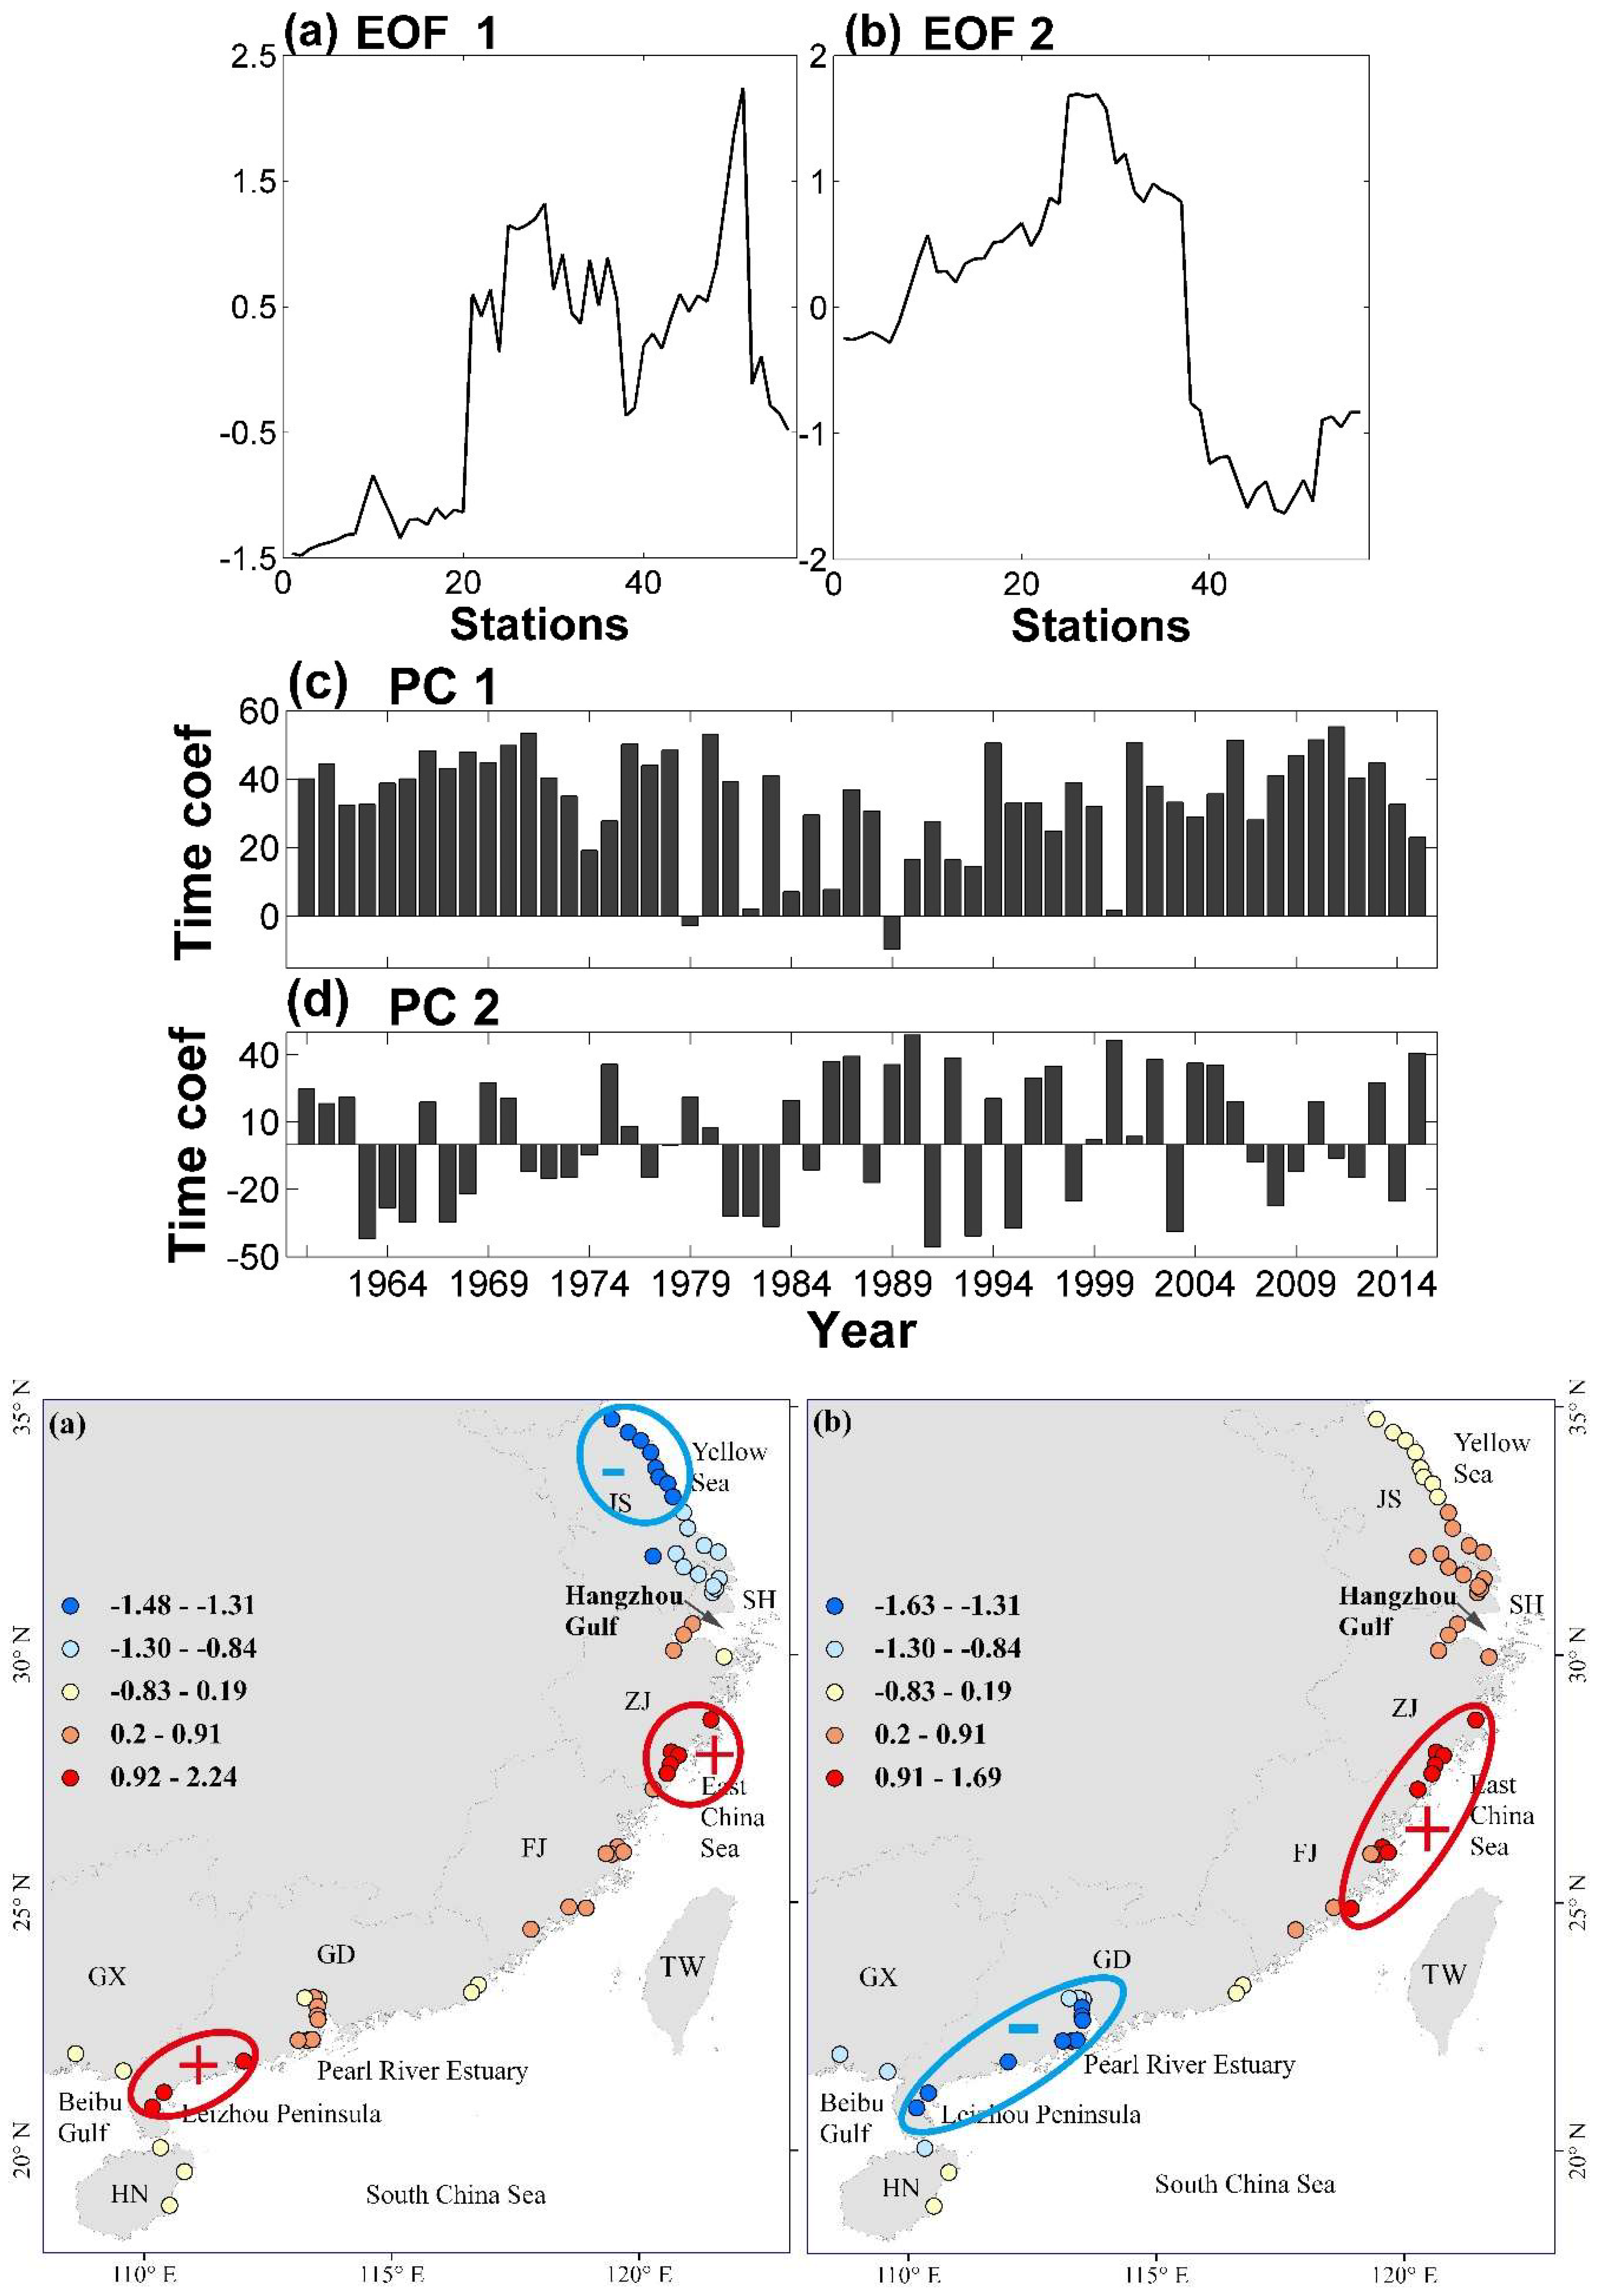
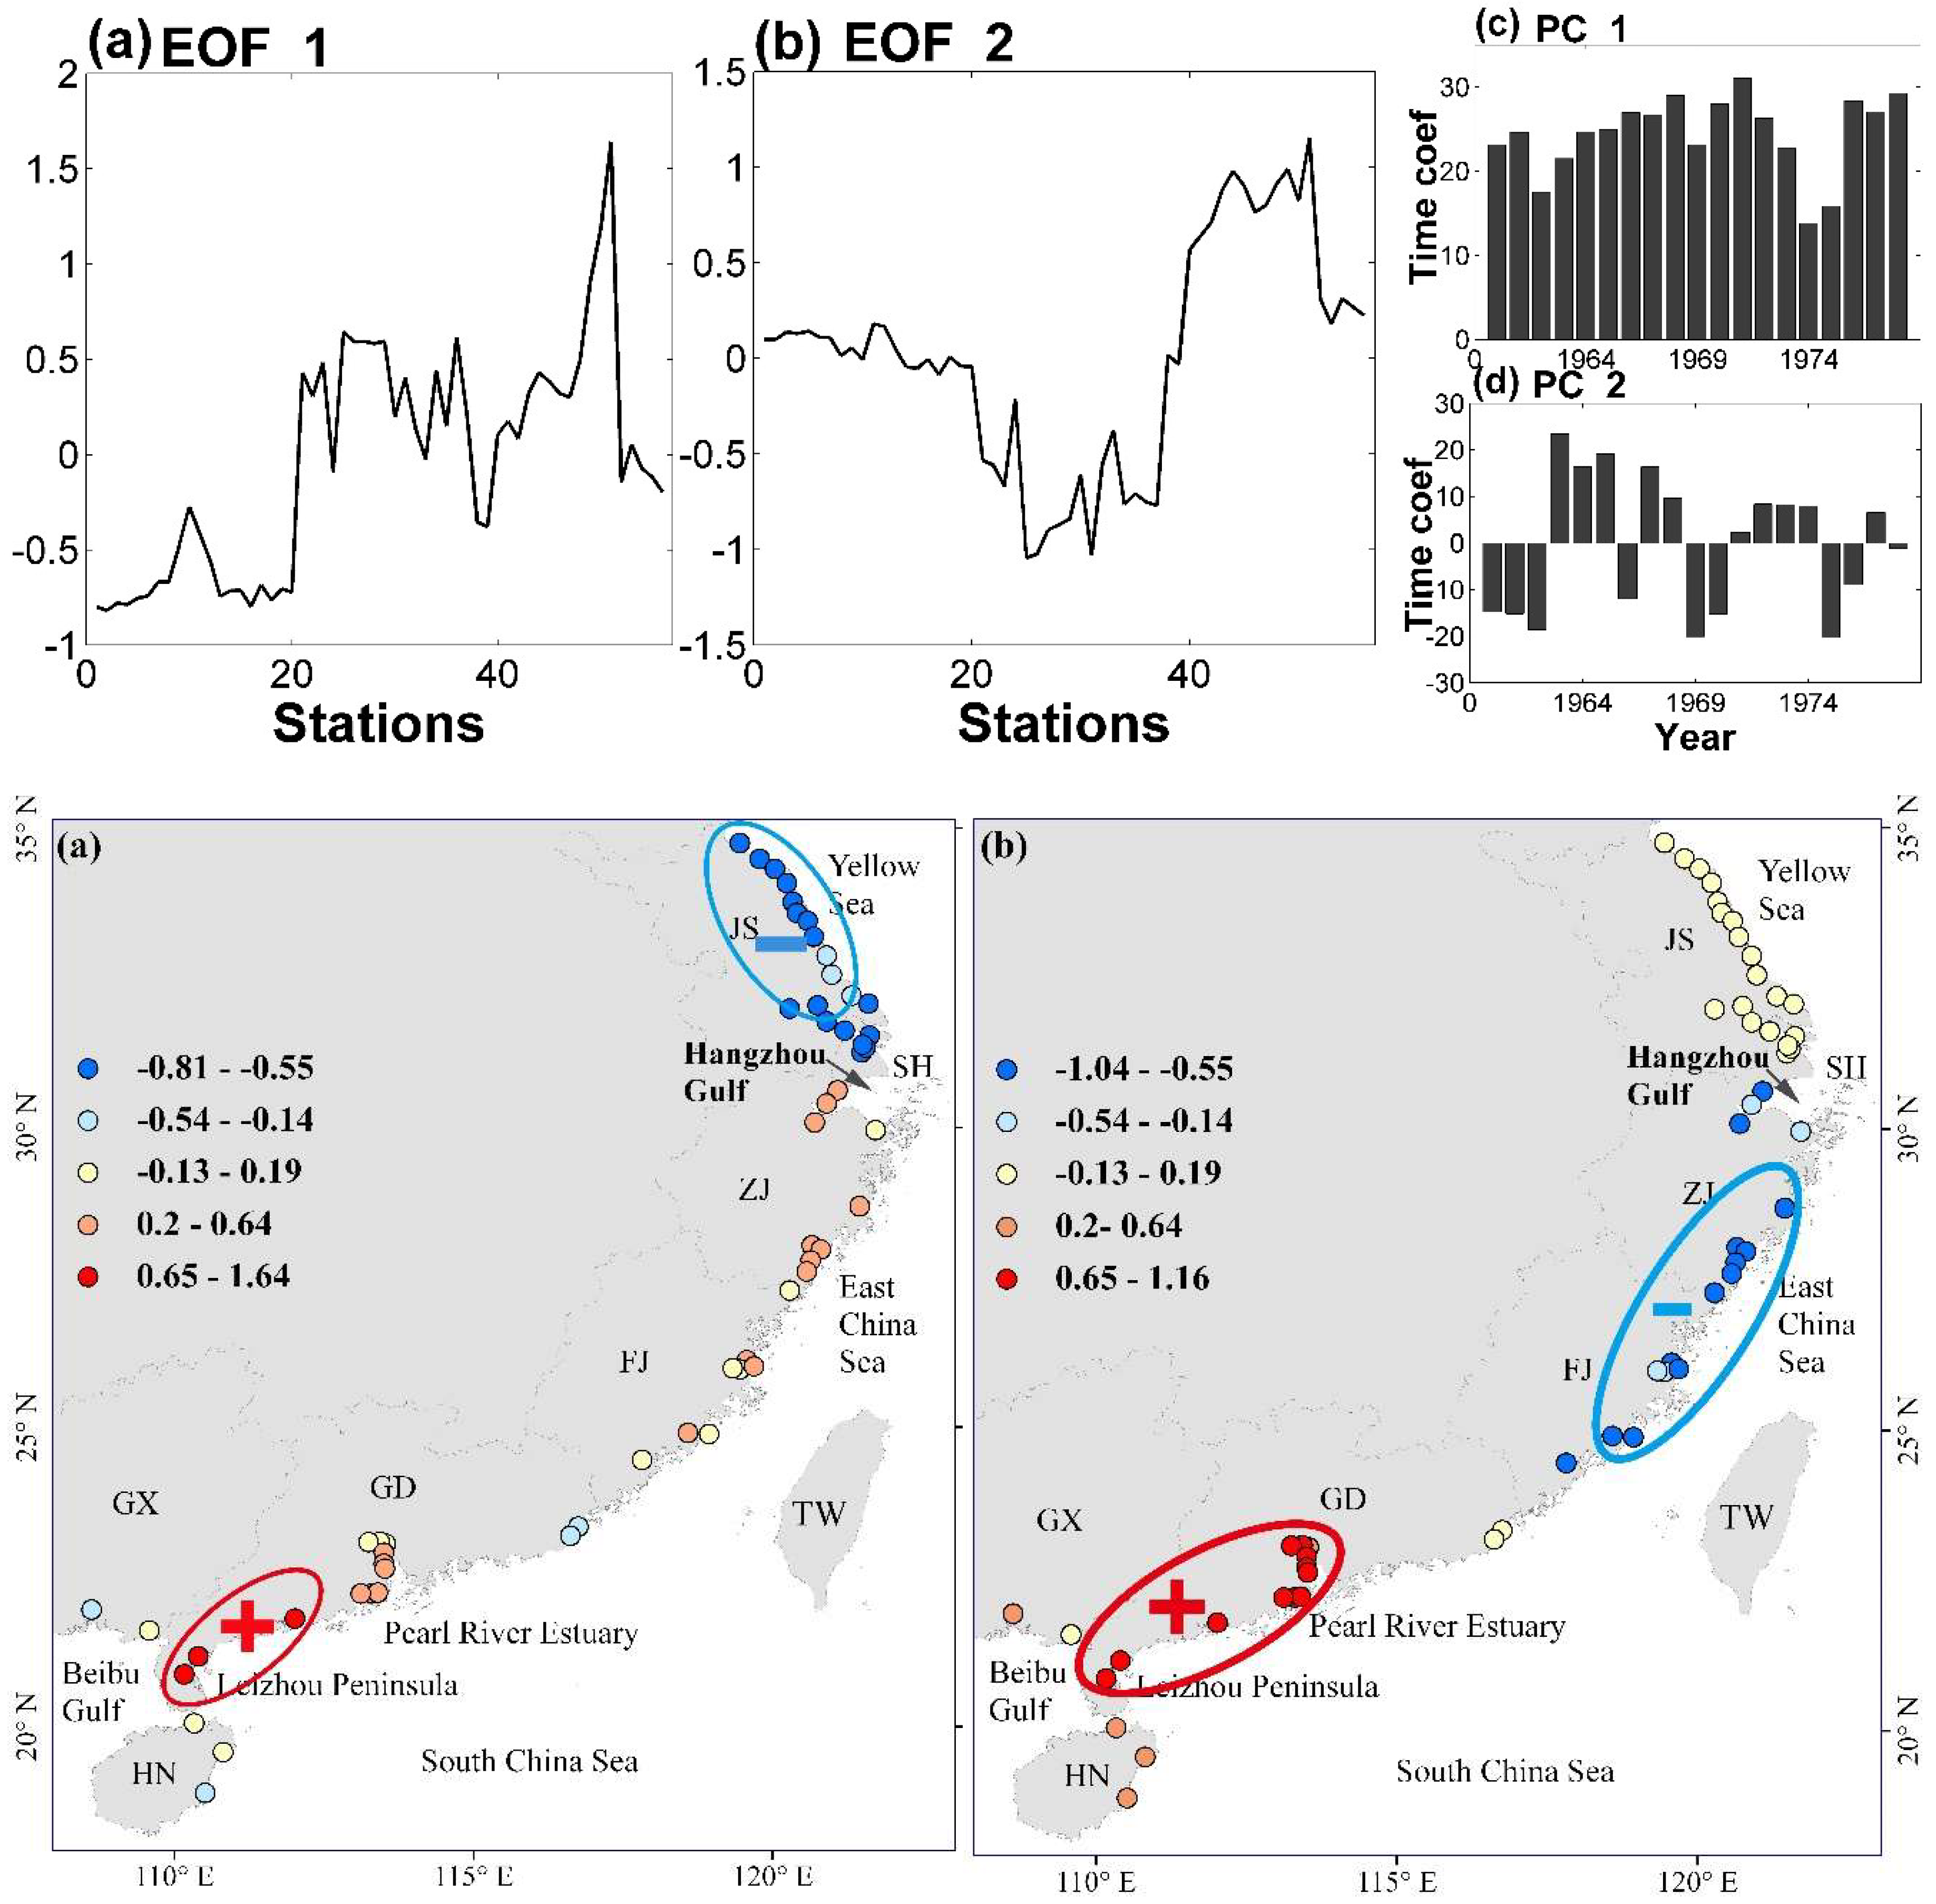
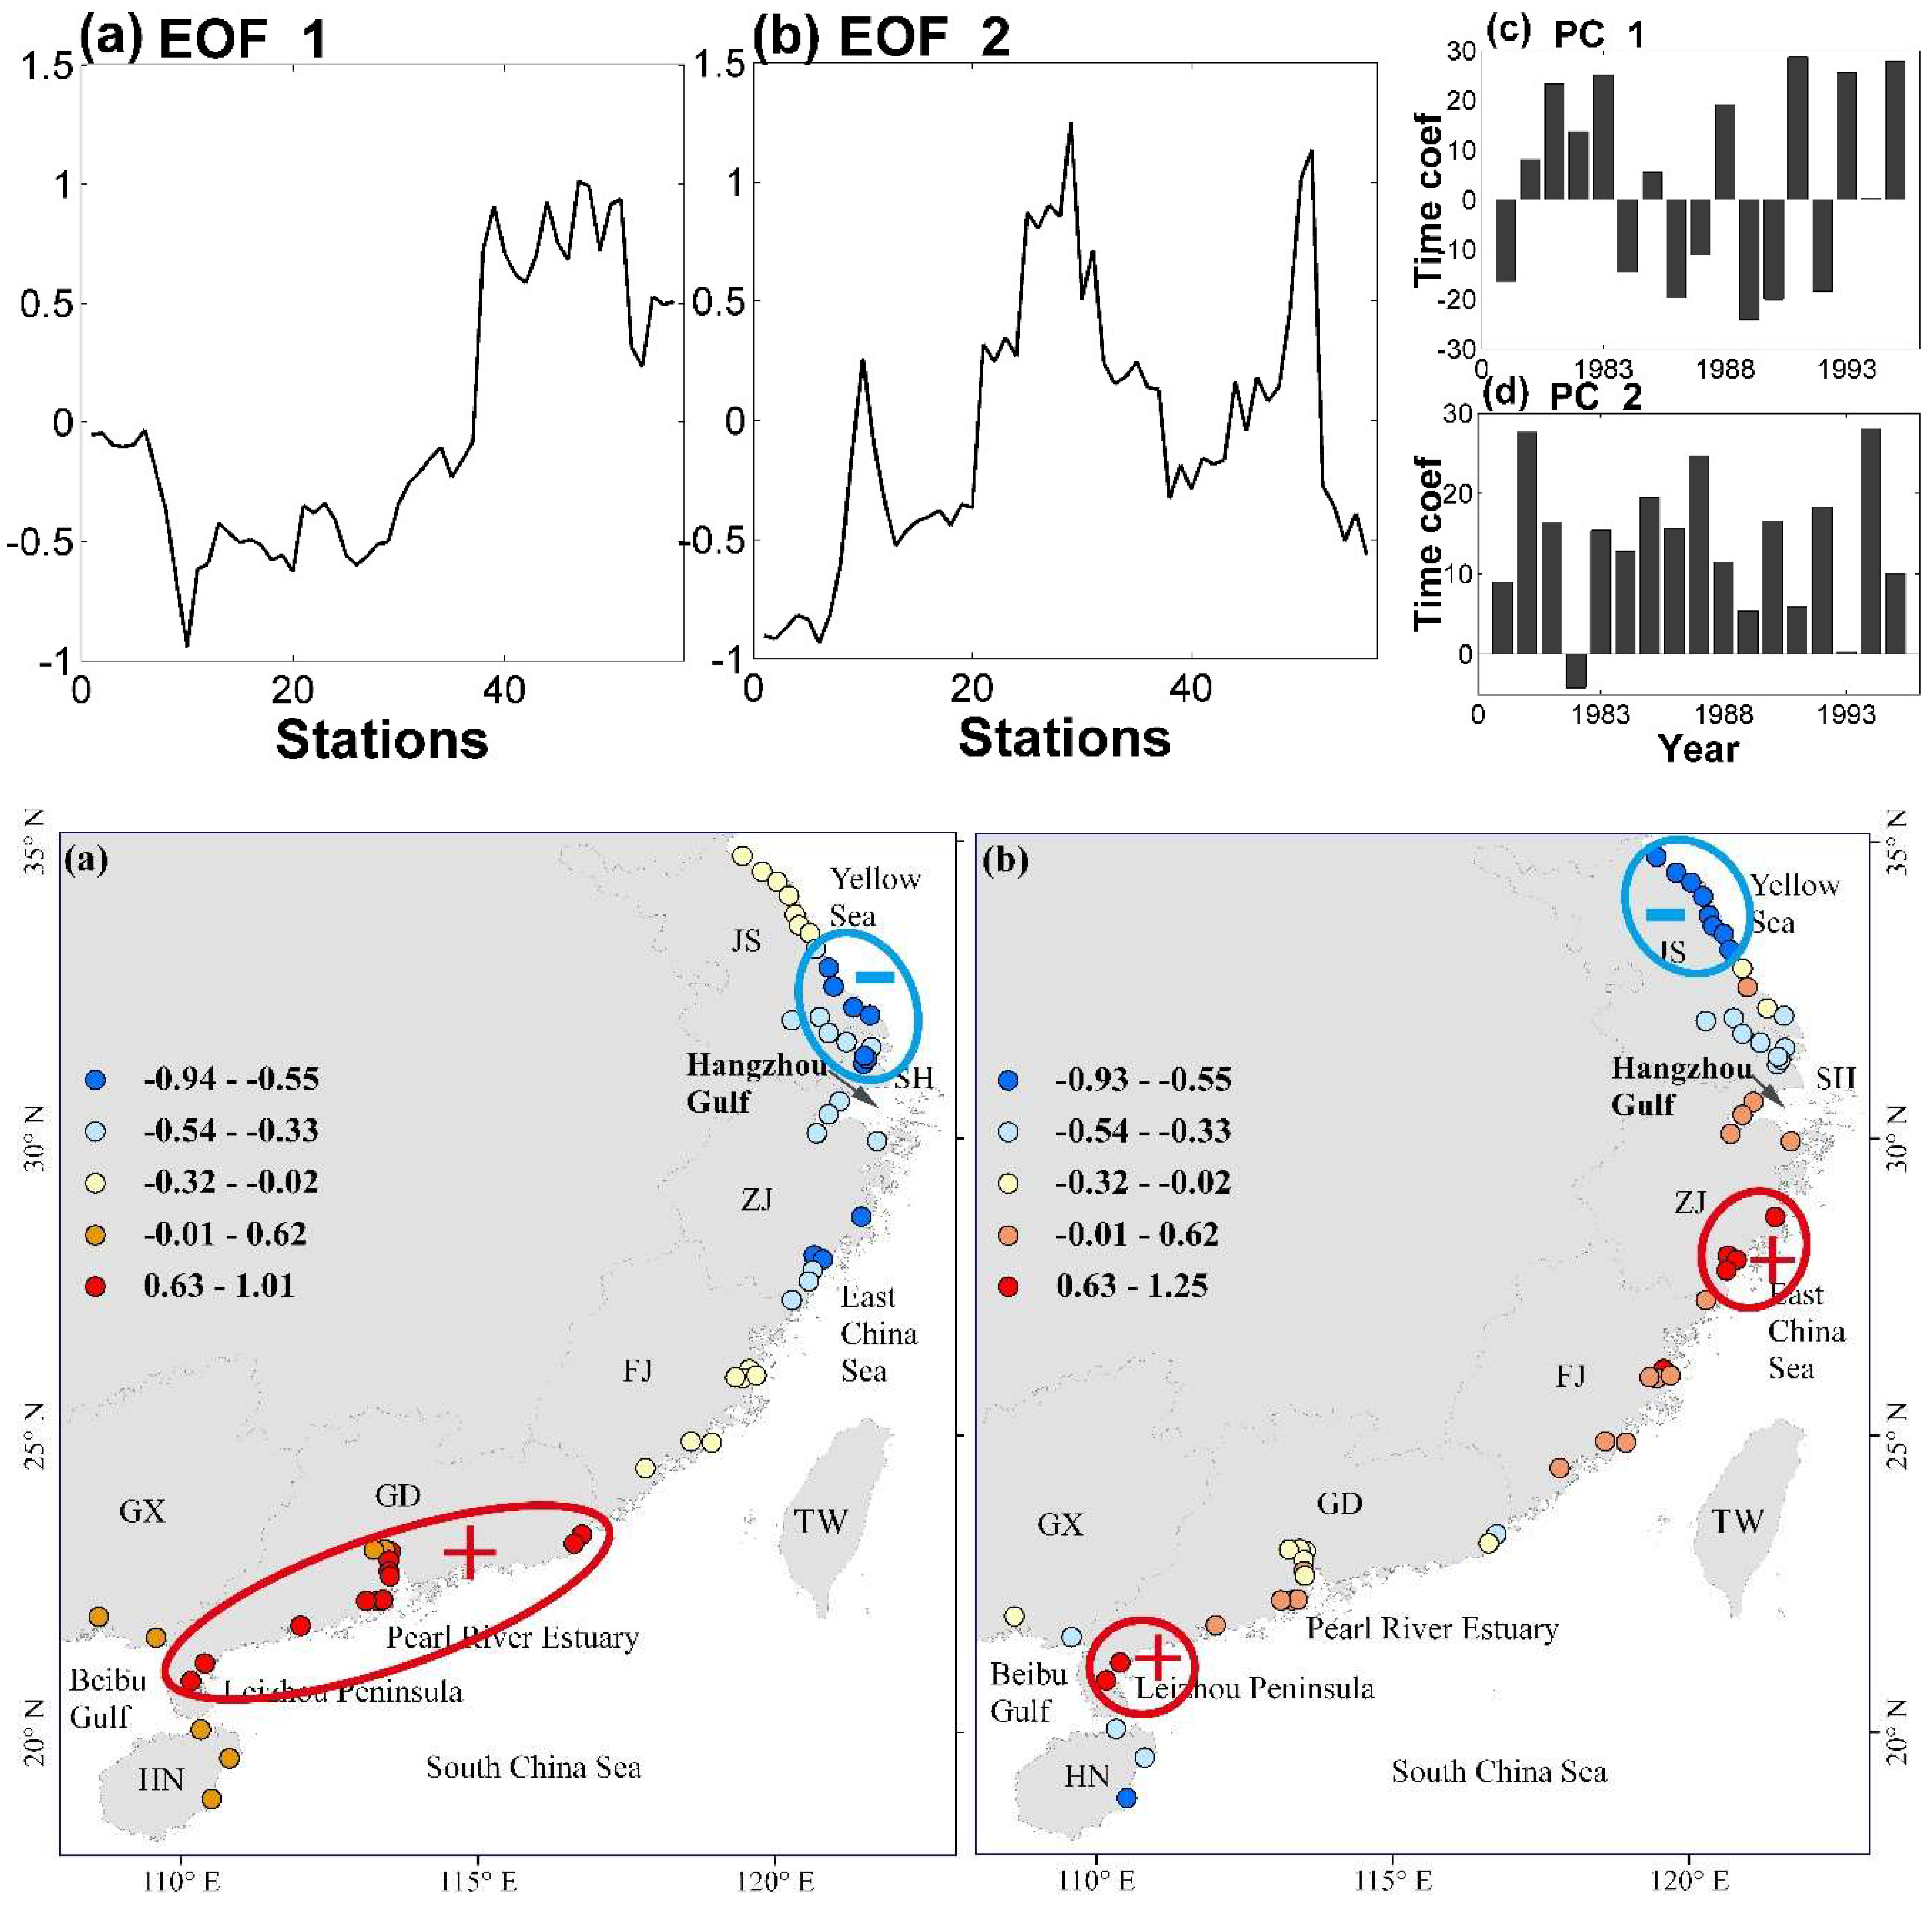
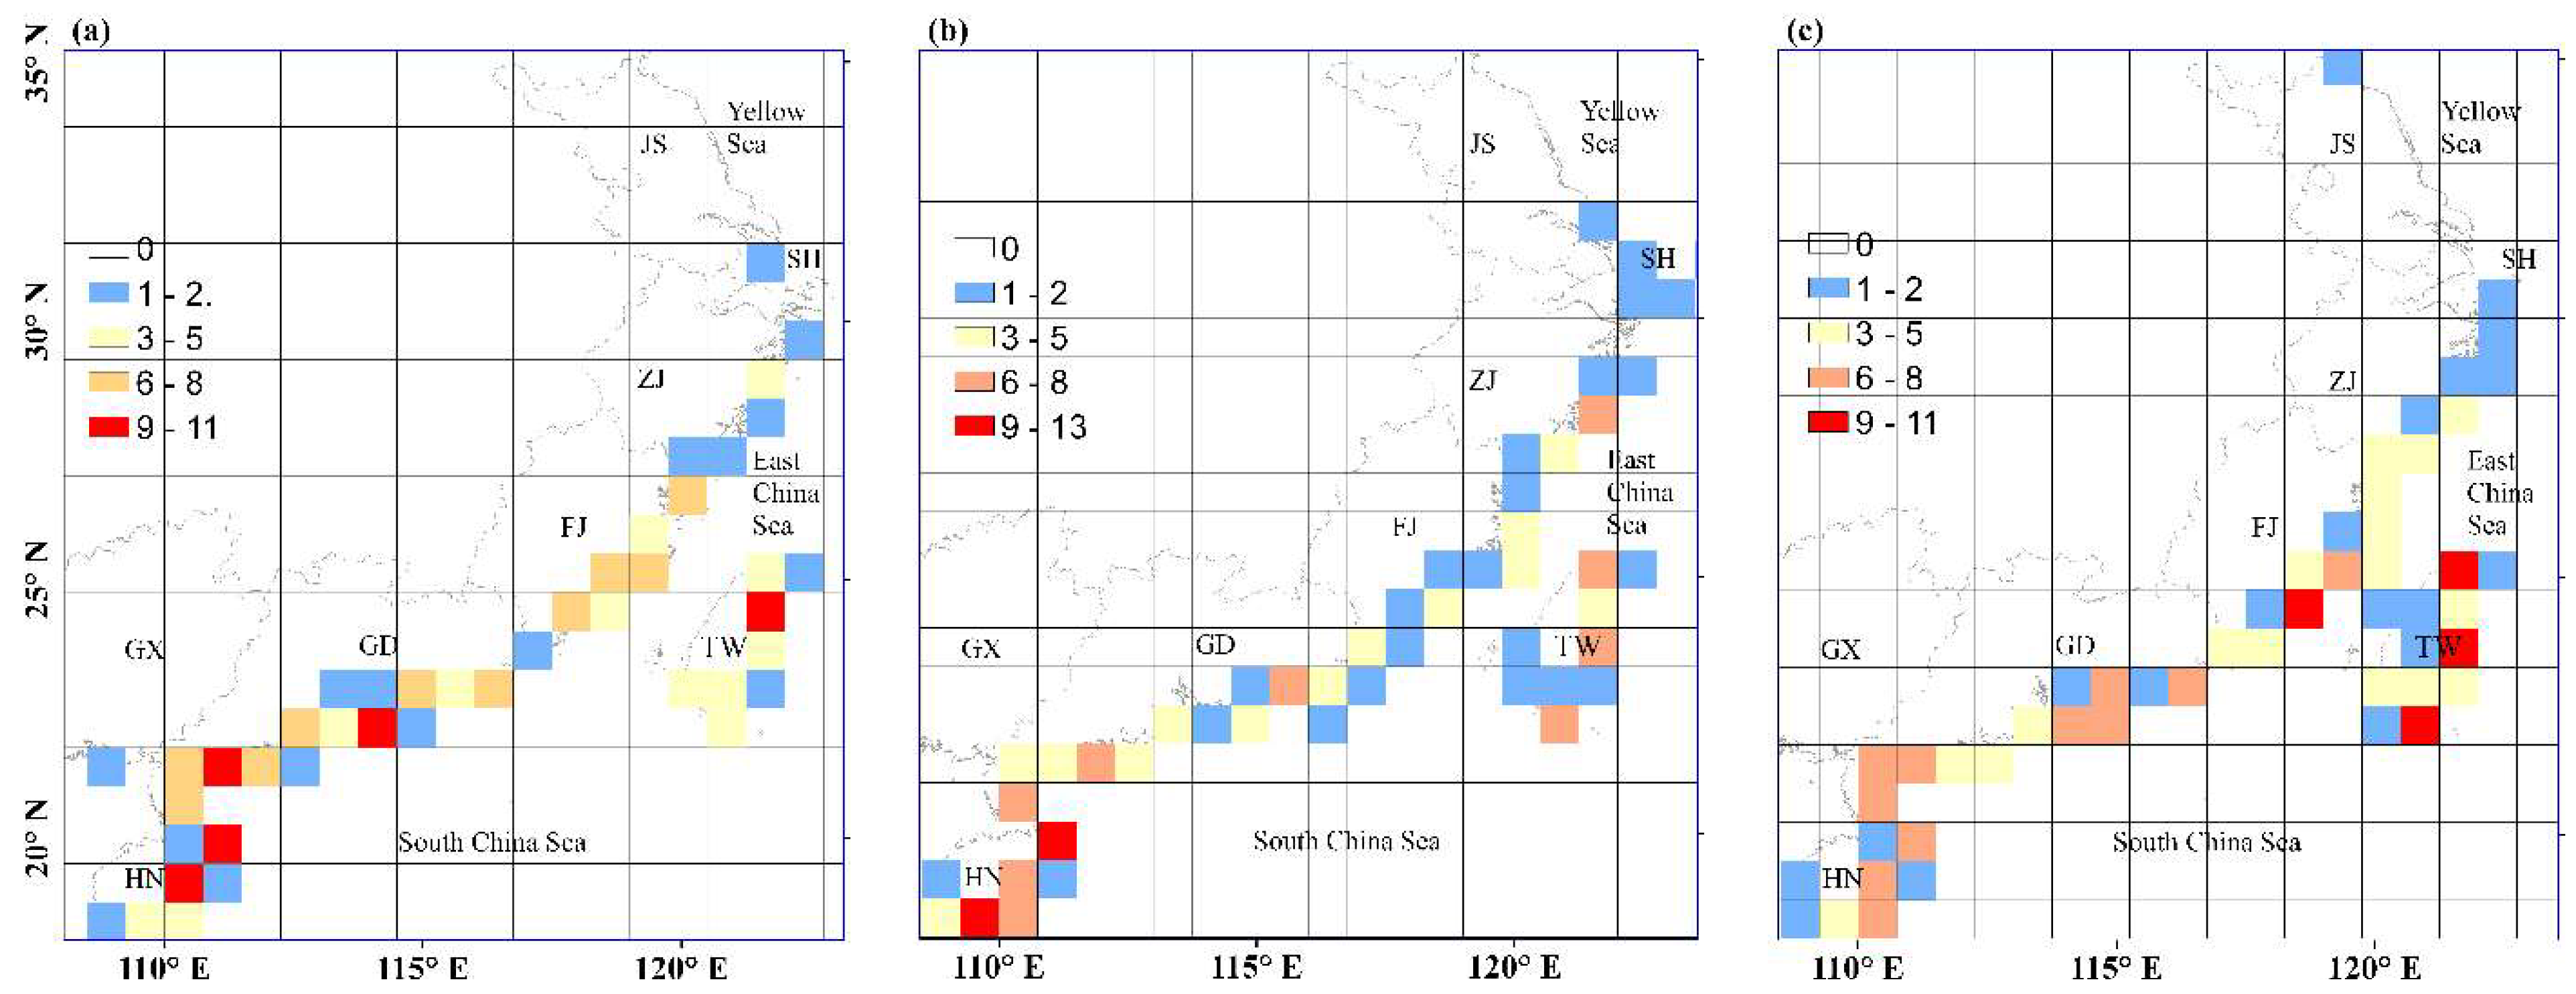
3.3. The Evolution of Spatial Distribution

In order to analyze the typical mode and evolution pattern of ASPI, we use the EOF function to decompose the annual-sum ASPI from each of the 56 tide-gauge stations in our study area. The tide stations are numbered 1 to 56 from north to south. Figure 5a,b shows the first two leading EOF modes of ASPI. The interpretation variance of these two modes are 42.6% and 25.2%, respectively, and the accumulated variance of the first two leading modes is 66.8%. The characteristic of the first leading mode exhibited a -++ zonal tripole pattern (see Figure 5a). There is one significant negative phase in the north and the positive phases are not continuous along the south coast area. The storm surge threat was small along the northern coast line from Hangzhou Gulf. The strong threat was from the center to the southern coastline of Zhejiang province and the western coastline of Guangdong province, respectively. The largest threat was on the western coastal area of Guangdong province. The corresponding principal component (PC) of the first leading mode showed decadal variation, however, the time series of the first PC is larger than the second PC time series (see Figure 5c,d). The second leading mode in Figure 5b illustrated a +- zonal dipole. The storm surge threat was large from the center to southern coastline of Zhejiang province and it was low from the coast area from the Pearl River Estuary to the western coastline of Guangdong province. The PC of the second leading mode in Figure 5d exhibited no obvious trend, however, when the PC of the first leading mode showed a large fluctuation between 1980 and 1995, the PC of the second leading mode was large. The storm surge threat was large along the center to the southern coastline of Zhejiang province in this period.
According to the above temporal pattern, we divided the entire time series into three periods. The first period is from 1960 to 1979. In this period, the time coefficient of the first leading mode was large. The second period is from 1980 to 1995. In this period, the time coefficient of the first mode fluctuated greatly, and the time coefficient of the second mode was large. The third period is from 1996 to 2015. The time coefficient of the first mode was enhanced again. We continue the EOF analysis for the annual-sum ASPI in three different periods to evaluate the spatiotemporal distribution evolution of storm surge threat along the southeastern coastline of China.
Figure 6a–d shows the first two leading modes of ASPI from 1960 to 1978. The interpretation variance of these two modes are 39.2% and 28%, respectively, and the accumulated variance of the first two leading modes is 67.2%. In this period, the first leading mode exhibited a -+ dipole pattern. The largest storm surge threat was along the southwestern coast line of Guangdong province and the smallest storm surge threat was on the coast line of Jiangsu province. The second mode of ASPI illustrated a -+ dipole pattern. This dipole pattern is different from the first one in the area with the smallest storm surge threat. The largest storm surge threat still occurred on the western coastline of Guangdong province, however, the smallest storm surge threat was along the southern coastline of Zhejiang province. The negative phase in the north and the positive phase in the southwestern coastline are a dominant mode in this period.
In the period from 1979 to 1995, the interpretation variance of these two modes are 38.1% and 26.7%, respectively, and the accumulated variance of the first two leading modes is 64.8%. The first leading mode of ASPI in Figure 7a exhibited a -+ dipole pattern. The largest storm surge threat was located on the coast area from the Pearl River Estuary to the western coastline of Guangdong province. The smallest storm surge threat was along the southern coast line of Jiangsu province. The second mode showed a -++ tripole pattern in Figure 7b. The largest storm surge threat was located on the southern coastline of Zhejiang province and the western coastline of Guangdong province. The smallest was along the northern coastline of Jiangsu province. The time coefficient of the first mode showed a large amplitude fluctuation and significantly weakened, while it was stronger in the second mode(see Figure 7c,d). It turned out that the amplitude of the -+ dipole pattern became weaker, while the -++ tripole pattern became stronger. Great changes have taken place in the spatial distribution of storm surge threat of these two leading modes. The storm surge threat along the coastline of the center to the east of Guangdong province was weaker than that of the previous period, while the threat of the center to the southern coastal area of Zhejiang province became stronger.
Figure 8 showed the EOF spatiotemporal pattern of ASPI from 1996 to 2015. The interpretation variance of these two modes are 48.7% and 23.3%, respectively, and the accumulated variance of the first two leading mode is 72%. In this period, the first mode exhibited a -++ tripole pattern along the southeastern coast line of China. The largest threat was along the center to southern coast line of Zhejiang province. The storm surge threat on the eastern costal area of Leizhou Peninsula was also large. The smallest threat was along the northern coast line of Jiangsu province. The second mode showed a +- dipole pattern. The largest threat was along the southern coast line of Zhejiang province and the smallest threat was located on the western coastline of Guangdong province. In this period, the storm surge threat became stronger along the center to the southern coastline of Zhejiang province. This stronger threat illustrated the poleward movement of storm surge threat. Meanwhile, the storm surge threat along the southwestern coastline of Guangdong province became weaker.
Figure 9 illustrates the accumulated frequency of TC landfalls in each grid along the southeastern coastline of mainland China in different periods. The spatial distribution grids show the slight decreasing trend of TC landfall in the western and southwestern coastal areas of the South China Sea. there is a slight increasing trend from the center to the southern coastal area of the East China Sea. The change of long-term TC landfall position is the main factor that affects the range of storm surge potential impact. The poleward shift of storm surge threat is associated with the increasing landfall frequency from the center to the southern coastal area of the East China Sea.
In summary, the dominant mode changes in the different patterns of the three periods. The evolution of storm surge threat showed a poleward shift and was mainly associated with TC landfall characteristics [22]. The spatial distribution of storm surge threat changed from a -+ dipole pattern in the first period (1960–1978) to a -++ tripole pattern in the most recent period (1996–2015). The storm surge threat on the coastline from the center to southern Zhejiang province became stronger in the second period (1979–1995). The storm surge threat remained strong on the western coast of Guangdong province, and especially in the western coastal area of Leizhou Peninsula from 1960 to 2015. However, it became weaker in recent decades. The smallest threat was along the northern coast of Jiangsu province.

4. Conclusion and Discussion

In this work, we proposed a new metric for quantifying storm surge potential impact, ASPI. This metric is designed as a diagnostic tool to analyze the distribution patterns of long-term storm surge threat for coastal areas. The construction of ASPI was based on anomaly nontidal impact levels. Anomaly nontidal impact levels during the TC landfall period are calculated from tide-gauge records. This method avoided interference from the astronomical tide level, local topography, dynamic impact of regional marine systems, and regional mean sea level rise. Moreover, ASPI combines frequency and intensity to estimate the long-term characteristics of storm surge threat. It was more comprehensive for the evaluation of storm surge threat evolution patterns than single parameter (intensity or frequency) analysis.
We attempted to apply the above method to the southeast coastline of China. In this study area, we have chosen tide data and time series spanning 55 years from 1960 to 2015. It was longer and more suitable for spatiotemporal analysis of the evolution of storm surge threat. Although the frequency of TC landfall along the southeastern coastline of China has decreased over the past 20 years [43,44], the TC-induced storm surge potential impact illustrated an increasing trend over the past 15 years. Consistent with previous studies, the long-term trend of annual storm surge potential impact and the average value per TC both show a significant upward trend since the end of the 1990s [44,45,46]. The upward trend of storm surge threat is primarily caused by stronger normal storm surge activities. Extreme storm surge threat did not show an increasing trend until the mid-2000s. In previous studies, mean sea level change and ocean tide were thought to contribute to storm surge threats [47,48]. ASPI is a metric that removes the signals from the regional mean sea level and tidal components, and the analysis results still reflected a significant increasing trend. Additionally, there was clear interdecadal variability in this study area.
In the present work, we selected 56 tide-gauge stations. The spatial resolution was higher than that in other studies in this area [20,21,22,28]. The highest storm surge potential impact level along the southeastern coastline of China occurs on the eastern coastline of Leizhou Peninsula. The highest increasing rate in this particular area was for the eastern coastline of Leizhou Peninsula and northern coast of Beibu Gulf. Studies of risk assessment or statistical analysis of storm surge based on simulated maximum surge elevations have shown the same spatial distribution of hazard levels on Leizhou Peninsula. However, the difference in calculation function and intensity index of evaluation caused some discrepancies in Hainan Island [28]. The second highest area of ensemble storm surge potential impact was on the coast area between southern Hangzhou Gulf and Xiamen port. The increasing rate was significant but lower than the highest rate. This area exhibited an increasing trend that was larger than any of the other coastal areas. In contrast, the area on the northern coastline of Jiangsu province, the small area on the southeastern coastline of Guangdong province, and the eastern coastline of Hainan Island showed a slightly decreasing trend at the same time, which is not significant. This trend might be a decadal fluctuation of storm surge potential impact in these areas. The metric still has limitations regarding spatial sampling, especially when the coastal topography is complex and variable.
At last, we use the EOF function analyze the primary mode and evolution pattern of storm surge threat. The first leading mode exhibited a -++ zonal tripole pattern along the southeastern coastline of China. This primary mode illustrated that the storm surge threat was small along the northern coastline of Hangzhou Gulf, while the strongest threat was along the center to southern coast line of Zhejiang province and the southwestern coast line of Guangdong province. We found that the dominant mode changes in different patterns in the three periods. The spatial distribution of storm surge threat changed from a -+ dipole pattern in the first period (1960–1978) to a -++ tripole pattern in the most recent period (1996–2015). The storm surge threat on the coast line from the center to southern Zhejiang province became stronger from the second period (1979–1995). The large threat along the southwestern coastline of Guangdong province, especially the eastern coastal area of Leizhou Peninsula, was the strongest threat along the entire coastline of China in the first two periods and has become weaker in recent decades.
The spatial evolution of storm surge threat showed a poleward shift and was mainly associated with TC landfall characteristics [22]. The evolution of storm surge threat pattern was primarily controlled by long-term changes of TC characteristics. Therefore, further research is needed to understand the links between TC factors and increasing trends and the regional distribution patterns found in this study, which should consider both TC features and large-scale environmental aspects to account for the impacts of global climate change on storm surge activities.

Author Contributions

Conceptualization, Y.Z. and G.L.; methodology, Y.Z.; software, Y.Z.; validation, Y.Z.; formal analysis, Y.Z.; investigation, Y.Z. and T.G.; resources, Y.Z.; data curation, Y.Z., T.G.; writing—original draft preparation, Y.Z.; writing—review and editing, G.L., T.G.; visualization, Y.Z.; supervision, G.L.; project administration, G.L.; funding acquisition, G.L.

Funding

This research was funded by the National Natural Science Foundation of China, grant number are: 41871026, and 41571041.

Acknowledgments

This work is sponsored by the National Natural Science Foundation of China (grants 41871026, and 41571041). We very much appreciated two anonymous reviewers for their meticulous and valuable reviews. We thank Hui Peng and Mo Wang for their valuable suggestions.

Conflicts of Interest

The authors declare no conflict of interest. The funders had no role in the design of the study; in the collection, analyses, or interpretation of data; in the writing of the manuscript, or in the decision to publish the results.

References

  1. State Oceanic Administration of China. Marine Disaster Bulletin. 1989–2017. Available online: http://www.coi.gov.cn/gongbao/zaihai/ (accessed on 18 July 2018).
  2. Hallegatte, S.; Green, C.; Nicholls, R.J.; Corfee-Morlot, J. Future flood losses in major coastal cities. Nat. Clim. Chang. 2013, 3, 802–806. [Google Scholar] [CrossRef]
  3. Dasgupta, S.; Laplante, B.; Murray, S.; Wheeler, D. Climate Change and the Future Impacts of Storm-Surge Disasters in Developing Countries; Policy Research Working Paper; Center for Global Development 182, The World Bank Development Research Group Environment and Energy Team: Washington, DC, USA, 2009. [Google Scholar]
  4. Walsh, K.J.E.; McBride, J.L.; Klotzbach, P.J.; Balachandran, S.; Camargo, S.J.; Holland, G.; Knutson, T.R.; Kossin, J.P.; Lee, T.C.; Sobel, A.; et al. Tropical cyclones and climate change. WIREs Clim. Chang. 2016, 7, 65–89. [Google Scholar] [CrossRef]
  5. Bromirski, P.D.; Flick, R.E.; Miller, A.J. Storm surge along the Pacific coast of North America. J. Geophys. Res. Oceans 2017, 122, 441–457. [Google Scholar] [CrossRef]
  6. Marsooli, R.; Lin, N. Numerical Modeling of Historical Storm Tides and Waves and Their Interactions Along the US East and Gulf Coasts. J. Geophys. Res. Oceans 2018, 123, 3844–3874. [Google Scholar] [CrossRef]
  7. Menendez, M.; Woodworth, P.L. Changes in extreme high water levels based on a quasi-global tide-gauge data set. J. Geophys. Res. Oceans 2010, 115. [Google Scholar] [CrossRef] [Green Version]
  8. De Vries, H.; Breton, M.; de Mulder, T.; Krestenitis, Y.; Ozer, J.; Proctor, R.; Ruddick, K.; Salomon, J.C.; Voorrips, A. A comparison of 2D storm surge models applied to three shallow European seas. Environ. Softw. 1995, 10, 23–42. [Google Scholar] [CrossRef]
  9. Williams, J.; Horsburgh, K.J.; Williams, J.A.; Proctor, R.N.F. Tide and skew surge independence: New insights for flood risk. Geophys. Res. Lett. 2016, 43, 6410–6417. [Google Scholar] [CrossRef] [Green Version]
  10. Grinsted, A.; Moore, J.C.; Jevrejeva, S. Homogeneous record of Atlantic hurricane surge threat since 1923. Proc. Natl. Acad. Sci. USA 2012, 109, 19601–19605. [Google Scholar] [CrossRef] [Green Version]
  11. Marcos, M.; Calafat, F.M.; Berihuete, A.; Dangendorf, S. Long-term variations in global sea level extremes. J. Geophys. Res. Oceans 2015, 120, 8115–8134. [Google Scholar] [CrossRef] [Green Version]
  12. Marcos, M.; Woodworth, P.L. Spatiotemporal changes in extreme sea levels along the coasts of the North Atlantic and the Gulf of Mexico. J. Geophys. Res. Oceans 2017, 122, 7031–7048. [Google Scholar] [CrossRef] [Green Version]
  13. Haigh, I.; Nicholls, R.; Wells, N. Assessing changes in extreme sea levels: Application to the English Channel, 1900-2006. Cont. Shelf Res. 2010, 30, 1042–1055. [Google Scholar] [CrossRef]
  14. Pugh, D.T. Estimating Extreme Currents by Combining Tidal and Surge Probabilities. Ocean Eng. 1982, 9, 361–372. [Google Scholar] [CrossRef]
  15. Bilskie, M.V.; Hagen, S.C.; Medeiros, S.C.; Cox, A.T.; Salisbury, M.; Coggin, D. Data and numerical analysis of astronomic tides, wind-waves, and hurricane storm surge along the northern Gulf of Mexico. J. Geophys. Res. Oceans 2016, 121, 3625–3658. [Google Scholar] [CrossRef] [Green Version]
  16. Wu, W.Y.; Westra, S.; Leonard, M. A basis function approach for exploring the seasonal and spatial features of storm surge events. Geophys. Res. Lett. 2017, 44, 7356–7365. [Google Scholar] [CrossRef]
  17. Needham, H.F.; Keim, B.D.; Sathiaraj, D. A review of tropical cyclone-generated storm surges: Global data sources, observations, and impacts. Rev. Geophys. 2015, 53, 545–591. [Google Scholar] [CrossRef] [Green Version]
  18. Feng, J.L.; Li, D.L.; Wang, H.; Liu, Q.L.; Zhang, J.L.; Li, Y.; Liu, K.X. Analysis on the Extreme Sea Levels Changes along the Coastline of Bohai Sea, China. Atmosphere 2018, 9, 324. [Google Scholar] [CrossRef]
  19. Maskey, S. Flood risk in the changing climate. J. Flood Risk Manag. 2018, 11, 109–110. [Google Scholar] [CrossRef]
  20. Feng, J.L.; von Storch, H.; Jiang, W.S.; Weisse, R. Assessing changes in extreme sea levels along the coast of China. J. Geophys. Res. Oceans 2015, 120, 8039–8051. [Google Scholar] [CrossRef] [Green Version]
  21. Feng, X.B.; Tsimplis, M.N. Sea level extremes at the coasts of China. J. Geophys. Res. Oceans 2014, 119, 1593–1608. [Google Scholar] [CrossRef] [Green Version]
  22. Oey, L.Y.; Chou, S. Evidence of rising and poleward shift of storm surge in western North Pacific in recent decades. J. Geophys. Res. Oceans 2016, 121, 5181–5192. [Google Scholar] [CrossRef]
  23. Knapp, K.R.; Kruk, M.C.; Levinson, D.H.; Diamond, H.J.; Neumann, C.J. The International Best Track Archive For Climate Stewardship(IBTrACS) Unifying Tropical Cyclone Data. Bull. Am. Meteorol. Soc. 2010, 91, 363–376. [Google Scholar] [CrossRef]
  24. Kossin, J.P.; Emanuel, K.A.; Vecchi, G.A. The poleward migration of the location of tropical cyclone maximum intensity. Nature 2014, 509, 349–352. [Google Scholar] [CrossRef] [PubMed]
  25. Kossin, J.P. Hurricane intensification along United States coast suppressed during active hurricane periods. Nature 2017, 541, 390–393. [Google Scholar] [CrossRef] [PubMed]
  26. Kossin, J.P. A global slowdown of tropical-cyclone translation speed. Nature 2018, 558, 104–107. [Google Scholar] [CrossRef] [PubMed]
  27. Romero, R.; Emanuel, K. Climate Change and Hurricane-Like Extratropical Cyclones: Projections for North Atlantic Polar Lows and Medicanes Based on CMIP5 Models. J. Clim. 2017, 30, 279–299. [Google Scholar] [CrossRef] [Green Version]
  28. Gao, Y.; Wang, H.; Liu, G.M.; Sun, X.Y.; Fei, X.Y.; Wang, P.T.; Lv, T.T.; Xue, Z.S.; He, Y.W. Risk assessment of tropical storm surges for coastal regions of China. J. Geophys. Res. Atmos. 2014, 119, 5364–5374. [Google Scholar] [CrossRef] [Green Version]
  29. Shi, X.W.; Gao, T.; Tan, J.; Guo, Z.X. Research on Occurrence Frequency of Storm Surge Disaster Distribution in the Coastal Areas of China. J. Catastrophol. 2018, 33, 49–52. (In Chinese) [Google Scholar]
  30. Munroe, R.; Curtis, S. Storm surge evolution and its relationship to climate oscillations at Duck, NC. Theor. Appl. Climatol. 2017, 129, 185–200. [Google Scholar] [CrossRef]
  31. Department of Hydrology Ministry of Water Resources the People‘s Republic of China. Annual Hydrological Report; The Ministry of Water Resources of China: Beijing, China, 1960–2015; Volumes 5–8.
  32. Caldwell, P.C.; Merrifield, M.A.; Thompson, P.R. Sea Level Measured by Tide Gauges from Global Oceans—The Joint Archive for Sea Level Holdings (NCEI Accession 0019568), version 5.5; NOAA, National Centers for Environmental Information: Asheville, NC, USA, 2015. [Google Scholar] [CrossRef]
  33. Yu, F.J.; Dong, J.X. Collection of Storm Surge Disasters Historical Data in China 1949–2009; China Ocean Press: Beijing, China, 2015; Volumes 1–2. [Google Scholar]
  34. Hou, J.; Yu, F.; Yuan, Y.; Fu, X. Spatial and temporal distribution of red tropical storm surge disasters in China. Mar. Sci. Bull. 2011, 30. [Google Scholar]
  35. JMA. RSMC Tropical Cyclone Best Track Data. 1951–2017. Available online: http://www.jma.go.jp/jma/jma-eng/jma-center/rsmc-hp-pub-eg/RSMC_HP.htm (accessed on 25 March 2018).
  36. Pugh, D.; Woodworth, P.L. Sea-Level Science: Understanding Tides, Surges, Tsunamis and Mean Sea-Level Changes; Cambridge University Press: Cambridge, UK, 2014; pp. 400–410. [Google Scholar]
  37. Zhang, K.Q.; Douglas, B.C.; Leatherman, S.P. Twentieth-century storm activity along the US east coast. J. Clim. 2000, 13, 1748–1761. [Google Scholar] [CrossRef]
  38. Haigh, I.D.; Nicholls, R.; Wells, N. A comparison of the main methods for estimating probabilities of extreme still water levels. Coast. Eng. 2010, 57, 838–849. [Google Scholar] [CrossRef]
  39. Cid, A.; Menéndez, M.; Castanedo, S.; Abascal, A.J.; Méndez, F.J.; Medina, R. Long-term changes in the frequency, intensity and duration of extreme storm surge events in southern Europe. Clim. Dyn. 2016, 46, 1503–1516. [Google Scholar] [CrossRef]
  40. Bell, G.D.; Halpert, M.S.; Schnell, R.C.; Higgins, R.W.; Lawrimore, J.; Kousky, V.E.; Tinker, R.; Thiaw, W.; Chelliah, M.; Artusa, A. Climate assessment for 1999. Bull. Am. Meteorol. Soc. 2000, 81, S1–S50. [Google Scholar] [CrossRef]
  41. Mei, W.; Xie, S.P. Intensification of landfalling typhoons over the northwest Pacific since the late 1970s. Nat. Geosci. 2016, 9, 753–757. [Google Scholar] [CrossRef]
  42. WU, L.G.; Wang, B.; Geng, S.Q. Growing typhoon influence on east Asia. Geophys. Res. Lett. 2005, 32. [Google Scholar] [CrossRef] [Green Version]
  43. Ren, F.M.; Wu, G.X.; Dong, W.J.; Wang, X.L.; Wang, Y.M.; Ai, W.X.; Li, W.J. Changes in tropical cyclone precipitation over China. Geophys. Res. Lett. 2006, 33. [Google Scholar] [CrossRef] [Green Version]
  44. Knutson, T.R.; McBride, J.L.; Chan, J.; Emanuel, K.; Holland, G.; Landsea, C.; Held, I.; Kossin, J.P.; Srivastava, A.K.; Sugi, M. Tropical cyclones and climate change. Nat. Geosci. 2010, 3, 157–163. [Google Scholar] [CrossRef] [Green Version]
  45. Lee, B.S.; Haran, M.; Keller, K. Multidecadal Scale Detection Time for Potentially Increasing Atlantic Storm Surges in a Warming Climate. Geophys. Res. Lett. 2017, 44, 10617–10623. [Google Scholar] [CrossRef]
  46. Vousdoukas, M.I.; Voukouvalas, E.; Annunziato, A.; Giardino, A.; Feyen, L. Projections of extreme storm surge levels along Europe. Clim. Dyn. 2016, 47, 3171–3190. [Google Scholar] [CrossRef] [Green Version]
  47. Woodworth, P.L.; Menendez, M.; Gehrels, W.R. Evidence for Century-Timescale Acceleration in Mean Sea Levels and for Recent Changes in Extreme Sea Levels. Surv. Geophys. 2011, 32, 603–618. [Google Scholar] [CrossRef] [Green Version]
  48. Wahl, T.; Chambers, D.P. Evidence for multidecadal variability in US extreme sea level records. J. Geophys. Res. Oceans 2015, 120, 1527–1544. [Google Scholar] [CrossRef] [Green Version]
Figure 1. The definition of storm surge caused anomaly nontidal impact level (on the TC landfall day)
Atmosphere 10 00061 g001
Figure 2. Time series of (a) annual-sum ASPI, (b) frequency of landfall TCs along the southeastern coastline of China from 1960 to 2015, derived from Japan Meteorological Agency (JMA). Thick black lines are the 5-year running average with the red line schematically indicating trends. Shading shows 95% confidence bounds. Dotted black line in (b) is the average frequency of landfall TCs.
Atmosphere 10 00061 g002
Figure 3. Time series of (a) yearly average ASPI per TC, (b) annual-summation extreme ASPI, (c) annual frequency of extreme ASPI along southeastern coastline of China from 1960 to 2015. Thick lines are the 5-year running average with the red line schematically indicating trends. Shading shows 95% confidence bounds.
Atmosphere 10 00061 g003aAtmosphere 10 00061 g003b
Figure 4. (a) Sum of ASPI in each tide-gauge station from 1960 to 2015. (b) ASPI trend of individual tide-gauge stations along the southeastern coastline of China from the 1990s. Square marks indicate that the p-value of the increasing rate is smaller than 0.05. The capital letters represent the names of the coastal provinces: JS—Jiangsu, SH—Shanghai, ZJ—Zhejiang, FJ—Fujian, TW—Taiwan, GD—Guangdong, GX—Guangxi, HN—Hainan.
Atmosphere 10 00061 g004
Figure 5. (a–d) The first two leading EOF modes of ASPI and corresponding principal components (PCs) from 1960 to 2015.
Atmosphere 10 00061 g005
Figure 6. (a–d) The first two leading EOF modes and the PCs of ASPI during the period of 1960–1978
Atmosphere 10 00061 g006
Figure 7. (a–d) The first two leading EOF modes and the PCs of ASPI during the period of 1979–1995
Atmosphere 10 00061 g007
Figure 8. (a–d) The first two leading EOF modes and the PCs of ASPI during the period of 1996–2015
Atmosphere 10 00061 g008
Figure 9. The spatial distribution grid of TC landfall positions in (a) 1960–1978, (b) 1979–1994, and (c) 1995–2016.
Atmosphere 10 00061 g009

