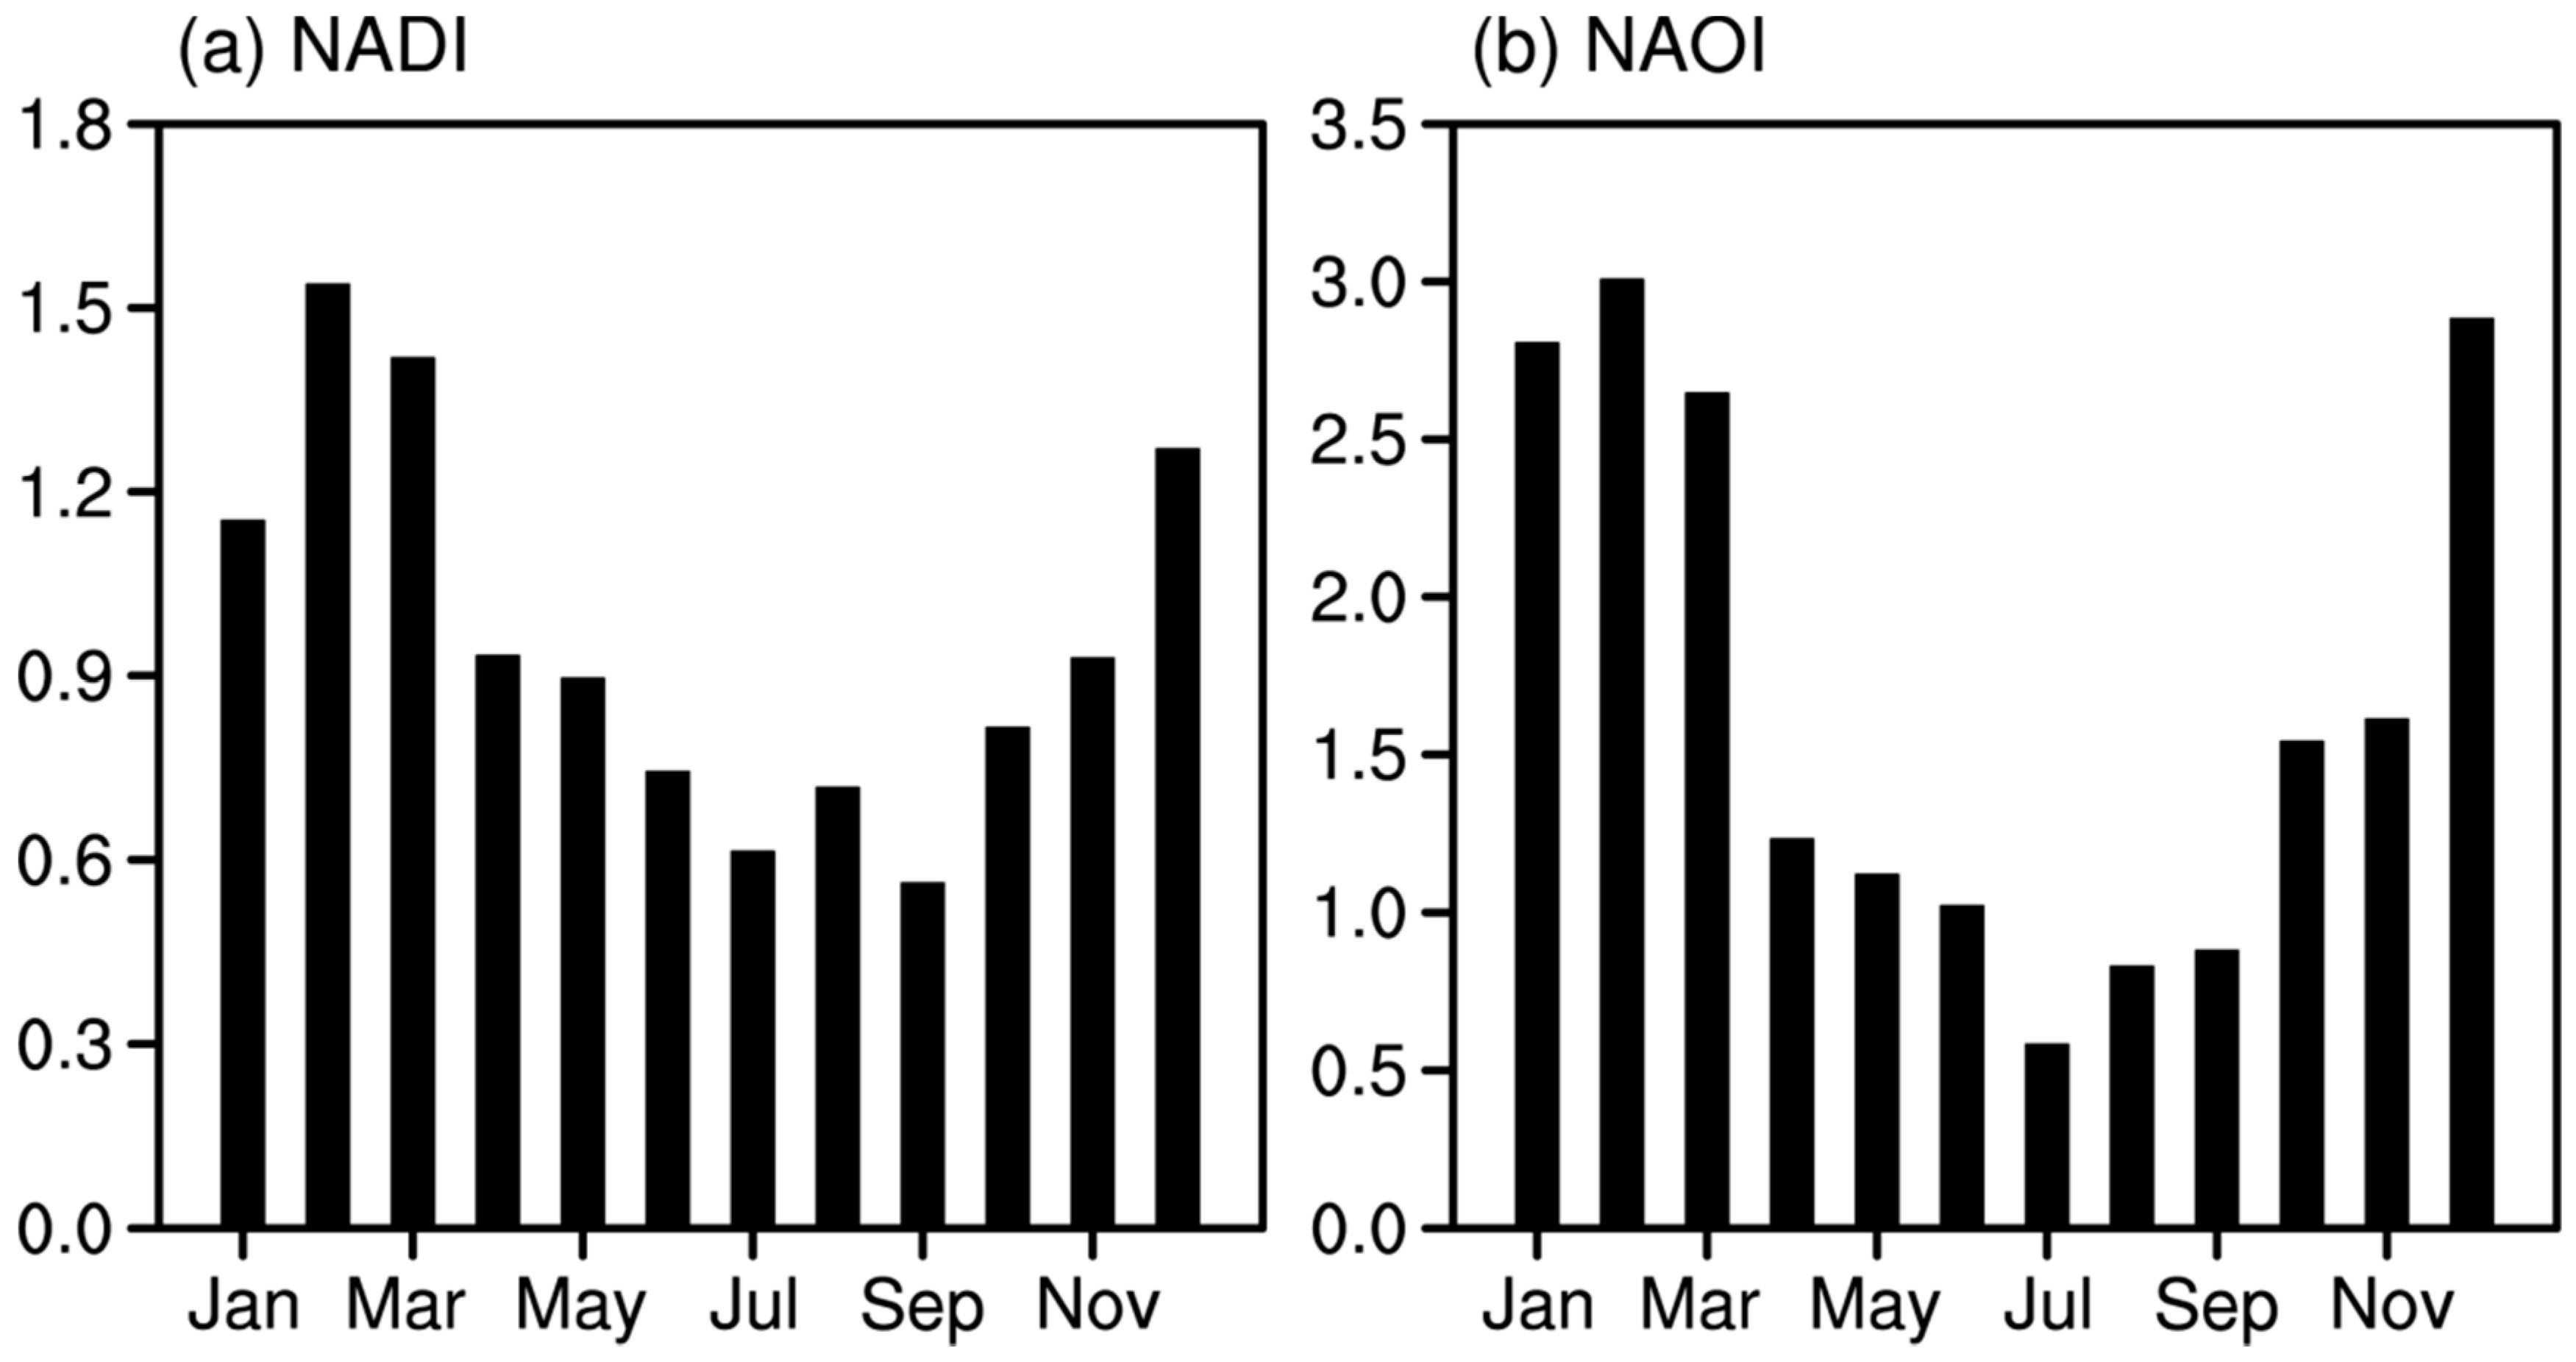
1. Introduction
The North Atlantic Oscillation (NAO) is the dominant mode of atmospheric circulation variability over the North Atlantic sector, and it has long been recognized as a large-scale south–north seesaw in atmosphere pressure, between the Azores High in the South and the Icelandic Low in the North. A positive (negative) NAO indicates that the intensity of both the Icelandic Low and the Azores High are simultaneously enhanced (weakened) [
1,
2,
3,
4,
5,
6]. The NAO occurs throughout the year, but it is most pronounced during the northern winter [
7,
8]. A number of previous studies have demonstrated that the NAO has a strong influence on regional weather and climate variation over the northern hemisphere. For instance, the NAO not only directly affects regional distributions of surface temperature and precipitation over the North Atlantic and its adjacent land areas, including North America, North Africa, and Europe [
5,
9,
10,
11,
12,
13], but also affects East Asia via air–sea interactions [
14,
15,
16]. Furthermore, many studies have also indicated that the associations of the NAO with Arctic sea ice variability and Northern Hemisphere ozone are significant [
17,
18,
19,
20,
21]. In addition, the NAO forces the tripole pattern of sea surface temperature (SST) anomalies in the North Atlantic during winter via a change in the air–sea heat flux, as has been described in previous studies [
21,
22]. The tripole pattern is characterized by a positive SST anomaly to the east of the United States along 35° N, and a negative SST anomaly to the northeast and southeast respectively [
13,
23,
24]. This tripole pattern is also the leading pattern of SST variability during winter over the North Atlantic, and has been verified by many observations and coupled ocean–atmosphere models [
25,
26].
A recent study by Ding et al. [
27] reported that there is a south–north dipole pattern of sea level pressure (SLP) anomalies over the western tropical North Atlantic and northeastern North America, which they called the North American dipole (NAD). The positive NAD pattern manifests as positive SLP anomalies in the western tropical North Atlantic, and as negative SLP anomalies over northeastern North America. In contrast to the NAO, both the wintertime NAD and NAO have a dipole distribution of SLP anomalies over the North Atlantic, but the activity center of the NAD is more westward and closer to the North Pacific than that of the NAO. As a result, the NAD is more closely related to the central Pacific (CP)-type El Niño, whose maximum positive SST anomalies are located in the central equatorial Pacific [
28,
29]. Ding et al. [
27] demonstrated that the wintertime NAD can induce spring SST cooling in the northern tropical Atlantic (NTA; 85° W–20° E, 0–15° N), which in turn affects the development of the Pacific meridional mode (PMM) [
30] through the subtropical teleconnection mechanism (STM) proposed by Ham et al. [
31]. Through the wind-evaporation-SST (WES) feedback [
32], the SST warming associated with the PMM over the northern subtropical Pacific extends southwestward and reaches the central equatorial Pacific during summer, finally leading to a CP-type El Niño event. Therefore, the NAD may serve as a unique precursor signal for the CP-type El Niño.
Given that both the NAD and NAO influence the NTA SST, it would be interesting to investigate the differences between their spatial characteristics, temporal variation, and climatic effects. In a previous study, Ding et al. [
27] presented a preliminary discussion of the differences between the NAD and NAO, but these differences are still not fully understood. Therefore, the purpose of this study is to explore the differences between them in greater depth. The remainder of this paper is organized as follows: A description of our datasets and methodology is presented in
Section 2;
Section 3 compares the spatial features, temporal variations, and climatic impacts of the NAD and NAO; a summary and discussion are provided in
Section 4.
3. Results
We will first examine the differences in the spatial structure of the NAD and NAO.
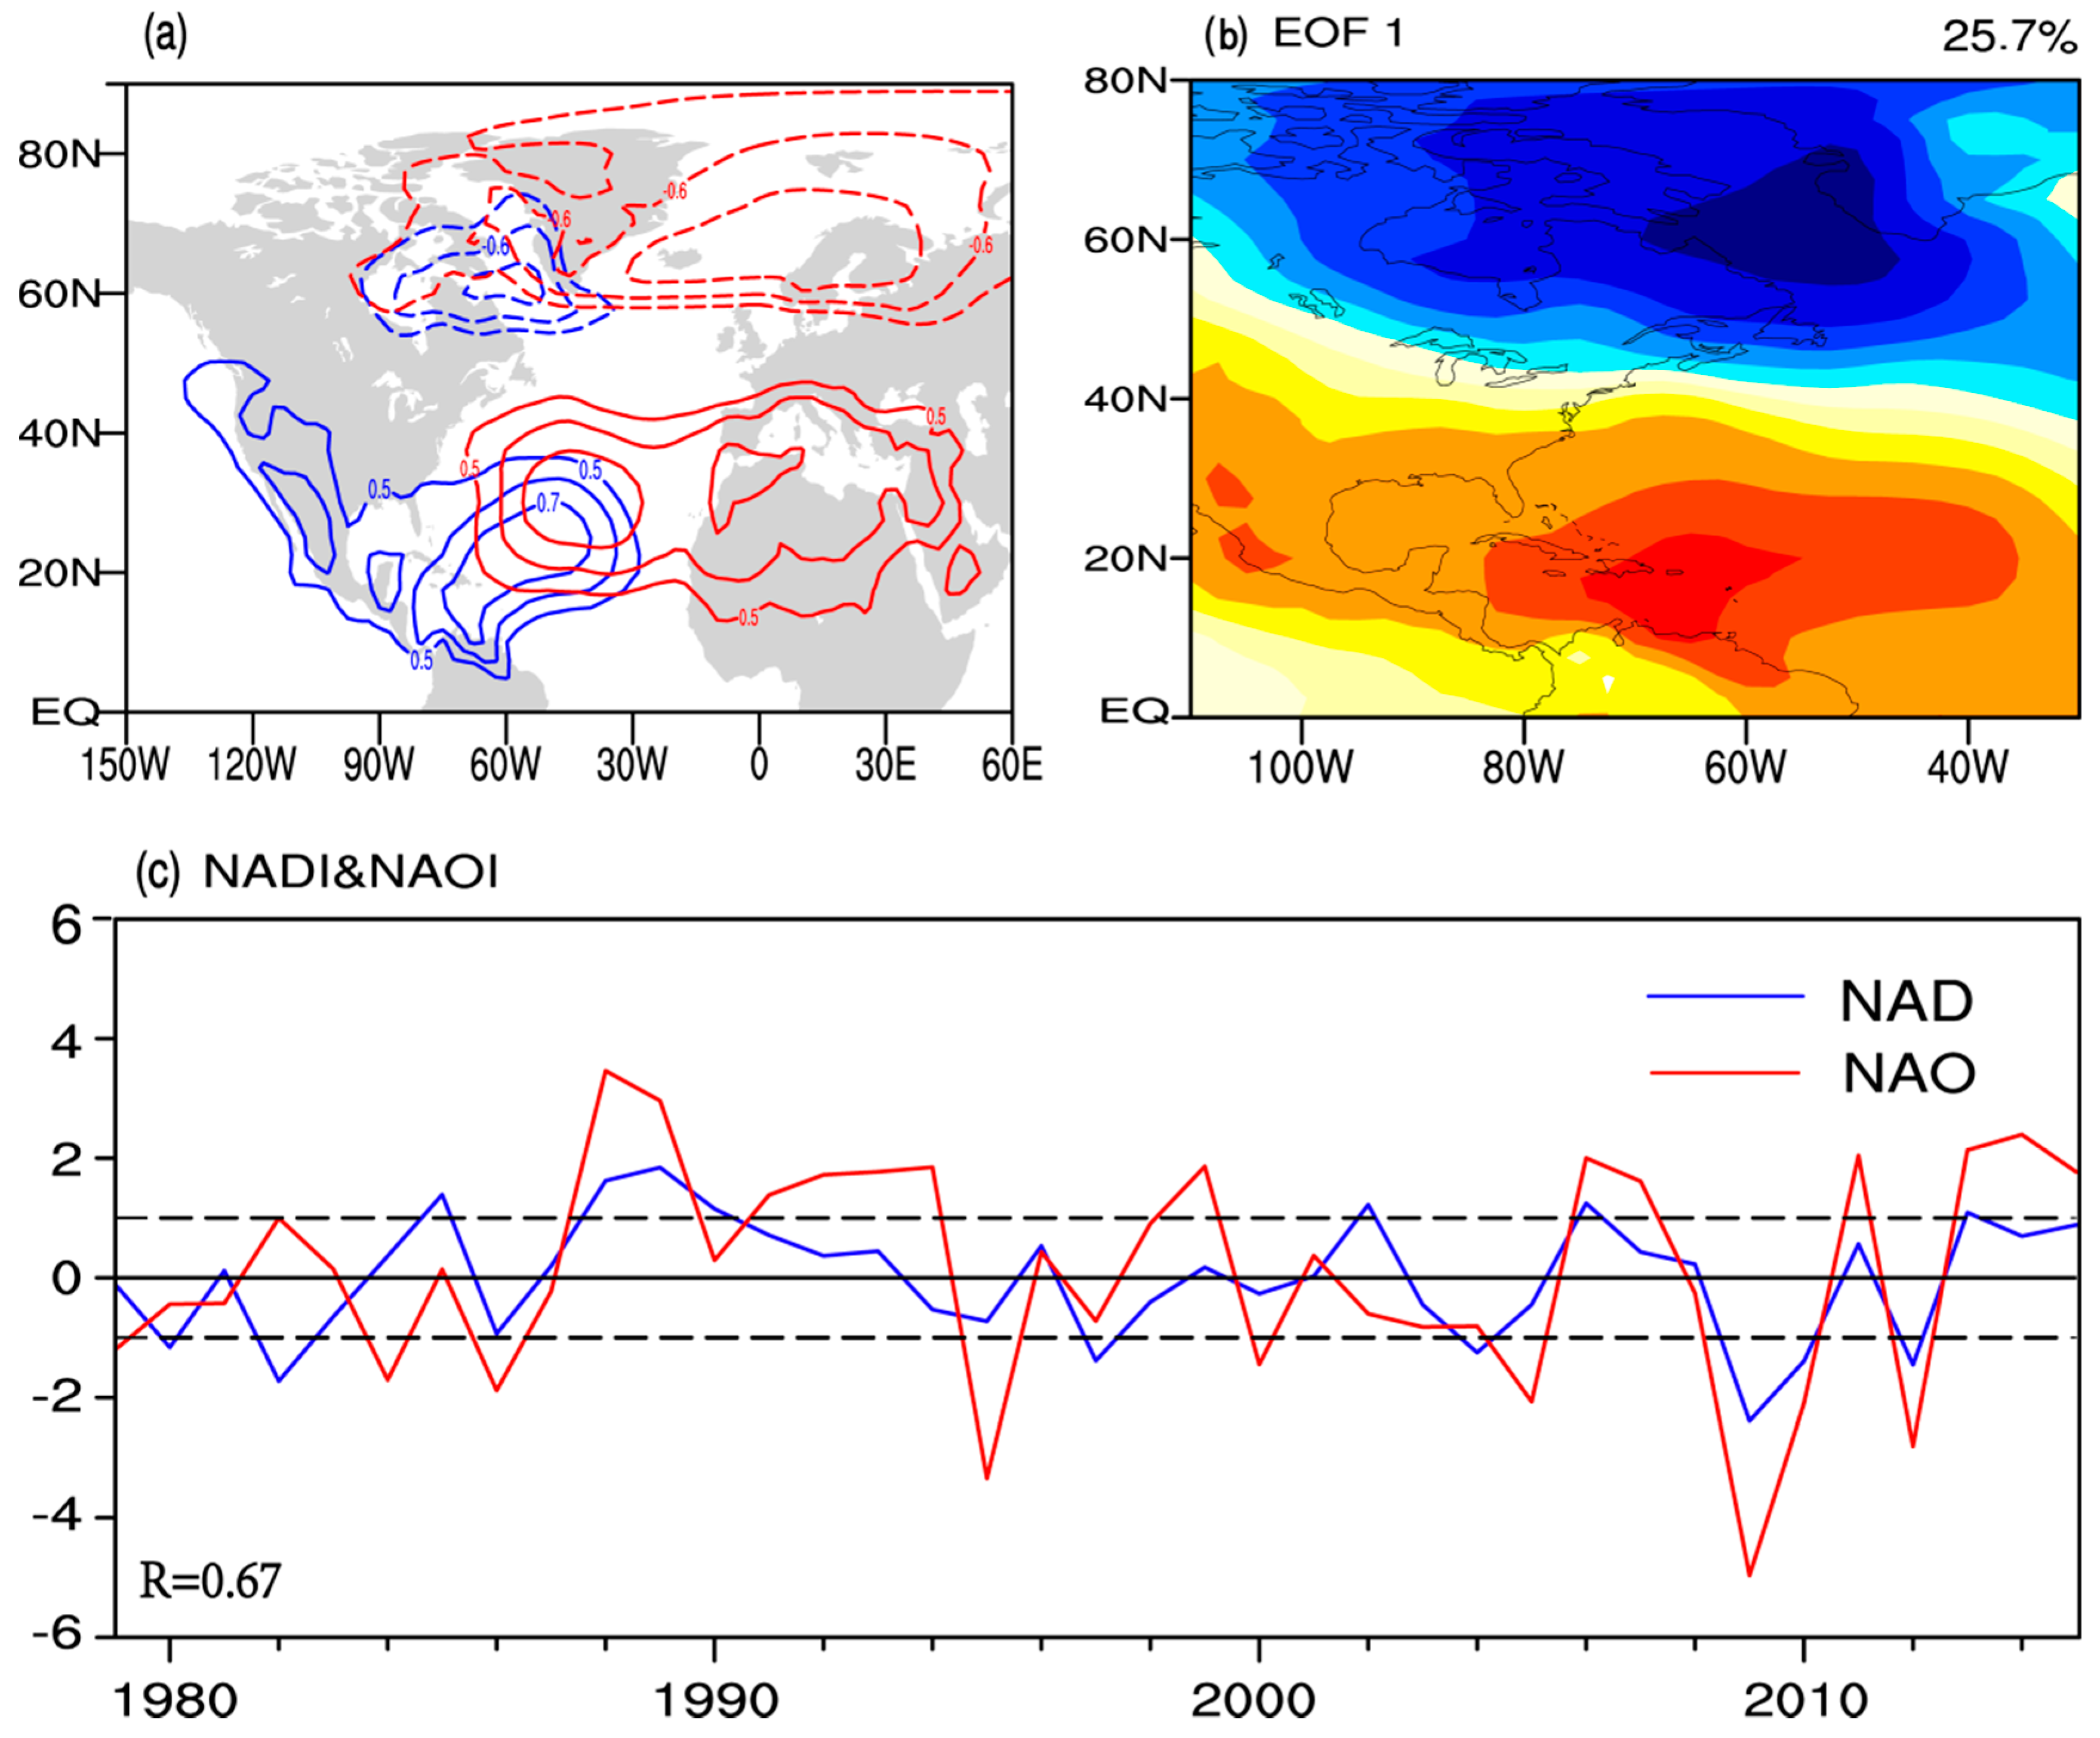
Figure 2 shows the correlation between the spatial pattern of the DJFM-averaged SLP anomaly and the simultaneous NADI and NAOI. We note that although the SLP patterns associated with the NAD and NAO overlap in some regions of North America and the North Atlantic, they also show some differences. The NAD-related SLP anomalies are located mainly between northeastern North America and western tropical North Atlantic, whereas the NAO-related SLP anomalies are located mainly across most of northwestern Europe, subtropical North Atlantic, and North Africa. Moreover, the two maximum SLP anomaly centers of the NAD are more west and south than those associated with the NAO.
We also performed empirical orthogonal function (EOF) analysis [
3] of the DJFM-averaged SLP anomalies from the western tropical North Atlantic to North America (110–30° W, 0–80° N) after linearly removing the effects of the NAO and El Niño–Southern Oscillation (ENSO) (represented by the simultaneous Niño3.4 SST;
Figure 1b). The leading EOF mode (EOF1; 25.7% explained variance) closely resembles the NAD pattern, and its positive and negative loading centers correspond exactly to the southern and northern poles of the NAD, respectively. These results suggest that, although the NAO and ENSO signals are removed, the NAD-like pattern still persists.
Next, we compare the temporal variations of the NAD and NAO.
Figure 2c presents the normalized time series of the DJFM-averaged NADI (blue line) and NAOI (red line) for the period 1979–2016. The correlation coefficient between the NADI and NAOI is 0.67 (at the 99.9% confidence level). However, although the NADI is strongly correlated to the NAOI, the NAD also has its own variability independent of the NAO. To demonstrate this, we classify all NAD and NAO events into the strongly positive and negative events during the period 1979–2016. A strongly positive or strongly negative NAD (NAO) event is defined as a year when its index was greater than 1.0 with positive standard deviation (>1.0) or less than 1.0 with negative standard deviation (<−1.0), while years that fell outside these criteria were labelled ‘no NAO’ or ‘no NAD’ (
Table 1). Only four positive NAD events (1988, 1989, 2006, and 2013) and three negative NAD events (2009, 2010, and 2012) occurred simultaneously with strong NAO events. The remaining three positive (1985, 1990, and 2002) and four negative (1980, 1982, 1997, and 2004) NAD events were not accompanied by strong NAO events. In particular, 2002 was a year in which the NADI was 1.2 (one of the strongly positive NAD events), while the NAOI was −0.6. In addition, 1982 was a typical year in which a strongly negative NAD event was accompanied by a strongly positive NAO event (the NADI and NAOI were −1.7 and 1.0, respectively). This result indicates that the fluctuations of the NAD are not completely consistent with those of the NAO, and that the NAD has its own temporal variability that is independent of the NAO.
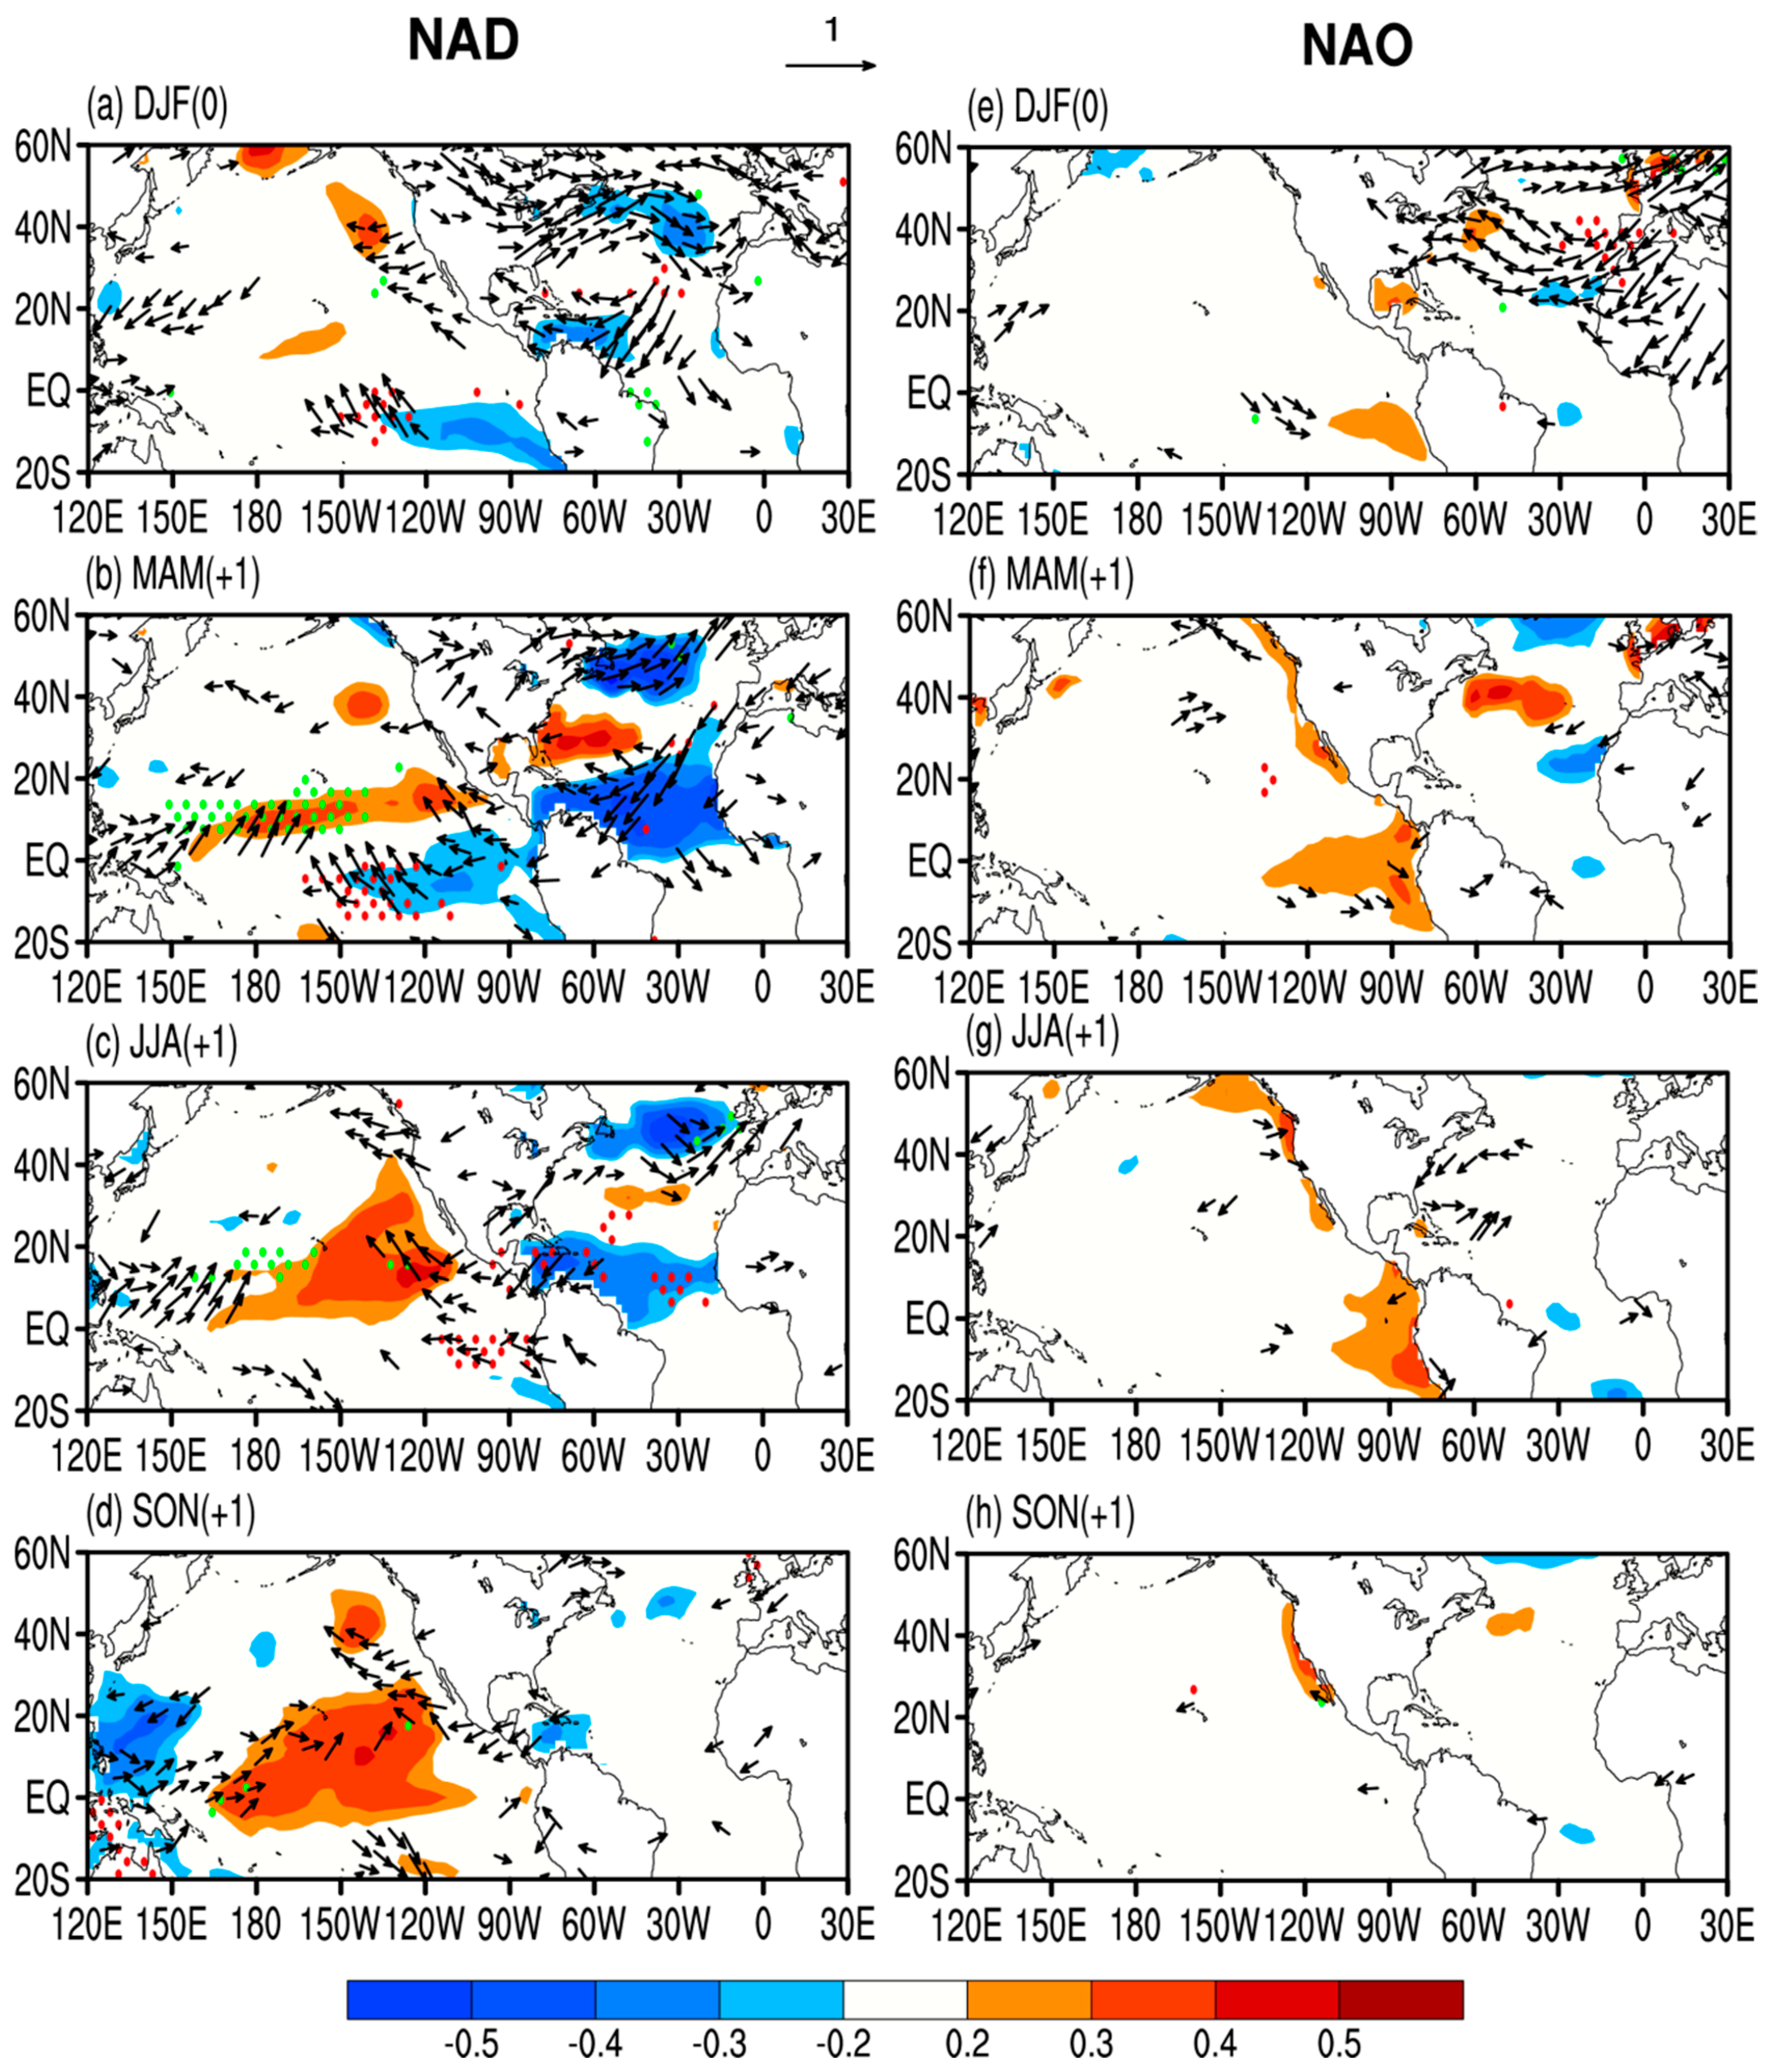
The above analyses show that there are differences in the spatial patterns and temporal variability of the NAD and NAO, and these differences may be the cause of their differing climatic impacts. Consequently, we next consider the seasonal evolution of climatic impacts. The maps showing the correlation of the three-month-averaged SST, surface wind, and precipitation anomalies with the NADI and NAOI for the December–February (DJF) concurrent with the two indices, and several lead times (March–May: MAM, June–August: JJA, and September–November: SON) are shown in
Figure 3. Note that although there are some similarities among the correlation maps, the differences are also obvious.
In the North Atlantic, both the NAD and NAO can force a tripole-like SST anomaly pattern by changing the latent heat flux in winter (DJF;
Figure 3a,e) and spring (MAM;
Figure 3b,f). However, there are some differences between their related tripole-like SST anomaly patterns. For example, the NAD has more significant correlations in the western North Atlantic than does the NAO. In particular, the major difference is in the NTA region (indicated by the red box in
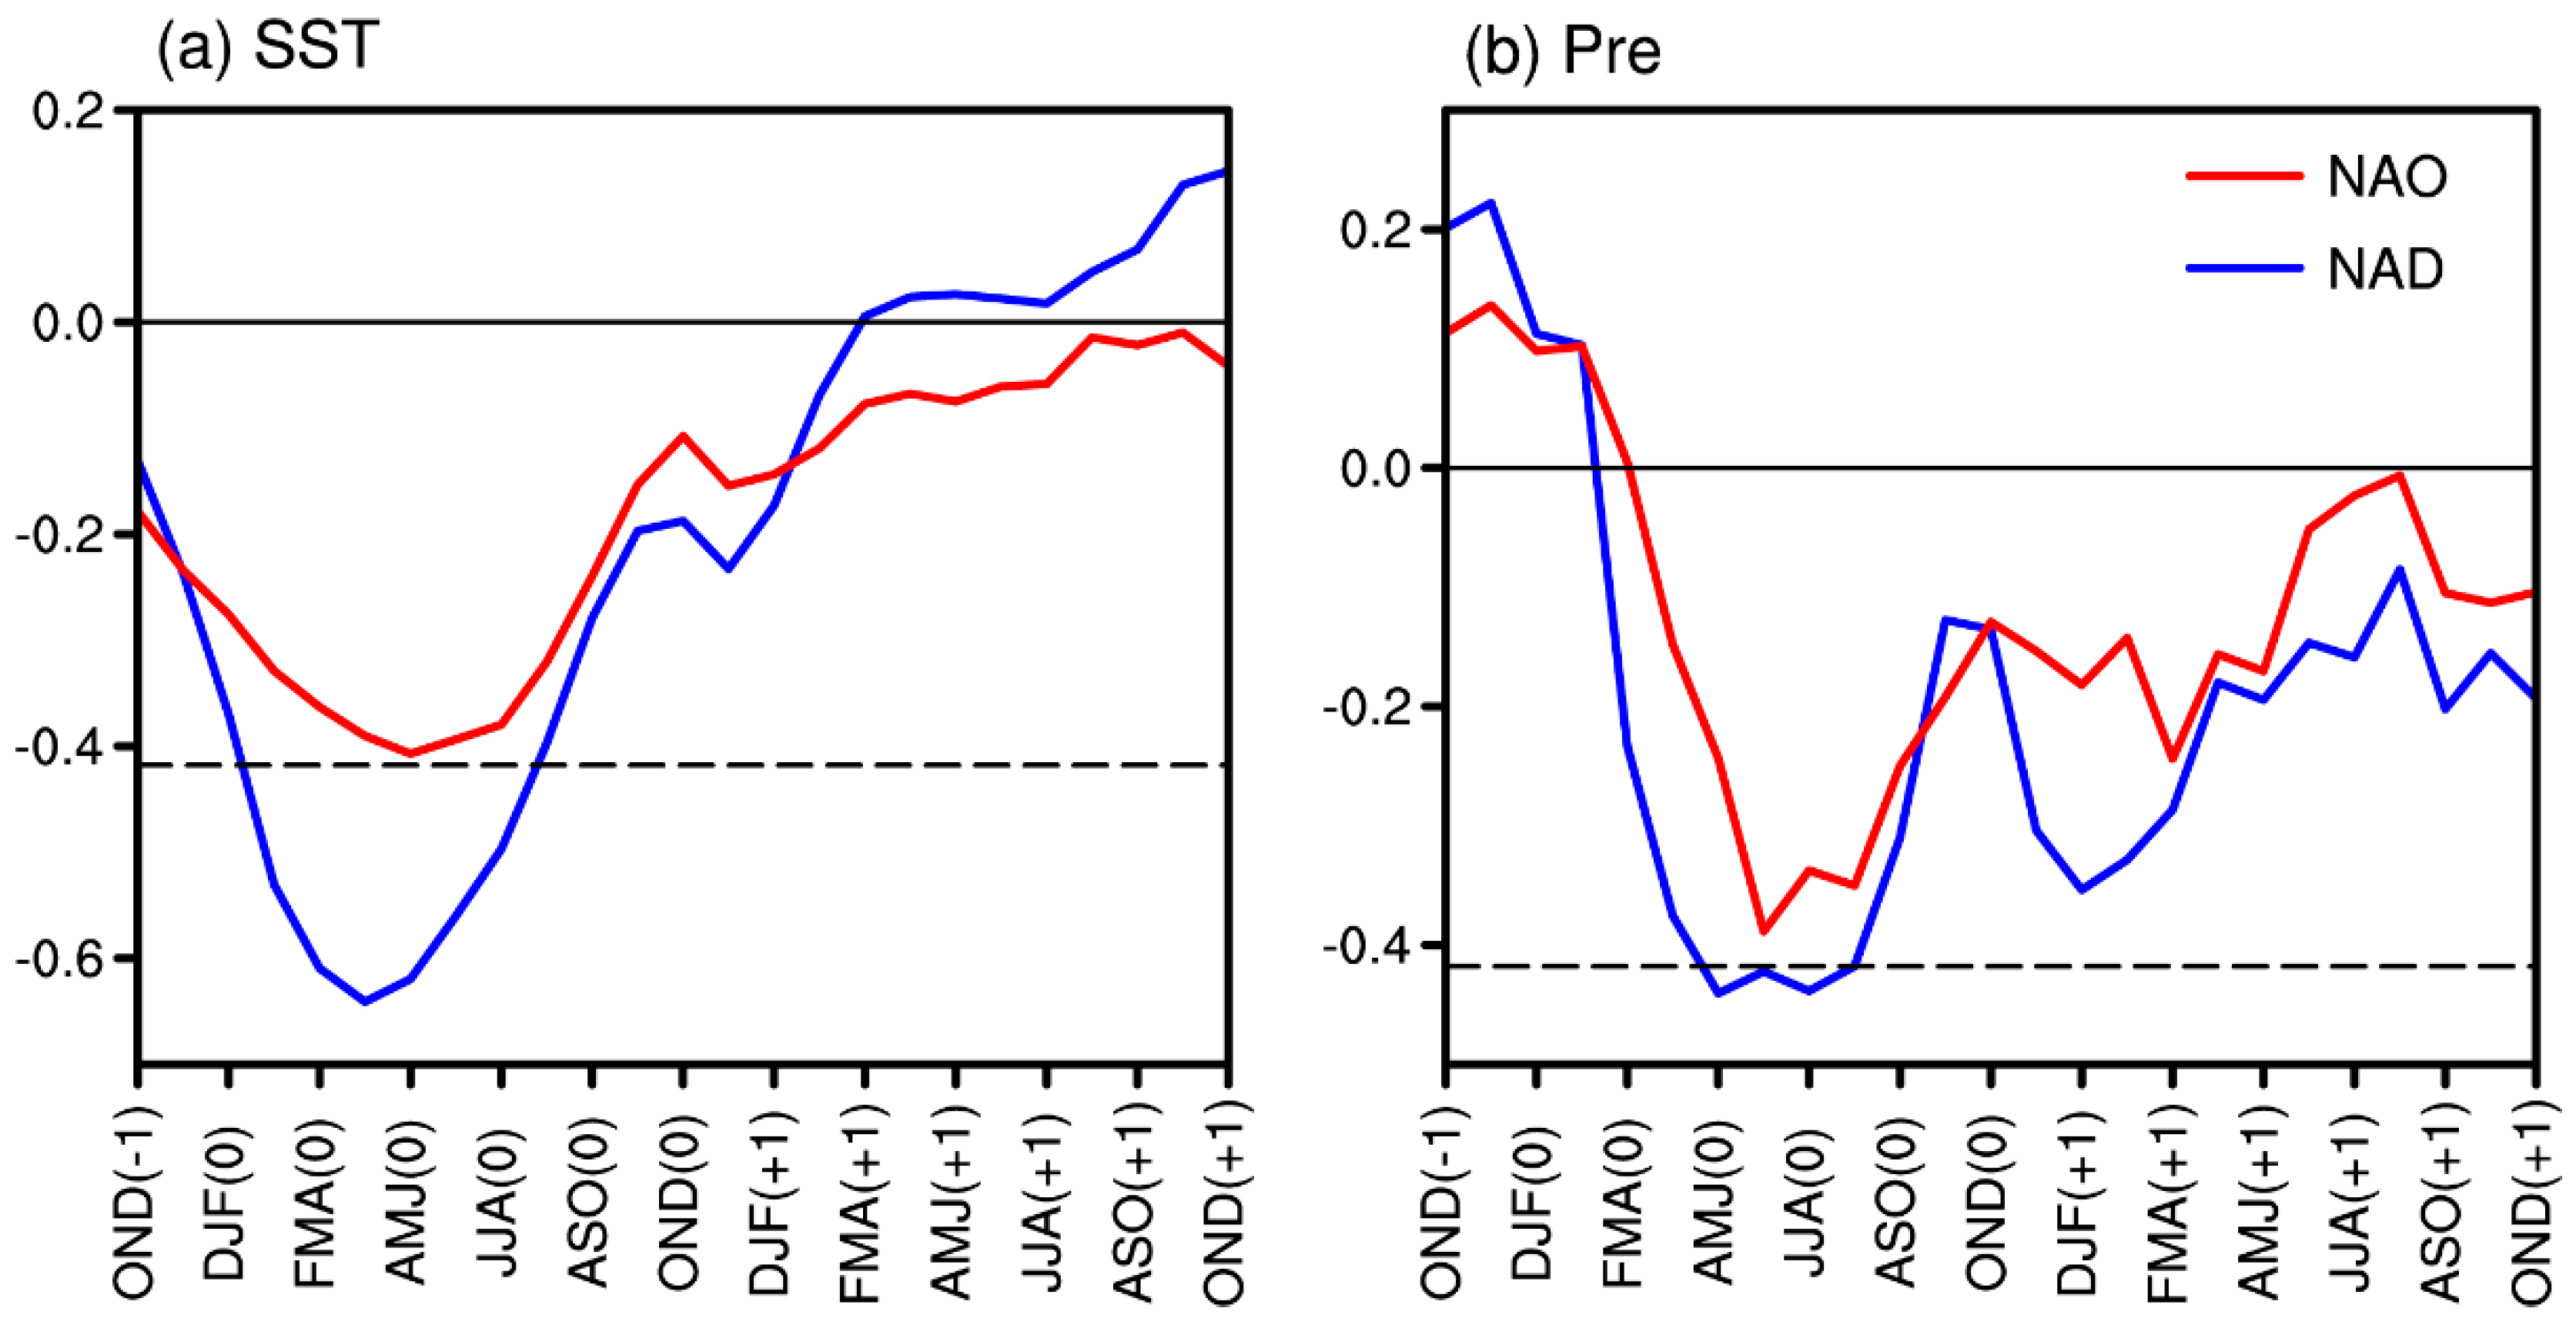
Figure 3b), where the influence of the NAO on the NTA region is much weaker than that of the NAD. The correlation coefficient (
R) between the NADI and the following MAM-averaged NTA SST is −0.64 (significant at the 99.9% confidence level), which is higher than that between the NAOI and the following MAM-averaged NTA SST (
R = −0.39; significant at the 95% confidence level; see also
Figure 4a). As Ding et al. [
26] mentioned, because the southern pole of the NAD is located much farther west and south (i.e., towards the NTA region) than the NAO, the NAD-related surface wind anomalies extend farther to the west and southwest towards the NTA region than those related to the NAO. Therefore, in contrast to the NAO, the NAD has a closer relationship with the NTA SST anomalies.
Ham et al. [
31] reported that the NTA SST anomalies can induce precipitation anomalies over the equatorial Atlantic during spring. We note that, consistent with the SST anomalies, the negative precipitation anomalies associated with the NAD are also more significant than those associated with the NAO in the NTA region during spring. Both the NTA SST anomalies associated with the NAD and NAO can persist from spring to summer through the WES feedback [
32]. We note that the NAD also has a higher correlation with the NTA SST anomalies and precipitation anomalies during summer than the NAO (the JJA season;
Figure 3c,g).
To isolate the impact of the NAD from the NAO, we calculated the partial correlation of the three-month-averaged SST, surface wind, and precipitation anomalies with the DJFM-averaged NADI by linearly removing the contemporaneous NAOI (
Figure 5a–d; compare with those in
Figure 3a–d). For three variables of A, B and C, the partial correlation equation is defined as follows:
where
and
are the simple correlations between variables
A and
B and variables
A and
C, respectively. Likewise,
is the simple correlation between
B and
C.
is the correlation between two variables,
A and
B, after removing the effect of another variable,
C. Variables
A,
B, and
C in this place can be taken as NADI, SST (or surface wind, precipitation) anomalies, and NAOI.
With the removal of the NAO effect, the tripole-like SST anomaly pattern and precipitation anomalies associated with the NAD still exist in the North Atlantic during spring and summer. In contrast, with the NAD effect removed (
Figure 5e–h), the tripole-like SST anomaly pattern associated with the NAO obviously weakens, especially in the NTA region, where significant SST and precipitation anomalies become indistinct. Therefore, the NAD tends to have a greater influence on climate variability in the NTA region than does the NAO.
In addition to the differences in the North Atlantic presented above, there are also some differences in the climatic effects of the NAD and NAO in the tropical Pacific. During spring (
Figure 3b), significant positive SST anomalies associated with the NAD develop in the northeastern subtropical Pacific (NESP; 160–110° W, 10–40° N; indicated by the green box in
Figure 3b) region. The NESP SST warming associated with the NAD extends equatorward during summer (
Figure 3c), and is associated with significant positive precipitation anomalies in the central-eastern equatorial Pacific. During autumn (SON;
Figure 3d,h), the SST warming associated with the NAD reaches the equatorial central Pacific, and a marked CP-type El Niño pattern is established. In contrast, weak SST anomalies (not significant at the 90% confidence level) associated with the NAO occur in the NESP region during spring. These weak SST anomalies associated with the NAO do not show obvious equatorward propagation during summer (
Figure 3c,g). As a result, the CP-type El Niño pattern associated with the NAO is indistinct during the following winter. Therefore, we conclude that in contrast to the NAO, the NAD may also exert a stronger effect on the tropical Pacific.
There are two possible reasons why the NAD can significantly impact the tropical Pacific. Compared with the NAO, the southern pole of the NAD is much closer to the tropical Pacific. Thus, the NAD has a stronger effect on the NESP SST warming during spring via its associated concurrent anticyclonic flow. On the other hand, the above results have shown that the NAD influences the NTA SST more than the NAO. According to Ham et al. [
31], the NTA SST cooling during spring can induce an anticyclonic flow over the NESP region as a Gill-type Rossby wave [
38] response. Therefore, the NAD can exert a stronger effect on the NESP SST warming by influencing the NTA SST. Finally, in contrast to the NAO, the NAD may play a more important role in influencing the occurrence of CP-type El Niño, owing to its effectiveness at forcing the NESP SST warming.
With the removal of the NAO effect, there are some reductions in the correlations of SST, surface wind, and precipitation anomalies with the residual NADI in the tropical Pacific (
Figure 5a–d), but the NESP SST warming associated with the NAD is still significant during spring (
Figure 5c). The CP-type El Niño pattern associated with the NAD can also be seen in the tropical Pacific during the following autumn. In contrast, after removing the effect of the NAD (
Figure 5e–h), significant SST and precipitation anomalies associated with the NAO almost disappear in the tropical North Pacific. These results support the idea that the NAD has an important effect on climate change in the North Atlantic as well as the tropical Pacific.
To further examine the differences between the NAD and NAO, we classified the NAD and NAO events into the following three groups: 1) positive (negative) NAD events that are not accompanied by a positive (negative) NAO event (hereafter positive NAD only or negative NAD only); 2) positive (negative) NAO events that are not accompanied by a positive (negative) NAD event (hereafter positive NAO only or negative NAO only); and 3) positive (negative) NAD events that are accompanied by a positive (negative) NAO event (hereafter positive NAD–NAO or negative NAD–NAO; as also listed in
Table 1).
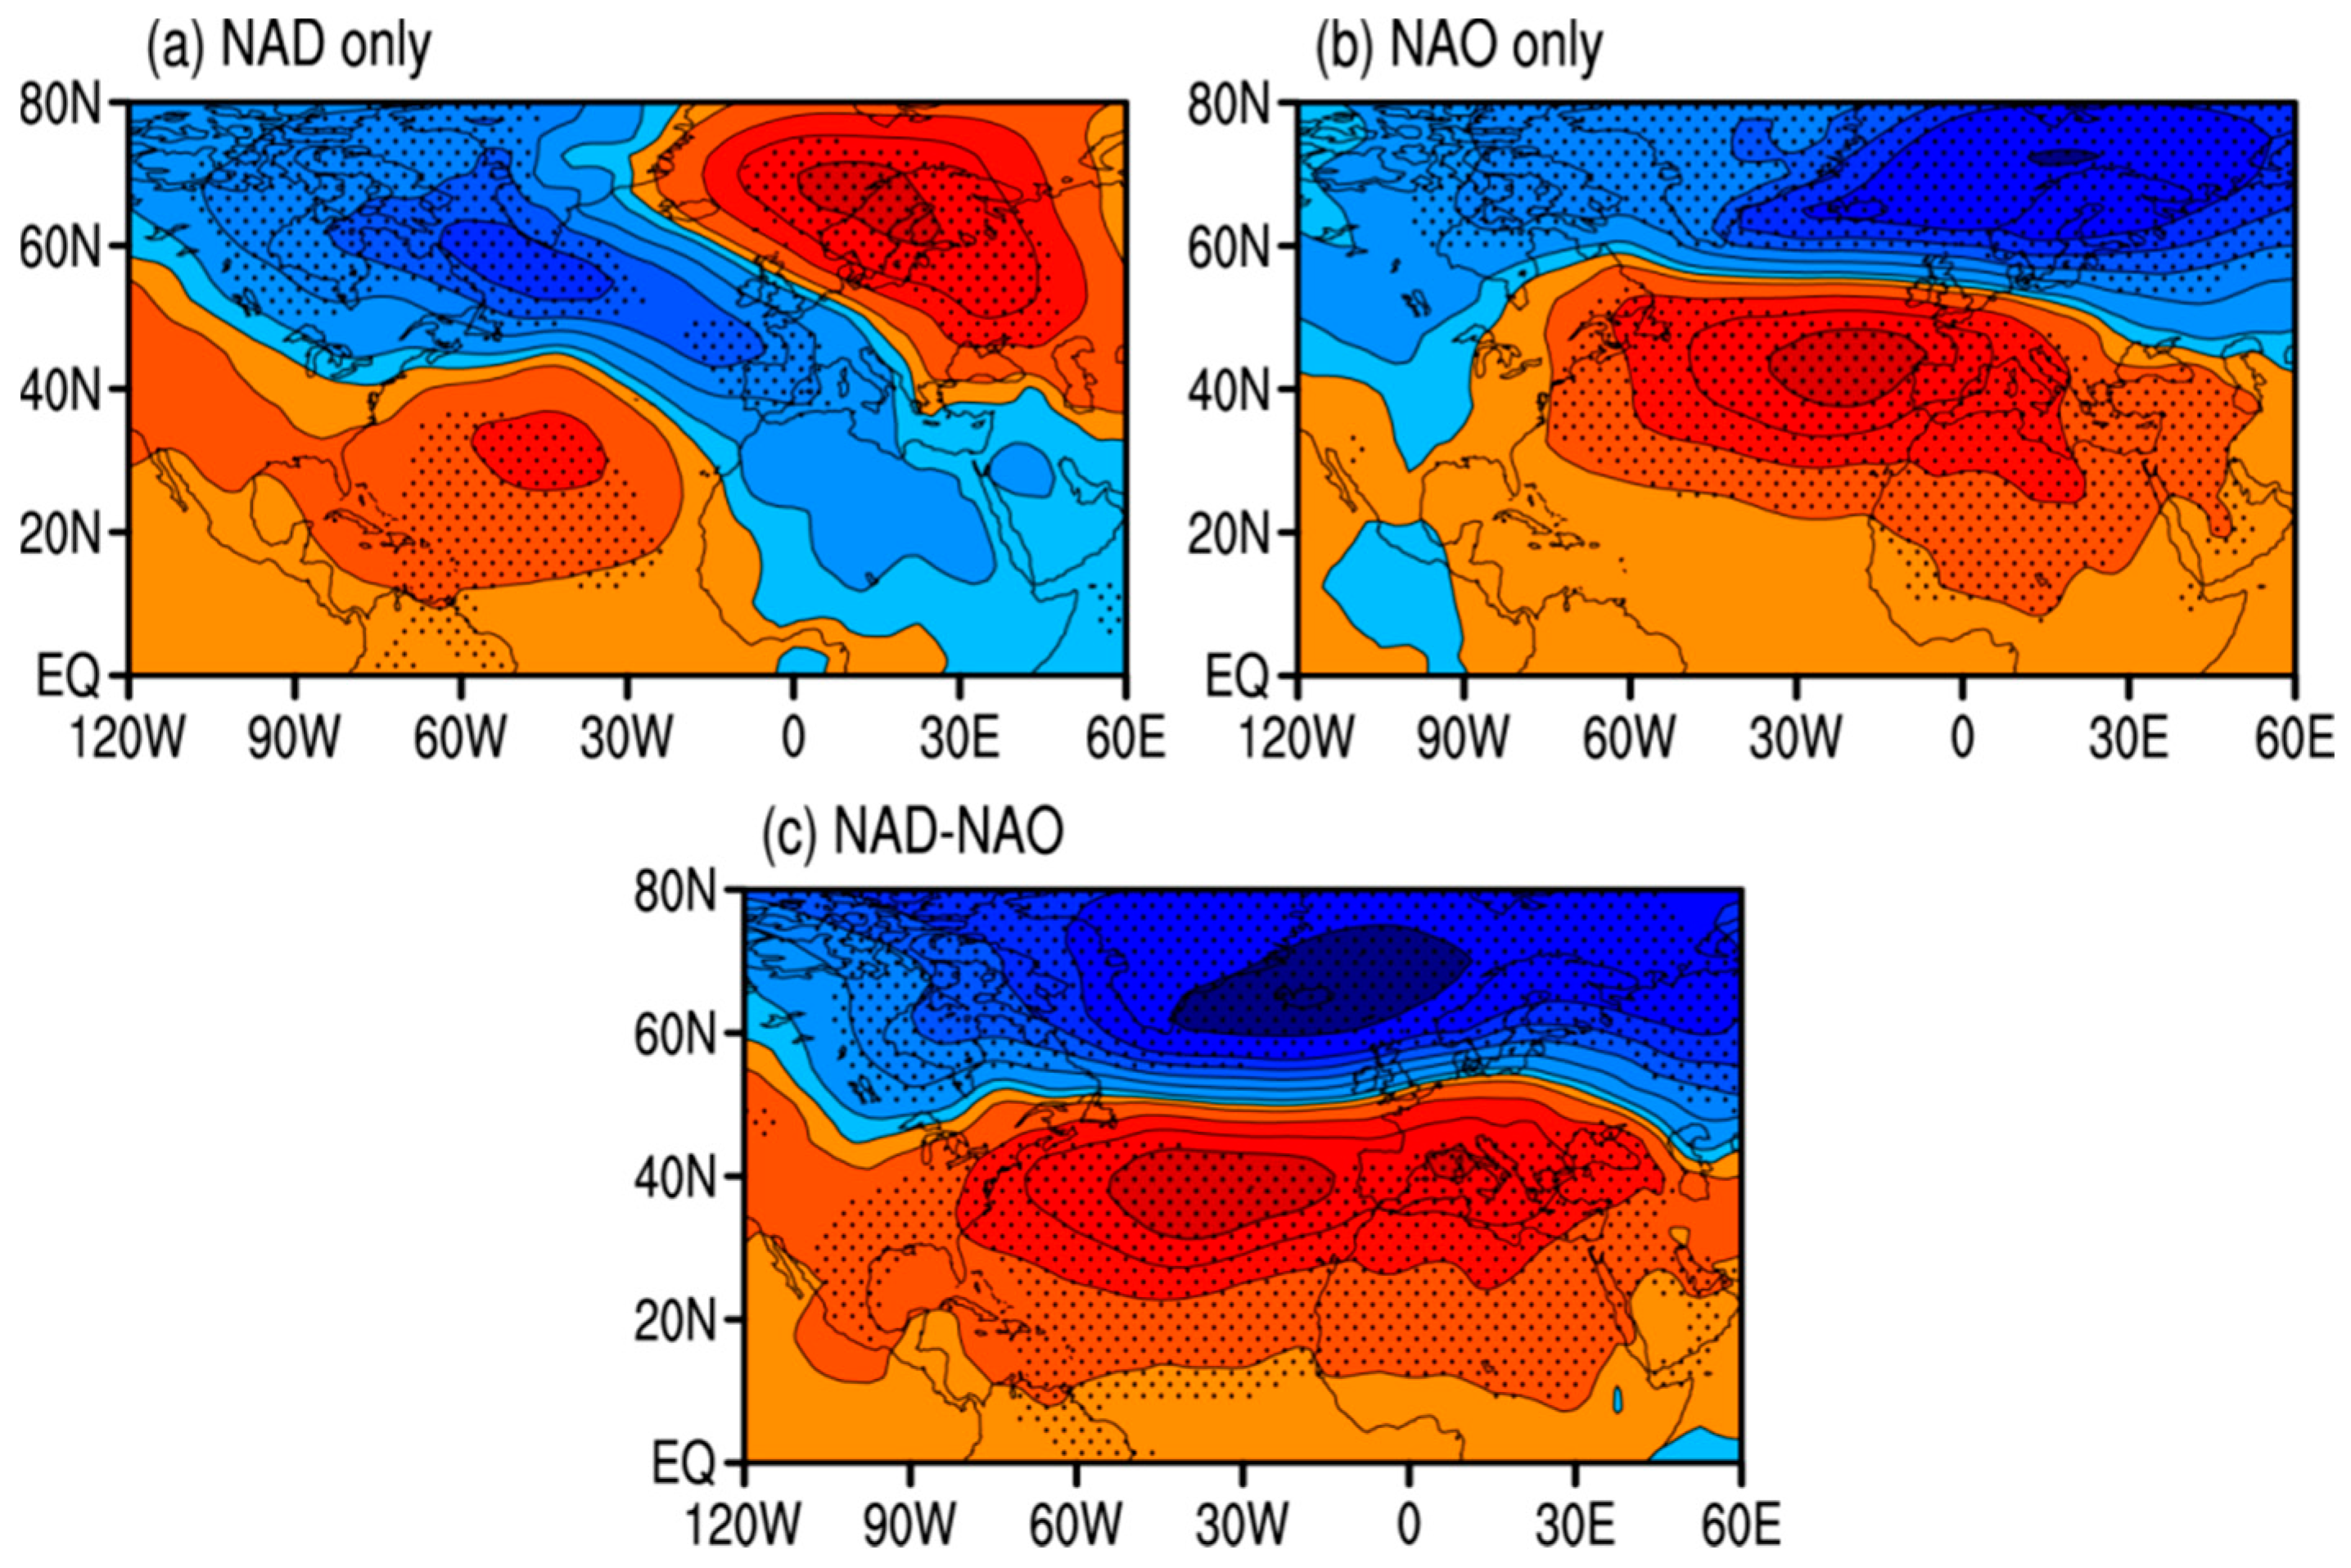
Figure 6 shows the composite differences in the DJFM-averaged SLP anomalies between only the positive and negative NAD events (
Table 1;
Figure 6a), between only the positive and negative NAO events (
Figure 6b), and between only the positive and negative NAD–NAO (
Figure 6c). For NAD only, we can see that the NAD is associated with a dipole-like pattern of SLP anomalies in the western tropical North Atlantic and northeastern America (
Figure 2a). In contrast, for NAO only, the dipole-like SLP anomalies structure associated with the NAO has large amplitudes located mainly in northwestern Africa and northwestern Europe, and the dipole centers of the NAO are shifted more to the north and east in relation to the NAD’s centers. For NAD–NAO, we note that the significant SLP anomalies extend more to the west and south, and cover from the western tropical Atlantic to North America. The above analysis further demonstrates that the SLP anomalies associated with the NAO alone, and those associated with the NAD alone, are distinct.
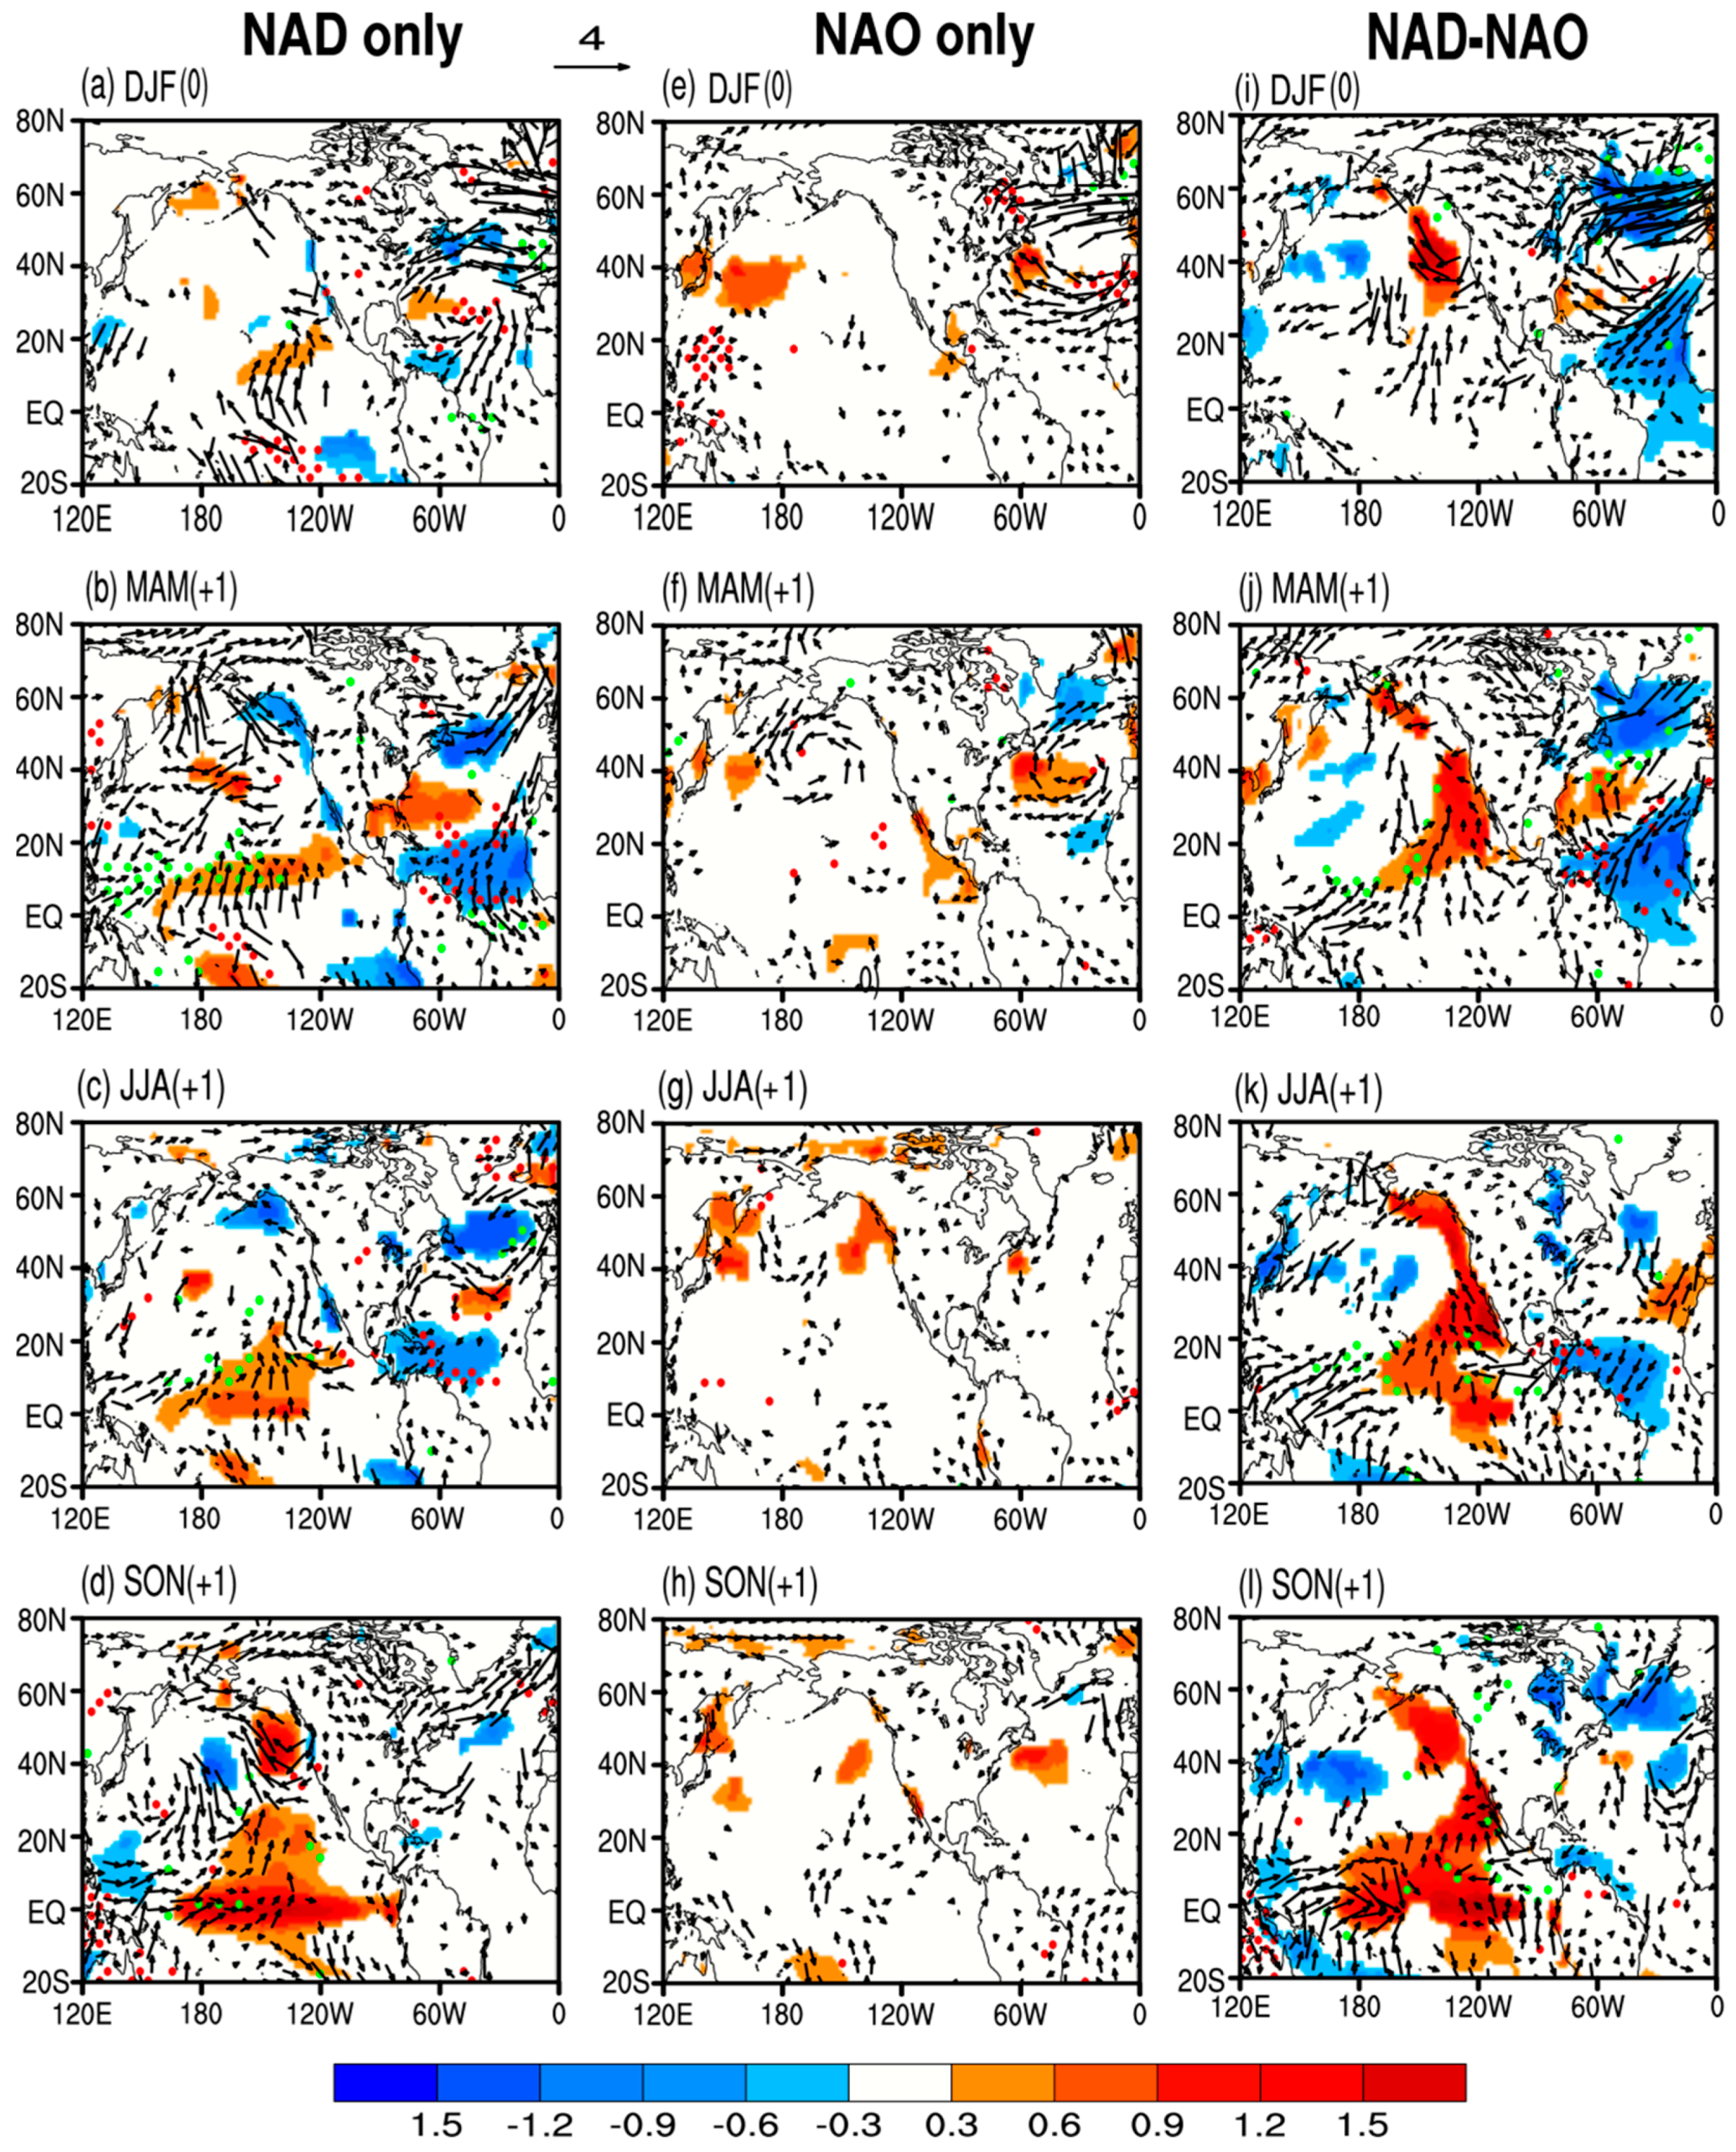
We next examined their climatic impacts by using the composite differences of the three-month-averaged SST, surface wind, and precipitation anomalies for the three groups for DJF, MAM, JJA, and SON (
Figure 7). For NAD only, the tripole-like SST pattern during spring in the North Atlantic, and the CP-type El Niño pattern during autumn in the tropical Pacific, remain evident. However, for NAO only, the SST and precipitation anomalies in the North Atlantic and North Pacific are significantly weaker than those for NAD only. These results are consistent with the above analysis (
Figure 3a), which suggests that the NAD may exert a stronger climatic effect on the NTA region and the tropical Pacific than the NAO. In addition, we note that the SST, surface wind, and precipitation anomalies in NAD–NAO are closely comparable to the NAD-only scenario, and the large difference between the two groups lies mainly in the tropical Pacific. Unlike the NAD-only class, the NAD–NAO group has stronger SST and precipitation anomalies in the tropical Pacific. These results indicate that the NAO alone has a very weak impact on the tropical Pacific, and the influence on the tropical Pacific will be strengthened when it coincides with the NAD.
Previous studies indicated that the ENSO had no significant relationship with the NAO; the correlation between them is very low [
39,
40]. Although some studies found that there are more occurrences of negative NAD in the late winter during El Niño events, and of positive NAO in La Niña events, there are still many uncertainties about the relationship between them [
41,
42,
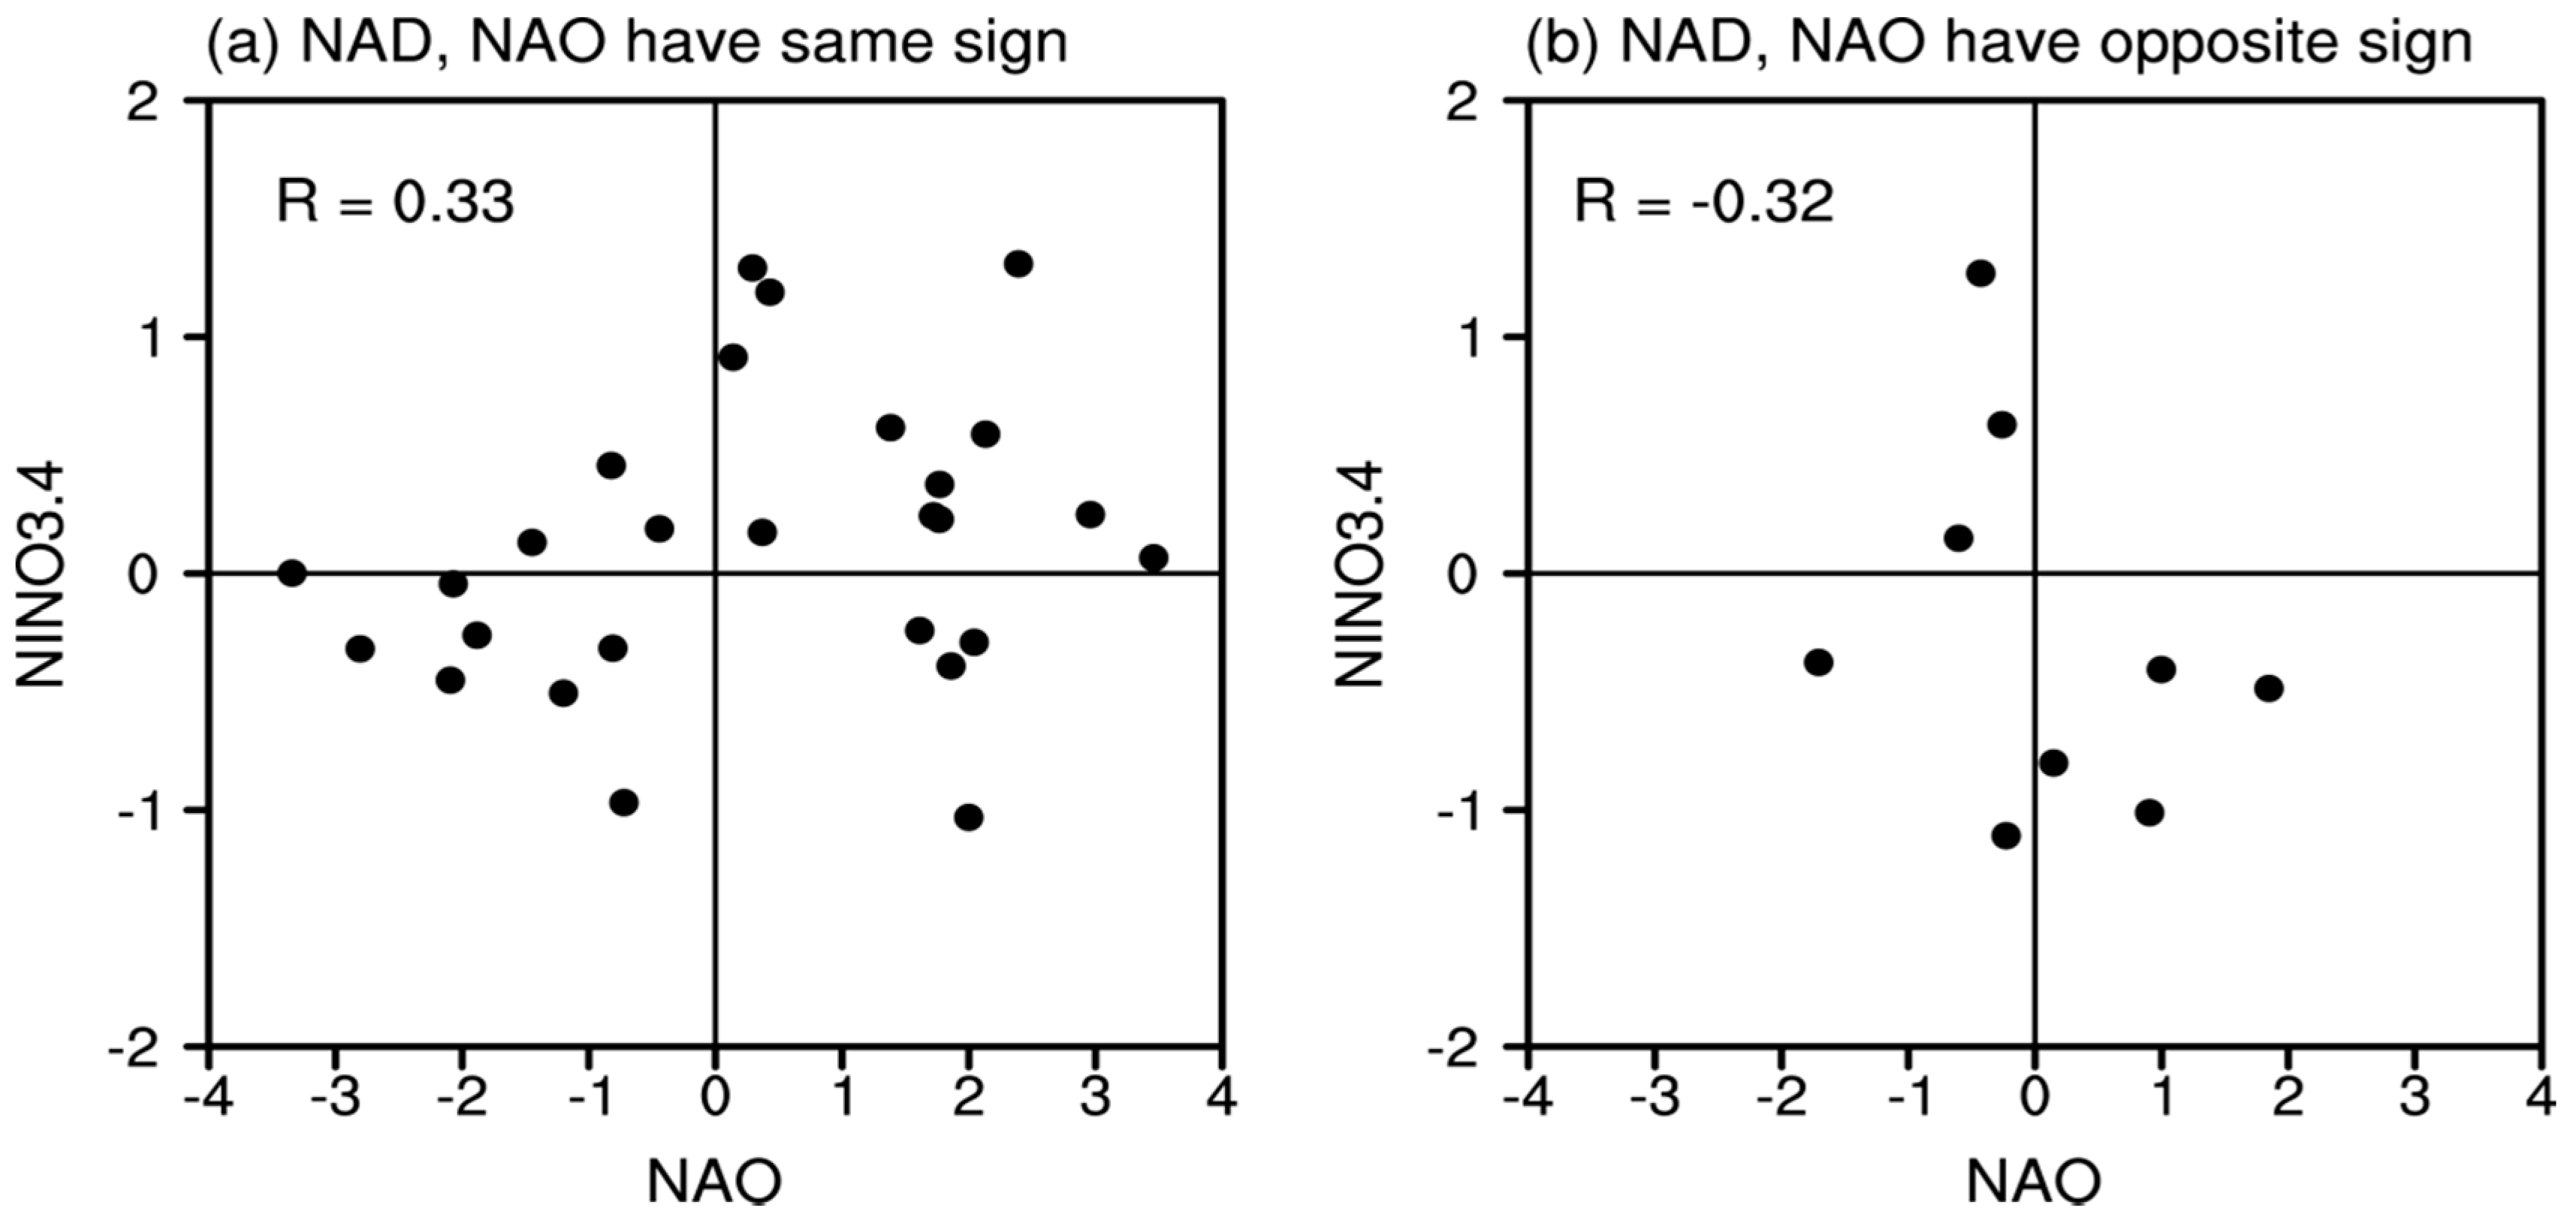
43]. However, we investigated the joint relationship between the NAD, the NAO, and ENSO through a scatterplot between the DJFM-averaged NADI and simultaneous NAOI, for the cases where they have the same (
Figure 8a) or opposite (
Figure 8b) sign. We note that the correlation between the NAO and Niño3.4 indices is 0.33 (significant at the 90% confidence level for the 28 events) when the NADI and the NAOI have the same sign (
Figure 8a), whereas the correlation is −0.32 (not significant at the 90% confidence level for the 9 events) when the NADI and the NAOI have the opposite sign (
Figure 8b). Therefore, the NAD may serve as a bridge linking the NAO to ENSO, suggesting that we should consider the role of the NAD while examining the NAO’s effect on the following ENSO events.
4. Summary and Discussion
The focus of this study was to investigate in detail the differences between the NAD and NAO. Our results show that the NAD and NAO have differences in their spatial structures, temporal variations, and climatic impacts. The NAD-related SLP anomalies are located mainly from northeastern North America to the western tropical North Atlantic, whereas the NAO-related SLP anomalies are located mainly across most of the northwestern Europe, subtropical North Atlantic, and North Africa. The SLP anomalies associated with the NAD are located more to the west and south than those associated with the NAO. In addition, we found that the NAD has its own temporal variability which is independent of the NAO, and the occurrence of strong NAD events is not always accompanied by simultaneous strong NAO events.
The differences in spatial pattern and temporal variability between the NAD and NAO may result in their different climate impacts. In the North Atlantic, because the NAD is located much farther west and south towards the NTA region than the NAO, the wintertime NAD has a stronger effect on the SST and precipitation anomalies in the NTA region during the following spring and summer. In the tropical Pacific, the wintertime NAD can be more effective in forcing the significant positive SST anomalies in the NESP region during spring, because the NAD is much closer to the tropical Pacific. The SST warming in the NESP region during spring associated with the NAD can extend equatorward in the following seasons and reach the equatorial central Pacific, finally leading to a marked CP-type El Niño pattern during autumn. In contrast, the weaker SST anomalies associated with the NAO that occur in the NESP region during spring do not show obvious equatorward propagation, and thus the CP-type El Niño pattern in the following autumn, associated with the NAO, does not develop. As a result, compared with the NAO, the NAD tends to be more conducive to the occurrence of the CP-type El Niño.
We also found that the influence of the NAO can pass to the tropical Pacific only when the NAD and NAO have the same sign, indicating that the NAD may serve as an important bridge linking the NAO to ENSO. Exploring the joint influences of the NAD and NAO on ENSO may help us to better understand the relationship between the NAO and ENSO, and contribute to the prediction of ENSO. In addition, the dynamical explanation for the NAD remains unexplained. Vallis et al. [
44] indicated that the NAO is associated with variations in the midlatitude circulation caused by fluctuating stirring from baroclinic eddies, but whether the NAD is caused by the baroclinic eddies is not clear. Further work, involving detailed analysis, will be required in this regard.
