Article

Aviation Meteorology at Several Plane Crash Sites

by
Alexander N. Safronov
A.M. Obukhov Institute of Atmospheric Physics, Russian Academy of Sciences, Pyzhevskii per. 3, Moscow 119017, Russia
Atmosphere 2019, 10(2), 50; https://doi.org/10.3390/atmos10020050
Submission received: 11 January 2019 / Revised: 24 January 2019 / Accepted: 25 January 2019 / Published: 28 January 2019
(This article belongs to the Special Issue Aviation Meteorology)

Abstract

:
The causes of aircraft crashes were investigated for several accidents, such as the Tu-154 and the Airbus A320-211 crashes near Sochi, Russia; the Airbus A320-232 crash near the Perpignan airport; and the Airbus A310-324 crash during landing in Moroni, Comoros Islands. Failures related to aircraft aerodynamics caused these air catastrophes. Upon encountering an upward vertical front, the airstream over the plane wing was disrupted and, as a result, the aerodynamic lifting force suddenly and dramatically decreased. The critical value of the vertical wind speed in a sea-land front (SLF) was determined to be ~0.5–1.0 m s−1. Some recommendations are proposed to prevent such aircraft accidents near coastal airfields. Forecast predictions of a sea-land breeze w-Front and of MWT (Mountain Wave Turbulence) were performed by regional atmospheric models with a resolution no lower than 2 km. Further, a possible reason for the sudden disappearance of aircraft near the coast of Florida is suggested.

1. Introduction

During take-off, a Tu-154B-2 aircraft with the serial number RA-85572 crashed on December 25, 2016, after refuelling at the intermediate airport in Sochi/Adler, Russia. Because this is the third accident of this nature in the specified area, special attention to and investigation of the causes which led to these accidents are required.
Since the crash of the aircraft was at the land–water interface, much attention has been paid to studying the Sea Breeze Circulation (SBC) for the time of the aircraft crash. Note that SBC is usually observed to occur at a short distance from the coast and it can extend along the coast for significant distances. An element of SBC is the upward w-Front, which is denoted by “A” in Figure 1. Figure 1a shows the aircraft flying in the unperturbed stream. In this case, the stream path above aircraft wing (l1) is larger than the path below wing (l2), therefore according Bernoulli the pressure below wing (P2) is larger than pressure above wing (P1) and the aerodynamic lift up force (Rz) allows to aircraft flying.
l 1 > l 2       P 1 > P 2       R z > m g
In this study, it is shown that the crash occurred at the moment the aircraft passed through the w-Front. The preliminary explanation was presented in Figure 1b. The aircraft flying in perturbed stream over the step of the w-Front was shown in Figure 1b. In this case the stream path above wing is comparable or less than perturbed path of stream below aircraft wing; the pressure below wing is less or wing is comparable to pressure above wing; the lift up force is insufficient for aircraft flying.
l 1 < l 2   ( l 1 l 2 )      P 1 < P 2       R z < m g
Probably due to aerodynamic failure, the aircraft fell downward in the “air-pocket” after contacting the w-Front. The pilot or the autopilot attempted to correct the situation, executing a command “pull up.” Despite this effort, the aircraft toppled tail down (Figure 1c).
The greatest perturbations (w′) and heterogeneity in the spatial distribution of the wind speed vertical component (w) in a horizontal plate often occur in the lower troposphere when air masses flow over topographic obstacles and flow over the sea-land border. Particular attention should be paid to the take-off and landing stages of large aircraft in coastal airfields, where the glide path passes at low altitudes directly above the sea-faring band. The sea-land circulation effect can be amplified many times over by the presence of mountain ranges on the seacoast. The general scheme of sea-land circulation in the presence of a mountain massif on the seacoast is shown in Figure 1 (right panel). The situation corresponds to the temporal period in the wintertime when the sea is warm and the land is cold. The atmospheric masses move from the sea, stop at the mountain massif and return to the sea as a vertical circulating vortex.
In addition, we consider a case of an aircraft that crashed at a low altitude while moving in a disturbed oncoming air stream that was bending around a topographic obstacle.
Note that modern large aircraft are generally capable of flying at high speeds and at high altitudes. It is generally thought that, at high altitudes, with the only exception being aircraft flying through storm fronts, w-Fronts are not a frequent phenomenon. However, this is not true. There is a wide variety of synoptic and mesoscale phenomena in the upper troposphere which include w-Fronts, including phenomena such as a vertical vortex at the side edge of a jet stream or a secondary vortex during unstable cyclogenesis near the equator. However, this issue is not considered in the framework of this study, which is limited to our work on the approach and initial climb phases of aircraft.
Note that aviation is the economic branch that is most dependent on a particular meteorological situation. In the troposphere, there are various atmospheric processes which have different spatial dimensions [1,2,3]. Depending on the assigned tasks and on the spatial resolution, meteorology is divided into several categories. The standard weather meteorology (usually called synoptic meteorology) uses meteorological fields with a resolution of 1° × 1° (~50–60 km). Recently, a number of meteorological services moved to the standard 0.5° × 0.5° resolution. Synoptic meteorology successfully describes atmospheric processes taking place at scales of more than ~25–50 km, such as hurricanes, cyclones (anticyclones), jet streams, baroclinic waves, troughs and ridges and major fronts. However, synoptic meteorology is not able to predict and correctly describe meteorological phenomena that are smaller in size. Therefore, for the correct description of meteorological situations at sizes less than synoptic resolution, we must use mesoscale meteorological models.
In the last several years, mesoscale meteorology (2–2000 km), also called regional meteorology at scales of ~10–25 km, has been an active area of development. As is well known, mesoscale meteorology is applied to predict such phenomena as thunderstorms, mesoscale convective systems (MCSs), tropical storms, land/sea breezes, mountain/valley breezes, downslope windstorms, gap flows, cold air damming, nocturnal low-level jets, lake-effect snow bands and others. Regional meteorology is widely used in pollution transfer forecasting, which utilizes the National Centre Environmental Protection (NCEP) system. Compared to synoptic phenomena, regional phenomena are intermittent, local and short-lived. At present, for regional meteorology, sustainable solutions (without any restrictions) are available at a resolution that is not less than 6 km. At scales of less than 6 km (called the upper limit of the Grey-Zone in this study), regional models fail in the convective calculation scheme; at smaller scales, the models additionally fail in the microphysics scheme. Regional meteorology with a resolution of 6–8 km can describe such atmospheric phenomena as sea-land circulations, mountain turbulence, secondary phenomena in convective currents (CIT), small circulations in cyclones and many others. The Grey-Zone convectional scheme problem is discussed in Reference [4,5].
Despite the fact that regional meteorological models have existed for a long time, they are not often applied to practical aerodynamics. The forecast of precipitation near airports is considered in Reference [6,7]; turbulence events at the flight level are analysed in Reference [8]; horizontal convective rolls are described in Reference [9]; and the correlation between fog and visibility is presented in Reference [10,11].
When a model is to be applied at the 2–6 km scale, regional meteorological models are advised and methods such as nudging, 3DVAR and 4DVAR assimilation should be used. In this vein, the WRF-ARW model (WRF—Weather Research and Forecasting; ARW—Advanced Research WRF) can be applied without any restrictions at a 6 km resolution and above but a model using a scale of less than 6 km requires some skills and caution.
Further, at the 100–500 m scale, which is called the LES scale (Large Eddy Simulation), the forecasting meteorology models require large computational resources and can be used only for small domains; usually, such models have a size of ~5 km at the horizontal plate and extend 0–2 km in altitude. These models are difficult to use and they often give unrealistic results. Some discussions on high-resolution numerical simulation for sea breeze can be found in Reference [12,13,14]. Thus, currently, LES meteorology is practically inapplicable to aviation meteorology.
Let us summarize what is written above. In aviation, as a rule, synoptic meteorology is used, so aviators fly without forecasts for mesoscale atmospheric events. To the reader, we now pose the question which we attempt to answer in this study, as discussed below: Should we use regional meteorology in aviation or not?
In this study, we also put forward several additional questions: Under what conditions do aerodynamic failures occur? Why is there a lack of detailed information about meteorological phenomena in the official aircraft crash reports? In which cases can the airfield meteorological data be extrapolated to the approach and departure glide paths?
The goal of this work is to study the various meteorological situations observed during aircraft crashes by using a regional model, as well as to identify the causes of these crashes and to develop recommendations for flight safety. The focus of the study is on the spatial–temporal distribution of the vertical component of wind speed (w-Front), on the distribution of sub-grid turbulent kinetic energy (TKE) and on the distribution of the modulus of horizontal wind speed at the moment of aircraft crashes. The calculation of the aerodynamic lift force, which depends on the wing profiles, is beyond the scope of meteorology and is not considered in this study.

2. The Objects of This Research

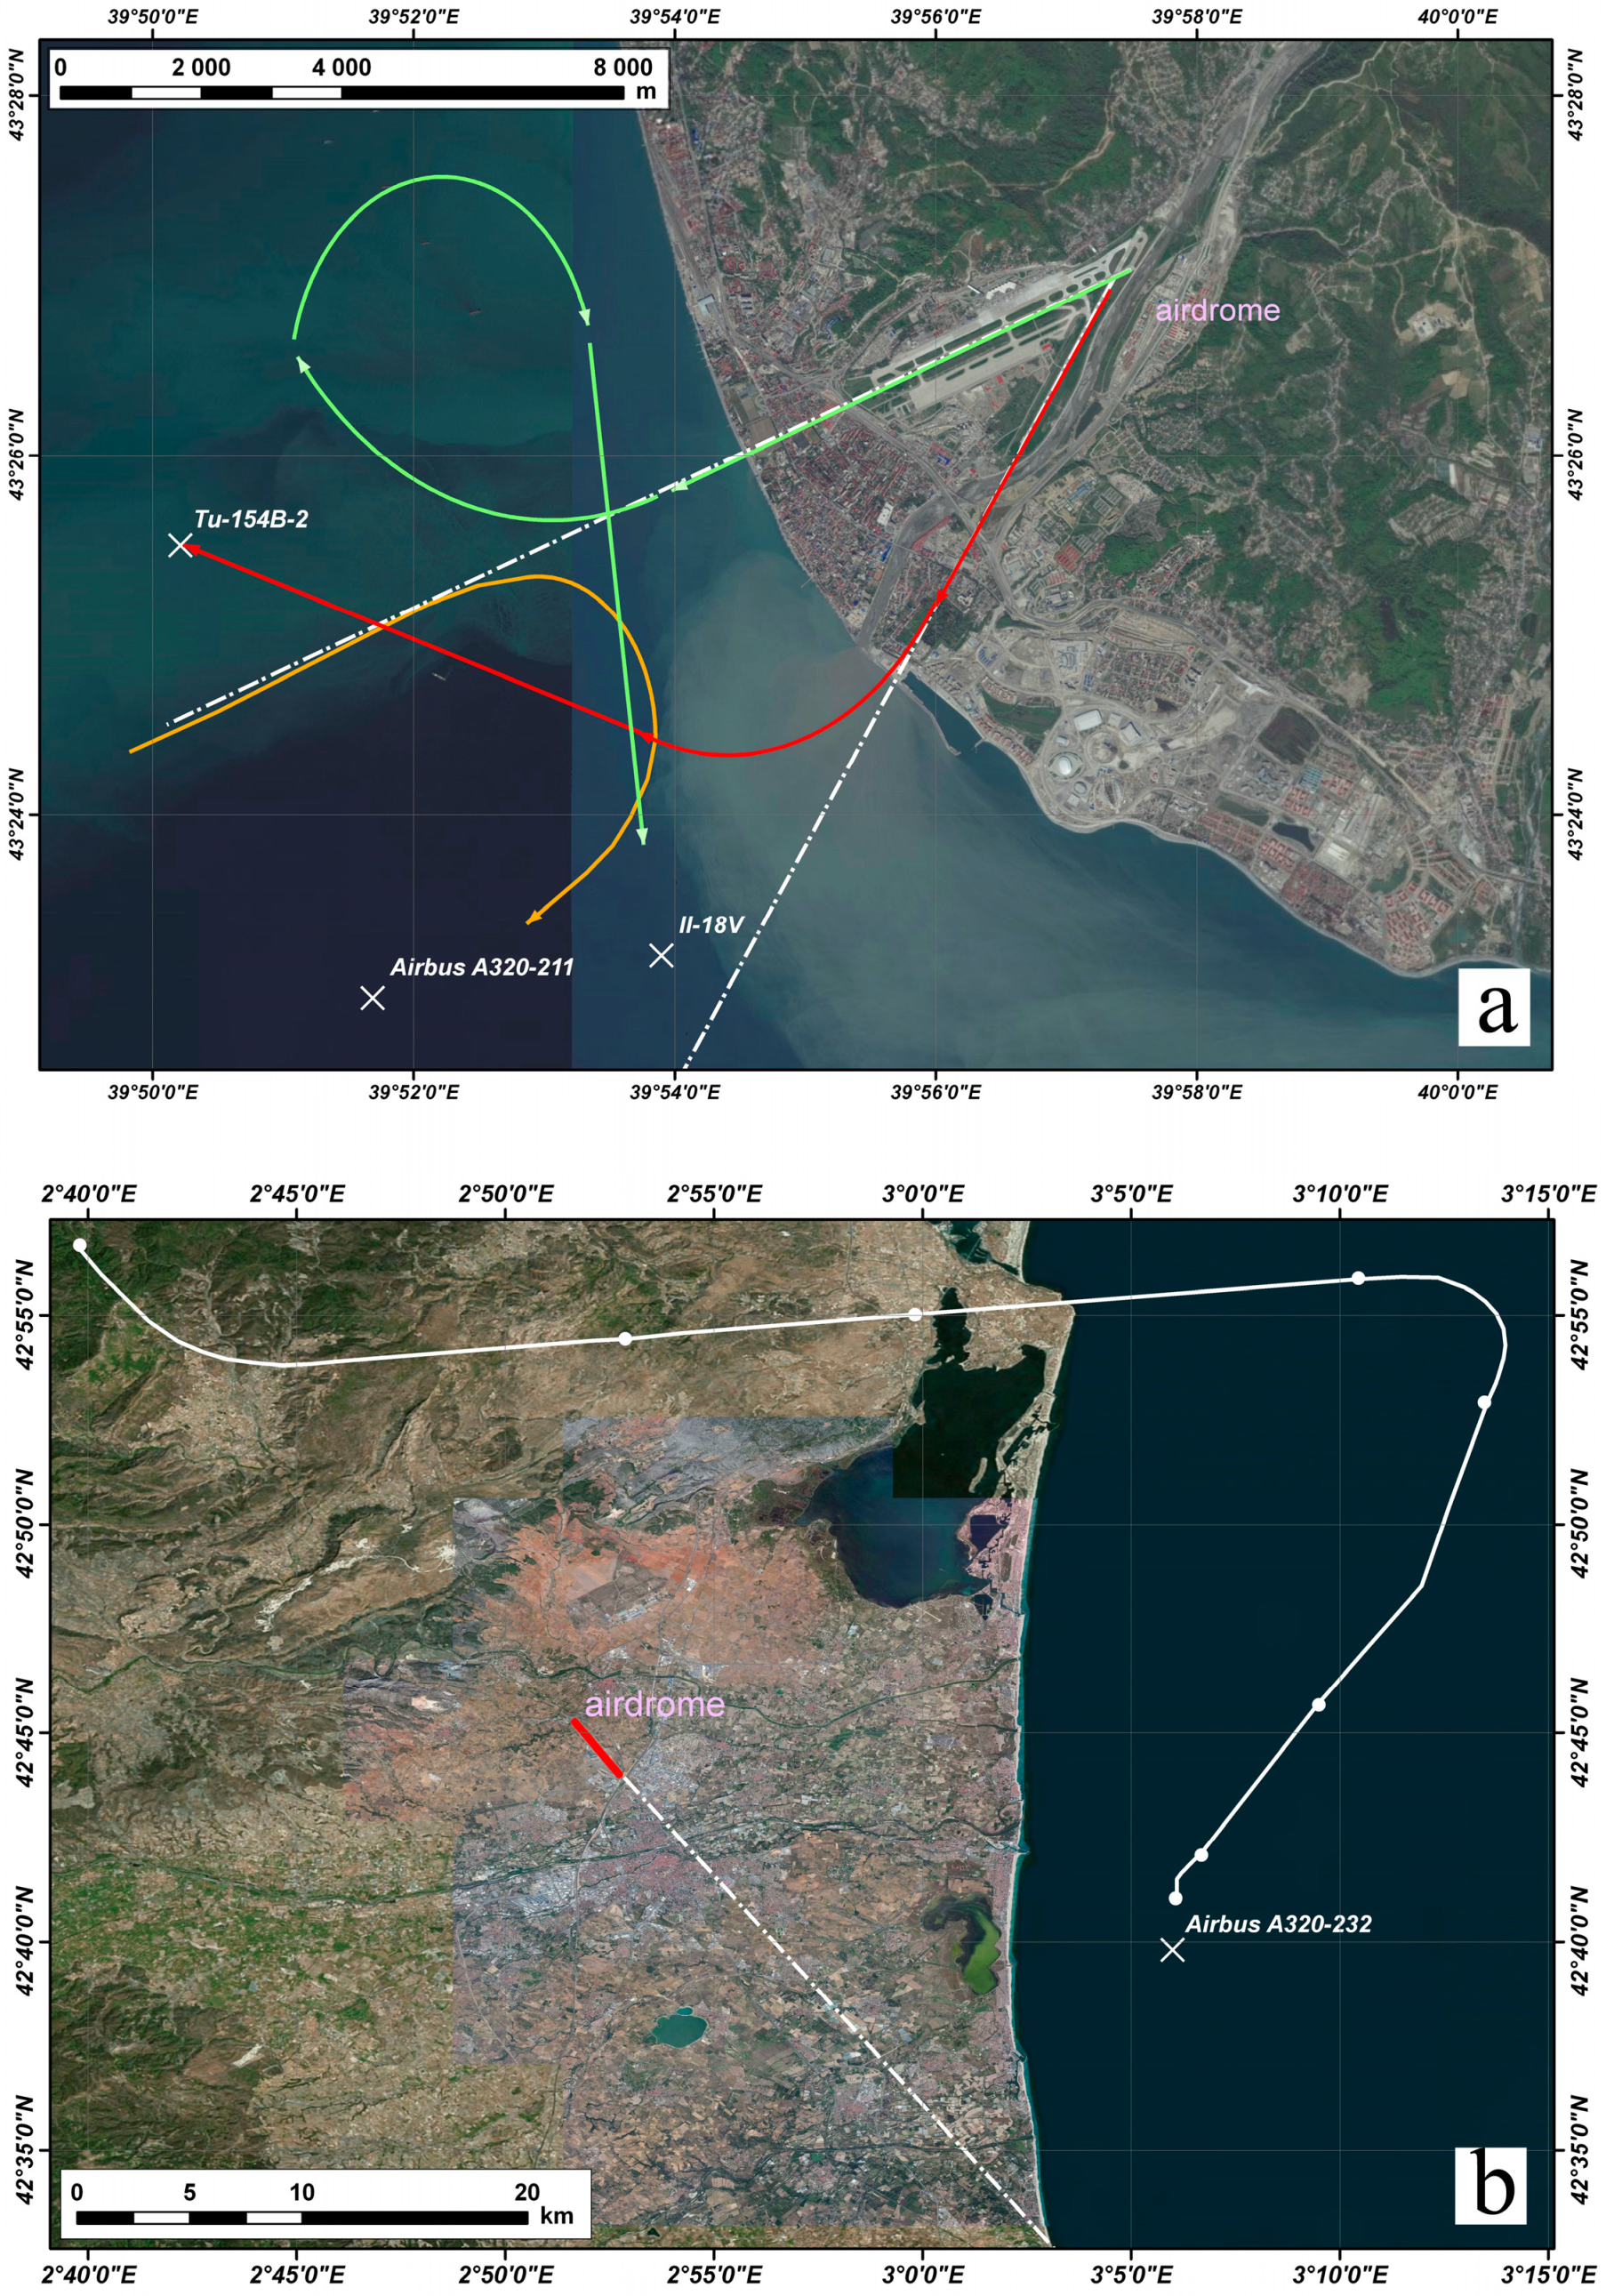
The objects of this study are the meteorological situations in four cases of plane accidents (Table 1). Two planes crashed near the airport in Adler/Sochi, Russia, one aircraft crashed near the airport Rivesaltes in the city Perpignan, France and one aircraft crashed near Comores Islands, Indian Ocean. In these cases, the effect of atmospheric air circulation in the marine zone on the aerodynamics of the flights was investigated. The reconstructed trajectories of the Il-18V, Tu-154B-2 and Airbus A320-211 aircraft, which crashed near the airfield in Adler/Sochi, Russia, are presented in Figure 2a. The fall of these aircraft occurred in coastal zones at distances from the coast not exceeding 8 km. The trajectory of Airbus A320-232 #888T-XL, which was carrying out a low-level flight test and crashed near the airport in Perpignan, France, is reconstructed and presented in Figure 2b. The space image obtained by the Virtual Earth service (Bing Maps, satellite Bird’s Eye N) is shown as a background image. In Figure 2, the glide paths from the aircraft’s position over the sea are marked by dashed white lines.
An example demonstrating the influence of topography on the aerodynamics of flight is represented by the accident of Airbus A310-324 #7O-ADJ in Moroni, Comores Islands, which crashed during a landing approach near the island aerodrome.

3. Measurements, Datasets and Methods

The hydrodynamic atmospheric model WRF-ARW (WRF: Weather Research and Forecasting; ARW: Advanced Research WRF) [20] was applied for modelling in this study. The model is now actively being developed and freely distributed. As is well known, any regional mesoscale hydrodynamic models require an assignment of the initial and boundary weather conditions. The DS083.2 reanalysis meteorological fields (NCEP FNL: Final Operational Model Global Tropospheric Analyses), which are available on the website (NCEP FNL) [21], were used as the initial and boundary meteorological conditions. The FNL meteorological fields are available with a horizontal resolution of 1° × 1° at 6 h intervals. In the vertical direction, the FNL fields have 27 height levels, from 1000 hPa to 10 hPa.
The wide range of various options of the physical processes in the WRF-ARW model provides the possibility to choose the parameters that better describe the processes in the atmosphere for a particular problem’s solution, local conditions and spatial scales, defined by the horizontal and vertical resolutions. In this study, the calculation was performed in three domains, with 18, 6 and 2 km spatial resolutions, 0–23 vertical levels with a vertical grid spacing of 50–10 hPa and two surface levels: 2 m and 10 m. The physical process parameterizations, which were applied during the calculation of the meteorological fields, are shown in Table 2. In the discussions below, we use QKE to denote twice the Turbulent Kinetic Energy, instead of TKE.
In addition to the model skin temperature from the NCAR/NCEP DS083.2 dataset, the daily SST (Sea Surface Temperature) analysis of the NCEP Real-Time Global High-Resolution (RTG-HR) data was used in this study. The RTG-HR SST data are operationally produced using NOAA AVHRR data on a ~1/12° grid. More details about the RTG-HR SST data can be found in Reference [22].

4. Analysis of Model Simulations

4.1. The Sea Breeze Front (SBF) Crash Events

The meteorology of the sea–land interface is well studied and includes such concepts as the Sea Breeze Circulation (SBC), the Sea Breeze Gravity current (SBG), the Sea Breeze Front (SBF), the Sea Breeze Head (SBH), the Kelvin–Helmholtz Billows (KHBs) and the Internal Boundary Layer (CIBL) (see [33,34,35]). In addition, the formation of Horizontal Convective Rolls (HCRs) is possible near the coast. The interaction between the SBF and the HCR is discussed in Reference [36].
Thus, nature of changes in the vertical component of the wind velocity can differ and can be observed both over the land and over the sea. However, it should be noted that, back in 2003, Miller et al. in Reference [19] pointed to the danger of sudden changes in the vertical wind velocities for aviation: “Aviators are concerned about low-level wind shear resulting from sudden changes in vertical velocity. Therefore, there are ample theoretical and practical reasons for studying the changes in the atmosphere’s vertical motions brought about by the SBF”. However, no requested changes to the aircraft operation rules were made.
Also note that, in Reference [37], it was mentioned that SBFs with updrafts as large as 2.0 m s−1 could occur when the ambient flow is offshore, while, according to [38,39], in most cases, the updrafts are in the range of 0.5–1.0 m s−1. Examples of WRF-ARW applied to sea breeze simulations can be found in Reference [40,41,42].
The general scheme of sea-land circulation with the generation of an atmospheric front in the cold season, corresponding to the situation of warm sea and cold land in the presence of hills on the seacoast, is shown in Figure 1. The sea-land front (SLF) is over the sea at some distance from the coastline (marked by the letter A in Figure 1). The SLF extends for a long distance along the coast and represents a problem for aerodromes whose glide paths cross the SLF.
As might be expected, the problem of aircraft stability is connected to perturbations in the vertical wind speed, which is small in comparison to the speed of the oncoming airflow:
w   < <   u h   < <   V
where w is the vertical wind speed; uh is the horizontal wind speed, whose typical values are in the range of 1–10 m s−1; V is the aircraft speed, which is approx. equal to 80 m s−1 at take-off and 250 m s−1 at aircraft cruising.
In the case of an SBF, a resolution of 2 km for WRF-ARW simulations can be used, since the main processes for an SBF in the band between the sea and land are determined not by convection and cumulus generation but by advection processes. However, a few words should be added about the modelling features at the sea surface level.
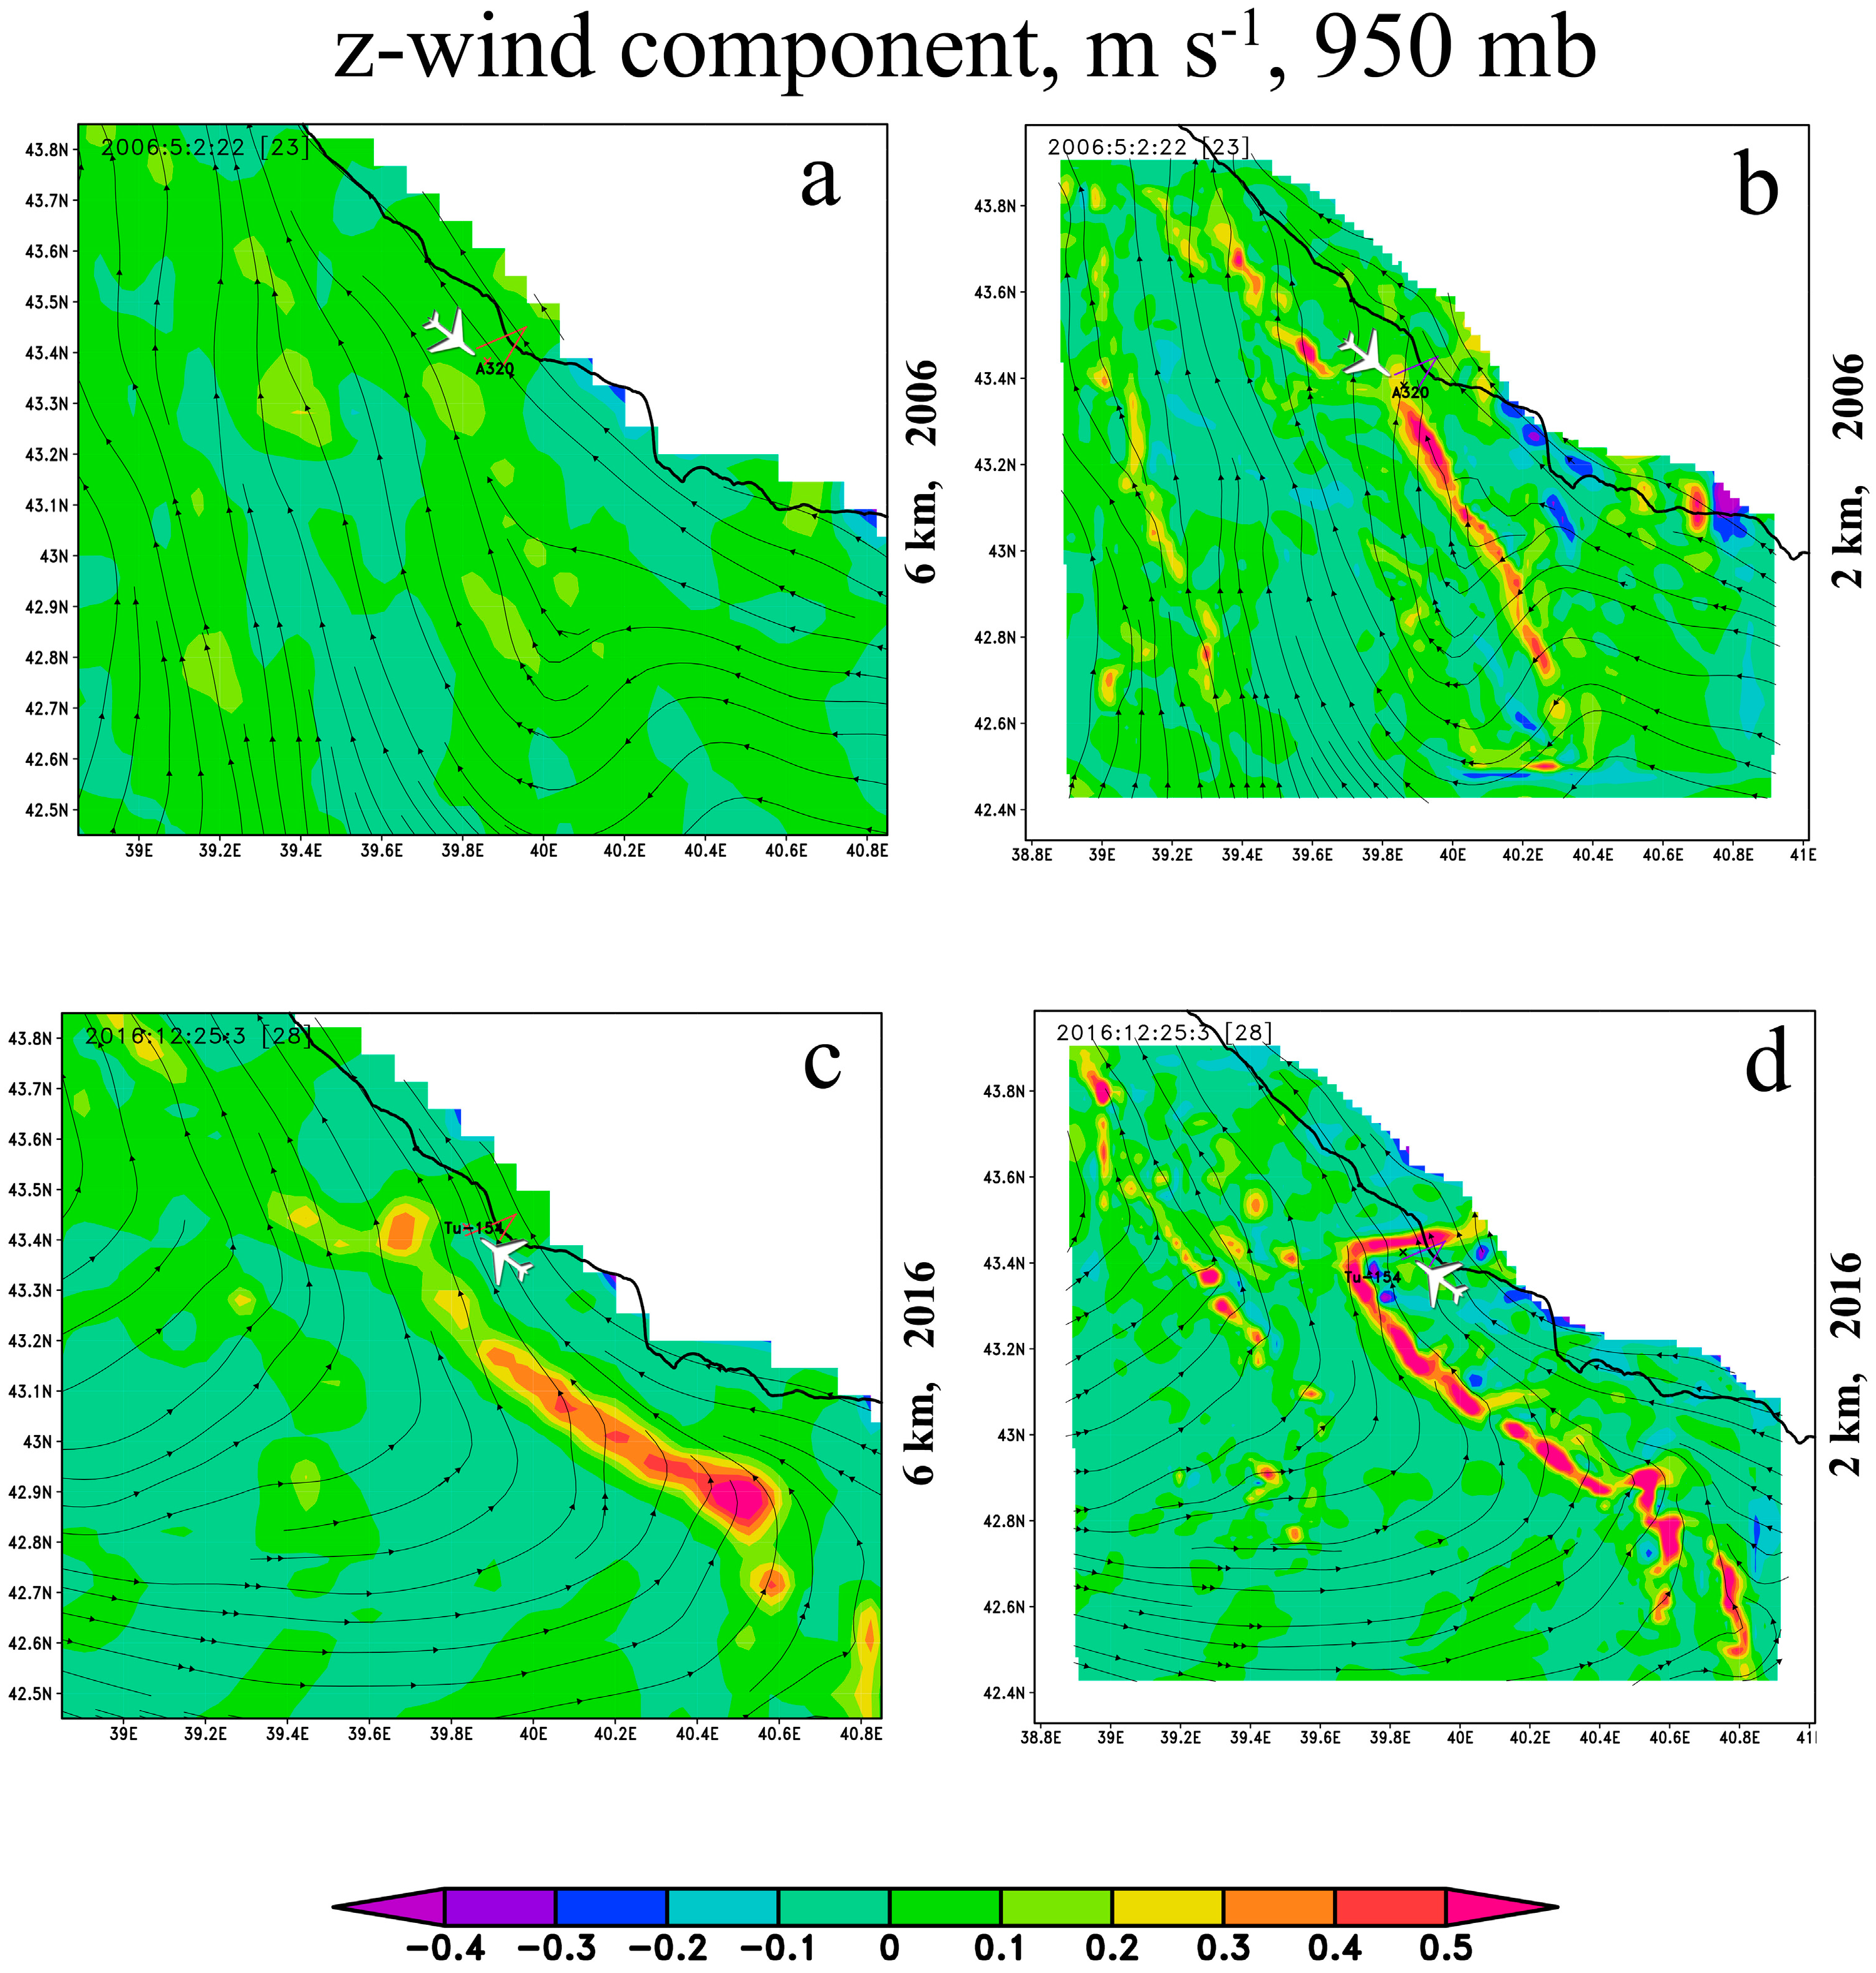
In our case, analysing the processes of advection in the lower troposphere at the land–sea boundary was our primary goal; therefore, it was proposed to vary the surface layer parameterizations. At first, we limited the local mixing by excluding thermal diffusion from the surface but we kept nonlocal mixing. Note that any local mixing over a sea surface will mask the SBF. The spatial distributions of the vertical component of wind speed at an altitude of 950 hPa at the time of the Airbus-320 crash (2 May 2006, at 22:00 UTC (a, b)) and at the time of the Tu-154 crash (25 December 2016, at 03:00 UTC (c, d)) near Sochi, calculated according to the WRF-ARW model, are shown in Figure 3 with a model resolution (the size of a cell in the model) of 6 km (a, c) and 2 km (b, d). In Figure 3, the contour of the coastal line is drawn as a black solid line. The A320-211 (a, b) and Tu-154 (c, d) crash site positions are specified by a marker. Additionally, the horizontal (u, v) wind streamlines are shown. The coastal line is drawn as a black solid line. The white area in Figure 4 corresponds to the underground model level.
As can be seen from Figure 3a,c, at a 6 km resolution, the SBF is significantly worse than at a 2 km model resolution. Thus, for the Airbus-320 #EK-32009 crash event, at a 6 km resolution, the SLF is not distinguishable (Figure 3a). At the same time, at a 2 km model resolution, the SLFs are well distinguishable in both cases and they extend along the coast at a distance from the coastline which is equal to ~5–10 km (Figure 3b,d).
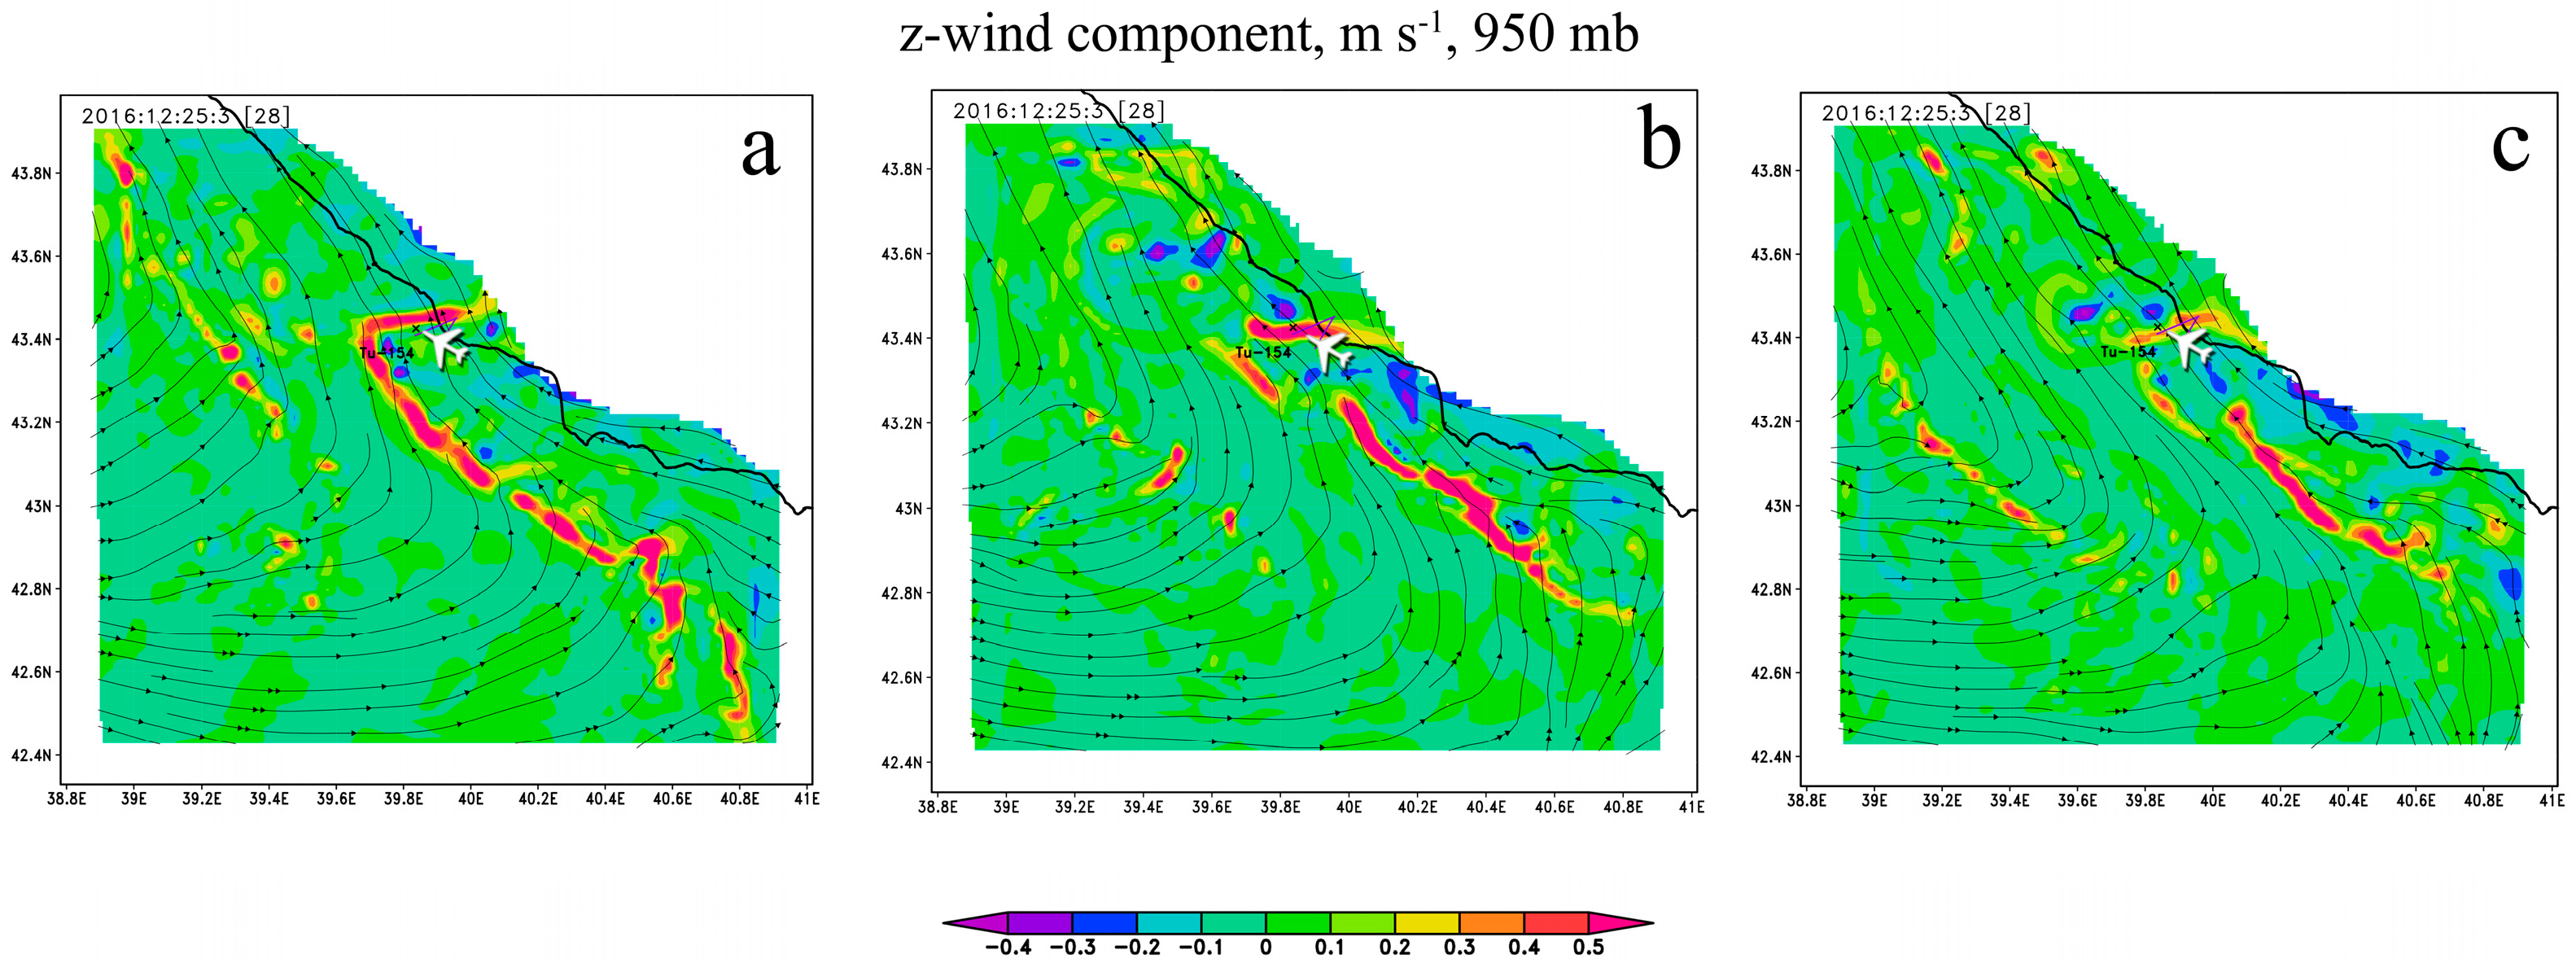
In this study, the influence of local mixing parameters on the results of the simulated vertical wind speed component distributions was considered for the Tu-154 crash on 25 December 2016, at 03:00 UTC (Figure 4). The dependence of the spatial distribution of the z-wind component at an altitude of 950 hPa on the type of local model mixing is presented in Figure 4. The simulations were performed using the WRF-ARW model with a resolution of 2 km for 25 December 2016, at 03:00 UTC, in the following: the approximation of the absence of local mixing near the surface (Figure 4a), the approximation of the five-layer model of thermal diffusion from the surface (Figure 4b) and the five-layer model of thermal diffusion with additional high-resolution SST assimilation (Figure 4c). As might be expected, the SLFs were camouflaged when additional local mixing was taken into account. In the SLF spatial distributions, discontinuities appeared and the maximum value of vertical wind speed in the SBF decreased.
At the start of the WRF-ARW model simulations in the short-term forecast mode, the influence of convective scheme inaccuracies, as well as the effect of sea surface heat fluxes and microphysics inaccuracies, will not be decisive. The result of the simulations mostly depends on the quality of the GFS/FNL initialization global fields. Therefore, for estimating the maximum values of vertical wind speeds that are dangerous for aviation, it is recommended to disable local mixing during the WRF-ARW simulations while not making any changes to the nonlocal mixing or to the advection schemes. In these WRF-ARW parameterizations, the SBF will be clearly visible, just as in Figure 4a.
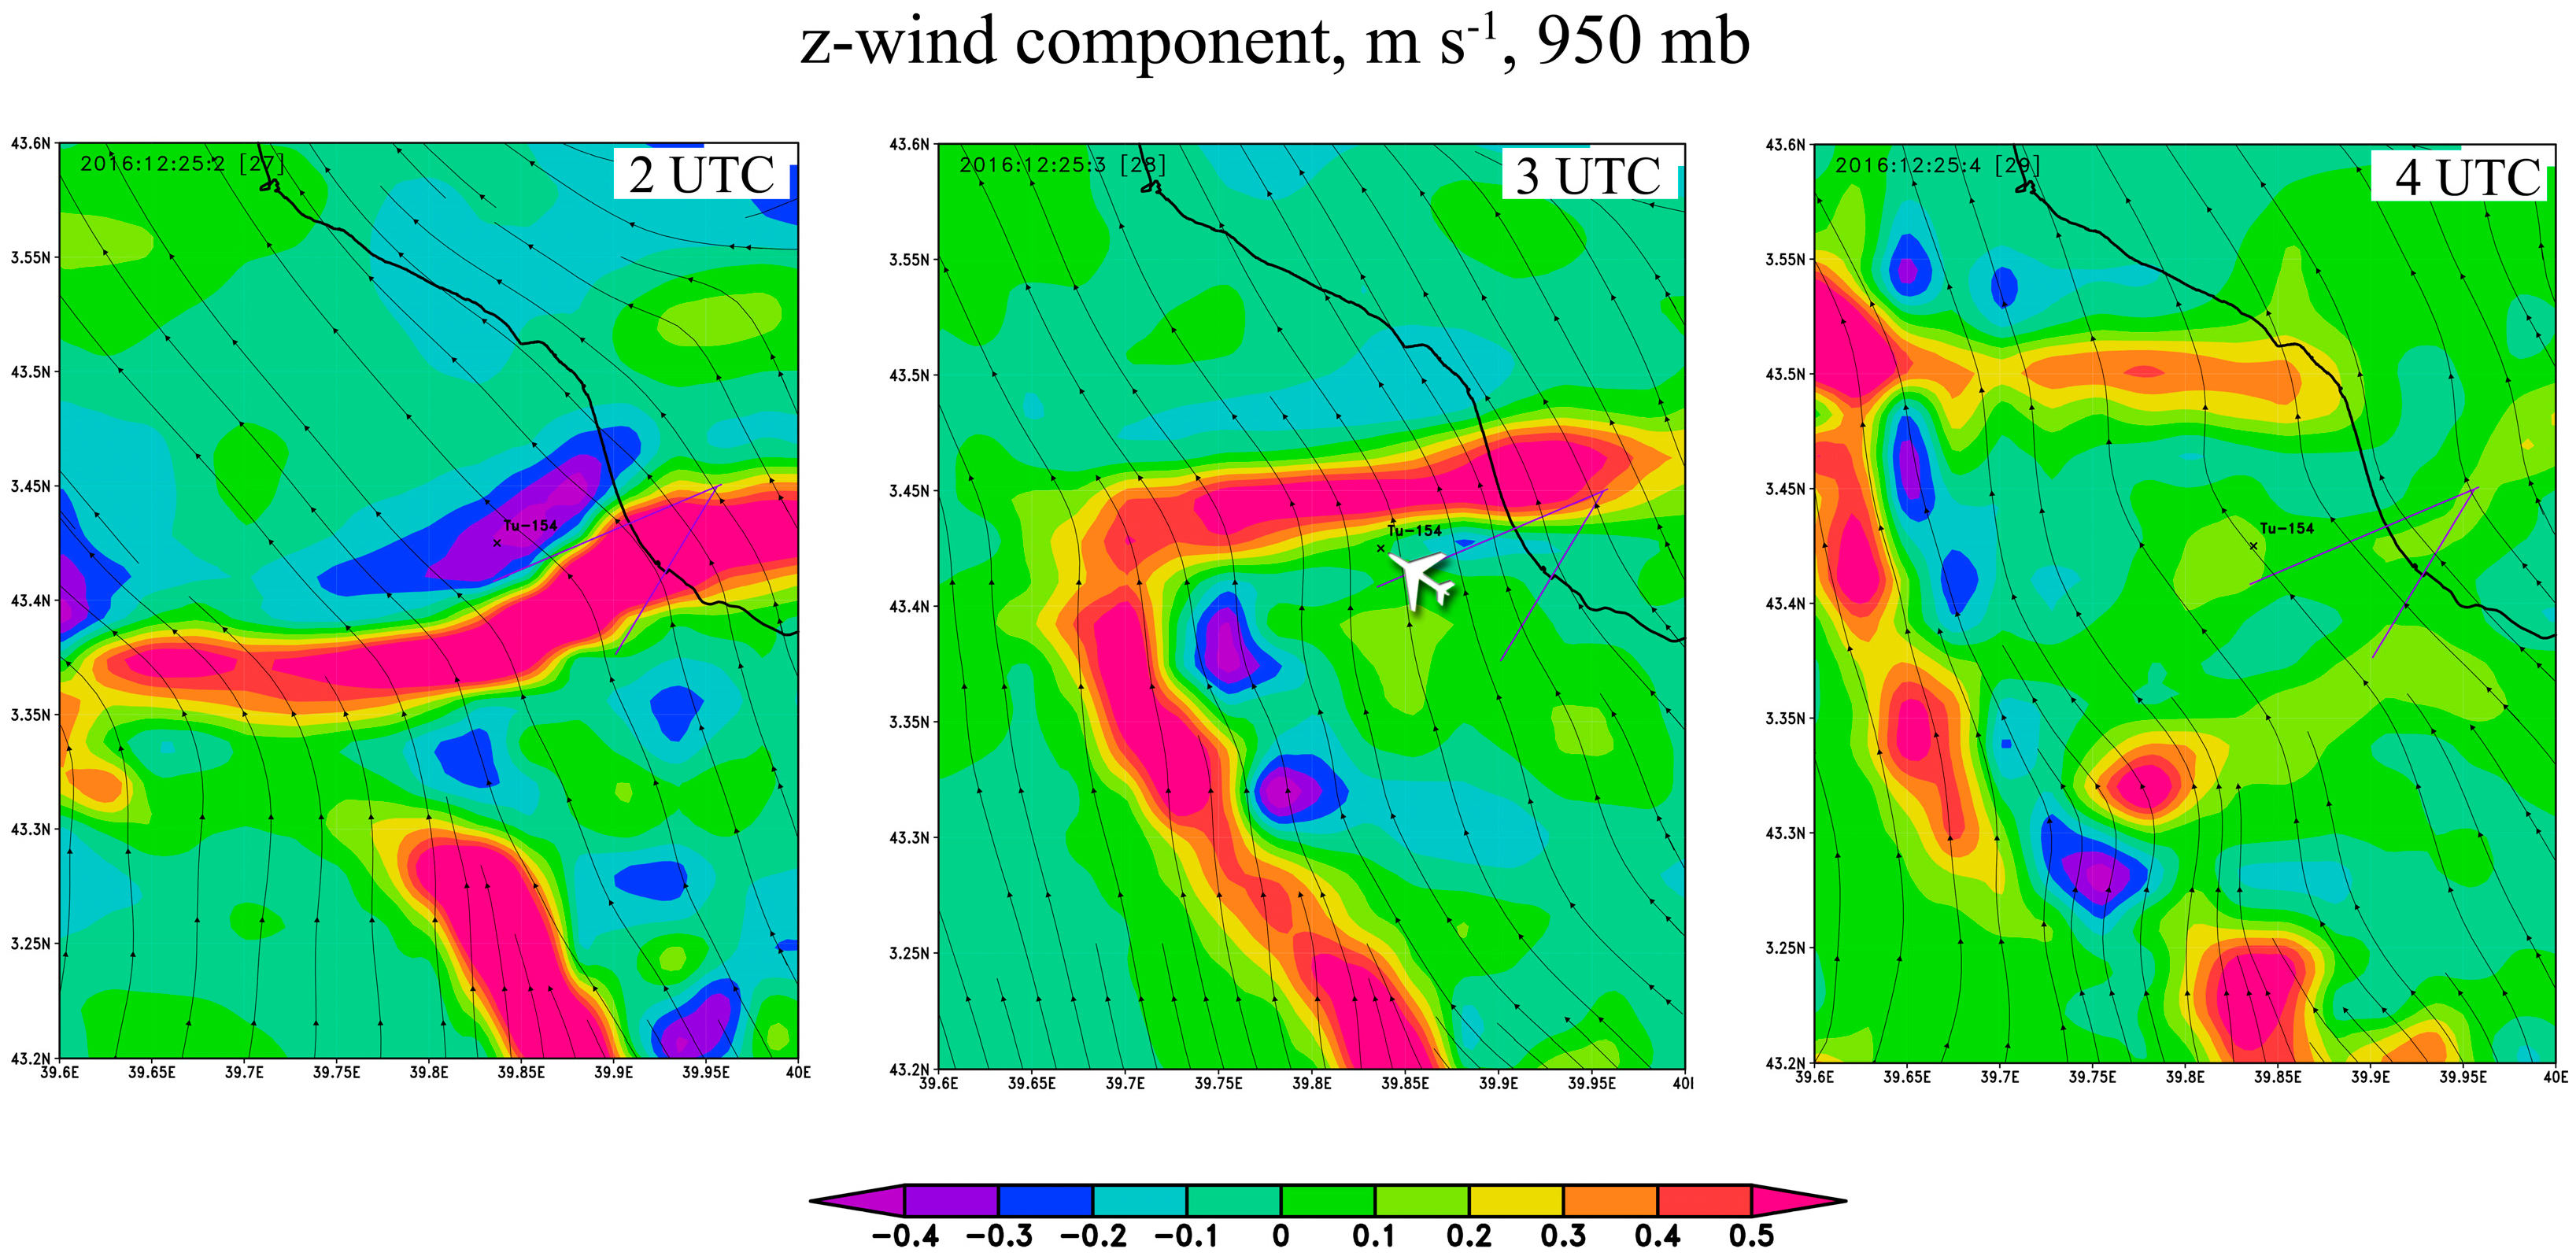
The dynamics of the temporal variation of the w-Front are presented at an enlarged scale in Figure 5 for 25 December 2016, at 02:00, 03:00 and 04:00 UTC. Note that the Tu-154 #RA-85572 accident occurred at 02:27 UTC during take-off from the southern airport runway. The simulation was run using the WRF-ARW model with a 2 km resolution in the approximation of the absence of model local mixing near the surface. The contour of the coastal line is drawn with a black solid line. Additionally, the horizontal (u, v) wind streamlines are shown. The location of the Tu-154 crash and both glide paths also are shown in Figure 5. It can be seen from Figure 5 that the local SBF spatial distributions in the aerodrome glide paths changed quite rapidly.
The turbulence (below, QKE is twice the Turbulent Kinetic Energy (TKE)) at an altitude of 950 hPa on 25 December 2016, at 03:00 UTC, at the Tu-154 #RA-85572 accident site, was insignificant: less than 1–2 m2 s−2 depending on the WRF-ARW parameterizations. Similarly, depending on the parameterizations, the modules of the horizontal wind speed were in the range of 6–10 m s−1. Then, for the case of the Airbus A320-211 #EK-32009 crash, the turbulence at 950 hPa did not exceed 0.2 m2 s−2 and the module of the horizontal wind speed was in the range of 2–4 m s−1. Thus, it is possible to draw the conclusion that in both the Tu-154 and Airbus A320 aircraft crashes near Sochi, at the moment of the accidents, neither turbulence nor horizontal wind speed at the time of the disasters was critical to the aircraft values.
The longitudinal cross-sections of the vertical component of wind speed in the near-surface 0–4 km layer are presented in Figure 6 for the accidents already discussed above: Airbus A-320 #EK-32009 (Figure 6a) and Tu-154 #RA 85572 (Figure 6c). The cross-sections were made near the points of collapse in the direction of the sea-land latitude, which is equal to 43.383° N and 43.425° N, respectively. Figure 6b, corresponding to the crash of Airbus A-320 #888T-XL, is discussed below. The simulations were made using the WRF-ARW model in the approximation of the absence of model local mixing. The markers in Figure 6 show the expected altitudes of the starting positions of the aircraft crashes. Note that in all cases at a high altitude of ~2.5 km, the air mass moves from the warm sea, while, at a low altitude of 0.5–1 km, the air mass moves in the reverse direction, that is, from the land. Additionally, for usability, in Figure 6, the (u, w) wind streamlines and the sea–land directions are specified.
The crash case of the TOGA flight test which occurred at a low altitude with Airbus A320-232 on 27 November 2008, 16:00 UTC, is additionally presented in Figure 6b. The cross-section was made at a latitude of 42.663° N. Let us note that, in this case, the land is on the left side in the figure, unlike in Figure 6a,c.
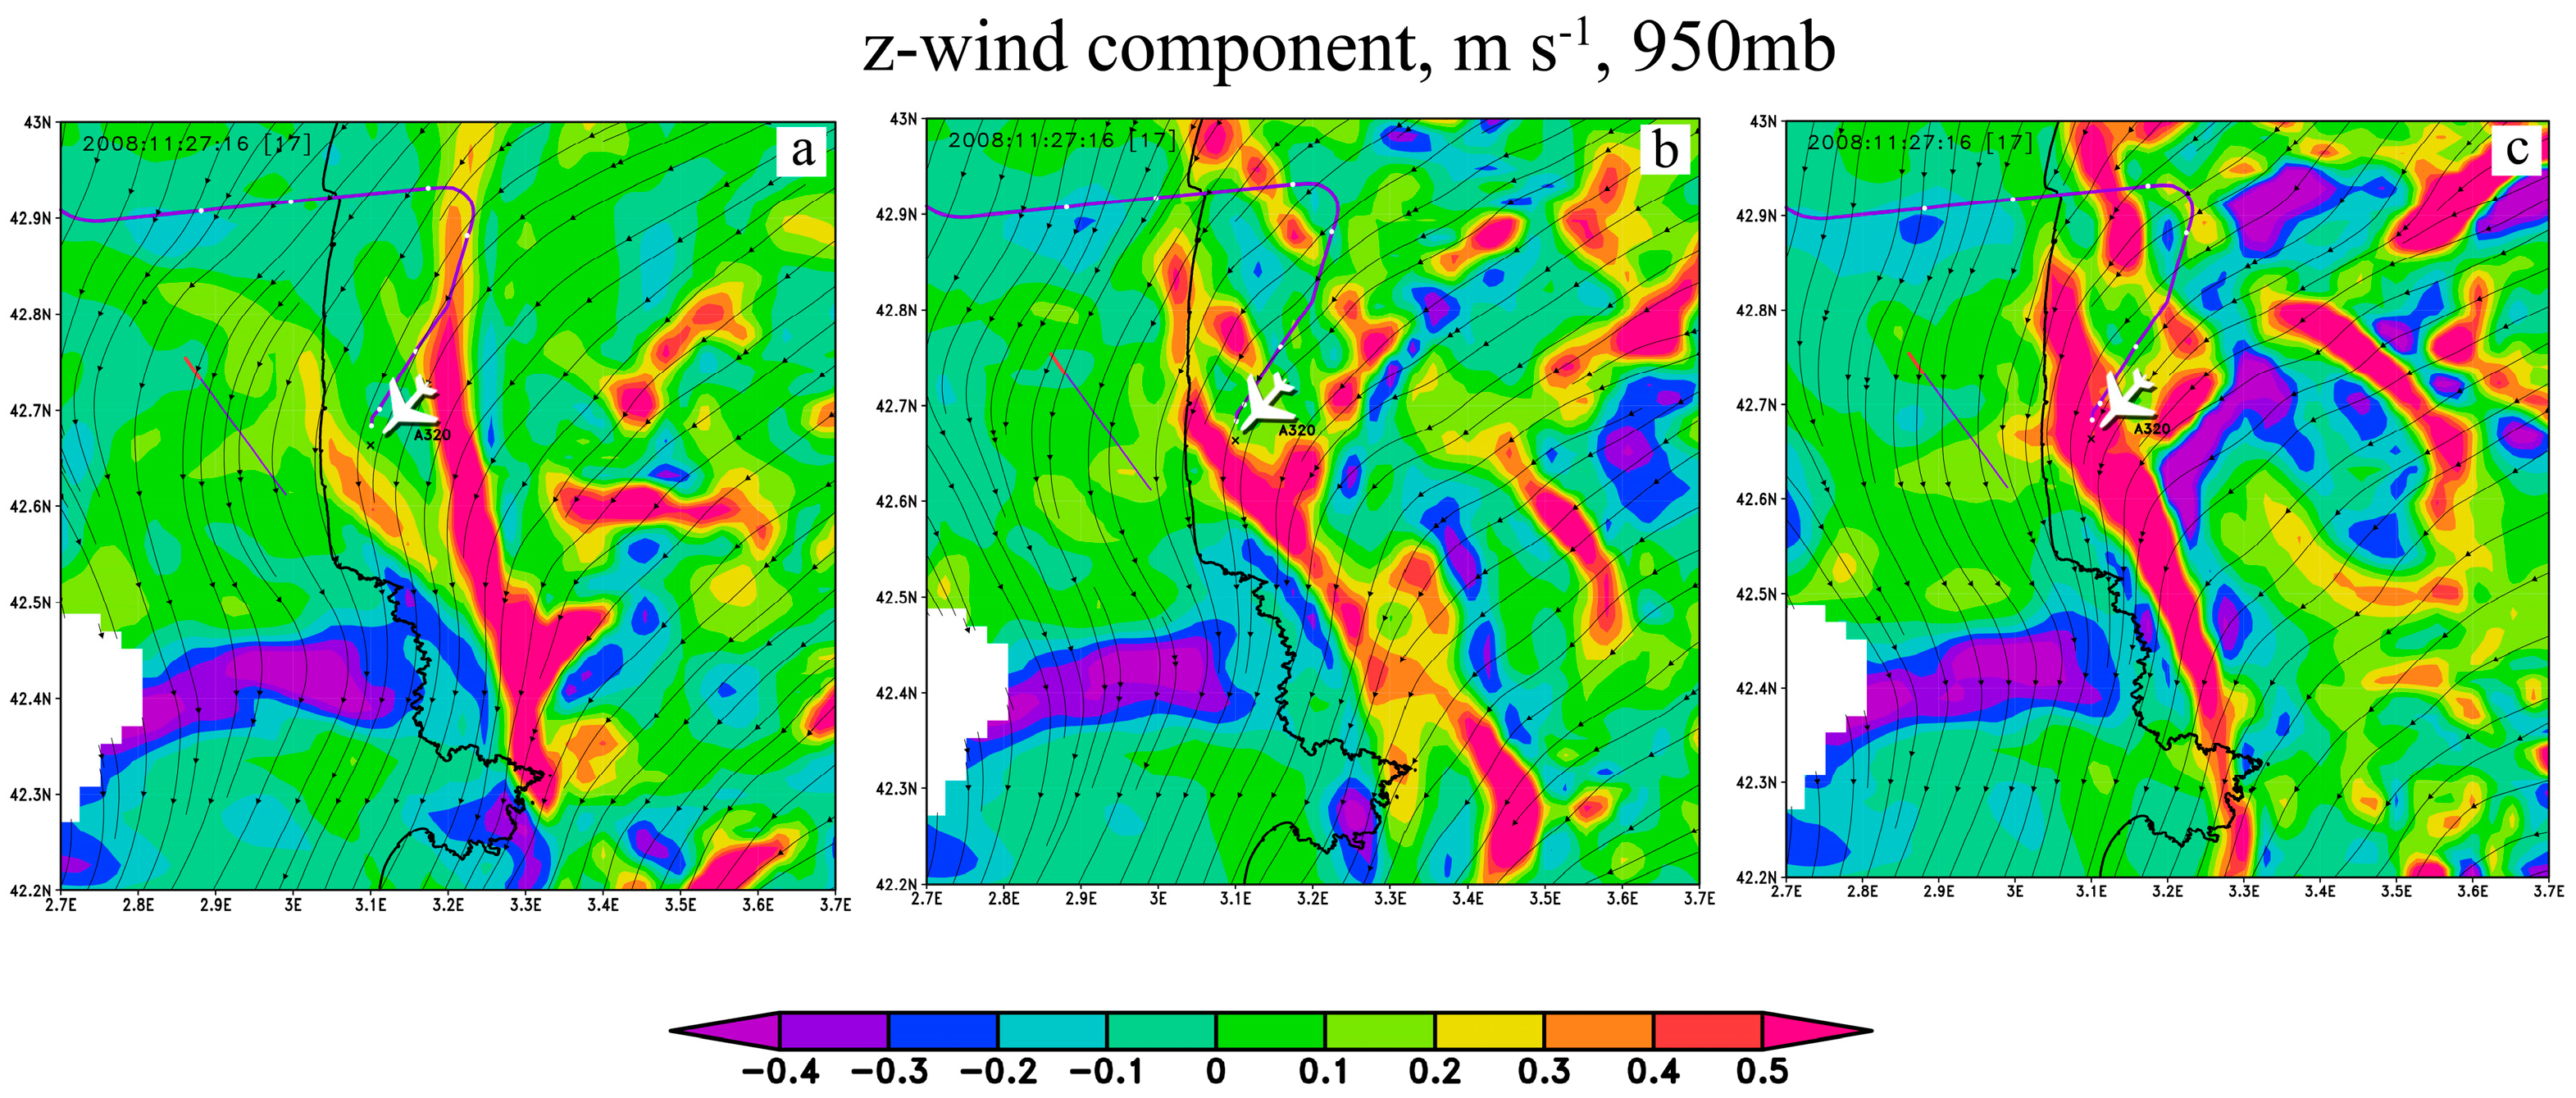
The spatial distribution of the vertical wind speed component at 950 hPa for the A320-232 #888T-XL crash on 27 November 2008, 16:00 UTC, simulated by the WRF-ARW model with a 2 km spatial resolution, is presented in Figure 7 with different surface model parameterizations applied. The cases in Figure 7a–c correspond to the simulation scenarios as follows: (a) simulation without accounting for local mixing at low altitudes; (b) simulation with consideration of thermal diffusion from the surface; (c) simulation with additional high-resolution SST assimilation. In Figure 7, the A320-232 route is indicated by a purple line; the white dots correspond to the moments of communication with the aerodrome services. The airfield is indicated by a short red line. The white area in Figure 8, as above, corresponds to the underground model level. In all cases, the horizontal wind speeds were not high, in the range of ~8–10 m s−1. Note that the turbulence at the time of the collapse of A320-232 #888T-XL was high, in the range of ~2–2.5 m2 s−2, and, in the simulation case using the five-layer thermal diffusion model, the turbulence reached values of ~3.5–4.5 m2 s−2. Therefore, as possible causes of the A320-232 crash, in addition to the SLF, it should be noted that high turbulence was a factor that could have led to the aircraft accident. The local zone of high turbulence stretched along the coast and closed off the approach to the airport glide path from the sea (not shown in the figures).
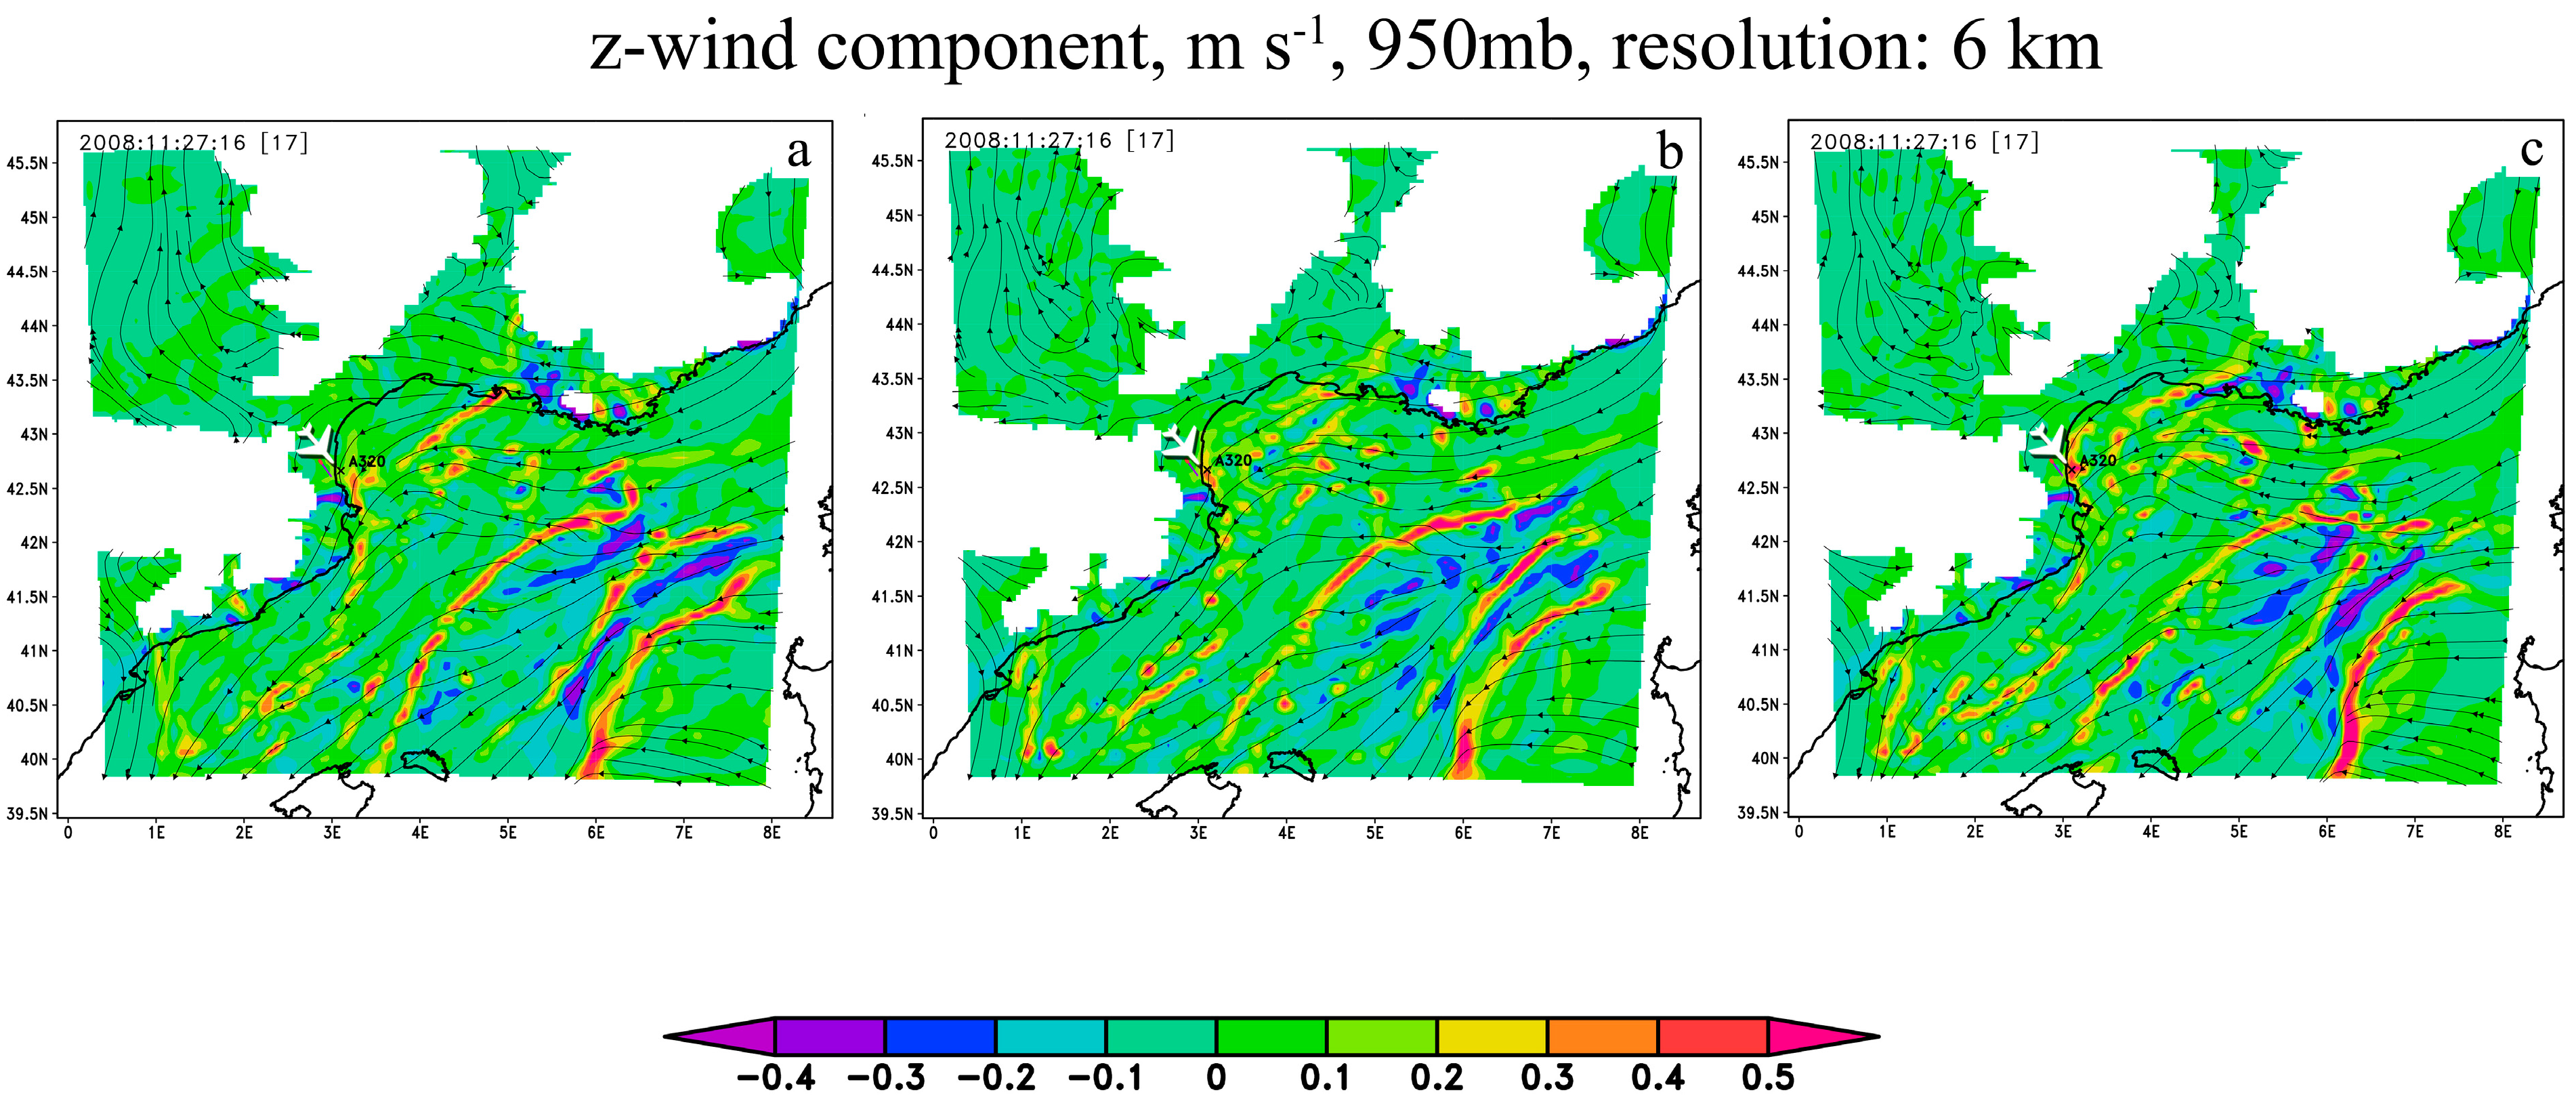
In Figure 8, the spatial distributions of the vertical component of wind speed have the same parameterizations as in Figure 7 but with a 6 km resolution. As can be seen from the figure, the SLF can be observed not only close to the coast but also at a considerable distance from the coast (~100 km). The structure of the SBF, as one would expect, was blurred when local mixing was taken into account (compare Figure 8a–c).
In this section, we show that the three aircraft accidents occurred during flights along the coastline at SLF formation sites. The value of the vertical speed w-Front in the SBF suddenly increased to 0.5 m s−1 and higher. In all the cases considered above, when the aerodynamic lift forces failed and the aircraft lost altitude, the pilot/autopilot tried to recover the aircraft’s position, which led to a sharp increase in pitch, loss of stability and stalling of the aircraft. Without special technical tools, the crew cannot see the w-Front; therefore, it is necessary to take into account the surprise of the crew at the appearance of the w-Front in the aircraft route. When an aircraft falls from a low altitude of ~500 m, the crew has less than 10 s, which is not enough time to recover the position of a modern aircraft.
The time during which the aircraft crosses the w-Front can be estimated as:
τ     L w / u a
where Lw is the bandwidth of the disturbances of the vertical velocity component in the w-Front of the SLB; ua is the aircraft speed. Taking into account that the aircraft speed on the glide path over the surf is equal to ~300 km/h and Lw is equal to ~1–2 km, when crossing the SLF, the pilot’s decision time is equal to ~12–24 s.
On the other hand, in a case of zero lifting force, the time of a body falling from an altitude of h without accounting for friction is:
T     2   h   / g
where g is the gravitational constant. Thus, the time of the plane’s fall from a height of 1 km in the w-Front of the SLB will be equal to ~14 s. In this situation, it is not surprising that none of the wrecked aircraft, which were equipped with modern communication systems, had time to send a distress signal. Information about the aircraft crashes came from coastal radar tracking stations.
In some cases, the sudden disappearance of an aircraft over the sea near the coast in the absence of a distress signal is perceived as an inexplicable mystical event. For instance, five Grumman TBM Avenger torpedo bombers disappeared during a United States Navy over-water navigation training flight from Naval Air Station Fort Lauderdale, Florida, on 5 December 1945 (Wikipedia). Then, on the same day, the Martin PBM Mariner flying boat, which launched from Naval Air Station Banana River, disappeared while searching for the flight. A really powerful SLF could have formed along the coast of Florida in the wintertime due to the presence of the warm Gulf Stream, which passes near the coast. As shown above, a w-Front can spread over long distances along the coast. Such a powerful w-Front closes the pathway to landing along the entire Florida coast. In such circumstances, aircraft should fly over the SLF front or turn eastward to land at alternative locations, such as the airdromes in Cuba or the Bermuda Islands.
It was shown in a study that after an aircraft enters an upward meteorological w-Front, it falls downward; it does not fly upward as predicted in Reference [43]. The reason for such a discrepancy is based on the fact that specialists in aerodynamics perform calculations for idealized conditions (aerodynamic w-Front, with w = const) but the ideal conditions do not correspond to the real conditions during an encounter with the SBF (meteorological w-Front, with w-variations), as seen in Figure 1a.
Summarizing, specialists should act urgently to develop lidars for diagnosing w-Fronts and to equip aircraft with them, as well as to forecast meteorological situations using regional atmospheric models which enable the prediction of a w-Front appearing in the sea-land breeze.

4.2. The Mountain Wave Turbulent (MWT) Crash Study Case

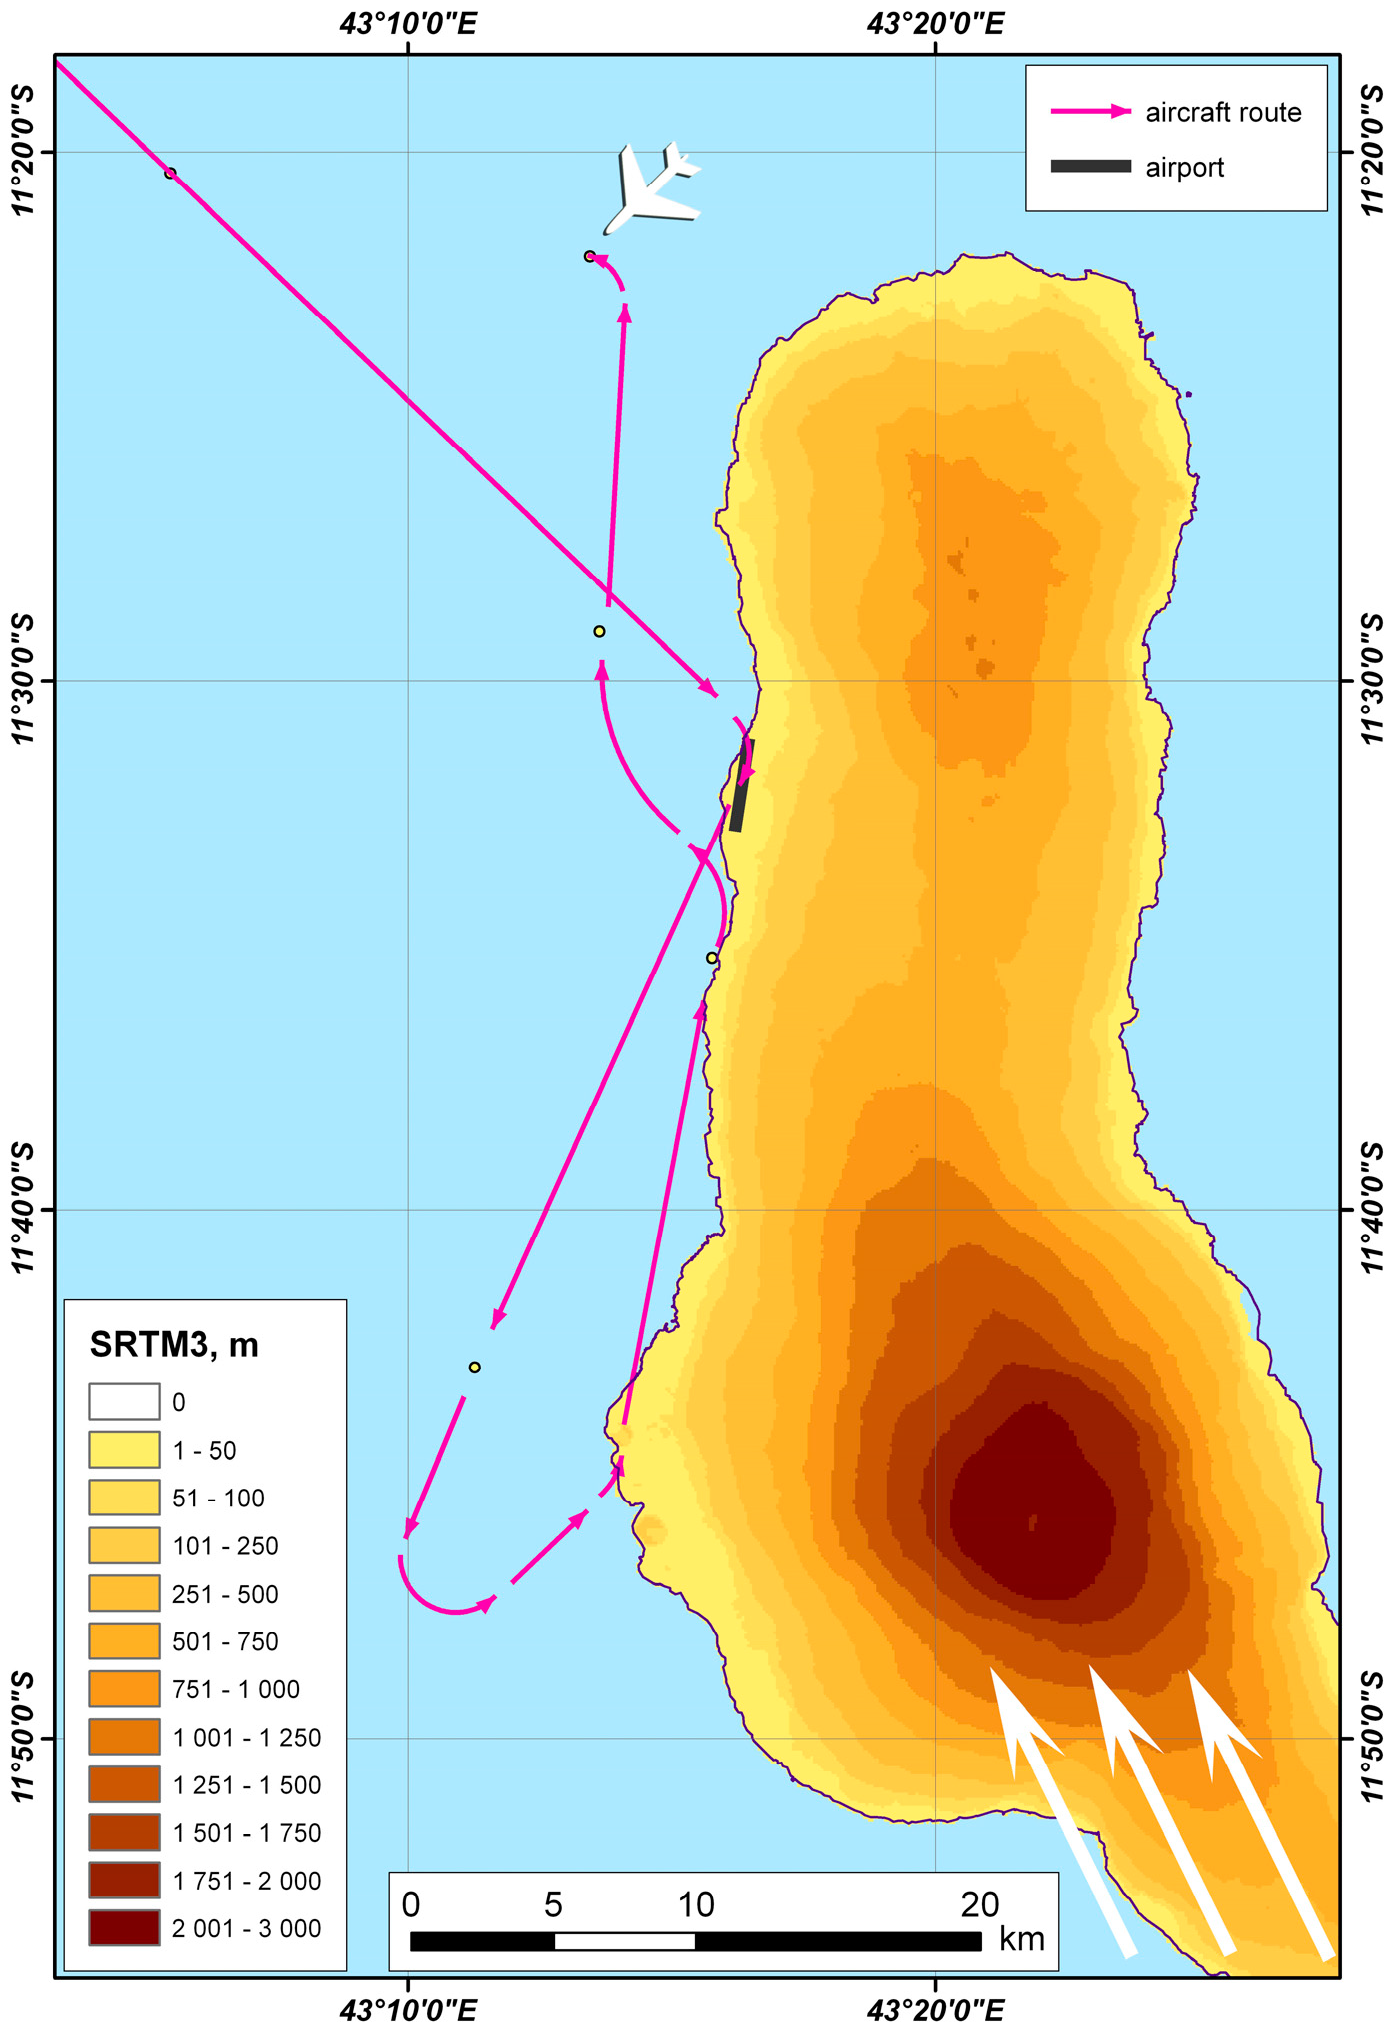
Next, we consider the case of aerodynamic instability appearing in the airflow, which flows over topographic obstacles. An example is the accident of Airbus A310-324 #7O-ADJ in Moroni, Comoros Islands. A homogeneous powerful wind stream dissipated when it flowed around an island volcano (Figure 9). The Moroni aerodrome and the glide path are located in the area of the wind shadow. The high topography obtained by SRTM3 (Shuttle Radar Topography Mission, NASA) with a 3 s resolution is drawn in the figure as a background. In Figure 9, the purple line corresponds to the aircraft flight path; the white arrows show the direction of the powerful wind flow on the day of the aircraft accident. In this study, it was shown that the volcano caused strong perturbations in the homogeneous atmospheric stream that was flowing around the volcano and spread a strong perturbation in the vertical component of the wind speed in the direction of the airport and a glide path. The reconstructed trajectory of the Airbus A310-324 is also presented in Figure 9.
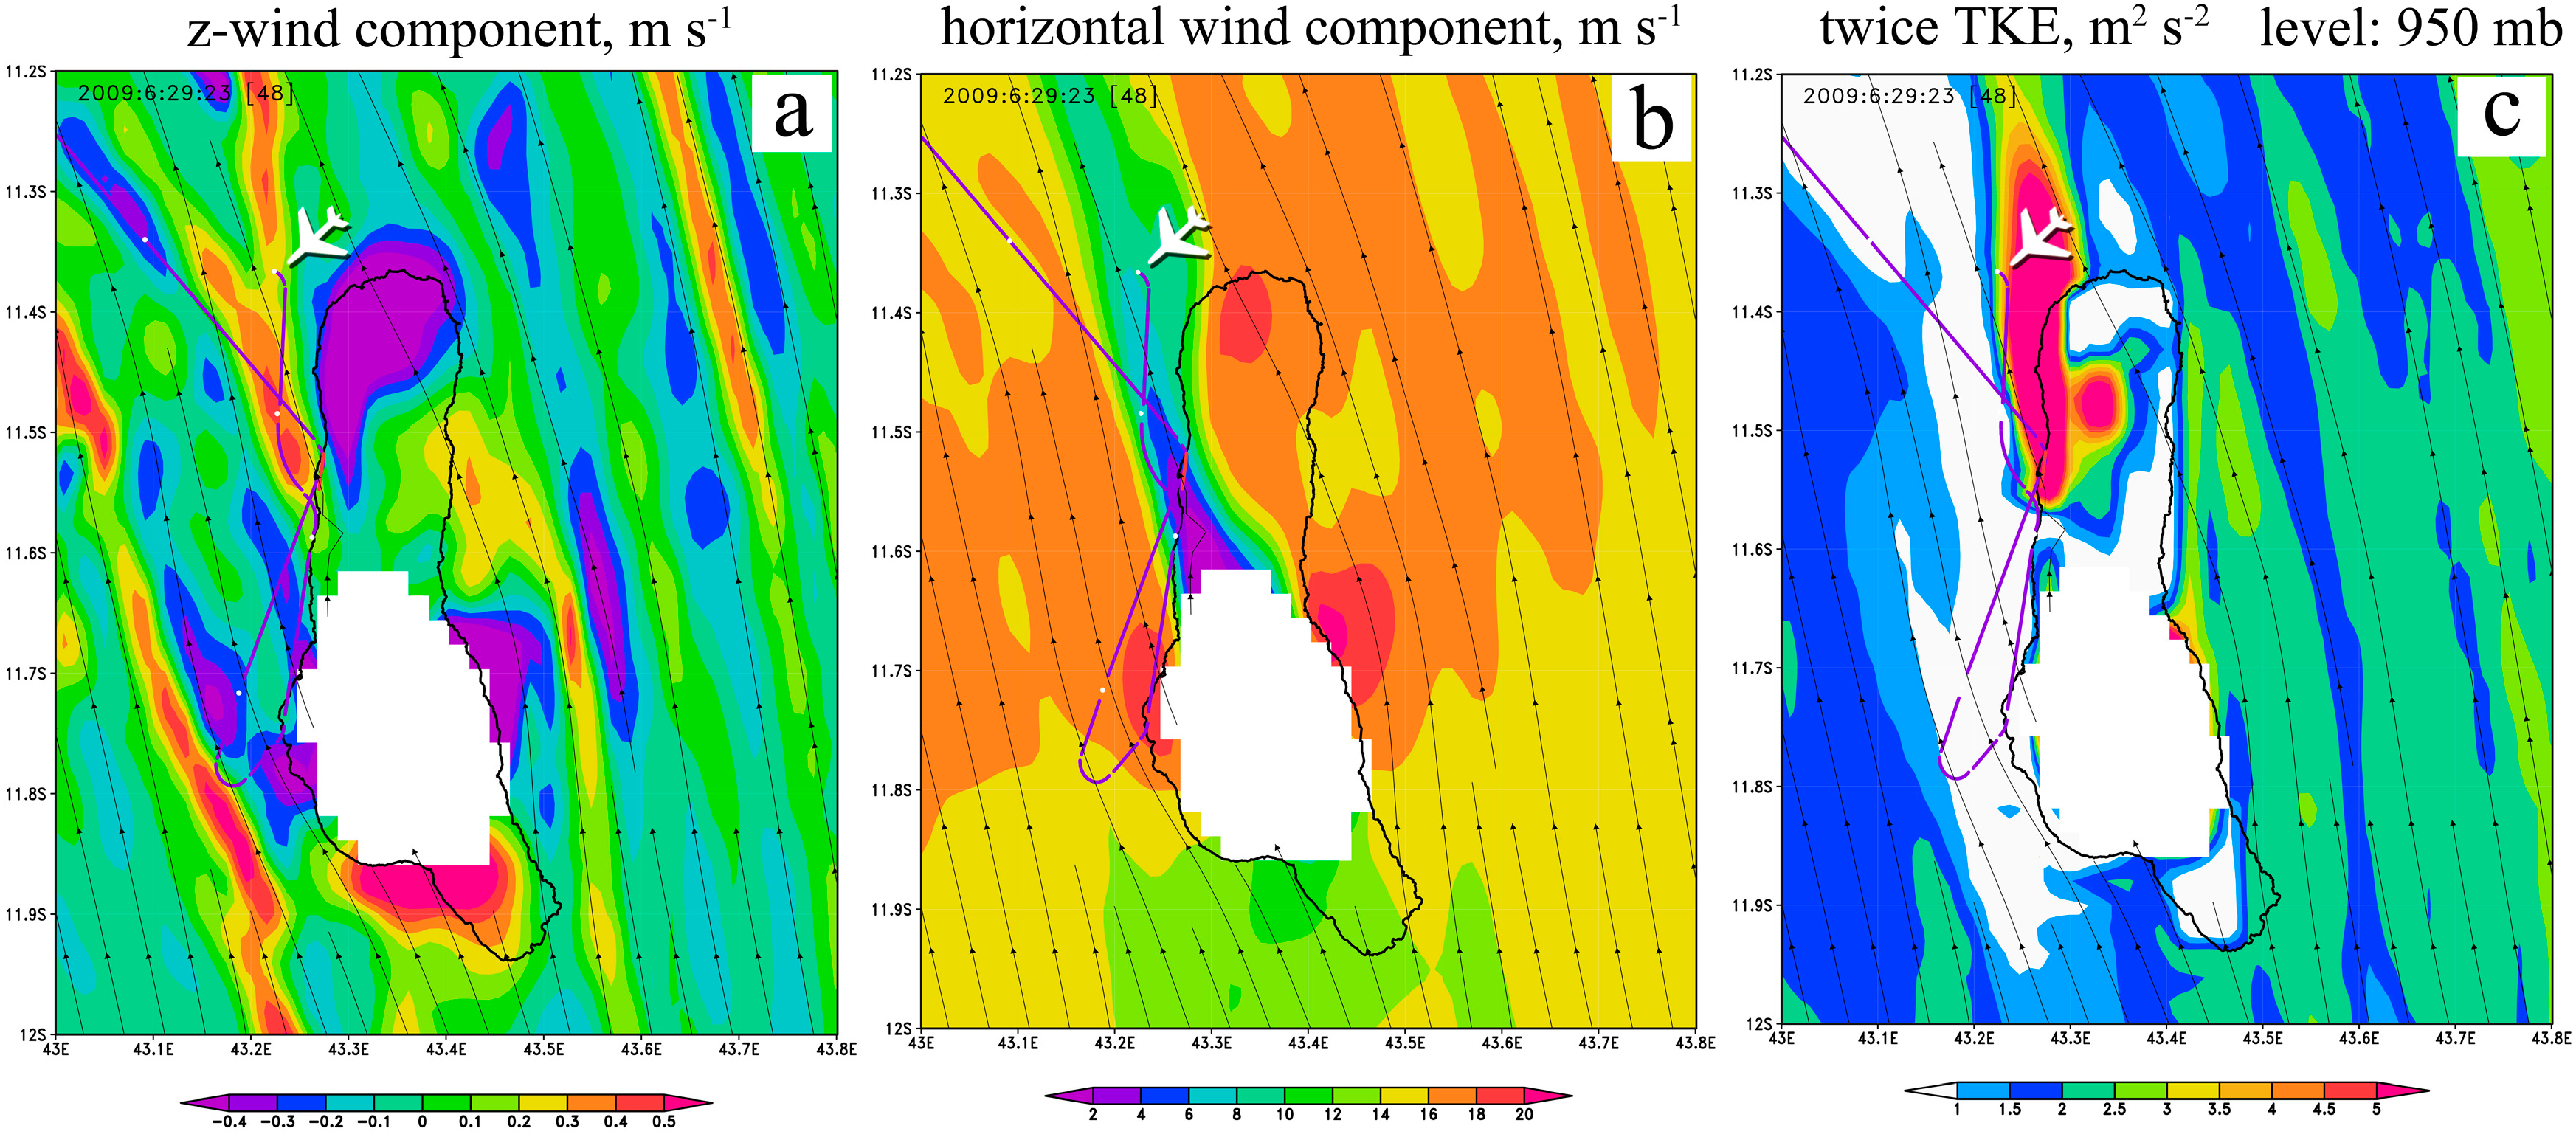
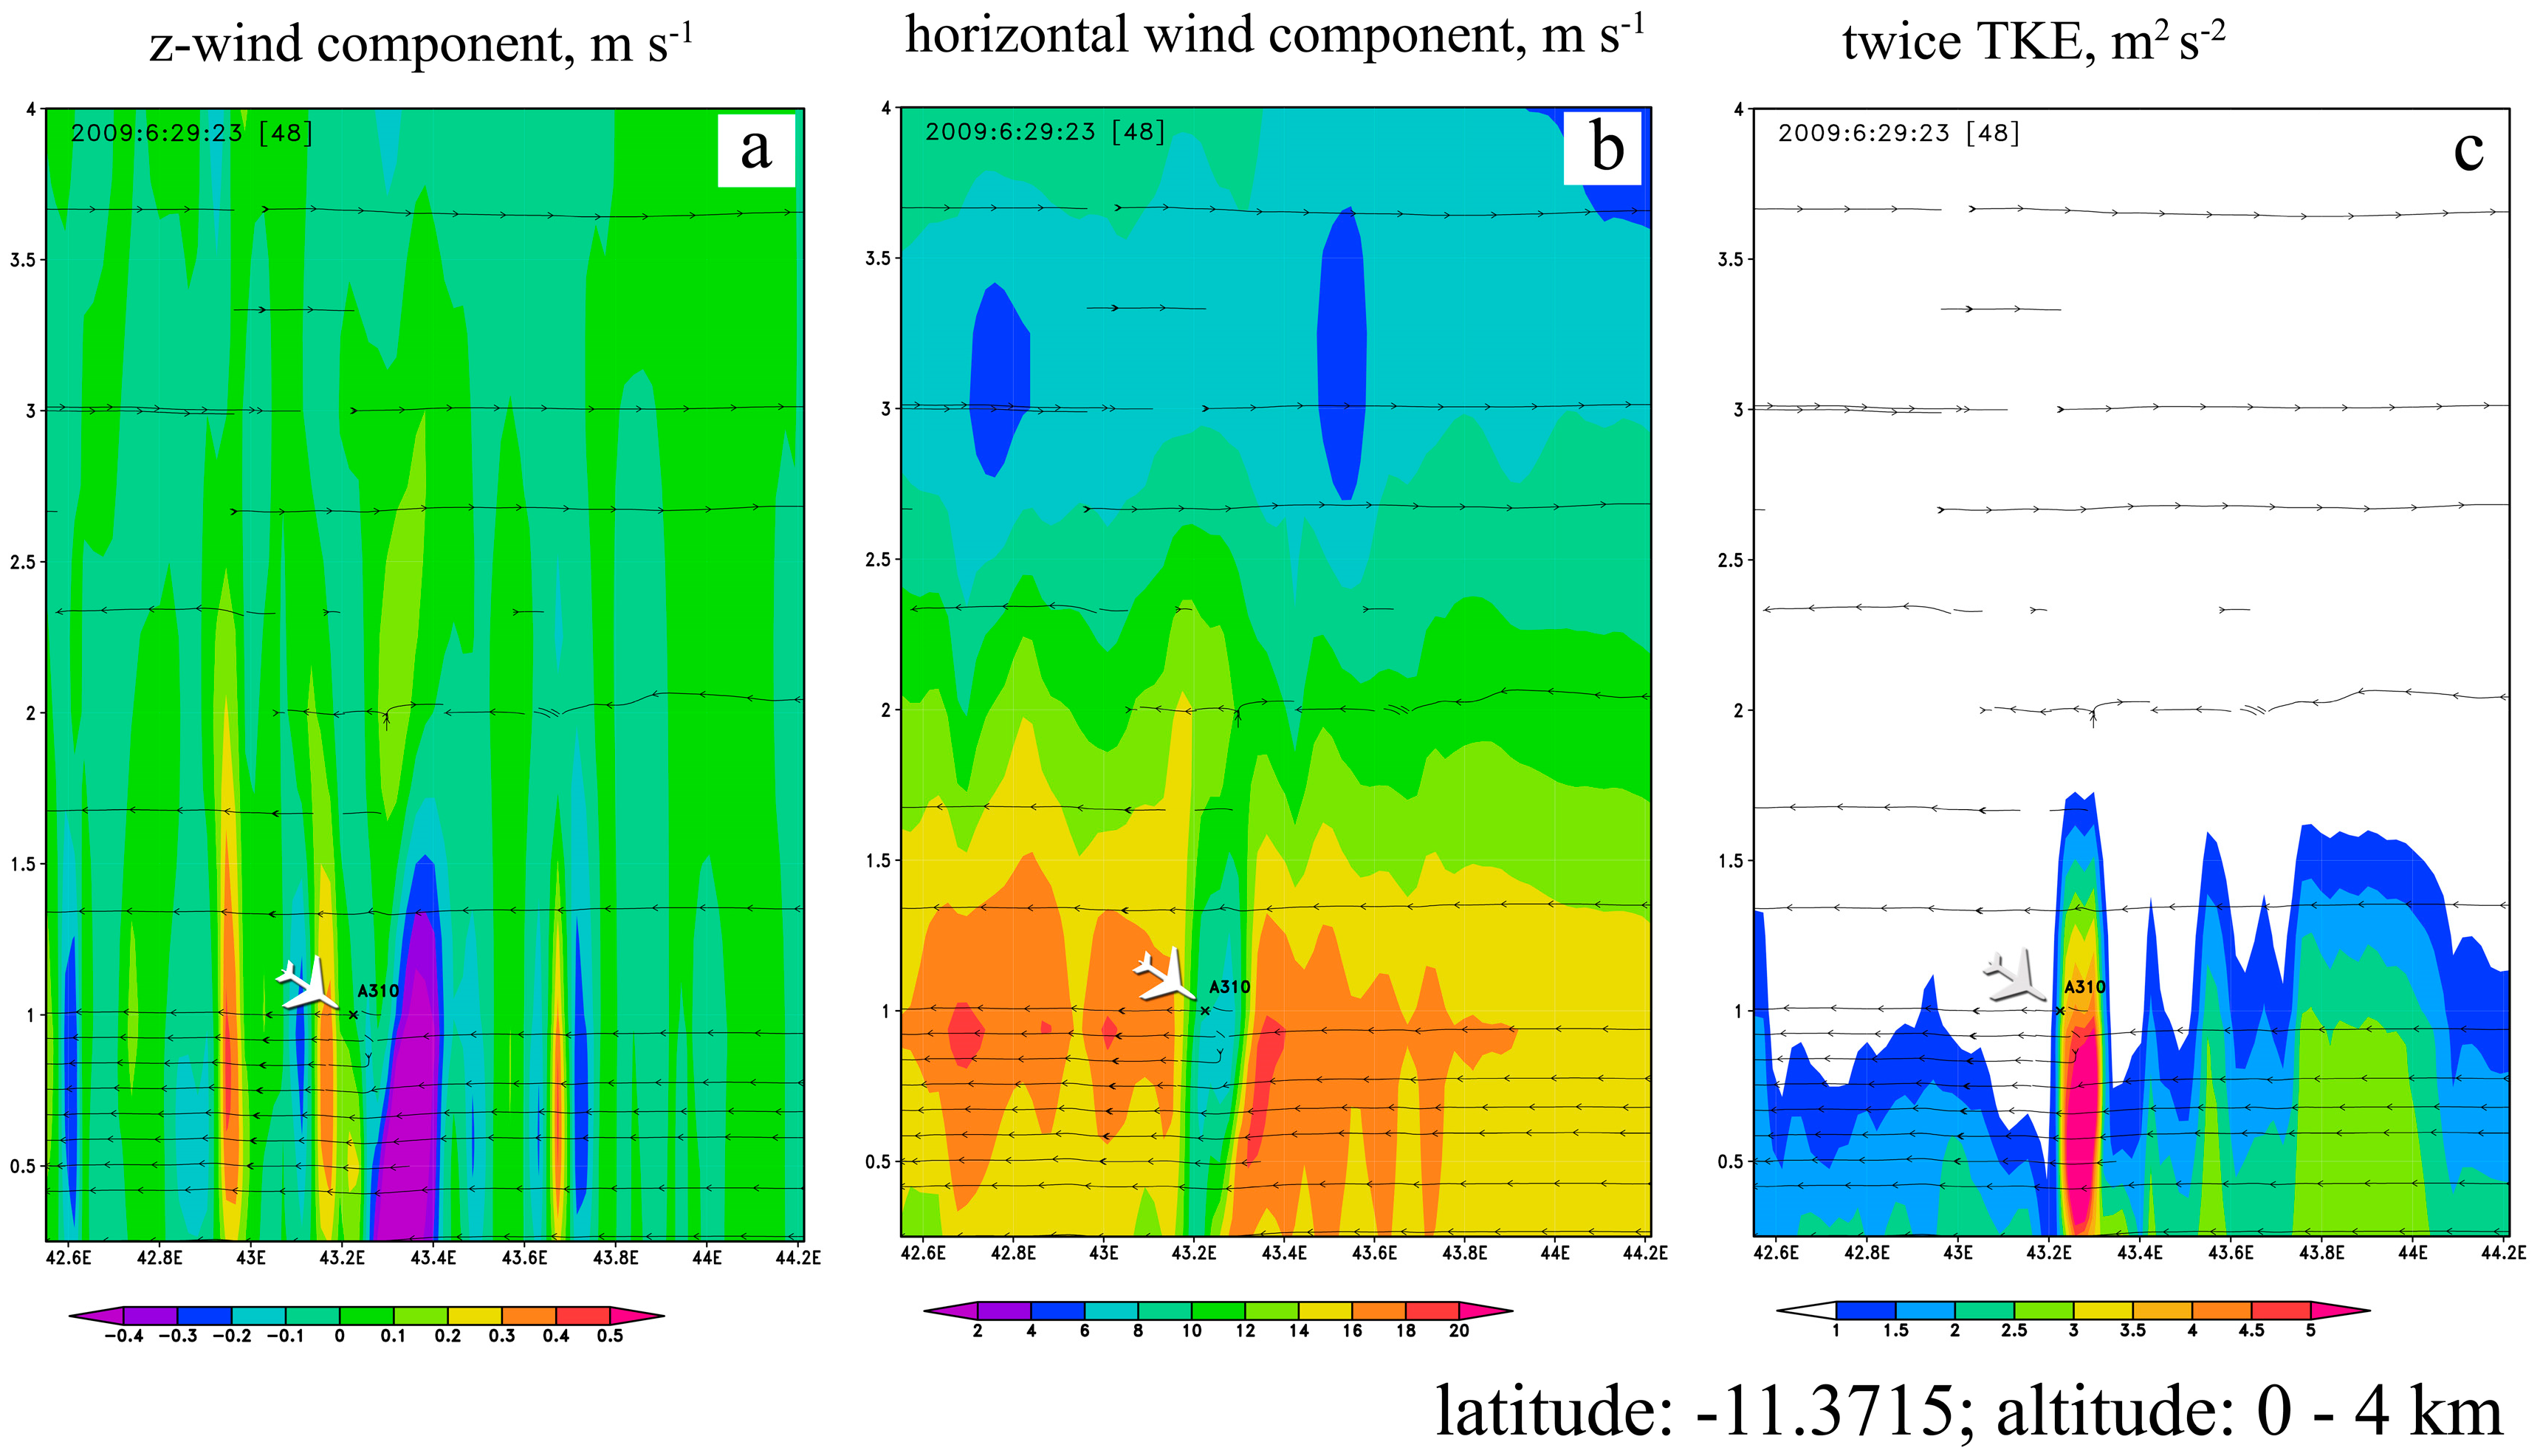
Figure 10 shows the spatial distribution of the vertical and horizontal components of the wind velocity and the doubled kinetic energy of the turbulence at a 950 hPa altitude for 29 June 2009, at 23:00 UTC, simulated by the WRF-ARW model with a 2 km resolution. The simulation was done using the WRF-ARW model with a 2 km resolution in the approximation of the absence of local mixing near the surface. The contour of the Comoros Island is marked by a black solid line. In Figure 10, the air route of the A310-324 aircraft is indicated by a purple line. Immediately before the aircraft accident, the aircraft crossed the border between the strong wind flow (16–18 m s−1) and the area of the wind shadow (2–8 m s−1), which is fully visible in Figure 10b. In the area of the wind shadow, a high turbulence is observed (QKE > 5 m2 s−2), as seen in Figure 10c. At the boundary of the wind shadow, the formation of the w-Front is observed due to the wind shear.
The cross-section of the vertical and horizontal components of the wind speed and the doubled kinetic energy of the turbulence at latitude −11.3715° S in the planetary bound layer (PBL) of 0–4 km are shown in Figure 11. The position of A310-324 at the time of the crash is indicated by a marker. As can be seen in the figure, the air mass disturbance in the PBL was at heights of 1.5–2 km.
As seen from the above example, the plane crash occurred because of the formation of the w-Front due to wind shear at the interface of the wind flow–wind shadow. From this observation, it also can be concluded that an emergency situation arising from the flow around mountains can be successfully predicted by the regional WRF-ARW model.

5. Conclusions

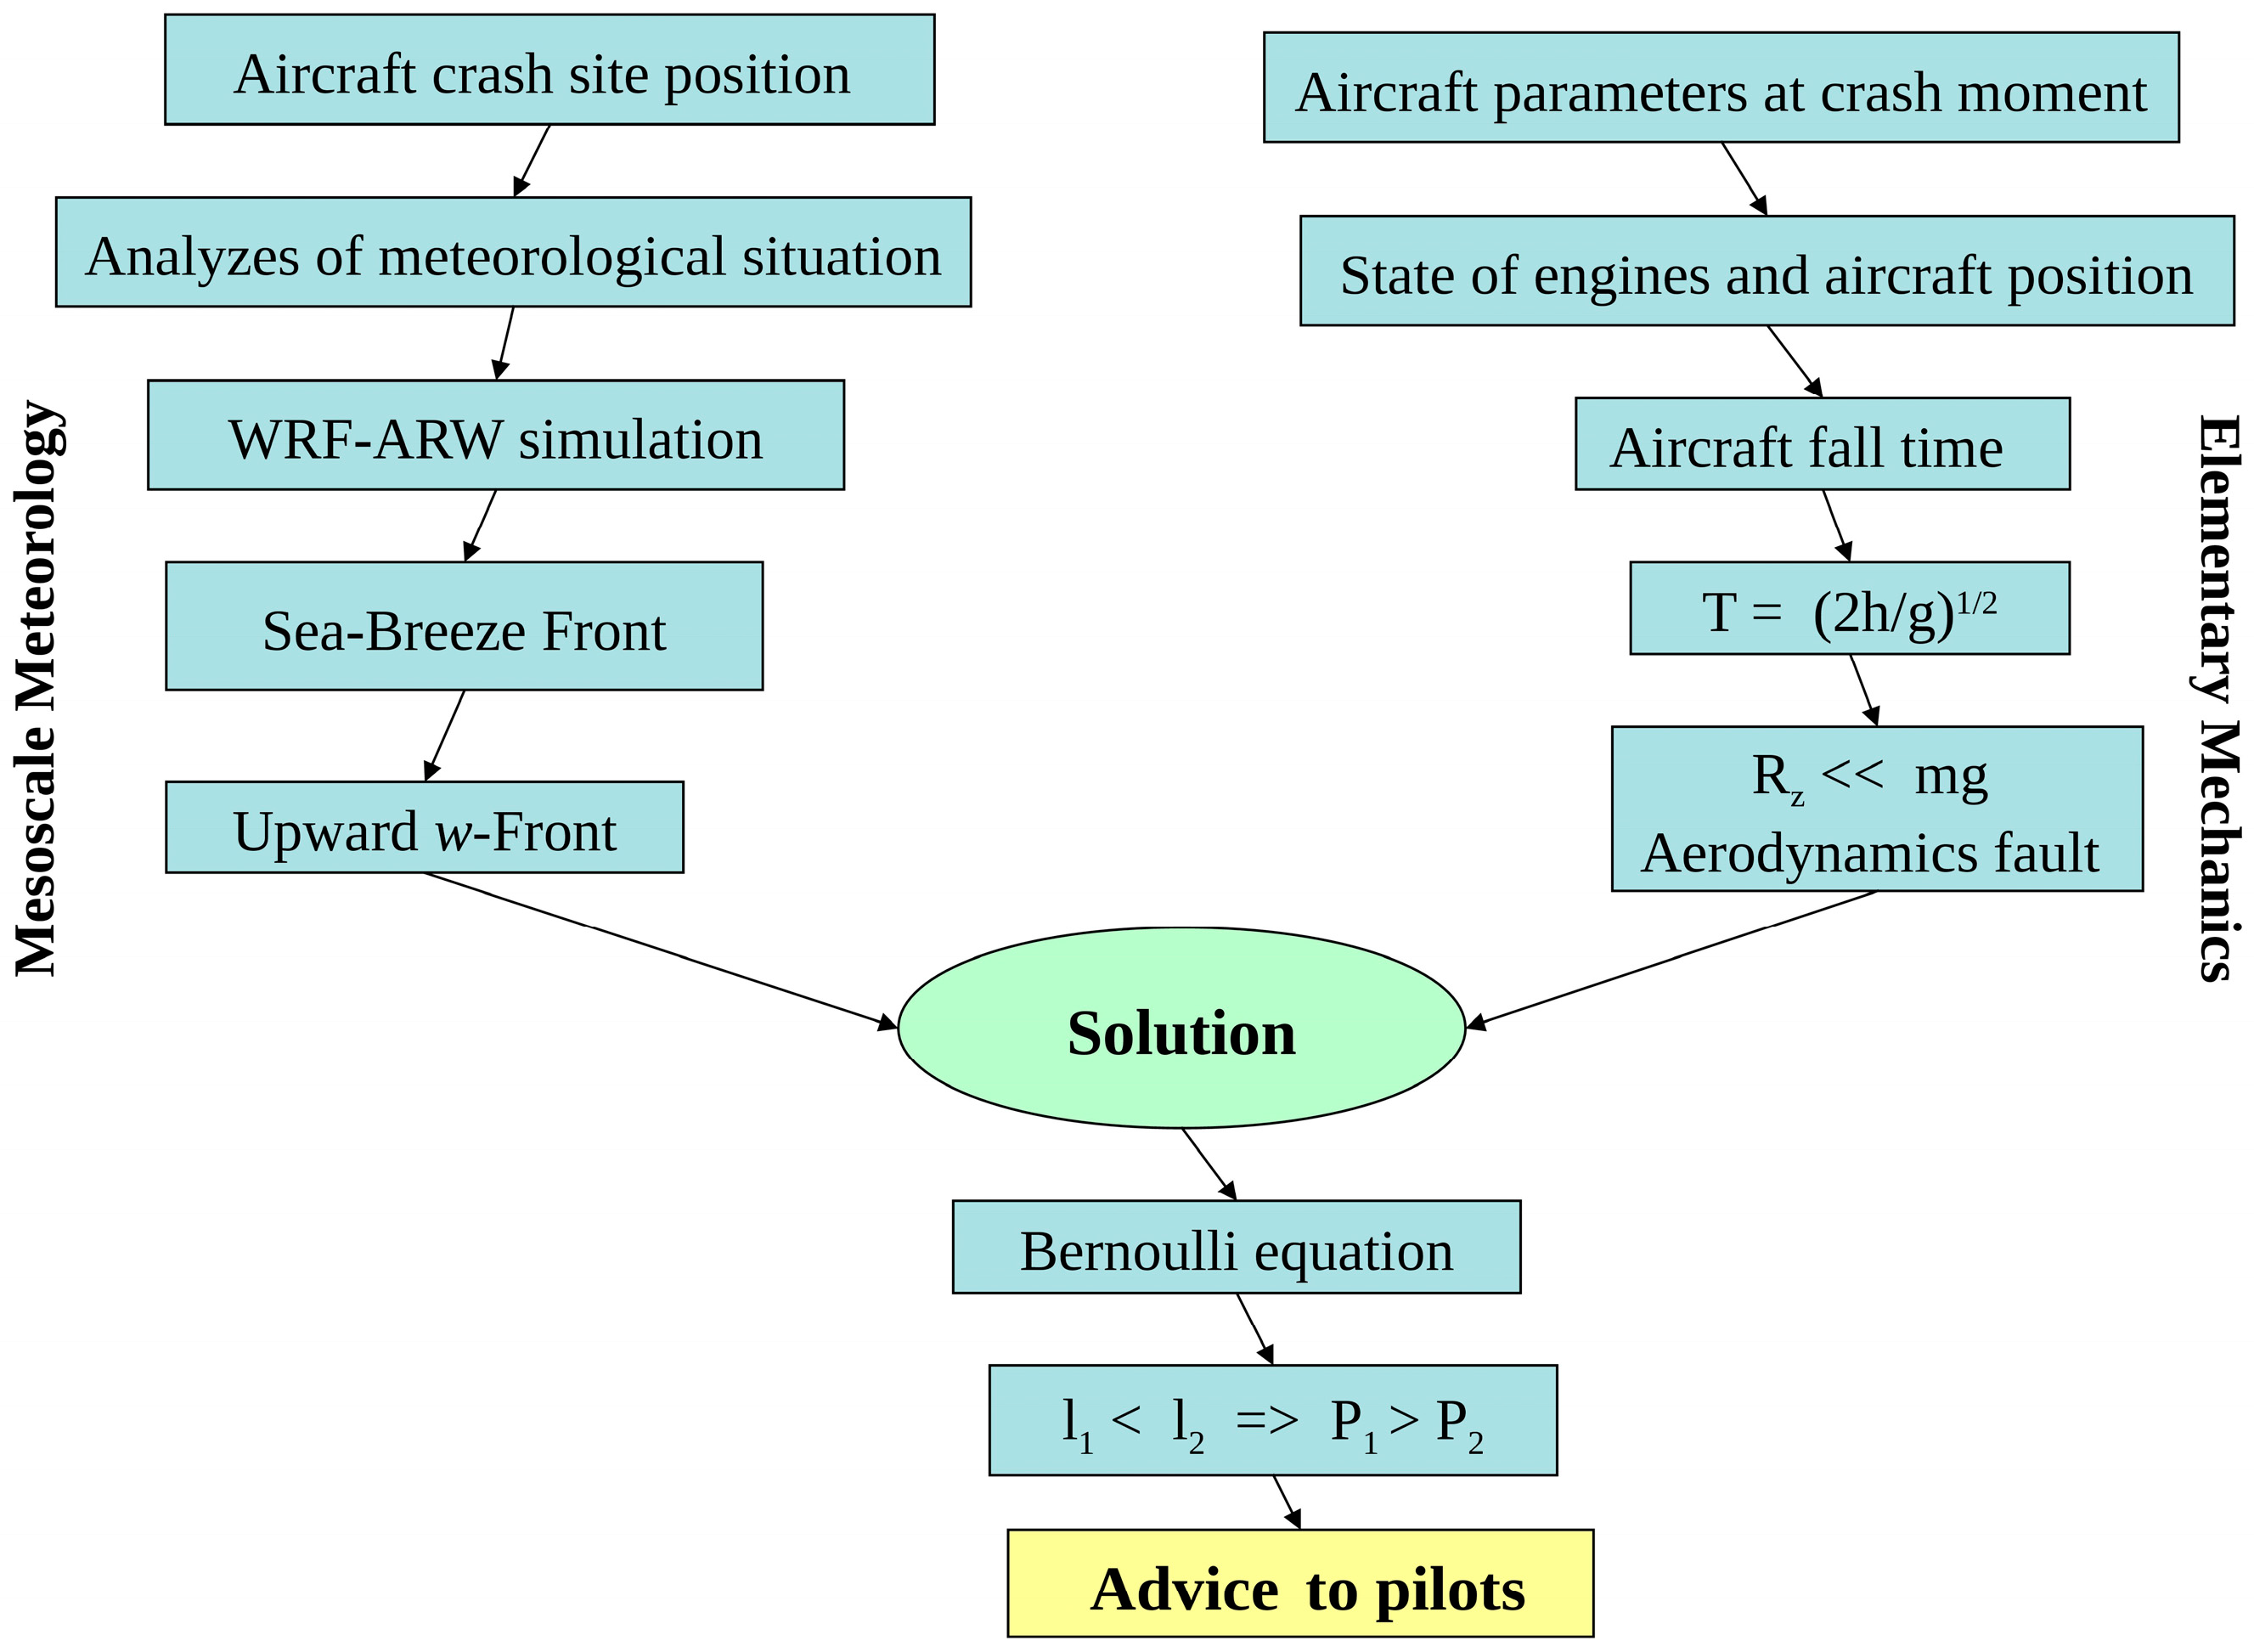
In this study, we investigated the causes of emergency situations that occurred for four aircraft of different designs. The common scheme, including mesoscale meteorology and mechanics analysis, is presented in Figure 12.
It was shown that in four cases, the cause of aircraft catastrophes was a failure in the aerodynamic lift force (Table 3): upon meeting powerful upward vertical wind fronts, the airflow over the aircraft wing stalled and the lift force decreased dramatically.
In this study, it is shown that a powerful vertical w-Front can form as a result of various atmospheric processes. For example, the winter sea-land breeze led to the formation of a powerful w-Front (SLF), which caused the crashes of Tu-154 B-2 #RA-85572 and Airbus A320-211 #EK-32009 near Adler/Sochi, Russia and Airbus A320-232 #888T-XL near the airport in Perpignan, France. The low altitude of a glide path and a low aircraft speed during take-off and landing make the coastal airfields extremely dangerous. The pilots do not have enough time to correct the alignment of the plane. The critical value of the vertical wind speed in the SLF is equal to ~0.5–1.0 m s−1.
It is shown that the SLF is stably predicted by using the regional atmospheric WRF-ARW model with a spatial resolution of not less than 2 km. It is proposed to use such regional models for SLF forecasting. Since SLFs, as a rule, have a height of about 2 km, it is recommended to accelerate climb during take-off in the band of the sea. In the presence of two take-off/landing glissade paths, flights should be carried out from the land side. In the presence of an SLF, it is strongly forbidden to take flight over the sea at a low altitude along the coast. Also, it is recommended to install lidars in aircraft for visual identification of a w-Front. A potential reason for the sudden disappearances of planes near the coast of Florida is also proposed. Due to presence of a powerful warm Gulf Stream the “Bermuda Triangle” is more suitable as SBC w-Front test-flight polygon than “Perpignan Triangle” in France, “Sochi Triangle” in Russia or “Java Triangle” in Java Sea. The “Bermuda Triangle” phenomenon was not early discussed in this aspect.
For the example of the Airbus A310-324 #7O-ADJ accident at the landing of Moroni, Comoros Islands, it is shown that Mountain Wave Turbulence (MWT), together with the powerful w-Front, could be the cause of the aircraft crash. At aerodrome weather stations, except for global weather forecasts, it is proposed that regional model forecasts be used for predicting the behaviour of airflow flowing over volcanoes and mountain ranges. The results of this research are summarized in Table 3.
During air accident investigation it is commonly accepted that plane accidents involve multiple causal factors, such as sensor malfunction, loss of spatial orientation and excessive levels of stress and fatigue amongst flight crew. In this study we point out that identification of the main cause of the accident is a very important task. It can prevent the repetition of accidents in similar situations. If the cause of the accident, for example, is specified as a malfunction of Pitot tubes, it will lead to a change of these tubes’ design but it might not prevent aircraft accidents. However, if we point attention to the instability of partial pressure that is measured by Pitot tubes, this will lead to additional study of the flight aerodynamics.
This study demonstrates, for the first time, a simple correlation between the mild upward w-Fronts (w-Columns) and aircraft crashes using several examples. It is suggested that disturbing the air mass under the airplane wing is enough to cause the aerodynamics to fail. Note that since the aerodynamic lift forces were not calculated in this study, it is only a hypothesis.
Further, consequences for an aircraft are determined not by the width of the upward w-Front itself and not by the convective jet velocity (0.5–1.0 m/s or 15–25 m/s) but by the time during which the aircraft is flying in the aerodynamic failure zone. If the aircraft is flying in the failure zone when τ = ~1 s, there will be an airborne bump(s); if the aircraft is in the aerodynamic failure zone for τ = ~10 s, it is possible for the aircraft to fall from the glide path to the earth/ocean surface with catastrophic consequences; at large values of τ, an aircraft falling from a high altitude can be destroyed in the air (see acknowledgment, τ = ~13 s).
For a group of flights, a failure in aerodynamic lift can lead to simultaneous accidents of several aircraft, leading to a situation which is better known as the phenomenon of the Bermuda Triangle.
The main conclusions are as follows:
r1. Not all meteorological phenomena are solvable and, accordingly, predictable within the framework of synoptic meteorology. Therefore, as a basis for aviation meteorology, it is necessary to use, especially in areas near aerodromes, not synoptic but regional meteorology with a spatial model resolution of ~6 km. Taking into account the features of a forecast in the Grey-Zone, regional meteorology with a resolution of ~2 km could be used.
r2. The consequences of an aviation incident strongly depend on the time range for which the aircraft is in the zone of aerodynamic failure (see the red area in Figure 3, Figure 4, Figure 5, Figure 6 and Figure 7). It is necessary to reduce the time for which the aircraft flies inside these zones. In particular, it is recommended to forbid flight along the coastal zone at altitudes up to 2 km, where an SLF can form.
r3. In this study, it is shown that the main error related to aerodynamics leading to the accident of some aircraft is the performance of aerodynamic calculations for idealized conditions instead of for actual conditions which are disturbed by a w-Front stream.
r4. The causes of the w-Fronts are various. Therefore, aerodynamic failures can occur both in the lower troposphere and in the upper troposphere, for example, at jet stream borders, near cyclone secondary fronts and so forth. It is recommended to equip aircraft with front lidars so that pilots can avoid such aerodynamic failure zones.

Funding

This research received no external funding.

Acknowledgments

I express my gratitude and respect for A.S. Yelokhov and A.Ya. Arabov for their courage and heroism in carrying out scientific aviation measurements in a powerful thunderstorm front, as well as thanks to the crew of the Il-18 aircraft, who successfully landed the damaged aircraft.

Conflicts of Interest

The authors declare no conflict of interest.

Abbreviations and Acronyms

AVHRRAdvanced Very High Resolution Radiometer SST dataset
CIBLConvective Internal Boundary Layer
FNLFinal meteorological dataset of Operational Model Global Tropospheric Analyses, NCAR/NCEP, USA
GFSGlobal Forecast System meteorological dataset, NCAR/NCEP, USA
HCRHorizontal Convective Rolls
IlIlyushin
KHBsKelvin-Helmholtz Billows
NCARNational Centre for Atmospheric Research, USA
NCEPNational Centres for Environmental Prediction, USA
NOAANational Oceanic and Atmospheric Administration, U.S. Department of Commerce
PBLPlanetary Boundary Level
QKEtwice turbulent Kinetic Energy
RTG-HRReal-Time Global High-Resolution SST dataset
SBCSea Breeze Circulation
SBFSea Breeze Front
SBGSea Breeze Gravity current
SBHSea Breeze Head
SLFSea-Land Front in SBC
SSTSea Surface Temperature
TKETurbulent Kinetic Energy
TuTupolev
WRF-ARW(Weather Research and Forecasting)-(Advanced Research WRF) model
wvertical component of wind speed
w-Frontupward front of z-component of wind speed, w > 0

References

  1. Orlanski, I. A rational subdivision of scales for atmospheric processes. Bull. Am. Meteorol. Soc. 1975, 56, 527–530. [Google Scholar]
  2. Ray, P.S. Mesoscale Meteorology and Forecasting; American Meteorological Society: Boston, MA, USA, 1986; p. 793. [Google Scholar]
  3. Holton, J. An Introduction to Dynamic Meteorology; Academic Press: San Diego, CA, USA, 1992; p. 511. [Google Scholar]
  4. Shin, H.H.; Hong, S.-Y. Free Access Representation of the Subgrid-Scale Turbulent Transport in Convective Boundary Layers at Grey-Zone Resolutions. Mon. Weather Rev. 2015, 143, 250–271. [Google Scholar] [CrossRef]
  5. Tomassini, L.; Field, P.R.; Honnert, R.; Malardel, S.; McTaggart-Cowan, R.; Saitou, K.; Noda, A.T.; Seifert, A. The “Grey Zone” cold air outbreak global model intercomparison: A cross evaluation using large-eddy simulations. J. Adv. Model. Earth Syst. 2017, 9. [Google Scholar] [CrossRef]
  6. Wong, W.-K.; Lau, C.-S.; Chan, P.-W. Prediction System for Aviation Applications at the Hong Kong International Airport. Adv. Meteorol. 2013, 11. [Google Scholar] [CrossRef]
  7. Kizhner, L.I.; Barashkova, N.K.; Akhmetshina, A.S.; Bart, A.A.; Starchenko, A.V. Forecast of Precipitation in the Area of Bogashevo Airport Using the WRF Model. Atmos. Ocean. Opt. 2014, 27, 187–194. [Google Scholar] [CrossRef]
  8. Chan, P.W.; Wong, W.K. An Analysis of a Severe Turbulence Event Encountered by an Aircraft over the South China Sea and the Application of Numerical Weather Prediction Models in the Early Alerting. Adv. Meteorol. 2014, 11. [Google Scholar] [CrossRef]
  9. Chen, G.; Zhu, X.; Sha, W.; Iwasaki, T. Toward Improved Forecasts of Sea-Breeze Horizontal Convective Rolls at Super High Resolutions. Part I: Configuration and Verification of a Down-Scaling Simulation System (DS3). Mon. Weather Rev. 2015, 143. [Google Scholar] [CrossRef]
  10. Herman, G.R.; Schumacher, R.S. Using Reforecasts to Improve Forecasting of Fog and Visibility for Aviation. Weather Forecast. 2016, 31, 467–482. [Google Scholar] [CrossRef]
  11. Chaouch, N.; Temimi, M.; Weston, M.; Ghedira, H. Sensitivity of the meteorological model WRF-ARW to planetary boundary layer schemes during fog conditions in a coastal arid region. Atmos. Res. 2017, 187, 106–127. [Google Scholar] [CrossRef]
  12. Antonelli, M.; Rotunno, R. Large-Eddy Simulation of the Onset of the Sea Breeze. J. Atmos. Sci. 2007, 64, 4445–4457. [Google Scholar] [CrossRef]
  13. Rizza, U.; Miglietta, M.M.; Anabor, V.; Degrazia, G.A.; Maldaner, S. Large-eddy simulation of sea breeze at an idealized peninsular site. J. Mar. Syst. 2015, 148, 167–182. [Google Scholar] [CrossRef]
  14. Calmet, I.; Mestayer, P.G.; van Eijk, A.M.J.; Herlédant, O. A Coastal Bay Summer Breeze Study, Part 2: High-resolution Numerical Simulation of Sea-breeze Local Influences. Bound.-Layer Meteorol. 2017. [Google Scholar] [CrossRef]
  15. SOCHI Airport Information, Details for Sochi Adler (URSS). 25 May 2015. (On Russian and English Language). Available online: http://vau.aero/navdb/chart/URSS.pdf (accessed on 25 January 2019).
  16. BEA FINAL REPORT on the Investigation into the Accident Involving the Armavia A320 Near Sochi Airport on 3 May 2006. Available online: https://www.bea.aero/docspa/2006/ek-9060502/pdf/ek-9060502.pdf (accessed on 25 January 2019).
  17. LFMP Airport Information, Details for Perpignan Rivesaltes Airport (LFMP). Available online: http://vau.aero/navdb/chart/LFMP.pdf (accessed on 25 January 2019).
  18. BEA Bureau d’Enquêtes et d’Analyses pour la sécurité de l’aviation civile. Accident on 27 November 2008 off the Coast of Canet-Plage (66) to the Airbus A320-232 registered D-AXLA Operated by XL Airways Germany. September 2010. Available online: https://www.bea.aero/docspa/2008/d-la081127.en/pdf/d-la081127.en.pdf (accessed on 25 January 2019).
  19. BEA COMMISSION D’ENQUETE. Rapport Final sur l’Accident Survenu le 29 Juin 2009 En mer au large de Moroni (Comores) De l’Airbus A310-324 Immatriculé 7O-ADJ Exploité par la compagnie Yemenia Airways. Available online: https://www.bea.aero/docspa/2009/7o-j090629/pdf/7o-j090629.pdf (accessed on 25 January 2019).
  20. Skamarock, W.C.; Klemp, J.B.; Dudhia, J.; Gill, D.O.; Barker, D.; Duda, M.G.; Huang, X.-Y.; Wang, W. A Description of the Advanced Research WRF Version 3. NCAR Tech. Note NCAR/TN-475+STR 2008. [Google Scholar] [CrossRef]
  21. NCEP FNL DS083.2 Meteorological Fields, National Centers for Environmental Prediction/National Weather Service/NOAA/U.S. Department of Commerce. NCEP FNL Operational Model Global Tropospheric Analyses, Continuing from July 1999. Research Data Archive at the National Centre for Atmospheric Research, Computational and Information Systems Laboratory. 2000. Available online: https://rda.ucar.edu/datasets/ds083.2/ (accessed on 25 January 2019).
  22. Reynolds, R.W.; Chelton, D.B. Comparisons of daily sea surface temperature analyses for 2007–2008. J. Clim. 2010, 23, 3545–3562. [Google Scholar] [CrossRef]
  23. Grell, G.A.; Devenyi, D. A generalized approach to parameterizing convection combining ensemble and data assimilation techniques. Geophys. Res. Lett. 2002, 29. [Google Scholar] [CrossRef]
  24. Jiménez, P.A.; Dudhia, J.; González-Rouco, J.F.; Navarro, J.; Montávez, J.P.; García-Bustamante, E. A Revised Scheme for the WRF Surface Layer Formulation. Mon. Weather Rev. 2012, 140, 898–918. [Google Scholar] [CrossRef] [Green Version]
  25. Nakanishi, M.; Niino, H. An Improved Mellor-Yamada Level 3 Model: Its Numerical Stability and Application to a Regional Prediction of Advection Fog. Bound.-Layer Meteorol. 2006, 119, 397–407. [Google Scholar] [CrossRef]
  26. Pleim, J.E.; Xiu, A. Development and Testing of a Surface Flux and Planetary Boundary Layer Model for Application in Mesoscale Models. J. Appl. Meteorol. 1995, 34, 16–32. [Google Scholar] [CrossRef] [Green Version]
  27. Xiu, A.; Pleim, J.E. Development of a Land Surface Model. Part I: Application in a Mesoscale Meteorological Model. J. Appl. Meteorol. 2001, 40, 192–209. [Google Scholar] [CrossRef]
  28. Dudhia, J. Numerical Study of Convection Observed during the Winter Monsoon Experiment Using a Mesoscale Two-Dimensional Model. J. Atmos. Sci. 1989, 46, 3077–3107. [Google Scholar] [CrossRef] [Green Version]
  29. Mlawer, E.J.; Taubman, S.J.; Brown, P.D.; Iacono, M.J.; Clough, S.A. Radiative transfer for inhomogeneous atmospheres: RRTM, a validated correlated-k model for the longwave. J. Geophys. Res. 1997, 102, 16663–16682. [Google Scholar] [CrossRef] [Green Version]
  30. Lim, K.-S.S.; Hong, S.-Y. Development of an Effective Double-Moment Cloud Microphysics Scheme with Prognostic Cloud Condensation Nuclei (CCN) for Weather and Climate Models. Mon. Weather Rev. 2010, 138, 1587–1612. [Google Scholar] [CrossRef]
  31. Wicker, L.J.; Skamarock, W.C. Time-splitting methods for elastic models using forward time schemes. Mon. Weather Rev. 2002, 130, 2088–2097. [Google Scholar] [CrossRef]
  32. Smagorinsky, J. General circulation experiments with the primitive equations: 1. The basic experiment. Mon. Weather Rev. 1963, 91, 99–164. [Google Scholar] [CrossRef]
  33. Abbs, D.J.; Physick, W.L. Sea-breeze observations and modelling: A review. Aust. Meteorol. Mag. 1992, 41, 7–19. [Google Scholar]
  34. Miller, S.T.K.; Keim, B.D.; Talbot, R.W.; Mao, H. Sea breeze: Structure, forecasting and impacts. Rev. Geophys. 2003, 41, 1011. [Google Scholar] [CrossRef]
  35. Crosman, E.T.; Horel, J.D. Sea and Lake Breezes: A Review of Numerical Studies. Bound.-Layer Meteorol. 2010, 137, 1–29. [Google Scholar] [CrossRef] [Green Version]
  36. Dailey, P.S.; Fovell, R.G. Numerical Simulation of the Interaction between the Sea-Breeze Front and Horizontal Convective Rolls. Part I: Offshore Ambient Flow. Mon. Weather Rev. 1999, 127, 858–878. [Google Scholar] [CrossRef]
  37. Helmis, C.G.; Asimakopoulos, D.N.; Deligiorgi, D.G.; Lalas, D.P. Observations of sea-breeze fronts near the shoreline. Bound.-Layer Meteorol. 1987, 38, 395. [Google Scholar] [CrossRef]
  38. Chiba, O. The turbulent characteristics in the lowest part of the sea breeze front in the atmospheric surface layer. Bound.-Layer Meteorol. 1993, 65, 181–195. [Google Scholar] [CrossRef]
  39. Stephan, K.; Kraus, H.; Ewenz, C.M.; Hacker, J.M. Sea-breeze front variations in space and time. Meteorol. Atmos. Phys. 1999, 70, 81–95. [Google Scholar] [CrossRef]
  40. Arrillaga, J.A.; Yagüe, C.; Sastre, M.; Román-Cascón, C. A characterisation of sea-breeze events in the eastern Cantabrian coast (Spain) from observational data and WRF simulations. Atmos. Res. 2016, 181, 265–280. [Google Scholar] [CrossRef]
  41. Steele, C.J.; Dorling, S.R.; von Glasow, R.; Bacon, J. Idealized WRF model sensitivity simulations of sea breeze types and their effects on offshore windfields. Atmos. Chem. Phys. 2013, 13, 443–461. [Google Scholar] [CrossRef] [Green Version]
  42. Li, Y.K.; Chao, J.P. An Analytical Solution for Three-Dimensional Sea–Land Breeze. J. Atmos. Sci. 2016, 73, 41–53. [Google Scholar] [CrossRef]
  43. Wingrove, R.C.; Bach, R.E., Jr. Severe Turbulence and Maneuvering from Airline Flight Records. J. Aircr. 1994, 31, 753–760. [Google Scholar] [CrossRef]
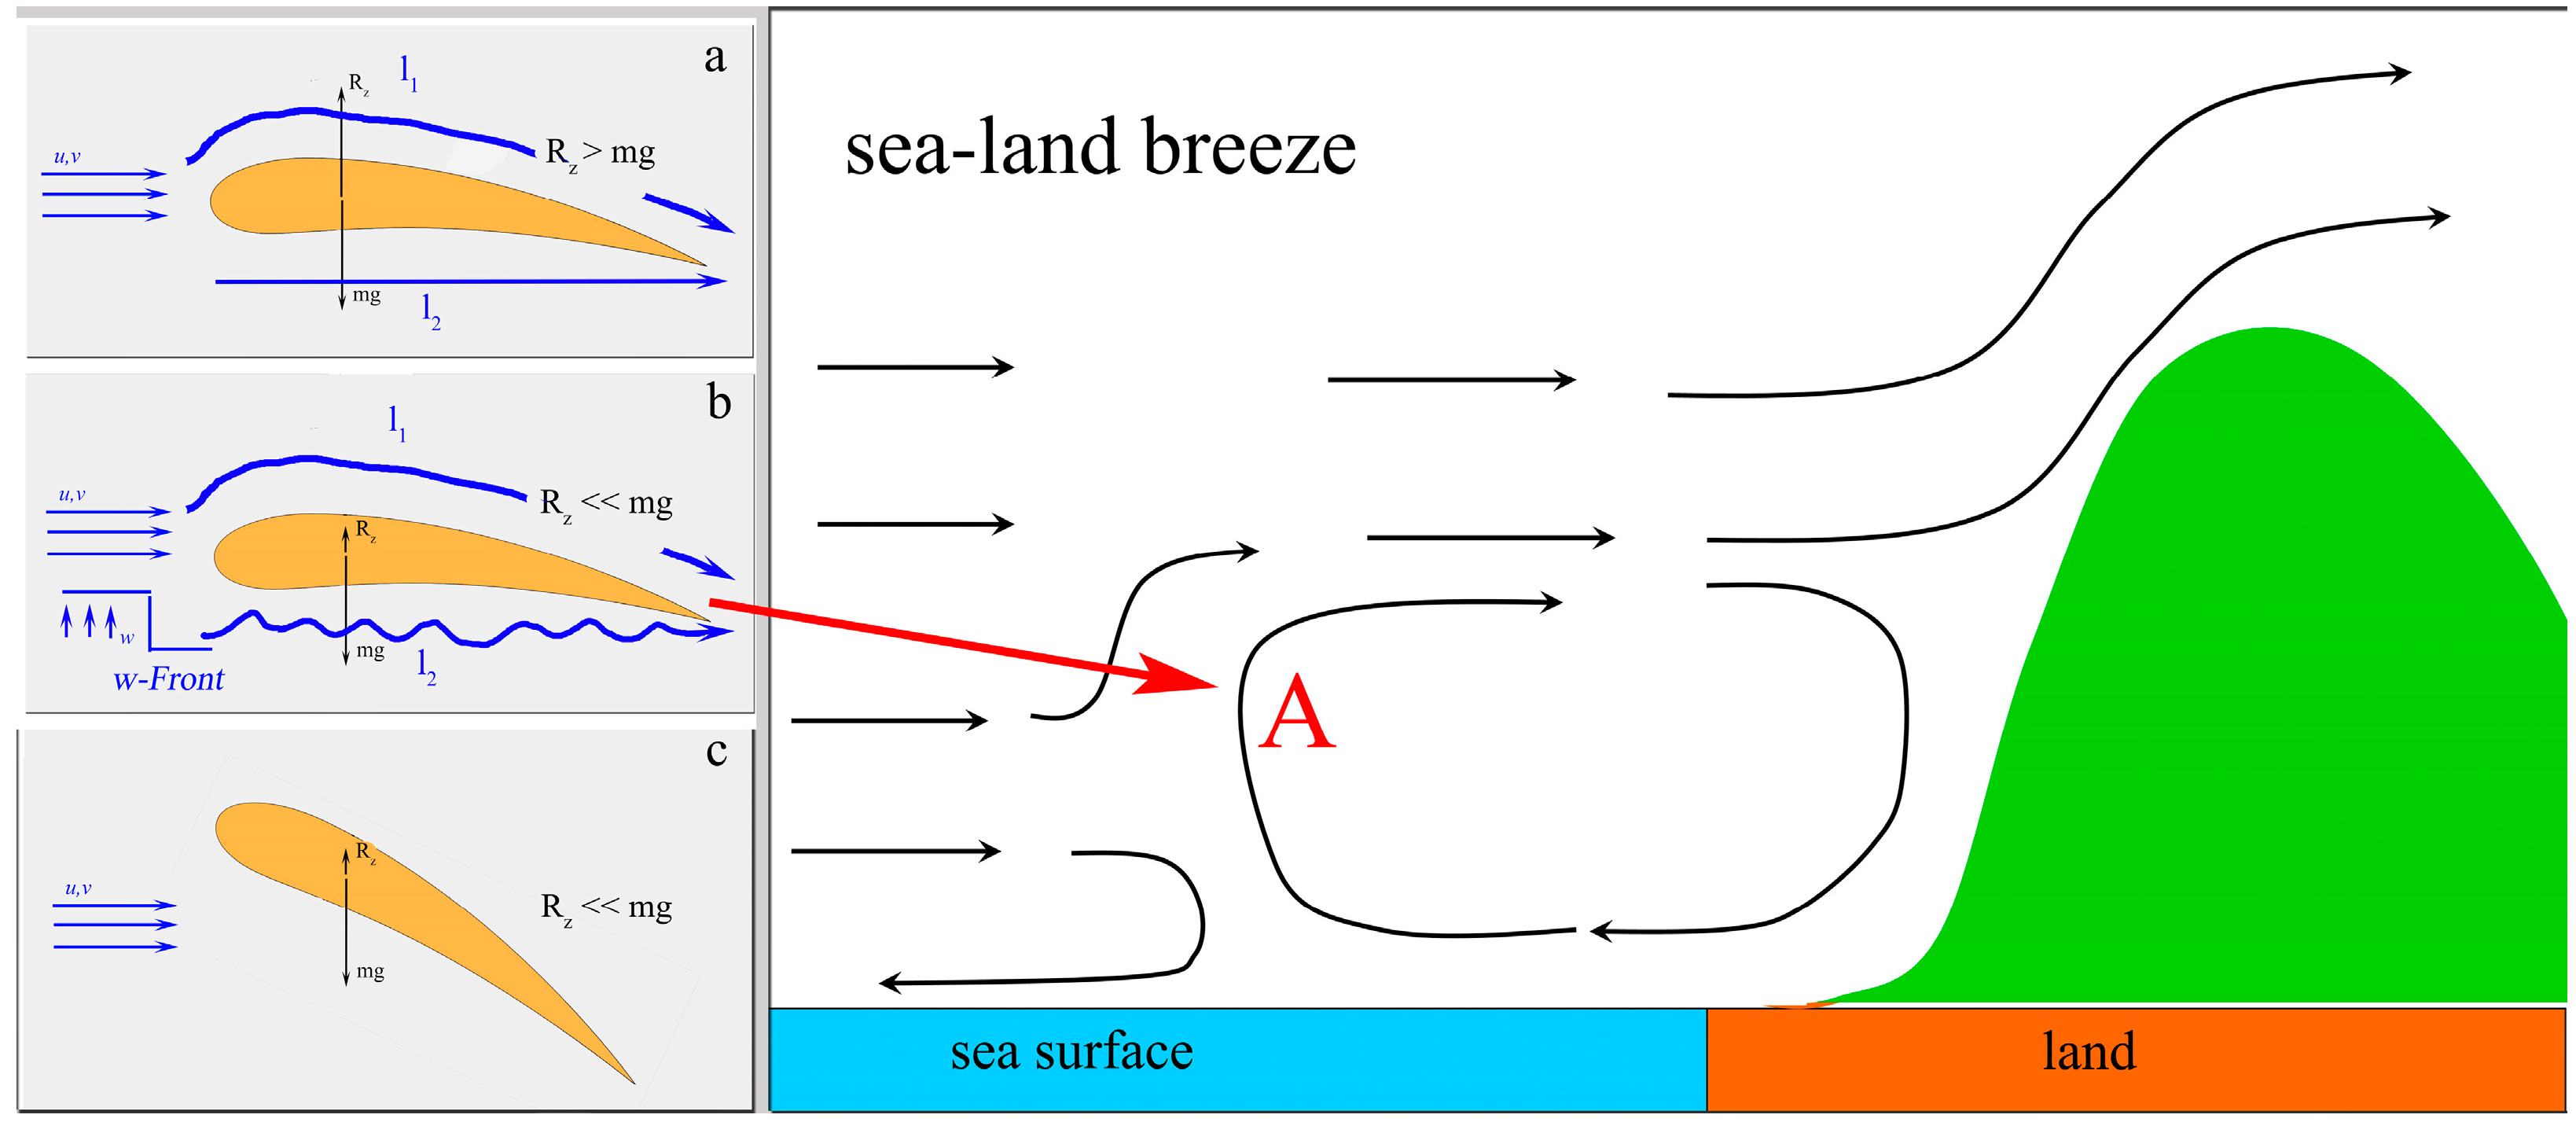
Figure 1. In the left panel: the streamlined processes (u,v) on a classical wing profile before an interaction with the w-Front (a); over the step of the w-Front (b); and after an interaction with the w-Front (c). In the right panel: sea-land circulation in the presence of mountains on the seacoast. A—atmospheric local vertical front.
Atmosphere 10 00050 g001
Figure 2. The air routes of Tu-154B-2 (red) and Airbus A320-211 (orange) in Adler/Sochi, Russia (a) and of Airbus A320-232 (white) in Perpignan, France (b). The glide paths from the aircraft’s position over the sea are marked by the dashed white lines. The air route of Il-18V (green) crashed near Adler/Sochi, Russia (a) on 01.10.1972 at 16:25 UTC, is shown in addition.
Atmosphere 10 00050 g002
Figure 3. The z-wind speed at a 950 hPa altitude for model resolutions of 6 km (a,c) and 2 km (b,d) for the A320 (a,b) and Tu-154 (c,d) crash sites. The white area corresponds to the underground model level.
Atmosphere 10 00050 g003
Figure 4. The Tu-154 crash site, Russia, 2016. The z-wind speed for three types of local mixing conditions near the surface: in the absence of local mixing (a); the five-layer model of thermal diffusion (b); thermal diffusion with additional SST assimilation (c).
Atmosphere 10 00050 g004
Figure 5. The Tu-154 crash site, Russia, 2016. The z-wind speed 1 h before the crash (2 UTC); at the moment of the crash (3 UTC); 1 h after the crash (4 UTC). Two glissades are specified by blue lines. Additionally, the horizontal (u, v) wind streamlines are shown.
Atmosphere 10 00050 g005
Figure 6. The vertical cross-sections of the z-wind component in the 0–4 km layer for crash sites: (a) A320-211, Russia, 2006; (b) A320-232, France, 2008; (c) Tu-154, Russia, 2016. The aircraft crash sites are indicated by markers. Additionally, the (u, w) wind streamlines and the sea–land directions are specified.
Atmosphere 10 00050 g006
Figure 7. The A320-232 crash site, France, 2008. The z-wind speed for three types of local mixing conditions near the surface: in the absence of local mixing (a); the five-layer model of thermal diffusion (b); thermal diffusion with additional SST assimilation (c). The white area corresponds to the underground model level.
Atmosphere 10 00050 g007
Figure 8. The (ac) are same as in Figure 7 but the simulations were done with a 6 km model resolution.
Atmosphere 10 00050 g008
Figure 9. The Airbus A310-324 crash site, Comoros Islands, 2009. The SRTM3 with a 3 s resolution topography is drawn as a background. The white arrows show the direction of a powerful wind flow. The black line corresponds to the runway; the aircraft route is indicated by a purple line.
Atmosphere 10 00050 g009
Figure 10. The Airbus A310-324 crash site, Comoros Islands, 2009. The z-wind component (a), the magnitude of horizontal wind speed (b) and the (QKE) doubled kinetic energy of turbulence (c). The aircraft route is indicated by a purple line.
Atmosphere 10 00050 g010
Figure 11. The Airbus A310-324 crash site, Comoros Islands, 2009. The vertical cross-section in the 0–4 km layer of the z-wind speed (a), the magnitude of horizontal wind speed (b) and QKE (c). The A310-324 crash site is indicated by a marker.
Atmosphere 10 00050 g011
Figure 12. The scheme is using in this study to analyse the aircraft accidents.
Atmosphere 10 00050 g012
Table 1. The locations of crashed aircraft considered in this study.
AircraftReg. NumberCrash SiteDate, UTCTime, UTCLatitude, °Longitude, °References
1Airbus A320-211ЕК-32009Adler/Sochi, Russia02.05.200622:1343.38339.8615[15,16]
2Airbus A320-232888T-XLPerpignan, France27.11.200815:4642.6633.100[17,18]
3Airbus A310-3247O-ADJComoros Islands29.06.200922:53−11.31643.3269[19]
4Tu-154 B-2RA-85572Adler/Sochi, Russia25.12.201602:2743.42539.837[15]
Table 2. The parameterizations of the WRF-ARW meteorological model.
Model ParameterScheme, (Main Features)Author Names and Reference
Cumulus parameterizationGrell 3D scheme, improved version of Grell-Devenyi schemeGrell and Devenyi, [23]
Surface layerRevised MM5 Monin-Obukhov scheme. The thermal and moisture roughness lengths over ocean are gave by COARE-3 formula (Fairall et al. 2003)Jimenez et al. [24]
Boundary layer schemeMellor-Yamada Nakanishi and Niino Level 2.5 PBL scheme, which predicts sub-grid TKE terms. Other MYNN options such as icloud_bl, bl_mynn_cloudmix, bl_mynn_mixlength and bl_mynn_cloudpdf are by default.Nakanishi and Niino, [25]
Land-surface model(a)no surface temp and moisture prediction
(b)5-layers thermal diffusion scheme. Only soil temperature involved in this scheme.
(c)2-layers Pleim-Xiu schemePleim and Xiu, [26,27]
Shortwave radiationSimple downward integration allowing efficiently for clouds and clear-sky absorption and scatteringDudhia, [28]
Longwave radiationRRTM (Long-wave correlated-k 16 bands with cloud optical depth)Mlawer et al. [29]
MicrophysicsWRF Double-Moment 6-class schemeLim and Hong, [30]
Advection schemeRK3 schemeWicker and Skamarock, [20,31]
Subgrid horizontal mixinghorizontal deformationSmagorinsky, [32]
Table 3. The atmospheric forcing to aviation crashes.
AircraftReg. NumberAtmospheric Forcing
Sea-Land Front 1 Turbulent Effect 2 Topography Effect
Airbus A320-211ЕК-32009yes
Airbus A320-232888T-XLyes possible
Airbus A310-3247O-ADJpossibleyesyes
Tu-154 B-2RA-85572yes
1w > 0.5 m s−1; 2 QKE > 5 m2 s−2.