Article

The Relationship between the Wintertime Cold Extremes over East Asia with Large-Scale Atmospheric and Oceanic Teleconnections

1
Key Laboratory of Coastal Environmental Processes and Ecological Remediation, Yantai Institute of Coastal Zone Research, Chinese Academy of Sciences, Yantai 264003, China
2
University of Chinese Academy of Sciences, Beijing 100049, China
3
Center for Ocean Mega-Science, Chinese Academy of Sciences, Qingdao 266071, China
*
Author to whom correspondence should be addressed.
Atmosphere 2019, 10(12), 813; https://doi.org/10.3390/atmos10120813
Submission received: 28 November 2019 / Revised: 9 December 2019 / Accepted: 11 December 2019 / Published: 14 December 2019
(This article belongs to the Section Meteorology)

Abstract

:
The influence of large-scale teleconnection patterns, Western Pacific (WP), Arctic Oscillation (AO) and El Niño-Southern Oscillation (ENSO), on the minimum surface air temperature (Tmin) anomalies and extremes over East Asia during the boreal winter from 1979 to 2017 were investigated by the composite analysis in terms of atmospheric and oceanic processes. The relationship between the Tmin and the geopotential height at 500 hPa (Z500) as well as sea surface temperature (SST) were first examined. Then we explored and estimated the contribution of the teleconnection patterns to the occurrence of extremely cold days and months quantitatively, and discussed other key factors in relation to the cold extremes. The WP and AO patterns play an important part in the prevalence of significant Tmin variability, whereas the effect of ENSO is relatively weak. Most of the cold extremes tend to appear in the negative phase of teleconnections, while there some extremes that occur in the opposite phase. In addition, the extreme months are more related to the preferred phase of the dominant pattern when compared to days. We conclude that the daily extremes are primarily triggered by the local-synoptic atmospheric circulations embedded in the large-scale teleconnection patterns, while the monthly extremes have a closer relationship with these low-frequency patterns.
Dataset: There are no linked research data sets for this submission. The following reason is given: Data will be made available on request.

1. Introduction

The teleconnections are usually defined as the simultaneous correlations between the planetary-scale circulation anomalies [1,2]. These patterns could exercise an extensive influence on global weather and climate. Hence, there were a large number of studies aimed to explore the formation mechanisms and spatio-temporal variability of teleconnections for the past 30 years [3,4,5]. The Western Pacific pattern (WP) is one of the main teleconnections over the North Pacific. During the winter, when WP is in the positive (negative) phase, the pattern is characterized by the dipole-like atmospheric circulation anomalies with a negative (positive) active center located on the Okhotsk Sea and another positive (negative) one situated around the subtropical western North Pacific [6]. In consequence, the temperature anomalies above (below) normal conditions are observed over almost all regions of East Asia [7]. The Arctic Oscillation (AO) is associated with the sea level pressure (SLP) field and has two oscillation centers at the Arctic and the mid-latitudes, respectively [8,9]. This pattern has a dramatic effect on the Siberian High (SH) and East Asian winter monsoon (EAWM) thereby controlling the climate variability over the middle–high latitude regions within East Asia. The El Niño-Southern Oscillation (ENSO) is known as the most influential oscillation for the global climate fluctuation, which is identified with abnormal warm or cold SST in the central or eastern Pacific. Zhang et al. [10] proposed that the ENSO could affect the strength of EAWM via low-level atmospheric circulation around the maritime continent. Wang et al. [11] stressed that the ENSO combined with Pacific Decadal Oscillation (PDO) has a substantial impact on dry–wet variations over various regions. However, since the eastern Pacific ENSO (EP) transformed into the central Pacific ENSO (CP) after the mid-1970s [12], the effect of ENSO on the climate variations over East Asia has pronouncedly decreased in the past several decades [2].
In recent years, a large body of studies has revealed the close relationship between the sea surface temperature (SST) and some teleconnections, which triggers climate variations on the regional scale Liu et al. [13] showed that the spatial structures and temporal variability of three Eurasian teleconnections. They found that the conventional Eurasian pattern (EU) is primarily induced by the SST anomalies over North Atlantic whereas the Scandinavian pattern (SCAND) is highly related to the SST anomalies around the tropical and southern Indian Ocean SST anomalies. When the conventional EU pattern is in the positive phase, the cold weather would prevail on the Yangtze River basin, Inner Mongolia and Northeast China. In comparison, the positive phase of the SCAND pattern is mainly associated with the cold anomalies over northern Eurasia and East Asia. Sun et al. [14] considered that the SST anomalies over the tropical Pacific and Indian Oceans are responsible for the interdecadal fluctuation of the Pacific–Japan teleconnection pattern (PJ) in the previous winter and spring. The fluctuation further enhances the interdecadal variations of summer precipitation in the Yangtze–Huaihe River valley of China. In addition, Sun et al. [15] stated that a seesaw pattern responds to the SST anomalies in extratropical North Pacific and the pattern drives the precipitation to increase or decrease over East Asia and the western North Pacific. Above all, it is important to figure out the SST variability and its association with teleconnections and climate changes.
The frequencies and intensities of extreme events have been increasing dramatically in East Asia over the past several decades. The extreme climate events, such as snow disasters, heat waves, flood and drought pose a severe threat to people’s lives and property. Scientists from various fields have paid their attention to the possible mechanisms of climate extremes over East Asia. Historically, numerous studies have exhibited that climate variations are associated with large-scale circulations [2,9,16,17]. In particular, the WP, AO and ENSO have an enormous effect on the strength and intensity of EAWM and then modulate the climate fluctuations over East Asia. Despite the fact that there are many papers that used the three patterns to explain the abnormal climate variations, few studies have focused on the relative importance among these patterns for the extreme temperature events within East Asia. Hence, the main aim of this study is to present a comprehensive understanding of the relationship between the cold extremes and the WP, AO and ENSO patterns.
The paper is organized as follows: the data and methodology are described in Section 2; the influence of teleconnections on the extreme cold events over East Asia is shown in Section 3; the summary and discussions are presented in Section 4.

2. Data and Methodology

2.1. Data

The study area is 15° N–55° N and 100° E–150° E, while the period is the boreal winter from 1979 to 2017. The minimum surface air temperature (Tmin) used in this paper is accessed from the National Oceanic and Atmospheric Administration Climate Prediction Center in the U.S (available at https://www.esrl.noaa.gov/psd/data/gridded/data.cpc.globaltemp.html and https://www.esrl.noaa.gov/psd/data/gridded/data.cpc.globalprecip.html). The Tmin anomalies are employed in this paper to eliminate the impact of the temporal biases under the variations of the climatology system. The anomalies were calculated by subtracting the daily mean climatology from the actual temperature for each grid first. Then, the values are normalized into [−1, 1] [18].
The analyzed variables used in this paper are derived from the ECMWF interim reanalysis dataset (0°–60° N, 60°–180° E). The daily geopotential height at a 500 hPa level (Z500), horizontal wind fields, and the sea surface temperature (SST) are chosen to present the atmospheric circulations and oceanic states [19]. The same procedure as Tmin, the deseasonalization and normalization are applied to Z500 and wind fields. It should be noted that the SST anomalies are only generated by deseasonalization but not normalization. Because the SST values for several grids are far greater than others, normalization would make most of SST anomalies close to 0.
The monthly WP and AO teleconnection indices are provided by the National Oceanic and Atmospheric Administration Climate Prediction Center (ftp://ftp.cpc.ncep.noaa.gov/wd52dg/data/indices/tele_index.nh,nd). The WP index is constructed by the rotated principal component analysis (RPCA) referenced to Barnston and Livezey [1]. The indices are normalized utilizing the monthly means and standard deviations from 1981 to 2010. The AO index is obtained by projecting the AO loading pattern to the daily anomaly 1000 millibar height field over 20° N–90° N latitude. The definition of Niño-3.4 indices is the standard deviation of the monthly SST using a 5 month running mean within the Niño-3.4 region. It is provided by the National Center for Atmospheric Research’s Climate and Global Dynamics Division (http://www.cgd.ucar.edu/cas/catalog/climind/Nino_3_3.4_indices.html).

2.2. Methodology

The main technique used in our study was the composite analysis based on the geopotential height and wind anomalies at a 500 hPa level, SST anomalies as well as Tmin anomalies. The positive (negative) indices days and months were defined as when the index values are above the 75th (below the 25th) indices. The variables corresponding to the phase of each low-frequency large-scale circulation patterns were extracted and computed the mean values on the gird.
For each grid, the cold extremes were defined as the lowest 10% values in the daily (monthly) Tmin anomalies distribution [18,20]. Then, daily (monthly) Tmin on the 352 days (12 months) among 3520 days (117 months) were identified as cold extremes. The percentage of cold extremes associated with a particular phase of the teleconnection pattern was also calculated. The Monte Carlo approach was used to test the statistical significance of the percentage. The assumed threshold was 25%. For each grid, the procedure was executed as following: the original time series of Tmin extremes and the three phases (positive, negative and normal phases) of a particular circulation pattern were paired randomly and then computed the percentage and judged the correlation again as mentioned above. After the program loops 1000 (10,000) times for daily (monthly) Tmin anomalies, a frequency distribution was generated and the original percentage was marked as significant if the value exceeds the 95% confidence levels.

3. Results

3.1. The Mean Winter Climatology within East Asia during the Positive or Negative Phase of Low-Frequency Large-Scale Circulations

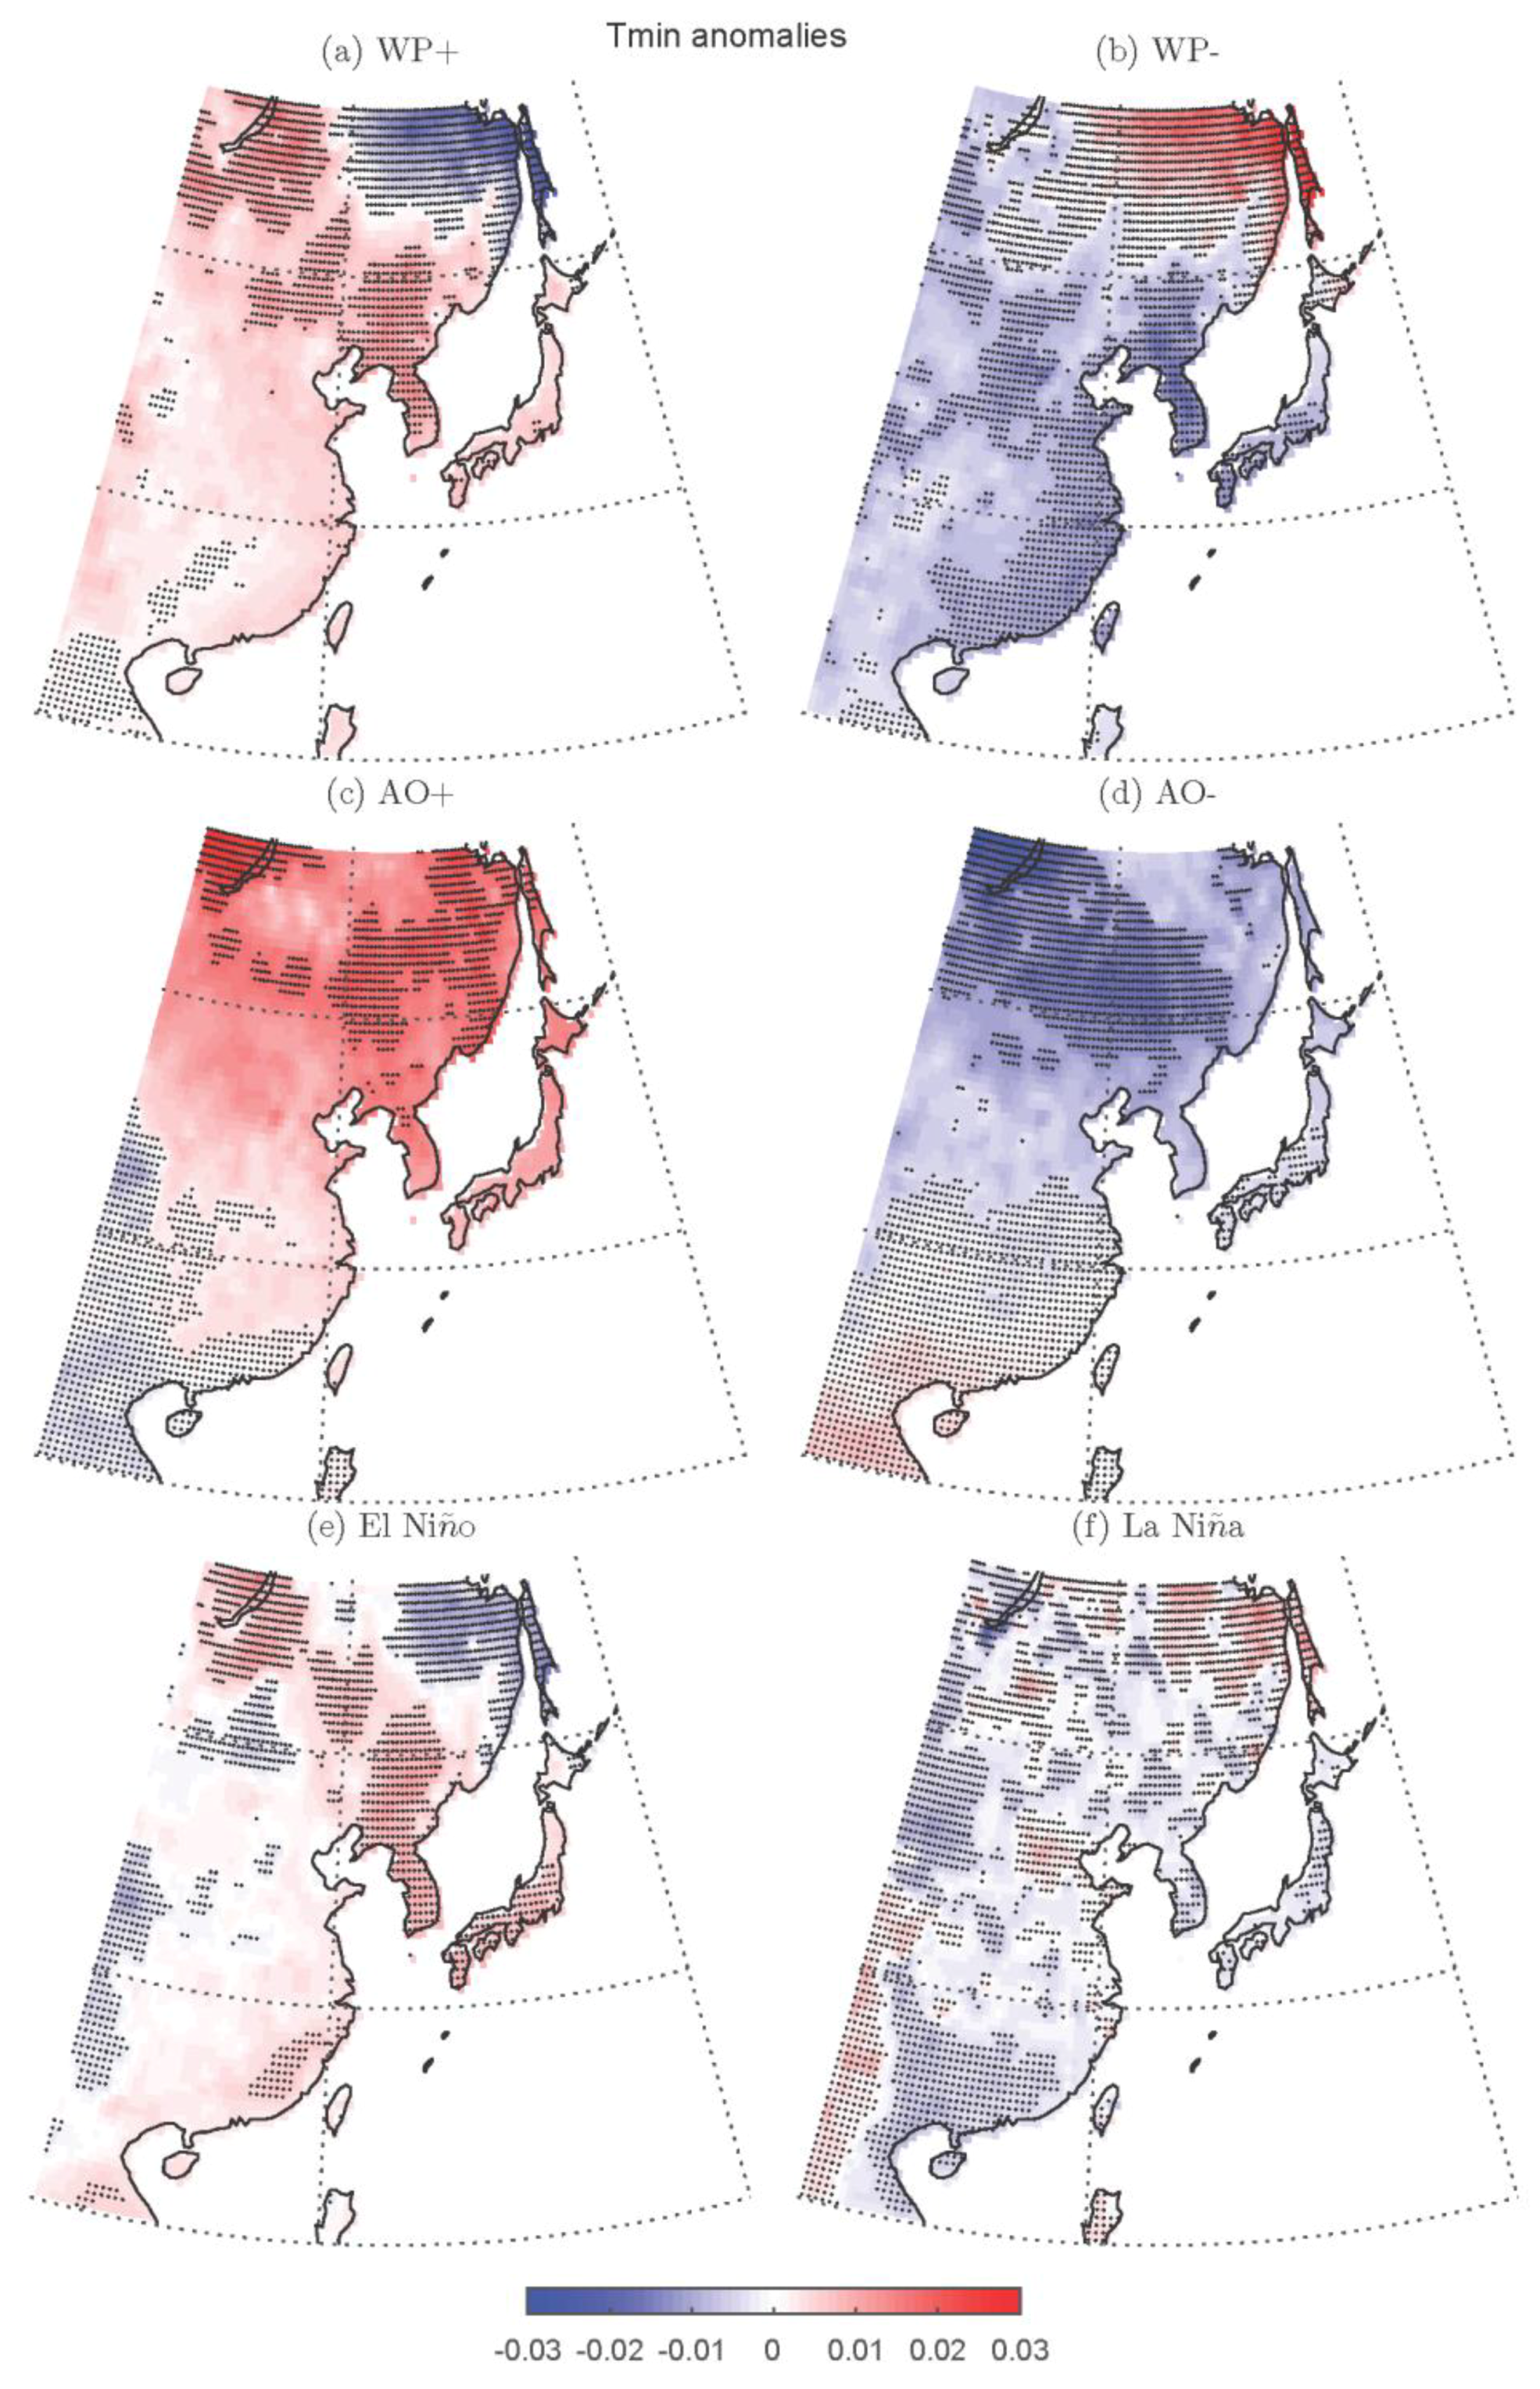
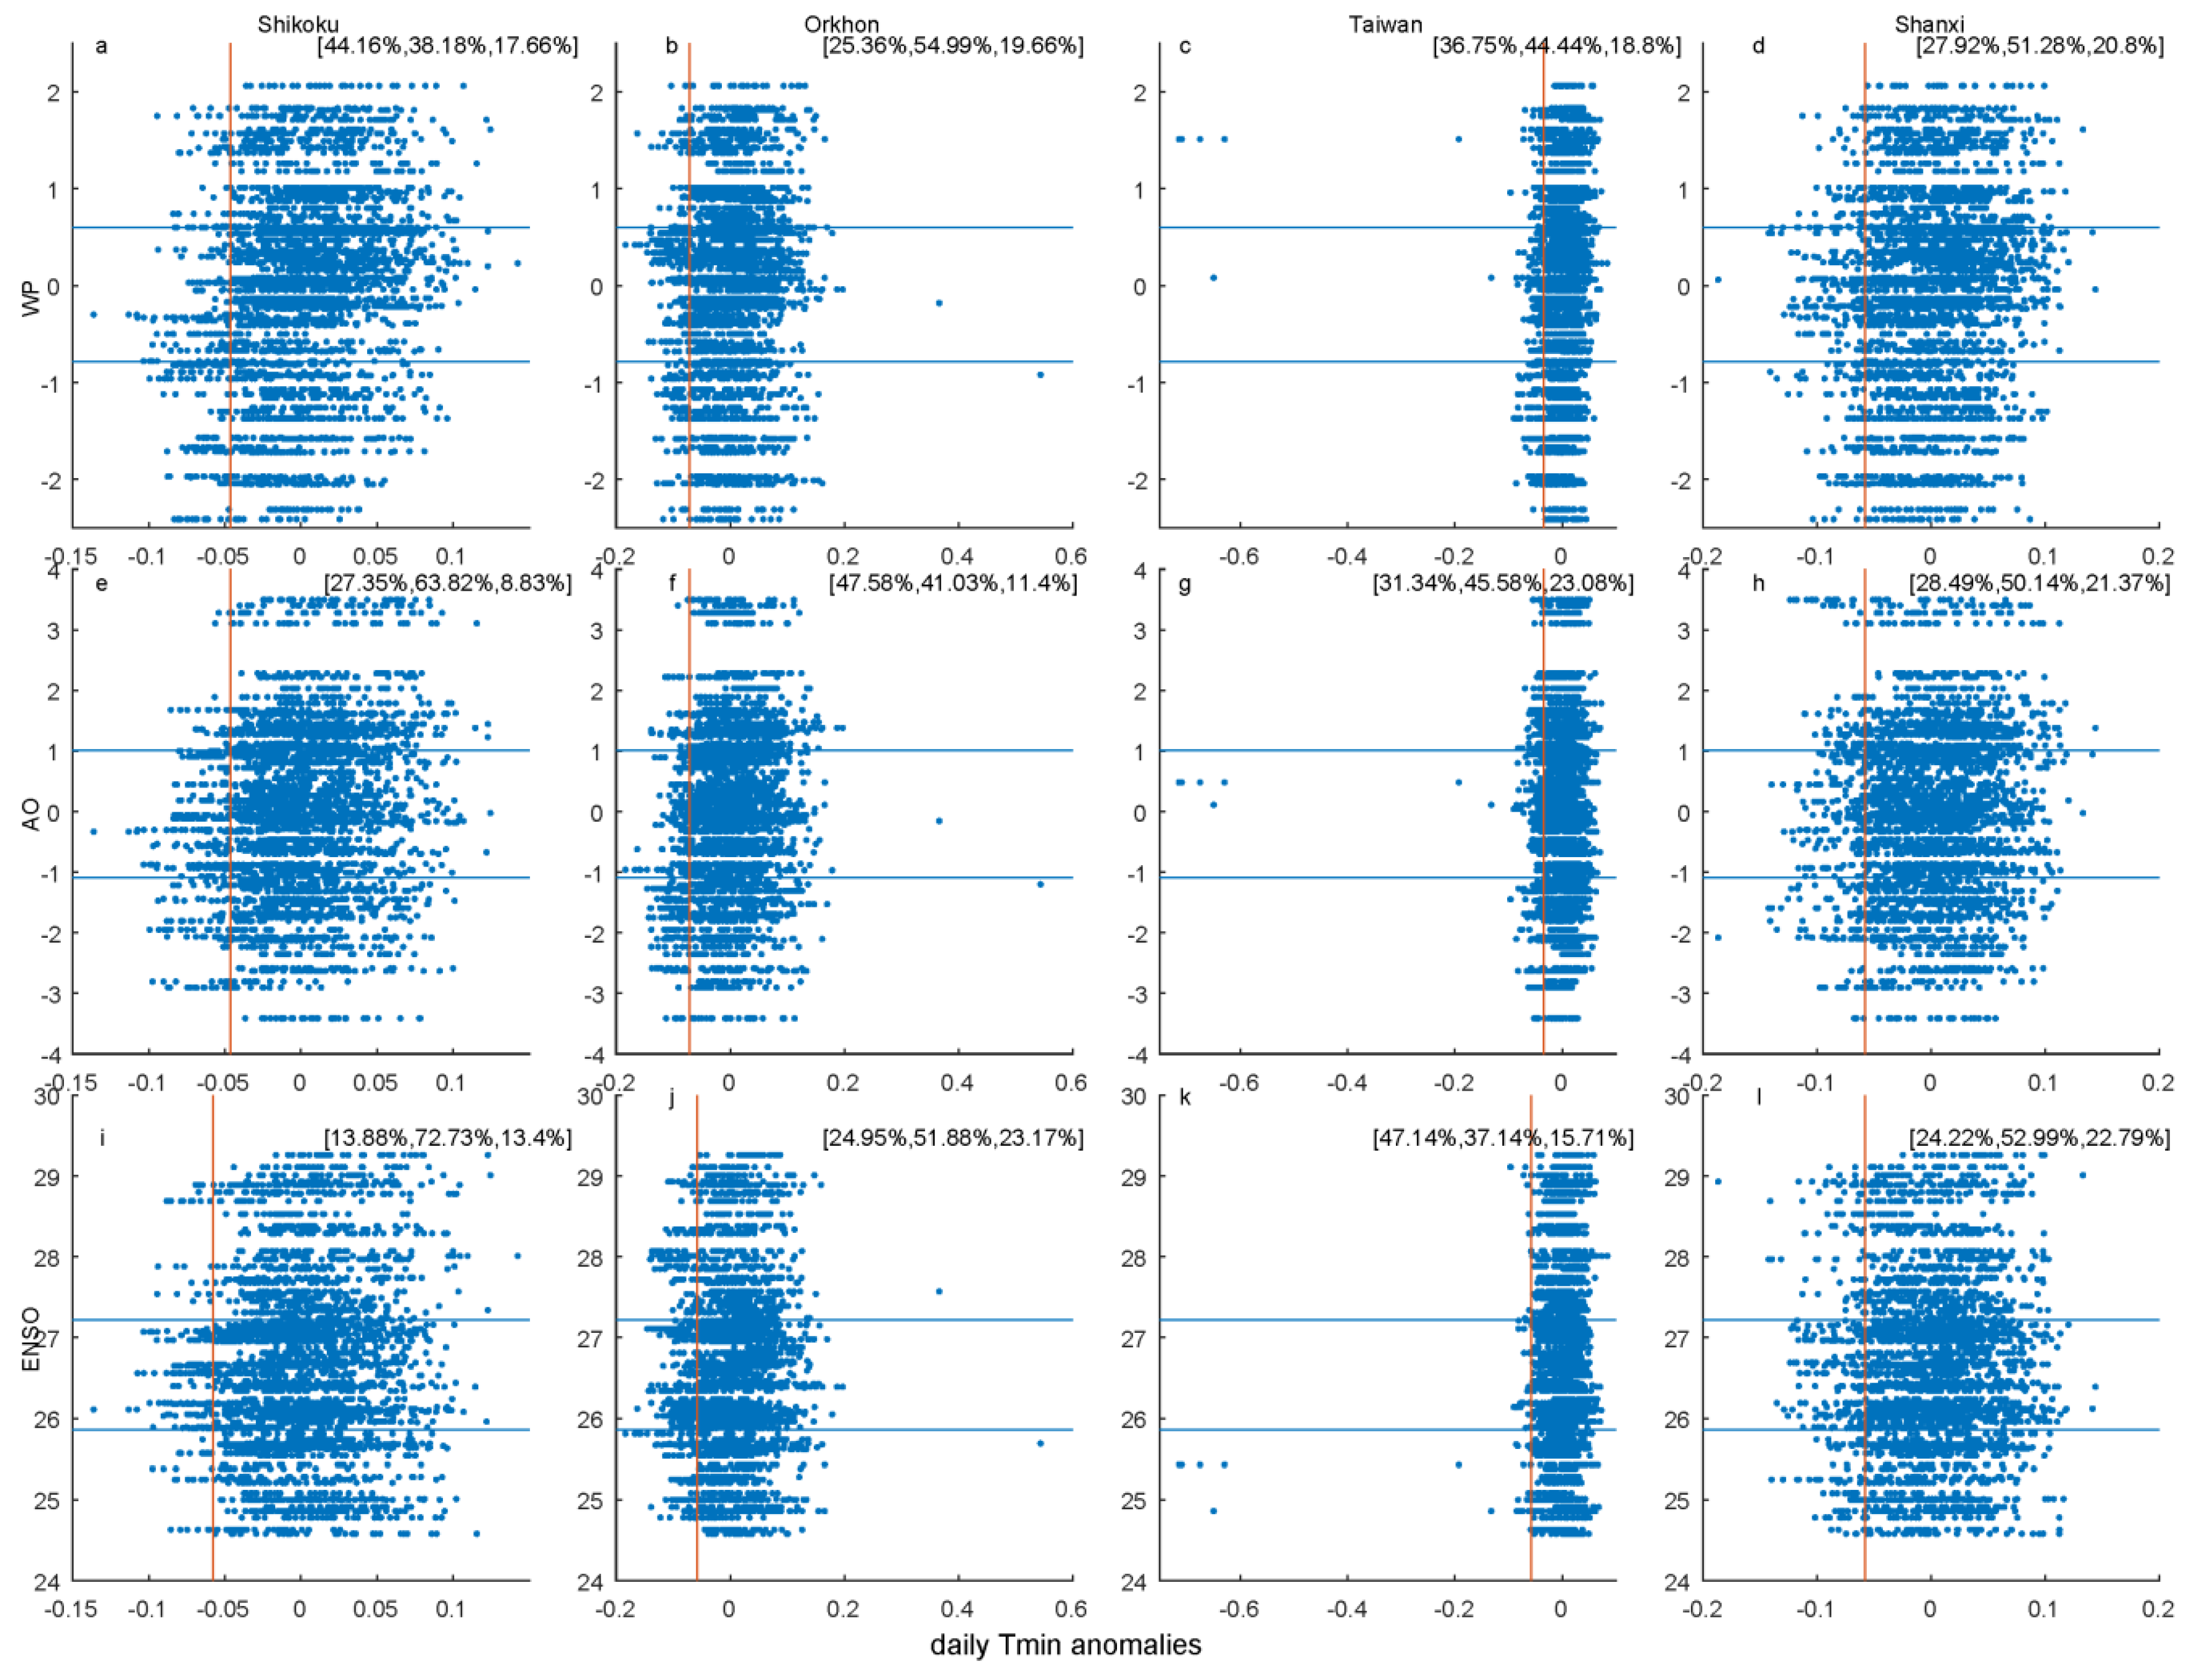
3.1.1. The Tmin Anomalies

Figure 1 exhibits the composites on the spatial distribution of Tmin anomalies during the positive or negative months of WP, AO and ENSO patterns. When WP pattern is in positive (negative) phase it is notable that positive (negative) Tmin anomalies appear over almost the whole of East Asia except southeastern Russia. The similar states occur in the positive (negative) phase of the AO pattern as well. In particular, the Tmin anomalies become warmer (colder) with increasing latitude in the AO+ (AO-) events. The regional difference in Tmin anomalies for the positive and negative phases of ENSO is relatively apparent than WP and AO pattern. During the El Niño phase, the positive Tmin anomalies occur in the vicinity of East Mongolia, the coast of East China, the Korean Peninsula and Japan. By contrast, during the phase of La Niña, the negative Tmin anomalies prevail over most of the regions in East Asia.

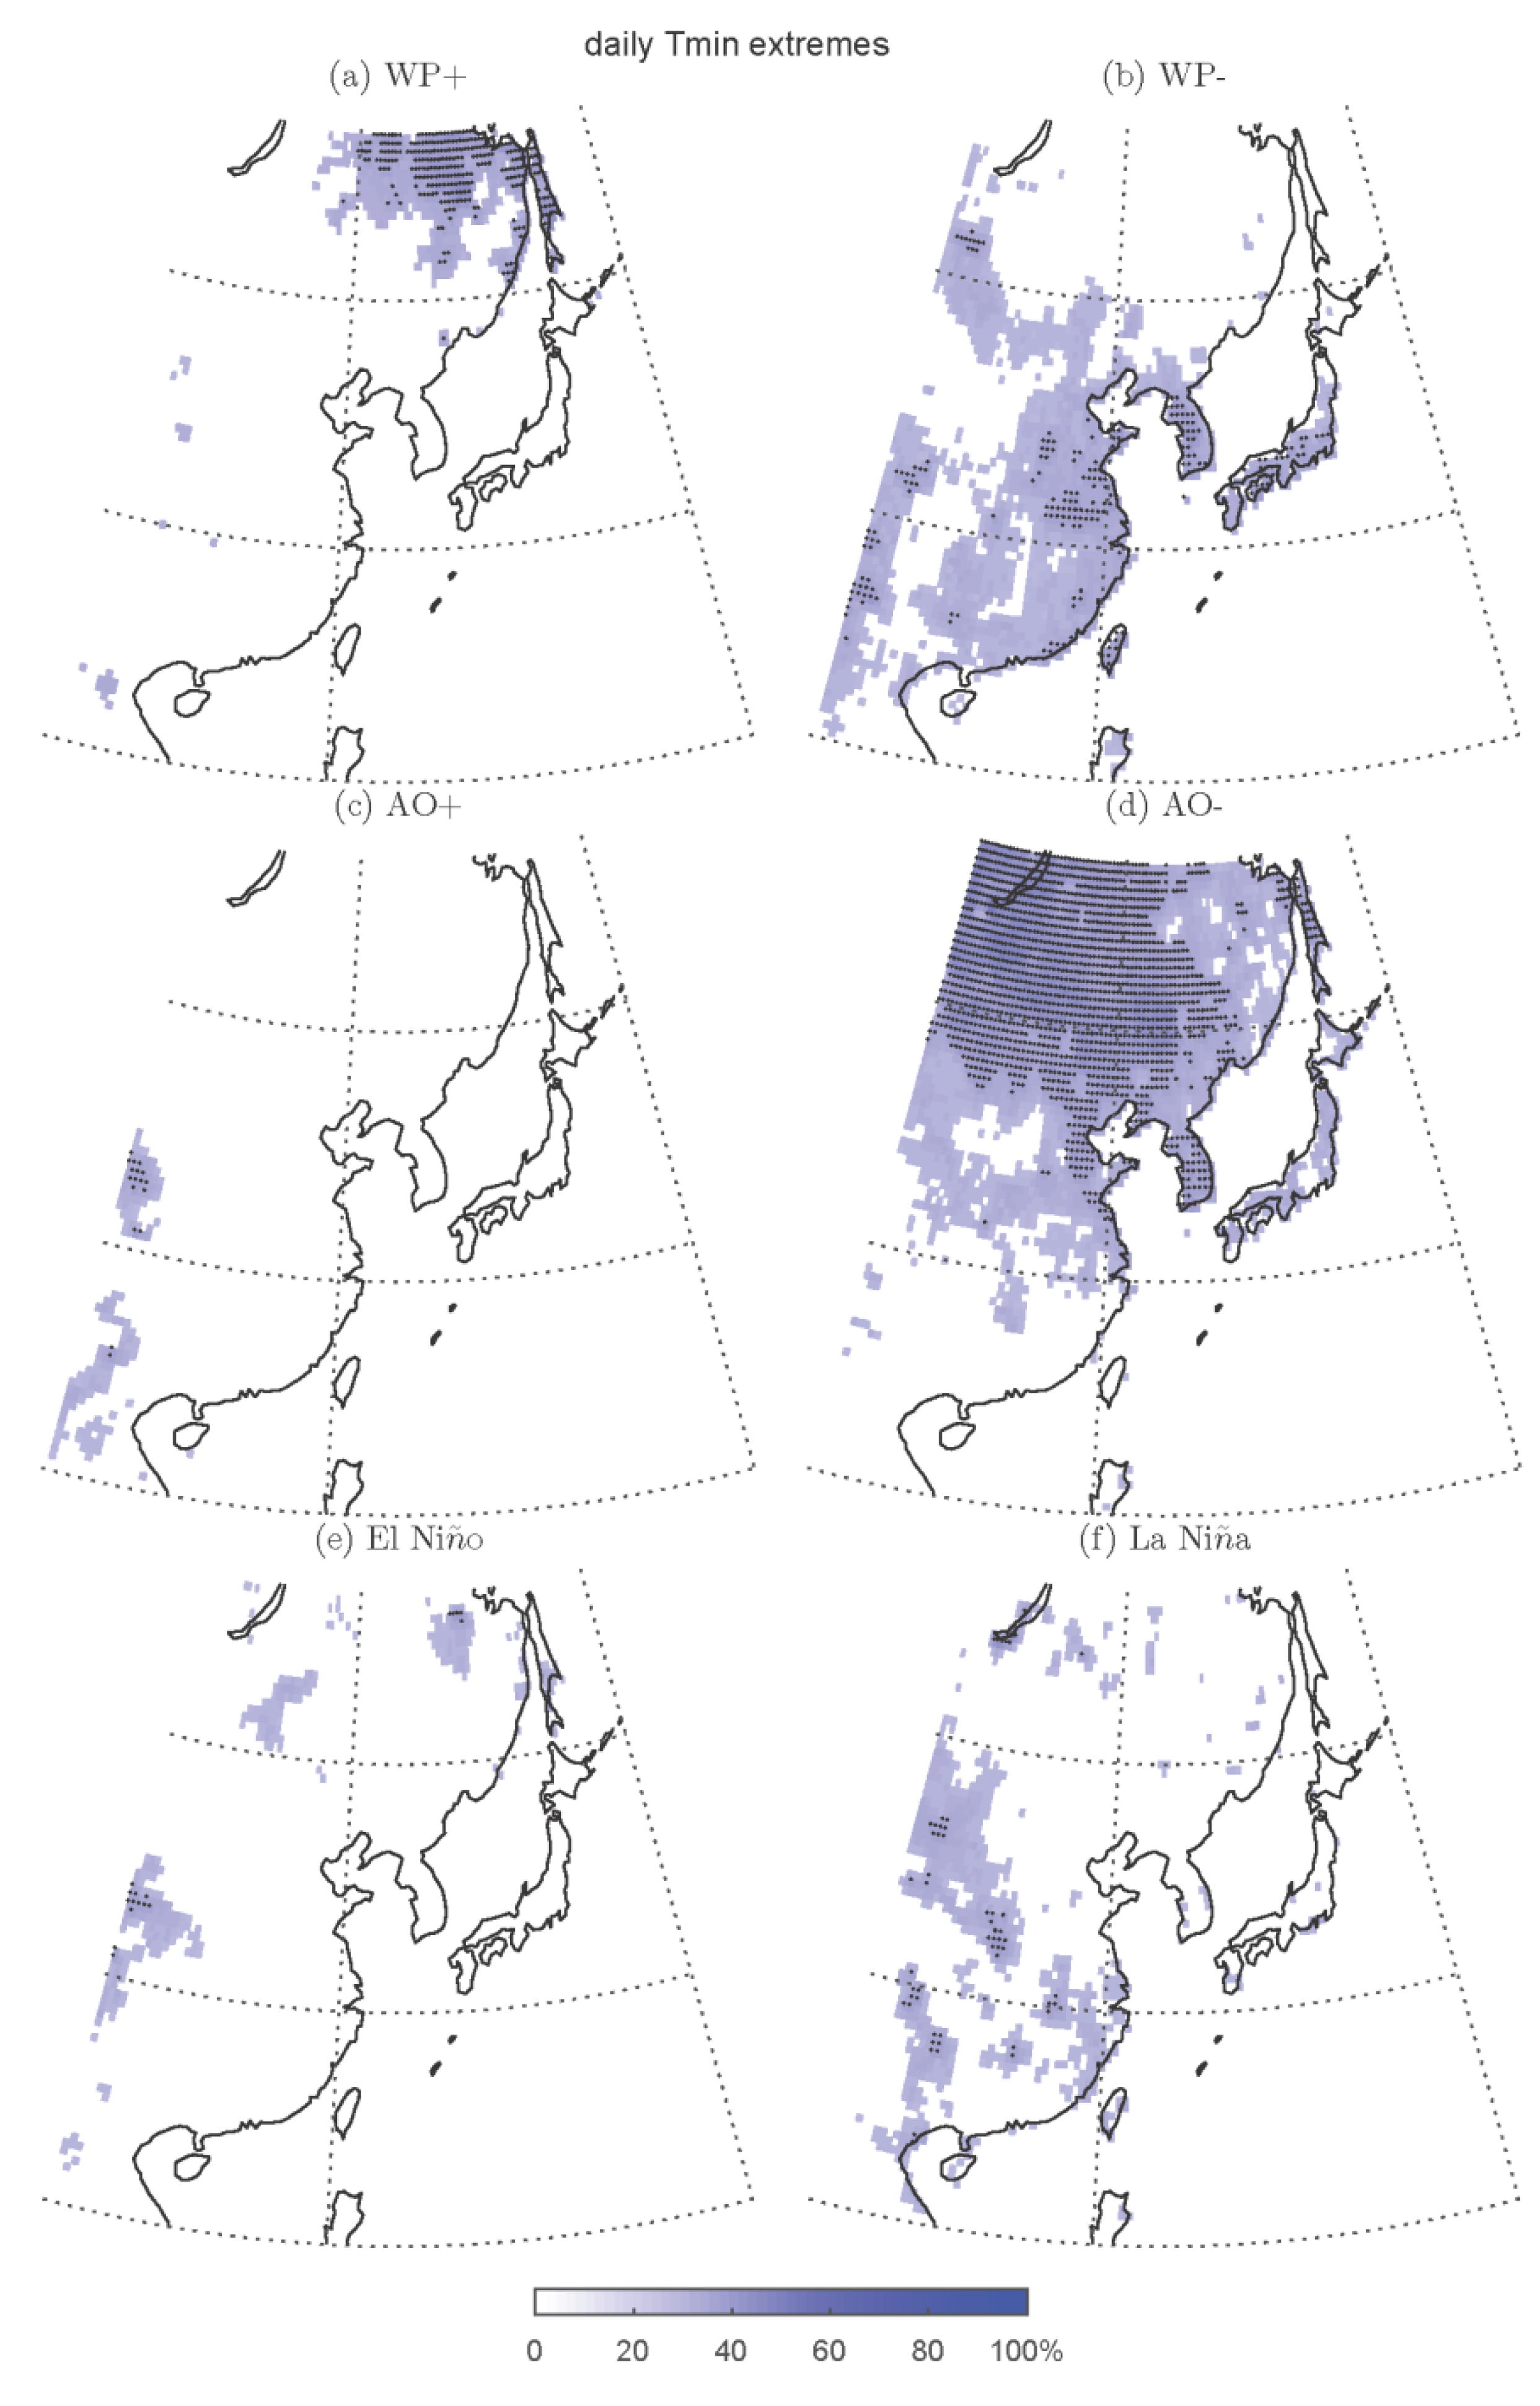
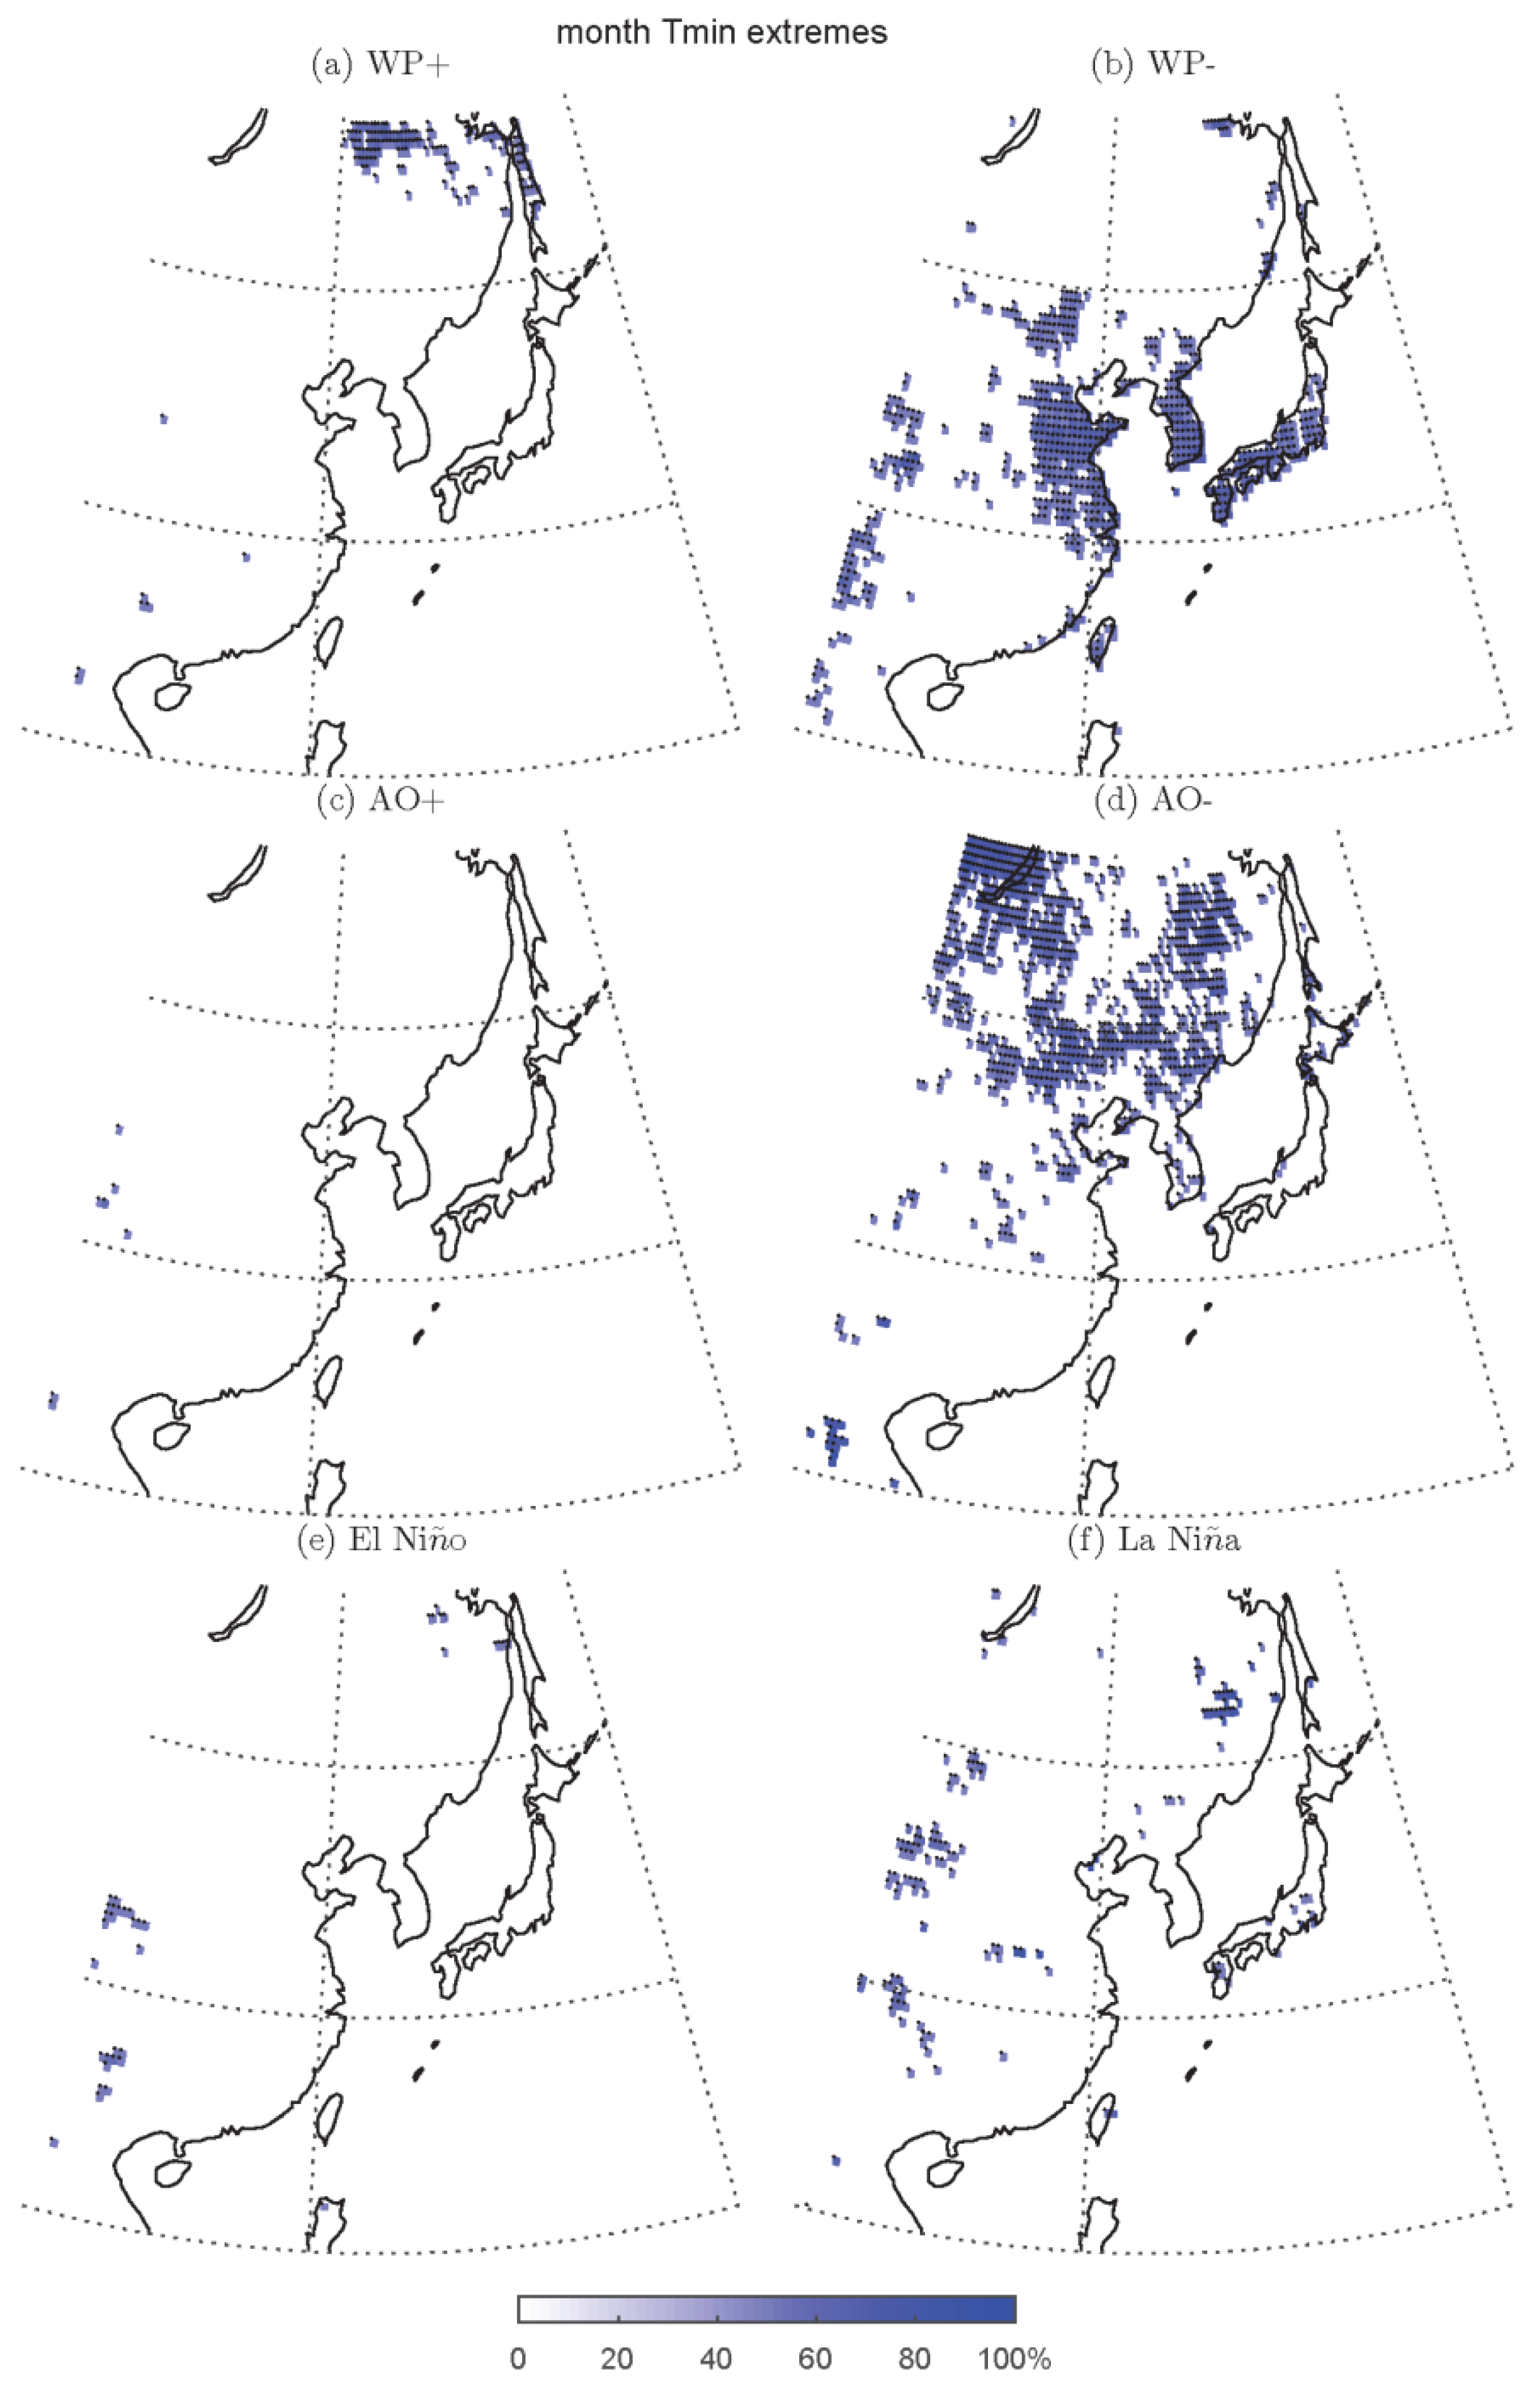
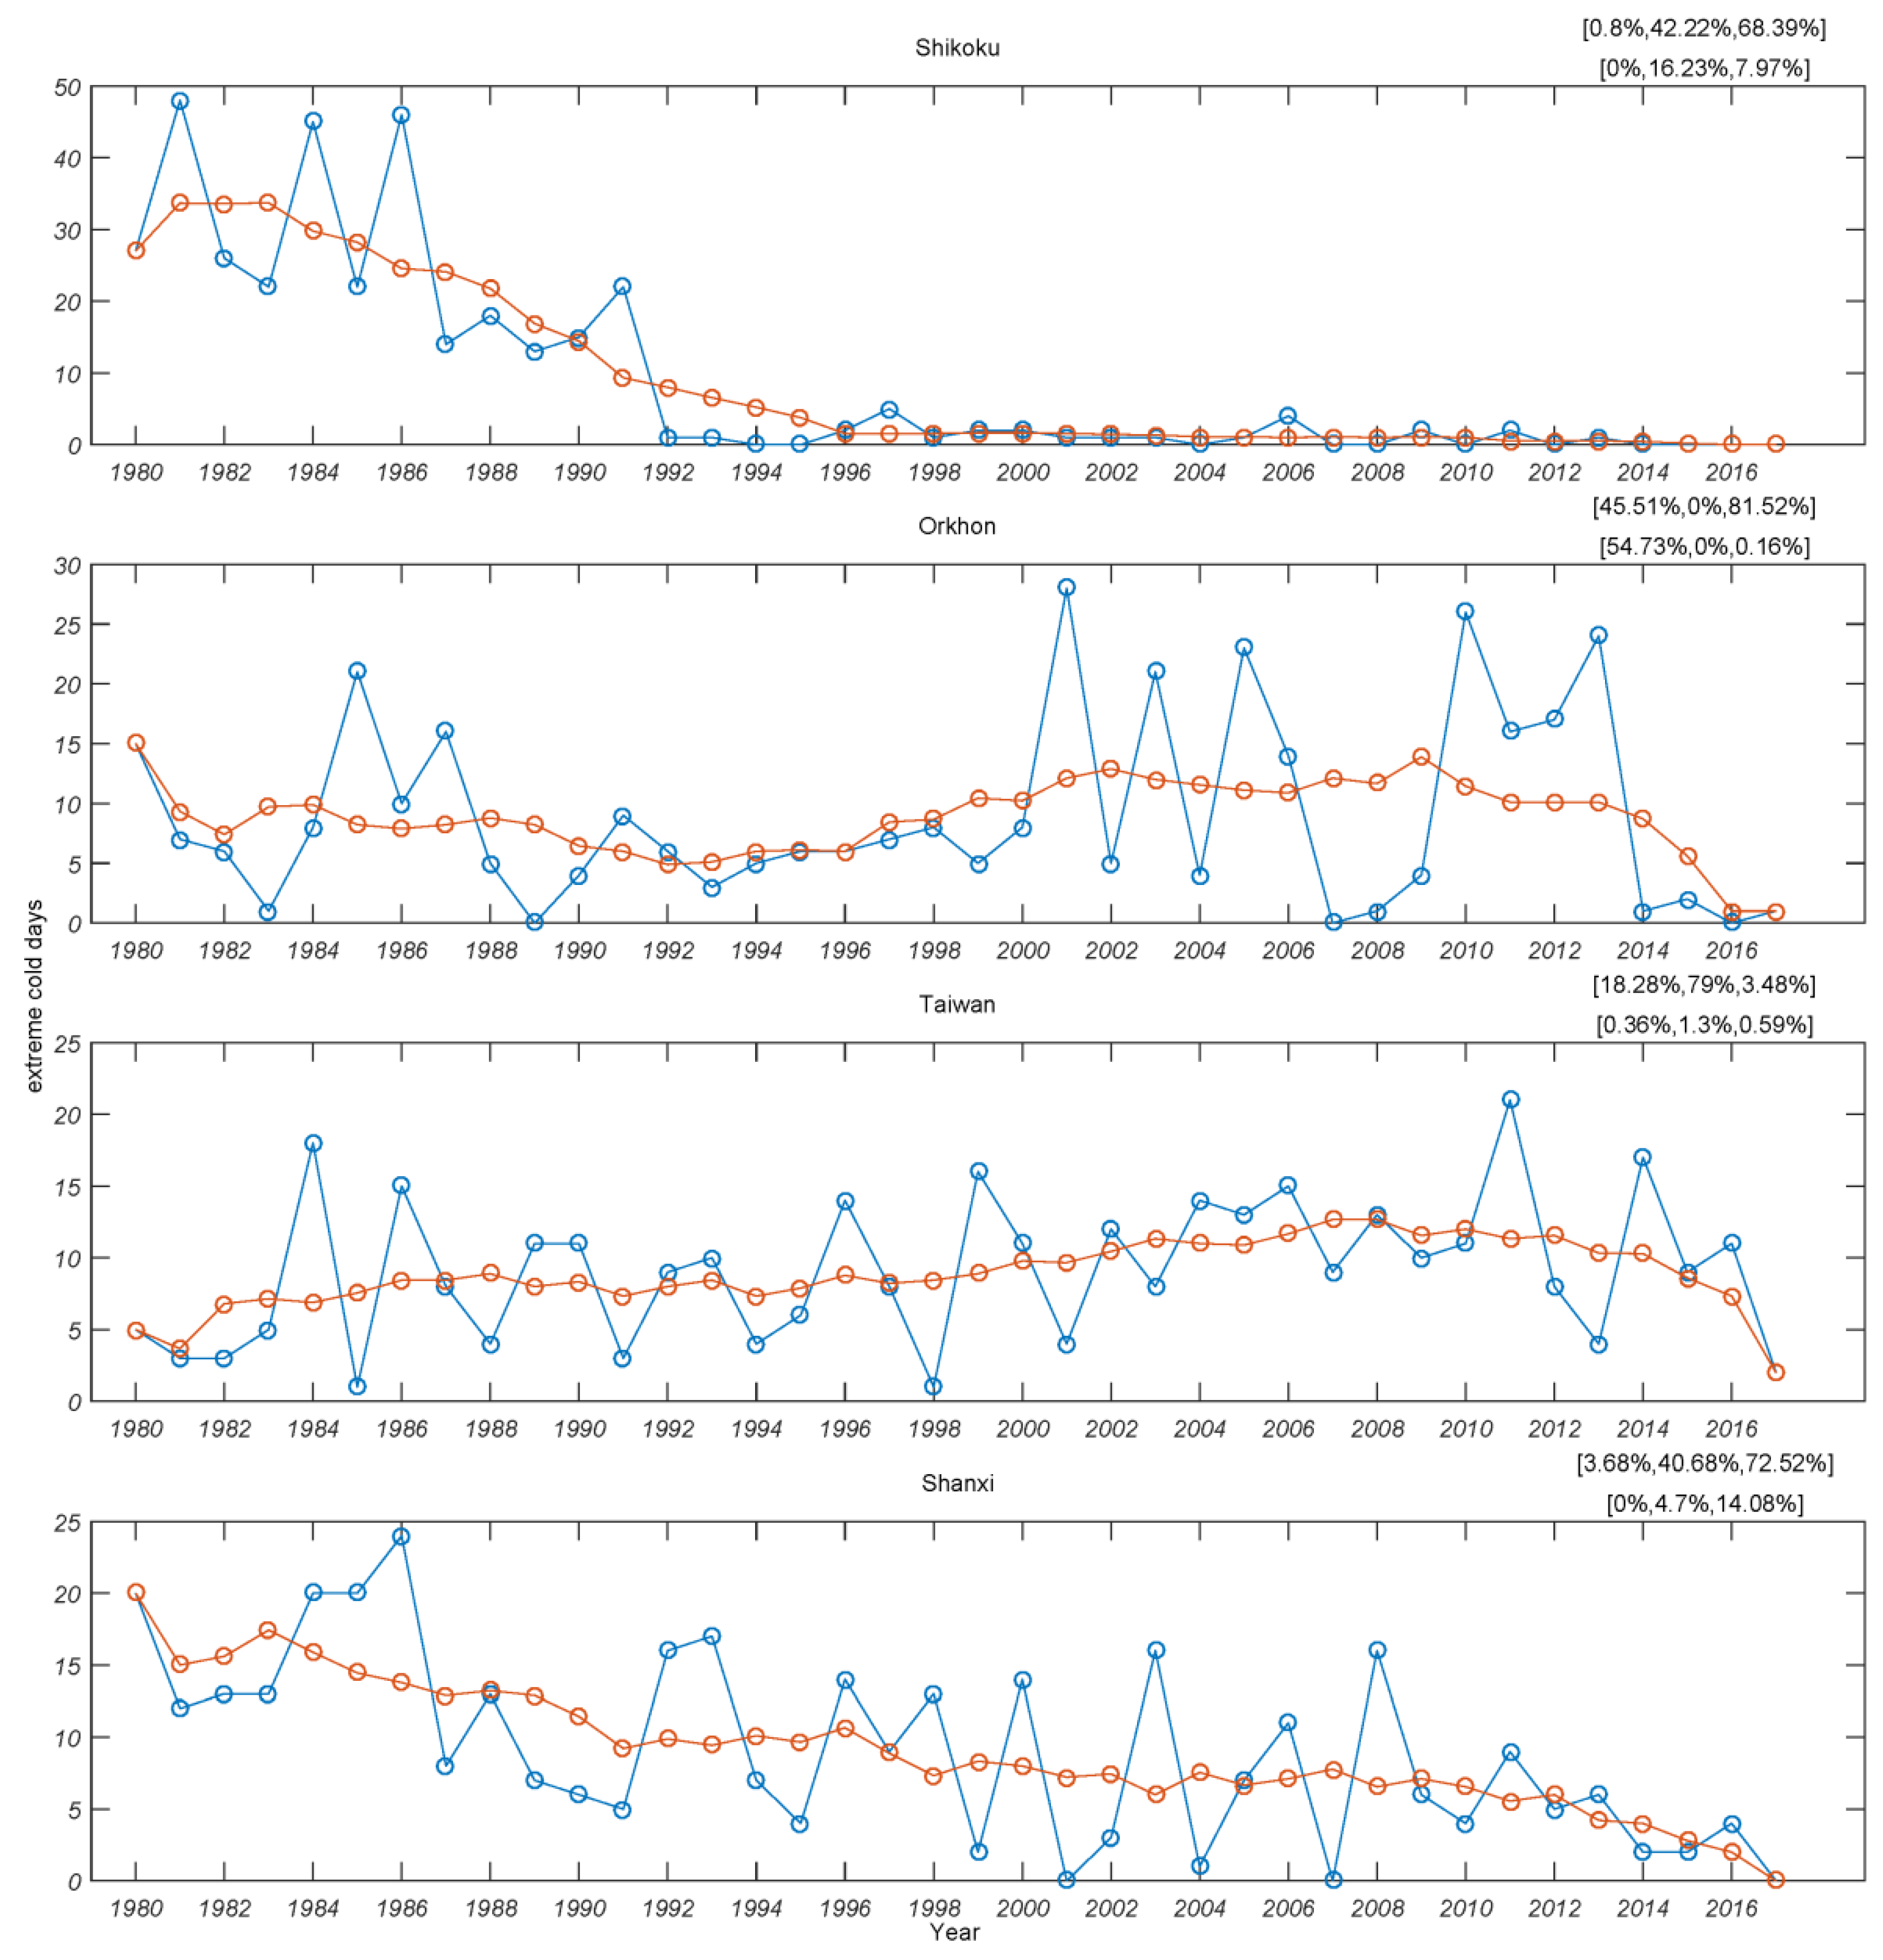
3.1.2. The Tmin Extremes

Figure 2 shows the percentage of daily Tmin extremes concurrent with the WP, AO and ENSO patterns in the positive or negative phase. Blue shaded grids indicate that the corresponding percentages are significantly higher than the expected chance (25%) at a 95% confidence level. The deeper the color, the larger the percentage would be. The grid with deeper color further implies a stronger correlation in the positive/negative teleconnection phase. A WP event is associated with the occurrence of cold extreme days in extratropical and subtropical regions within East Asia except for the region from central to southern China. Inversely, a WP+ event induces the cold extremes in northeastern East Asia. An AO+ event is related to the prevalence of cold extreme days in southwestern China. However, an AO- event is closely linked to the cold extremes over the north of 30° N within East Asia. For an El Niño event, it primarily contributes to the cold extremes in local areas in central Mongolia and southeastern Russia. As for a La Niña event, it exhibits a significant correlation with Tmin extremes in central and southern China. Overall, the daily Tmin extremes have a smaller area and weaker correlation in the ENSO cycle compared to the WP and AO patterns.
Since these patterns usually last from several weeks to months, furthermore, we investigate the relationship between the occurrence of monthly Tmin extremes and teleconnection patterns. The result is presented in Figure 3. In general, the spatial distribution of monthly cold extremes has some commonalities with daily cases but with more scattered and smaller range because of the smaller sample size. However, the correlation between the monthly Tmin extremes and teleconnections has higher statistical significance.

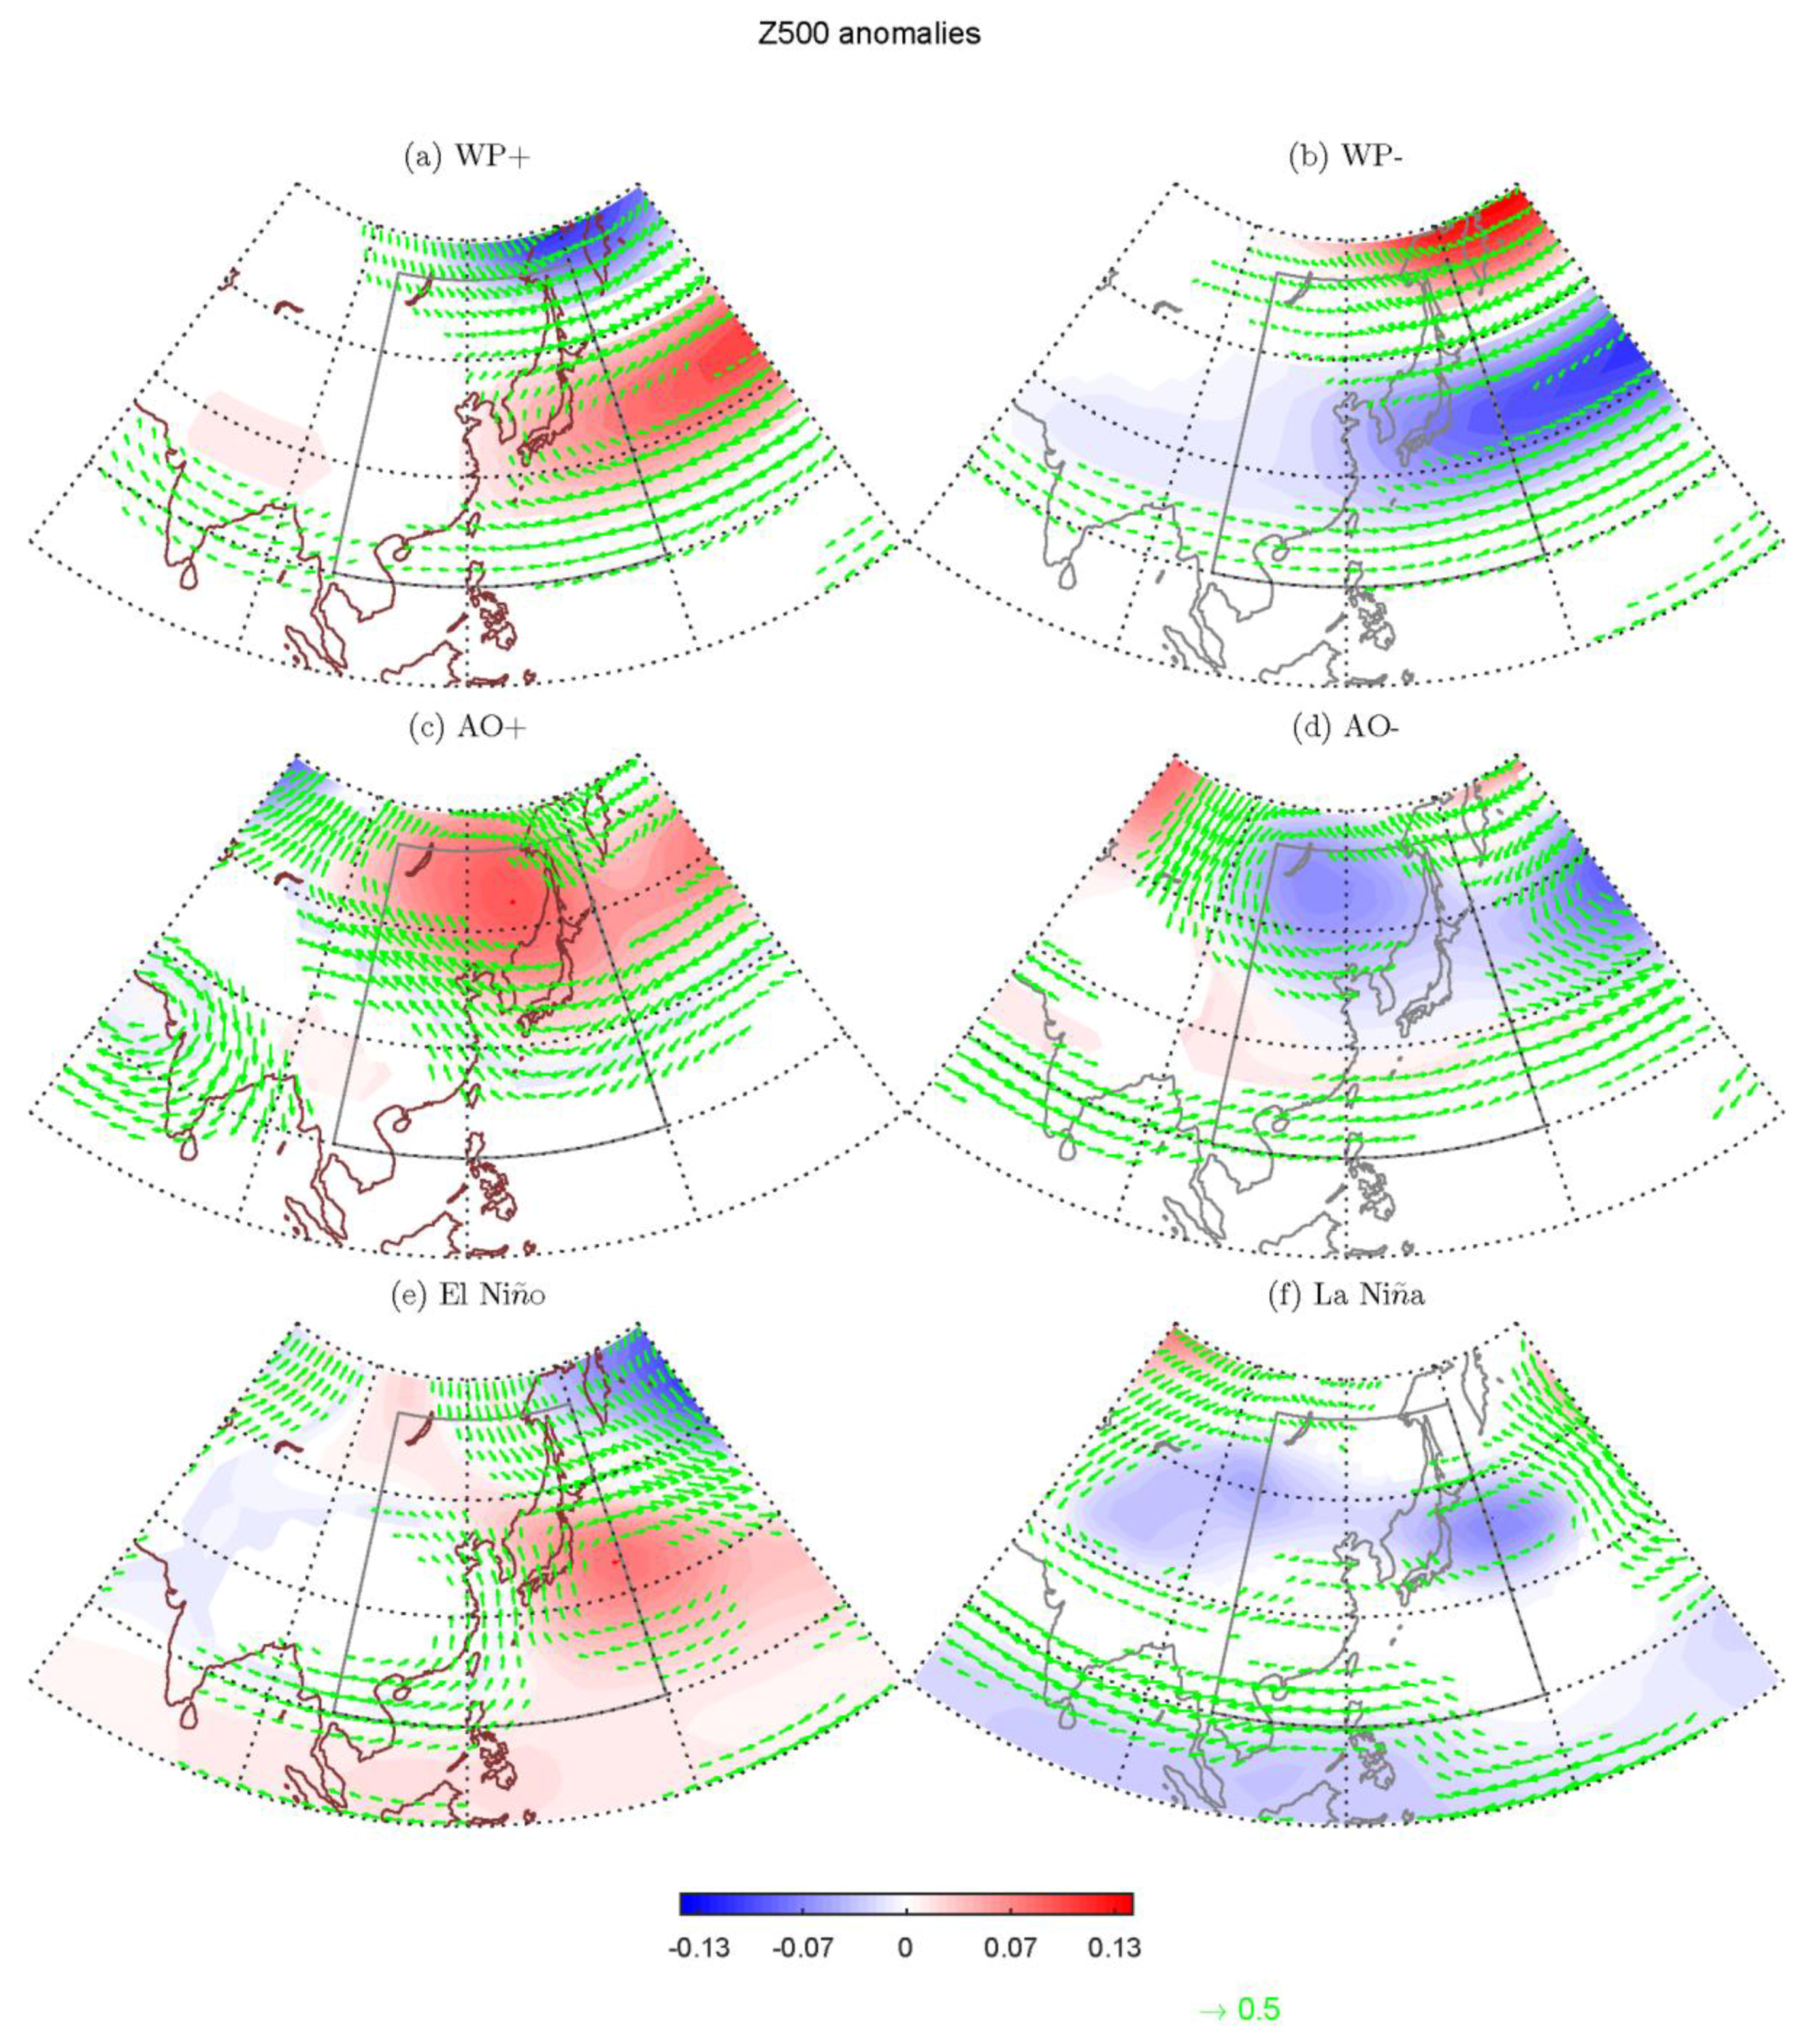
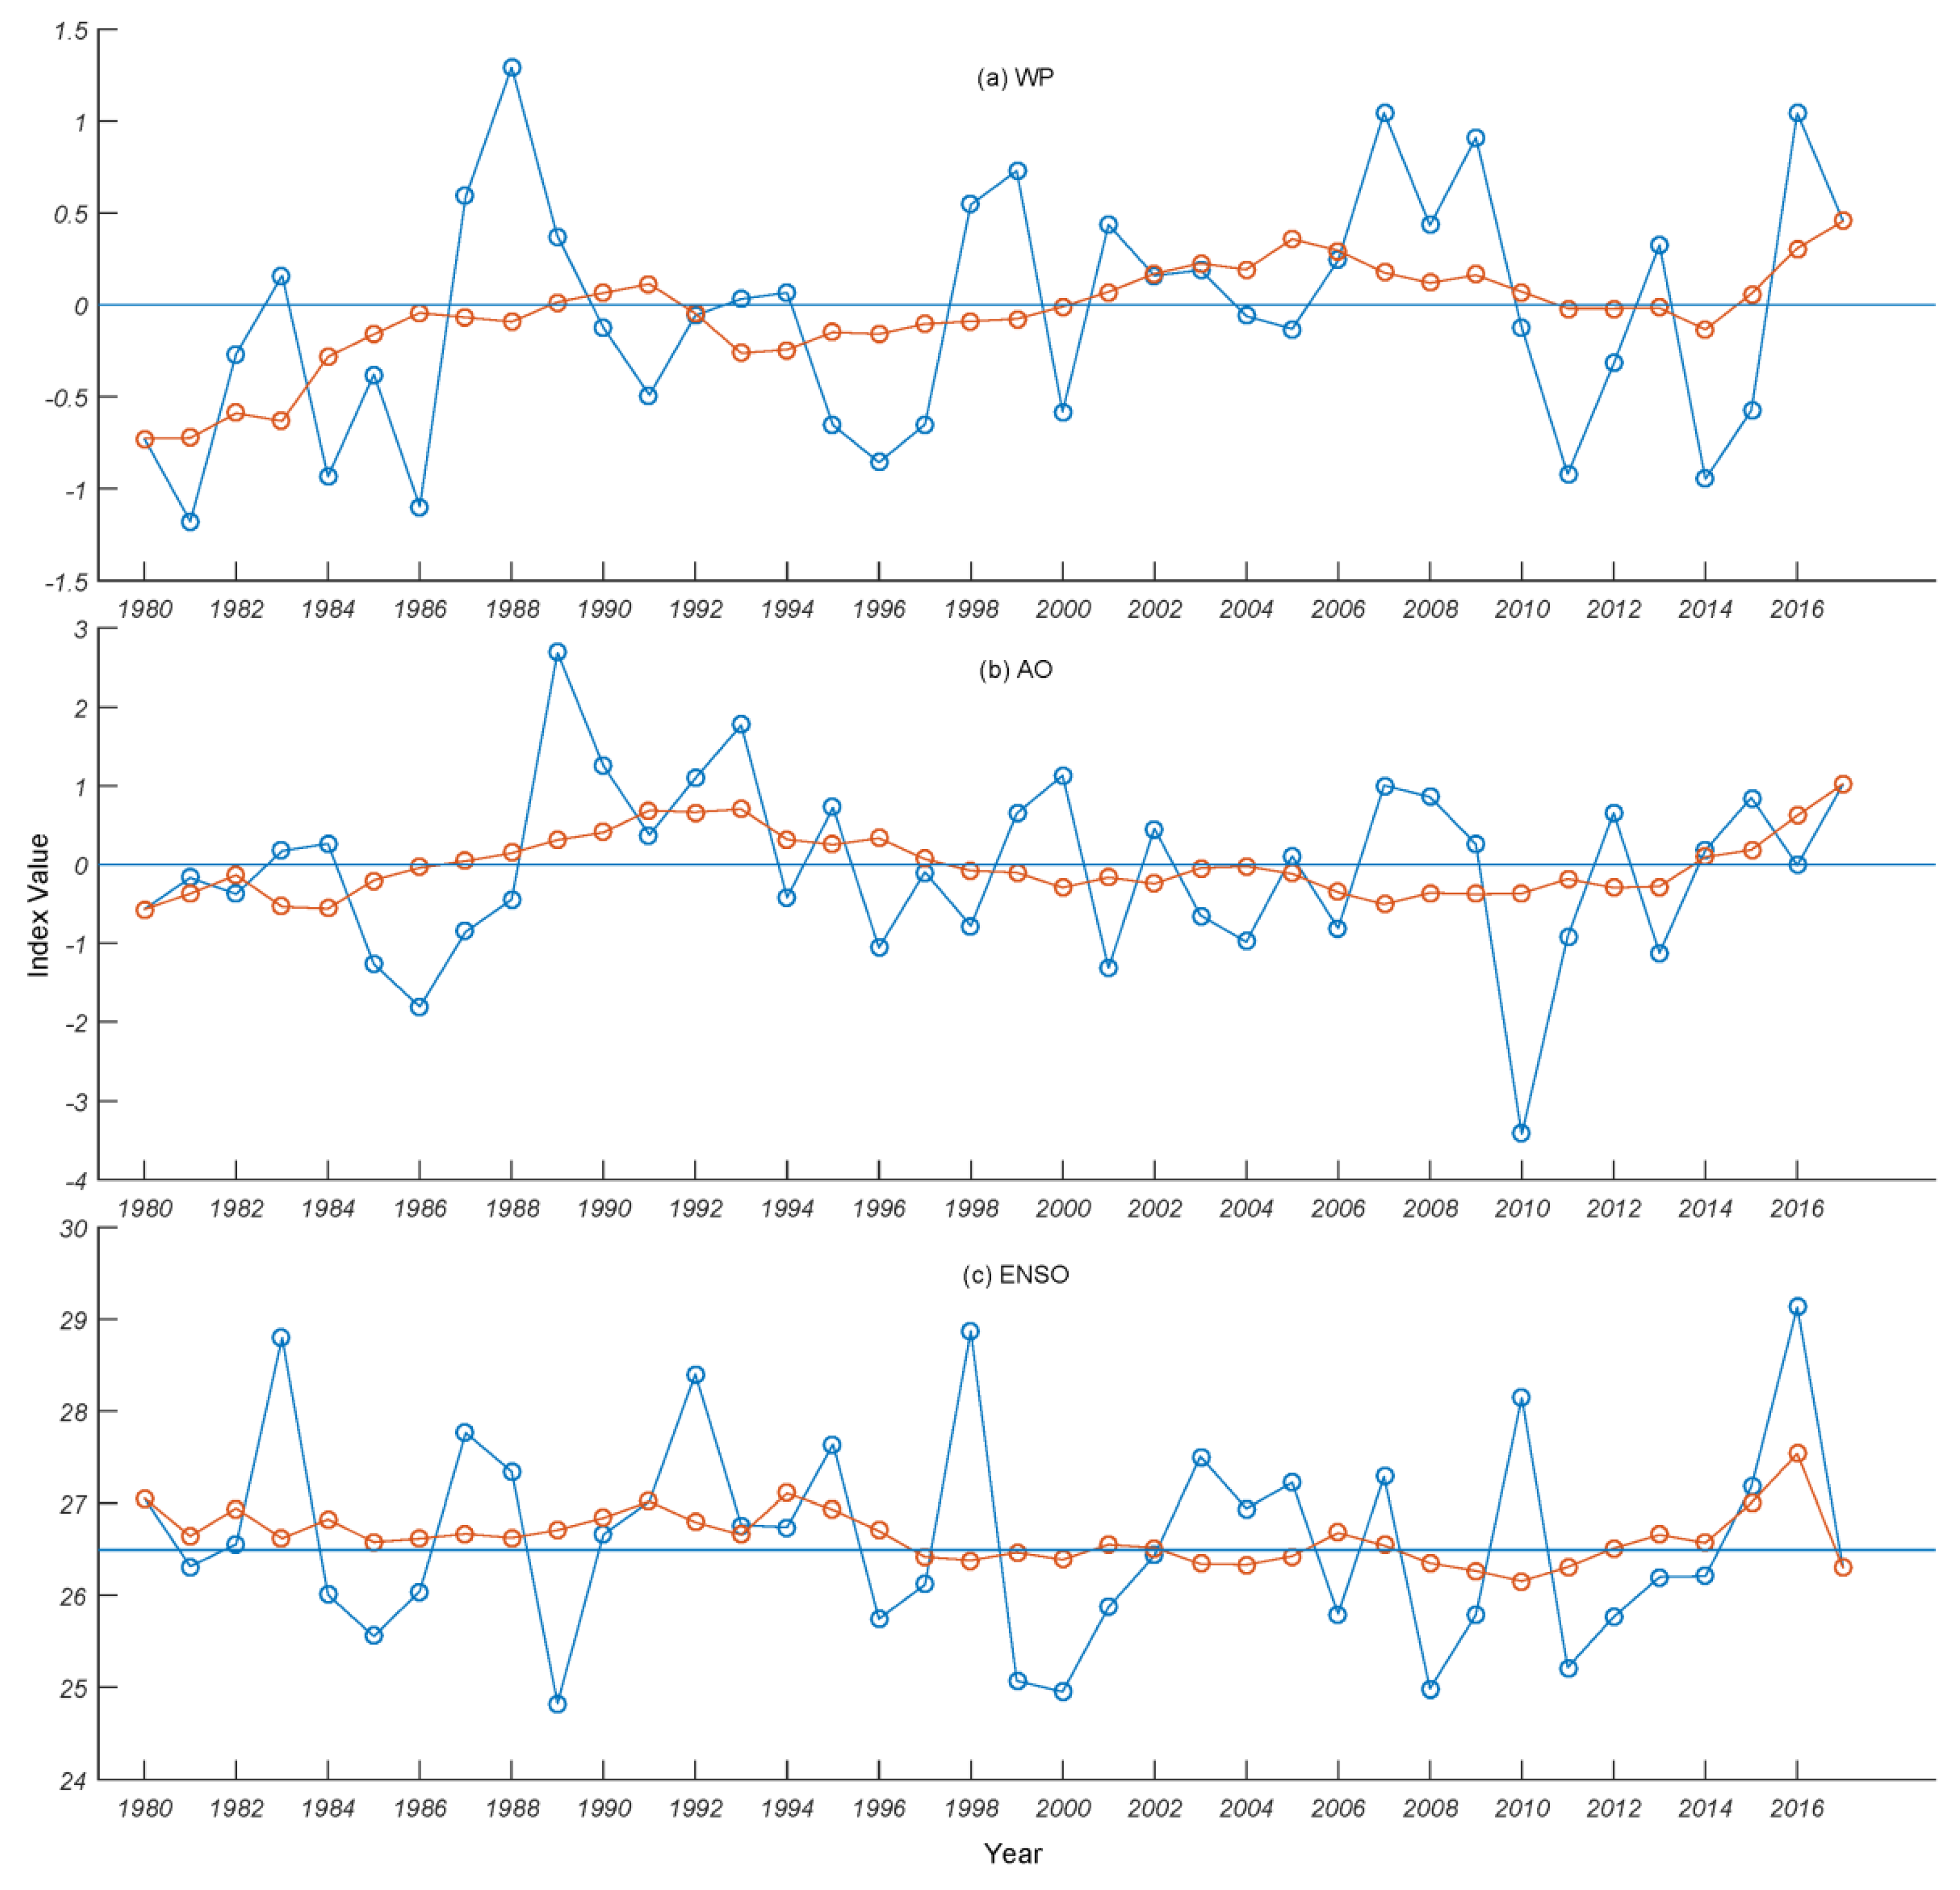
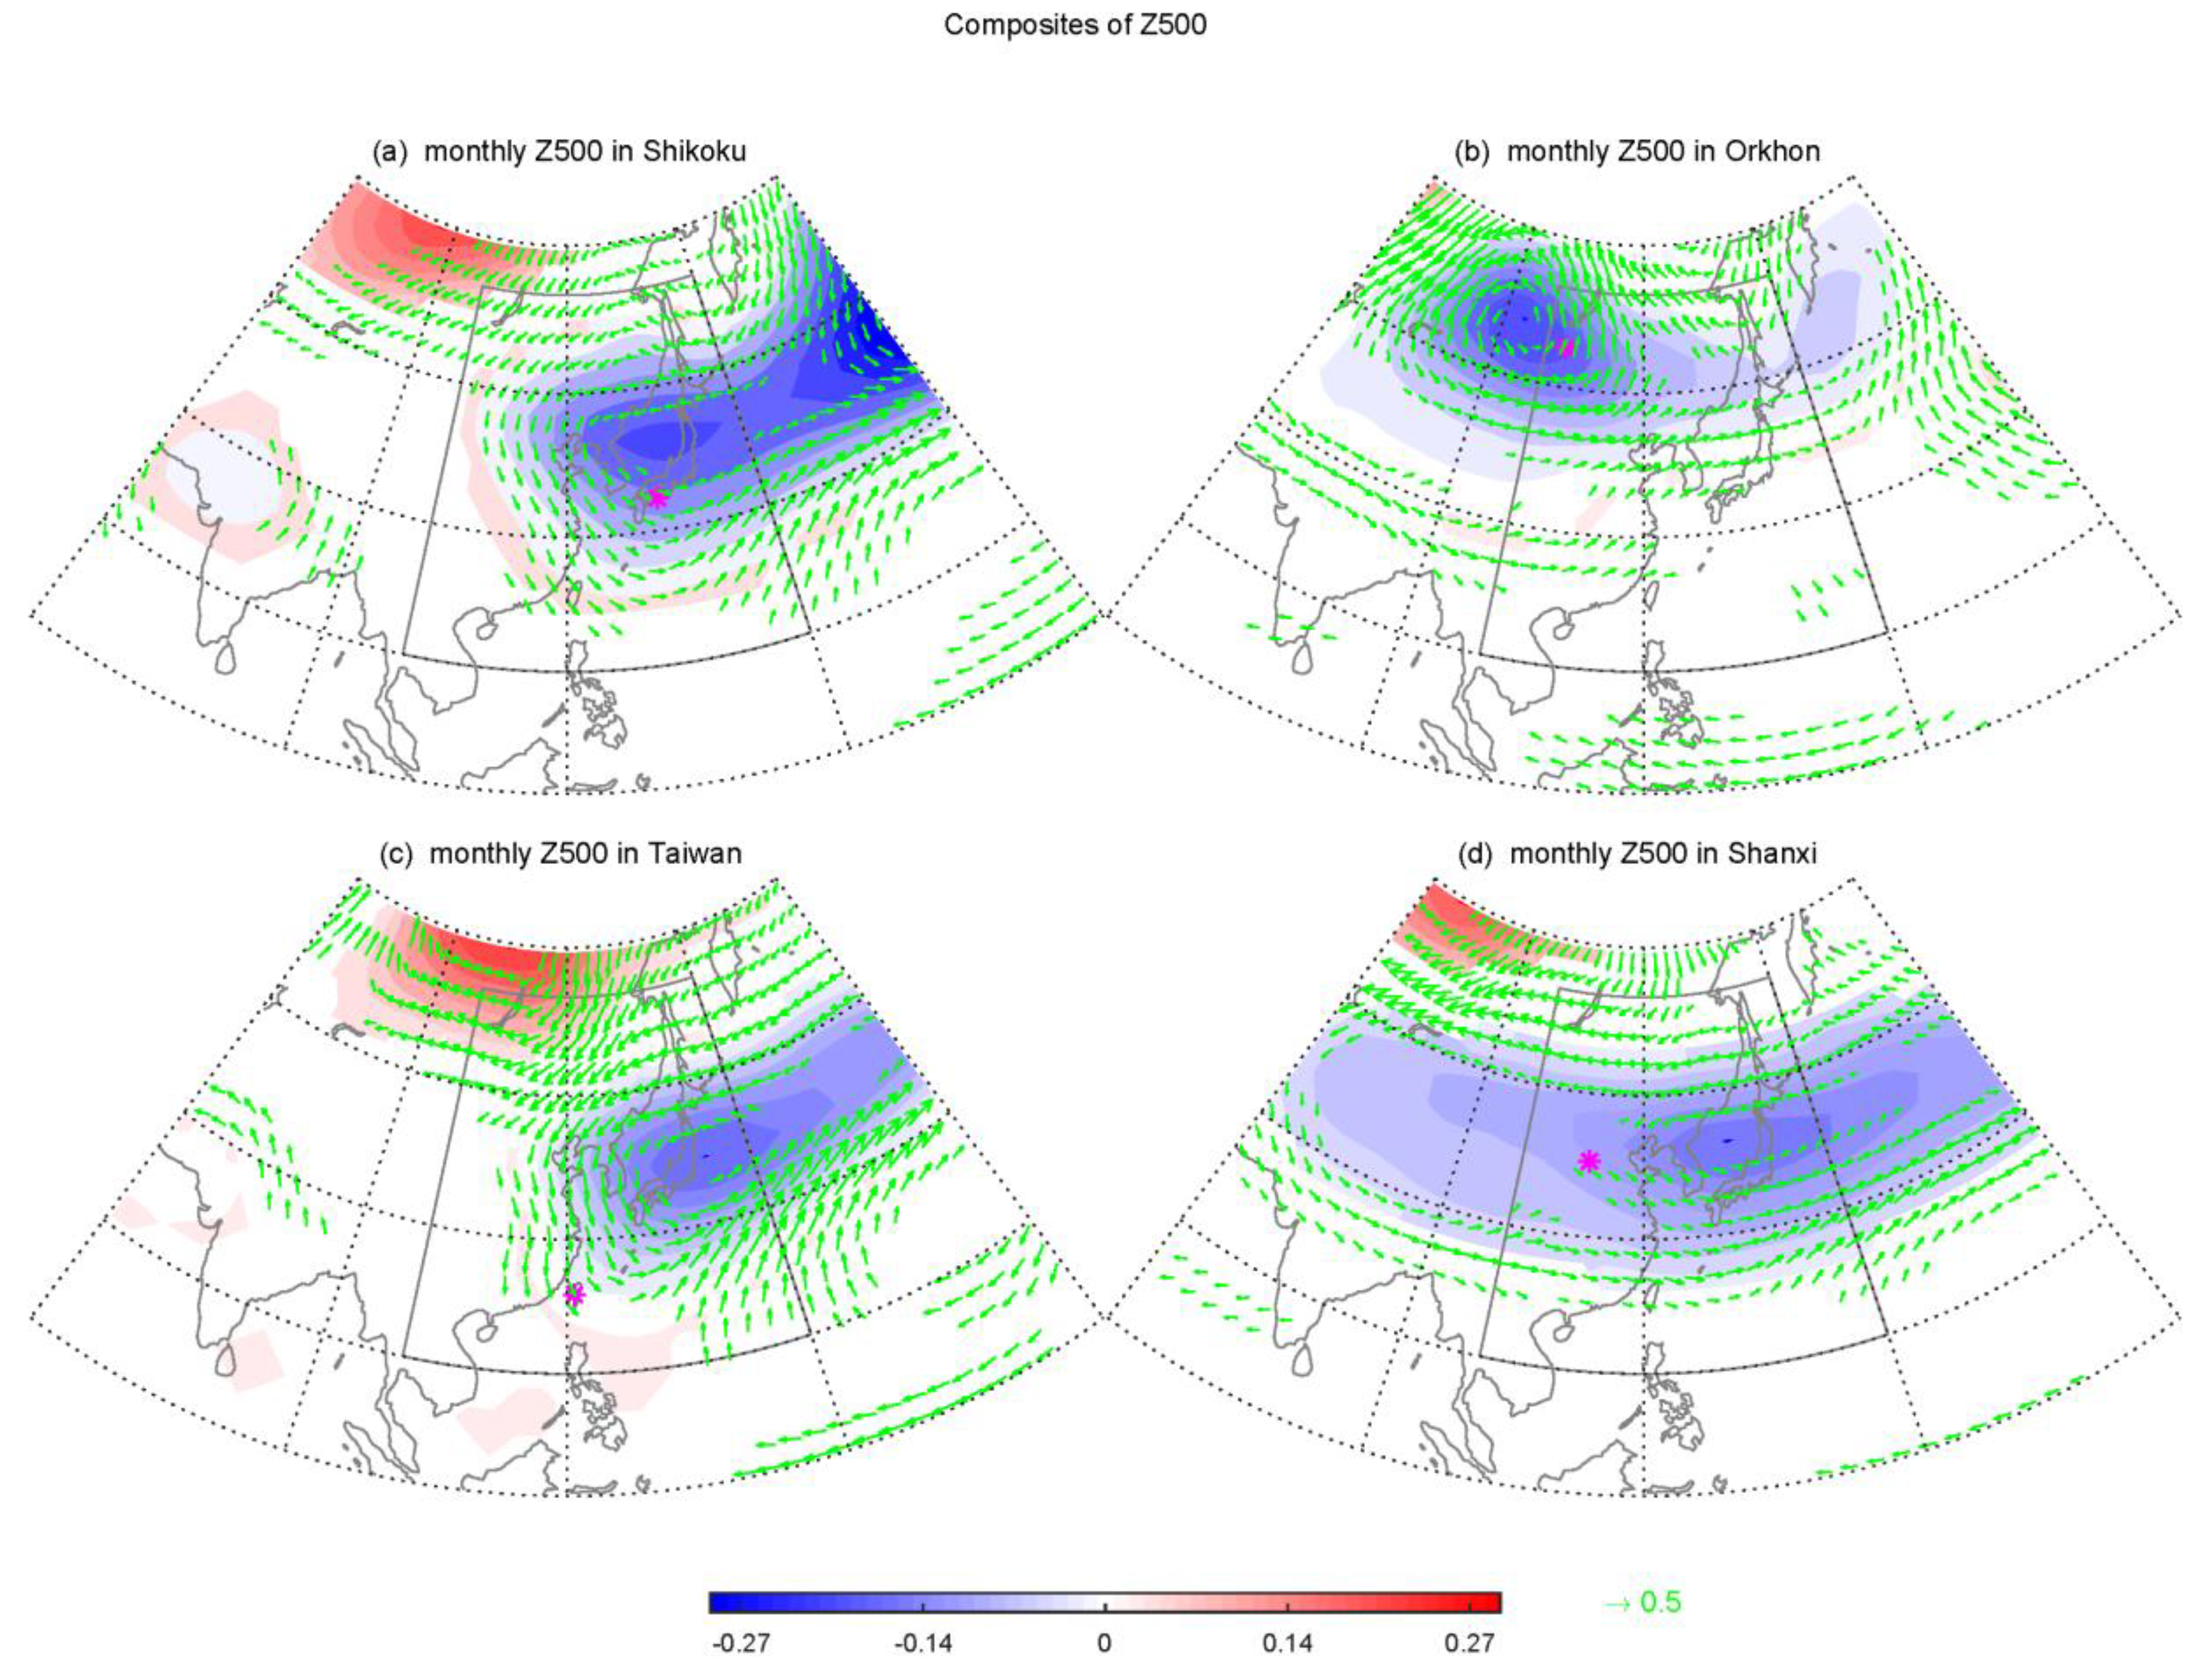
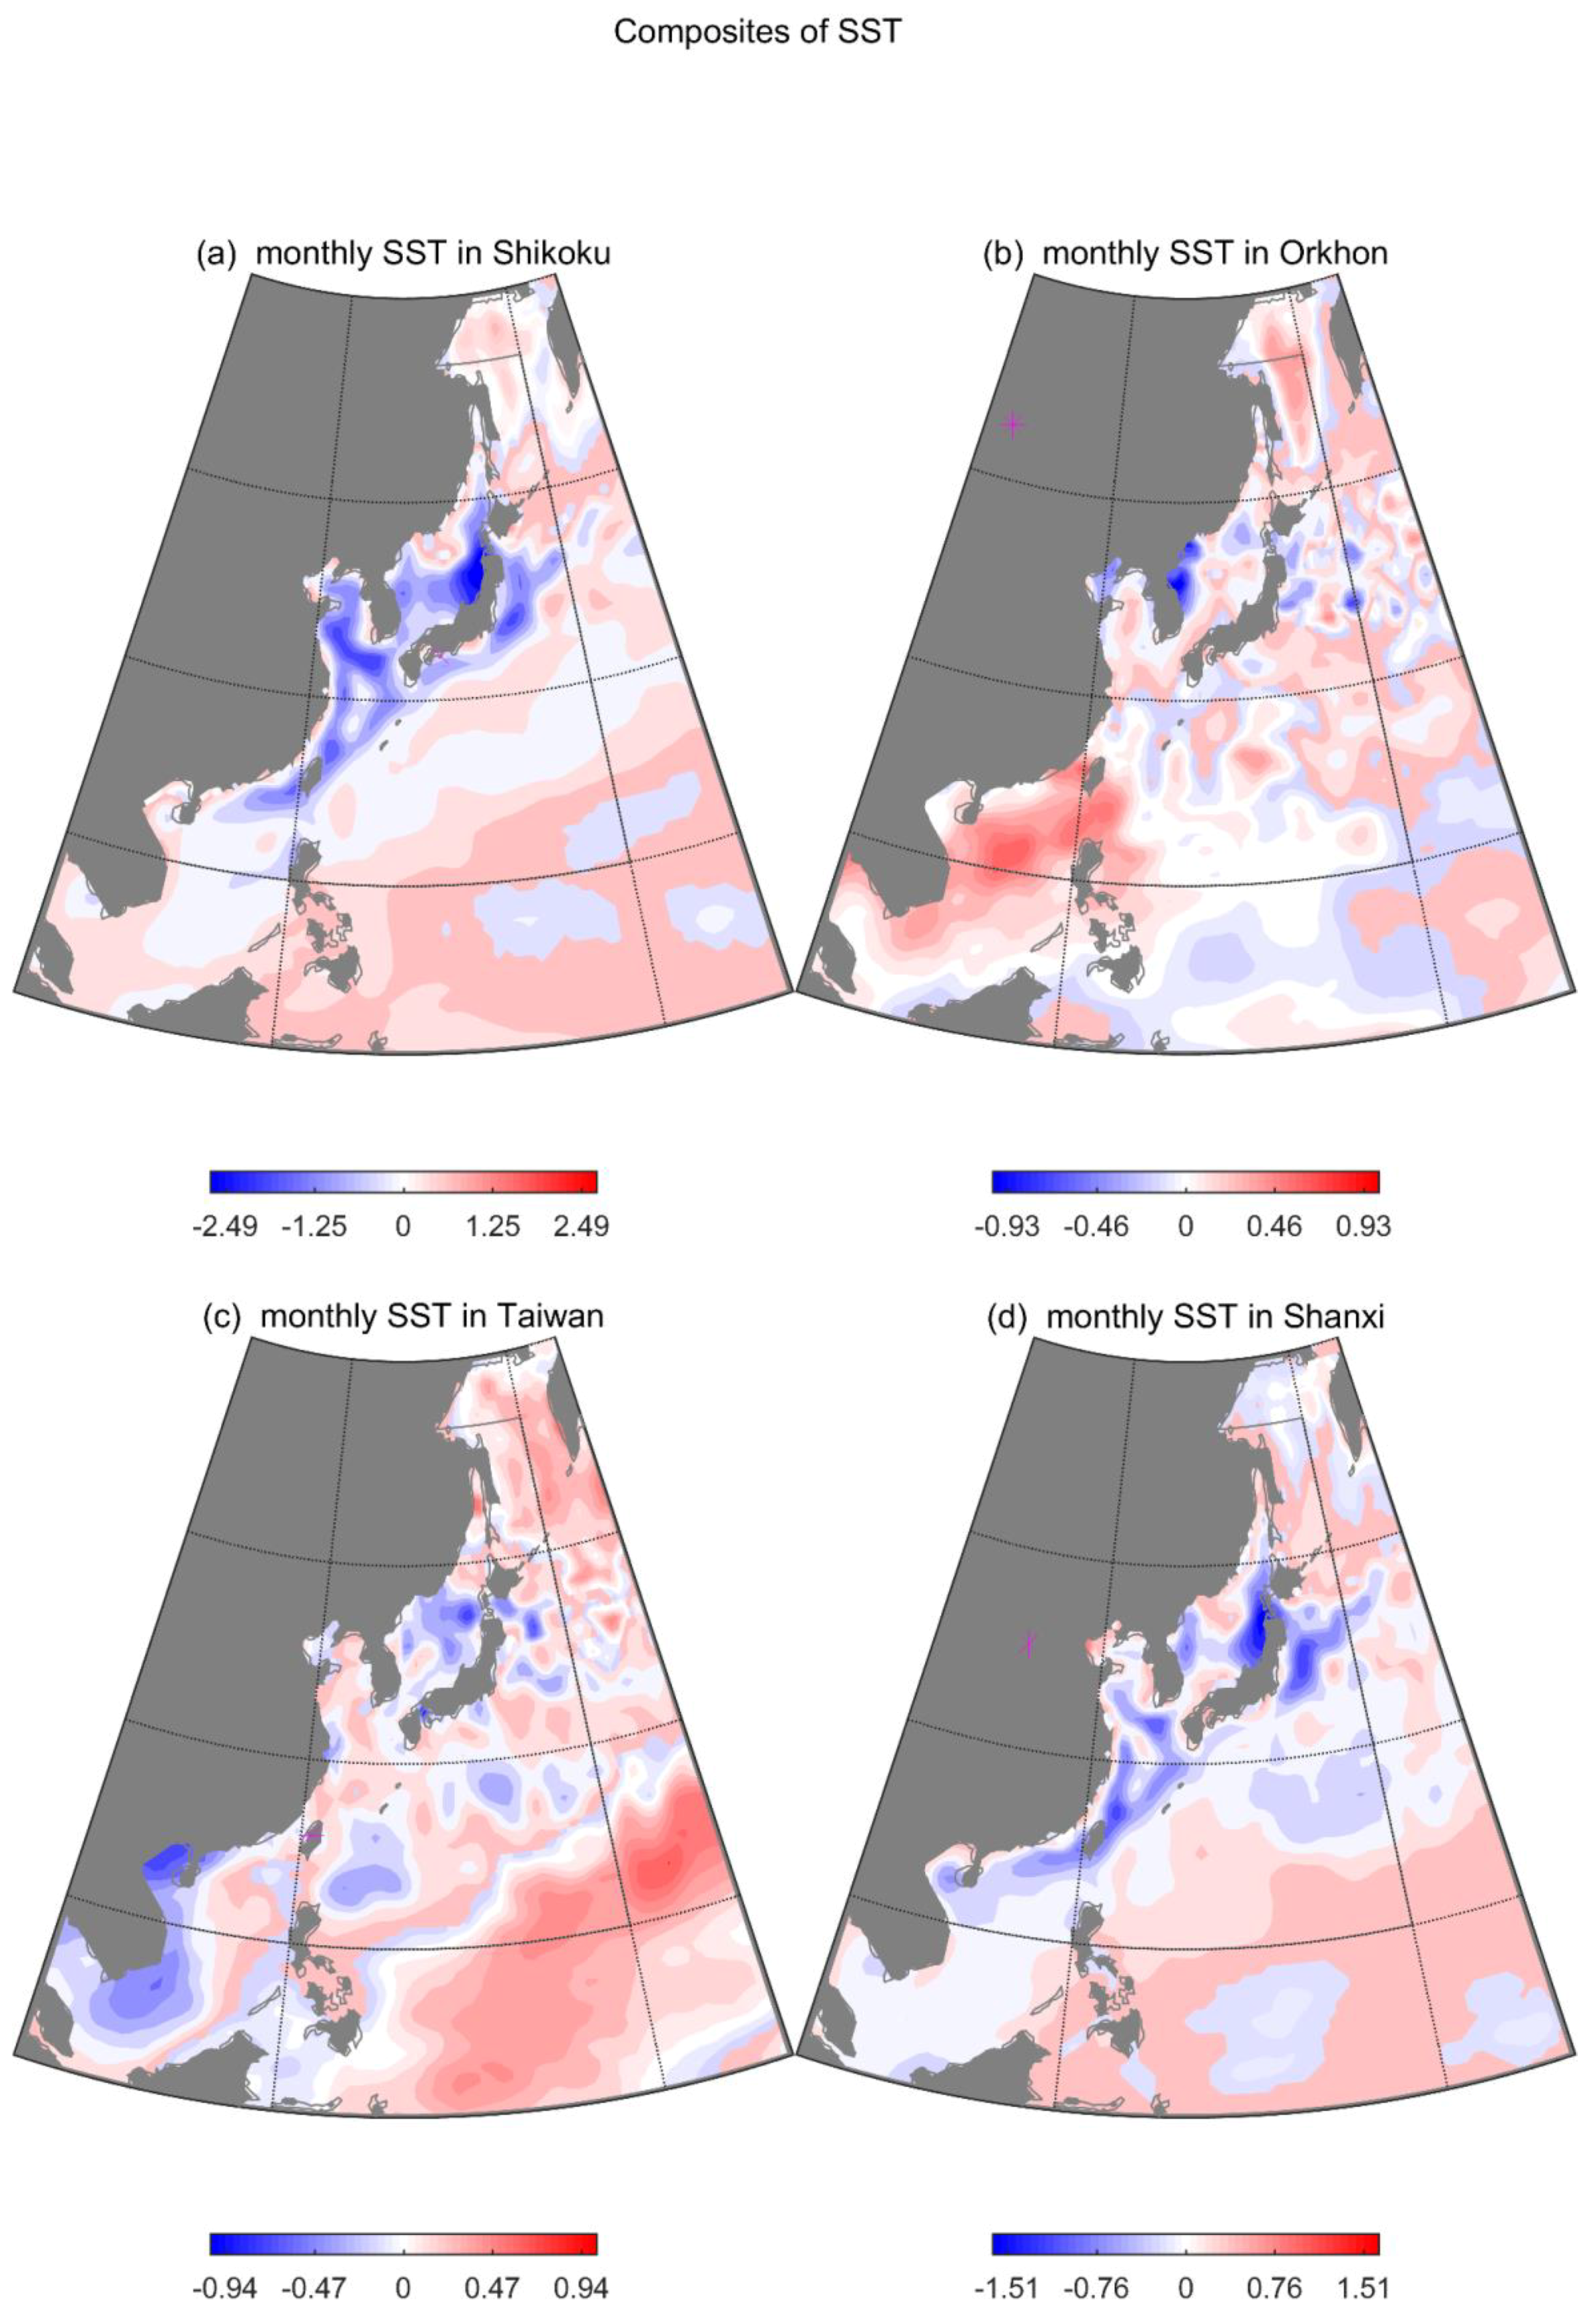
3.1.3. The Z500 and SST Anomalies

To explain the distribution of daily Tmin anomalies and extremes, the composites for Z500 and SST anomalies are shown in Figure 4 and Figure 5, respectively. During the positive (negative) phase of the WP pattern, the composite of Z500 displays a cyclone (anticyclone) in Kamchatka and an anticyclone (cyclone) in the western North Pacific. For the composite of Z500 in the positive (negative) phase of the AO pattern, a strong anticyclonic (cyclonic) circulation centers over the northern region within East Asia. It can be seen that the westerlies at the middle–high latitudes are stronger (weaker) than normal conditions in both cases. Meanwhile, the mid-latitude region within East Asia is governed by the warm (cold) and mild (dry) southerlies (northerlies). As for an El Niño event, an anticyclonic circulation is predominant over the western North Pacific. The south-easterlies and south-westerlies converge around Japan and the coast of East China, which are controlled by warm air. For the case in the opposite phase, the zonal cyclonic circulation prevails over the mid-latitude region of East Asia. The westerlies around 45° N are weakened by the cold air from the Arctic flowing southward into the lower-latitude area.
The composite of SST anomalies in the positive (negative) phase of WP exhibits the prominent warm (cold) anomalies over the western North Pacific, which is surrounded by the weak cold (warm) anomalies in the north and south, respectively. As for the positive phase of AO, the composite depicts the evident warm (cold) SST anomalies originating from the Yellow Sea and the Bohai Sea, passing through the Sea of Japan, reaching the western North Pacific. The SST anomalies at middle–high latitudes for the El Niño events have some commonalities with that in the positive phase of WP, but present strong cold anomalies in tropical West Pacific. In contrast, for a La Niña event, widespread warm anomalies appear over the entire western North Pacific and the anomalies in the tropical western Pacific warm pool are very strong.
Additionally, we constitute the composites of monthly Z500 and SST anomalies. Since the distribution of Z500 and SST anomalies for months is very similar to that for days, the relevant composites are not presented here.

3.2. Individual Cases Associated with the Large-Scale Teleconnections

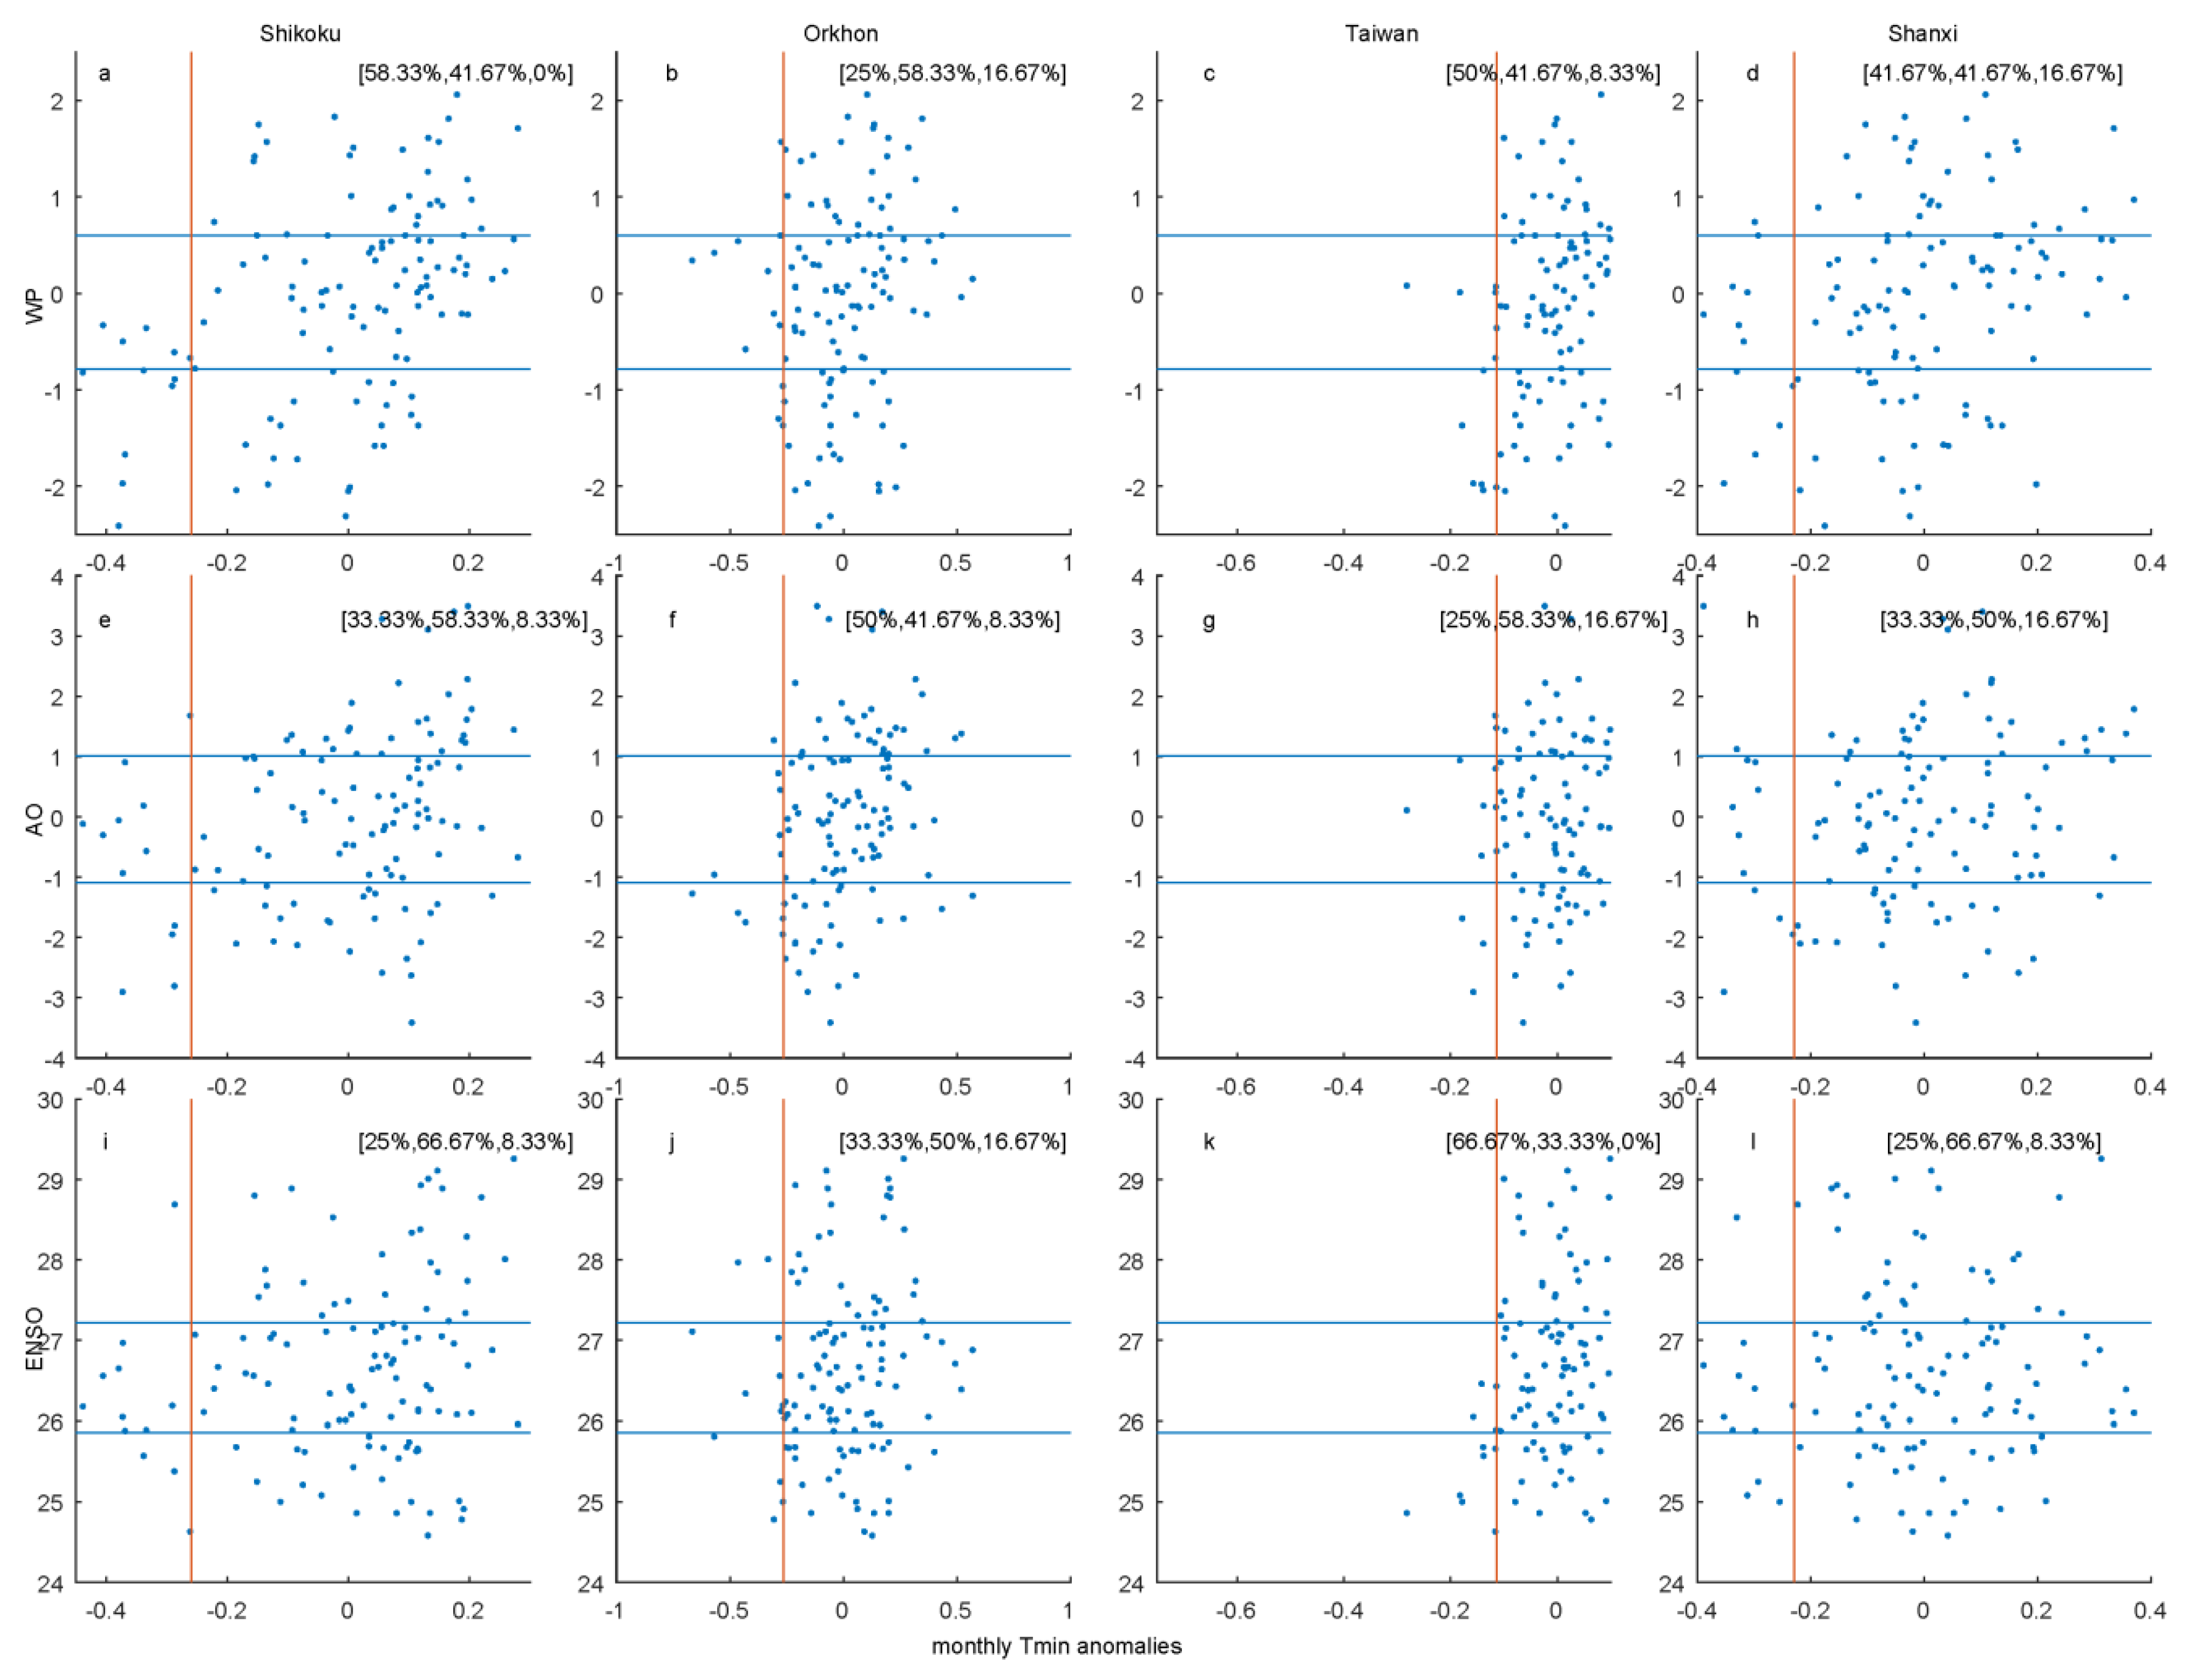
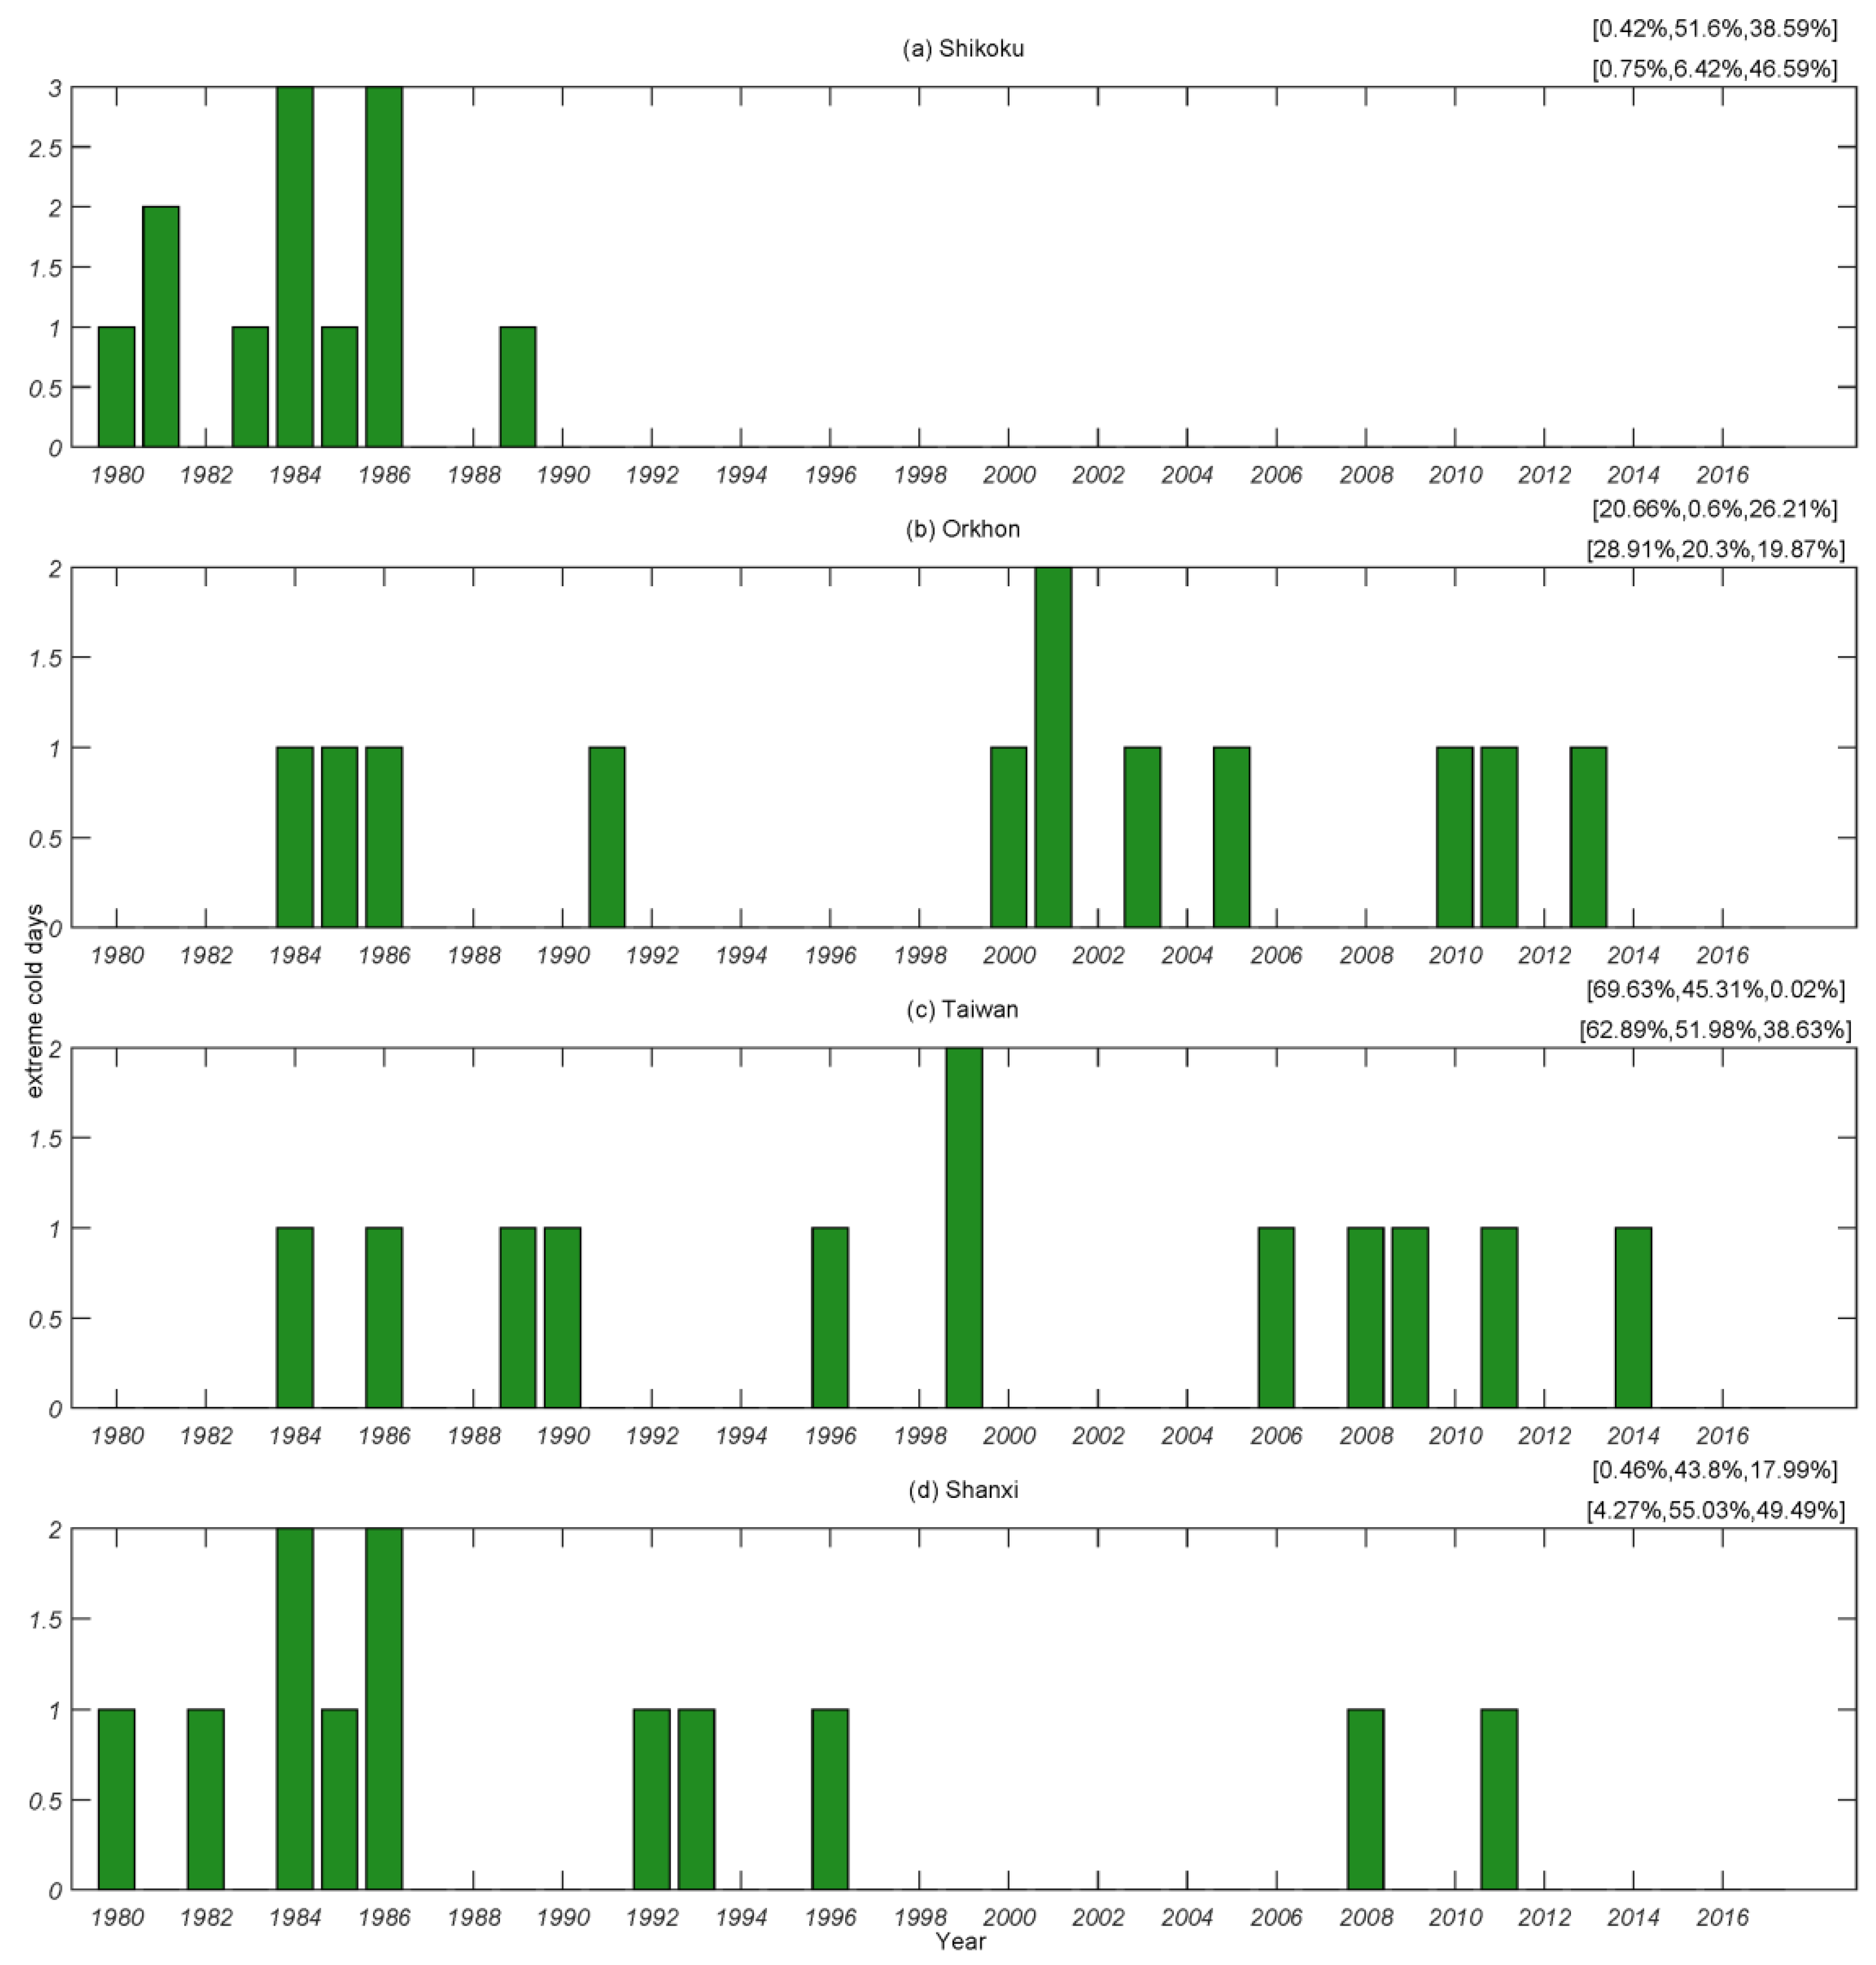
3.2.1. The Tmin Extremes in the Pattern of the Individual Cases

To verify the effect of large-scale teleconnection on Tmin variations in boreal winter from 1979 to 2017, four locations within Shikoku of Japan, Taiwan, Shanxi province of China and Orkhon Aimag of Mongolia are selected to discuss according to Figure 2 and Figure 3. The cold extremes in Shikoku (34° N, 134° E) are closely related to the WP-pattern, whereas extremes in Orkhon (49° N, 104° E) are impacted by the AO-pattern. Both WP- and ENSO-events have an effect on the Tmin extremes in Taiwan (24° N, 121° E) and the former effect is greater than the latter. Here, Shanxi (38° N, 111° E) is a special case where it is not subjected to any patterns involved in this study.
Figure 6 displays the scatterplots between the daily Tmin anomalies and teleconnection indices values. For cases of Shikoku, Orkhon and Taiwan, a large body of Tmin extremes appear in the negative phase of the dominant pattern, whereas there are still several extremes are related to the opposite phase. This result illustrates that the Tmin extremes are subjected to other factors except for the leading patterns, even though the region has a significant correlation with these teleconnections. Besides, the number of daily cold extremes in the preferred phase of the dominant pattern is two to three times as the opposite phase, while the ratio is approximate 1:1 in other patterns except for the example of Shikoku in the AO pattern. The asymmetric characteristics in three locations demonstrate the phase that a leading teleconnection plays, which is a substantial role in the existence of Tmin extremes in these regions. In particular, the trend towards a particular phase is not evident in the case of Tmin extremes in Shanxi. Moreover, we find that the coldest days in Taiwan concur with the La Niña event, which suggests that the ENSO cycle is the main background field for the pronounced temperature variations in this area.
Figure 7 shows the scatterplots for the monthly Tmin anomalies and teleconnections. For the cases of Shikoku, Orkhon and Taiwan, there is a higher frequency for the occurrence of monthly extremes in the negative phase than normal conditions of dominant pattern, and few monthly extremes appear in the opposite phase compared to the daily extremes. Overall, the percentage of extreme months in the positive event is lowest, regardless of locations and patterns. Notably, the monthly extremes in Shanxi present some connections with the WP- and AO-events compared to daily extremes, which is indicative of that the leading low-frequency patterns affect the temperature variability in this location on monthly timescale, whereas other factors with shorter timescale cause the daily cold extremes.
The time series of teleconnection indices and the number of extremely cold days are presented in Figure 8 and Figure 9. The blue and red line in Figure 8 represents the interannual and interdecadal variability, respectively. There is an increasing trend in the oscillation in the WP pattern. The strong WP-events appear frequently during the wintertime for the periods 1980–1986, 1994–1997 and 2010–2015. Correspondingly, the extreme cold events in Shikoku were relatively active from 1980–1986. Nevertheless, the number of extreme days experienced a decrease prominently around 1987. There were few cold extremes since 1992 except for 1997, 2006, 2009 and 2011. The cold extremes in Orkhon are frequently concurrent with the AO-events for the periods 1985–1987, 2001–2003 and 2009–2013. The observed extremes have a higher frequency in these years than others as well. In particular, the long-term variation exhibits the simultaneously reverse trend between the extremes in Orkhon and AO index. The phenomenon implies that extremes are subjected to the AO pattern at the interdecadal time scales. For the case of Taiwan, it can be seen that the interdecadal variability of extreme days tends to increase since 1999, while the ENSO index experienced an evident decrease in the same phase. Therefore, we conclude that the number of extreme days and ENSO index have a close correlation on the long-term variability. Moreover, we employed the Pearson analysis to test the significance of correlations at different time scales. Overall, the correlations between the extremely cold days on Shikoku, Taiwan and Orkhon and the relevant dominant patterns have high statistical significance at the 95% level. The significance is higher on the interdecadal scale than the interannual scale. Especially, we found Shanxi has a significant correlation with the WP pattern, while the case is not closely linked to the strongly negative phase of this teleconnection in Figure 2 and Figure 6. The correlation indicates that the extreme Tmin days in Shanxi maybe only depend on the positive or negative value of the WP index, regardless of the strength of the phase. On the other hand, there is a significant correlation between the daily extreme cold on Shanxi as well as Taiwan and the interdecadal AO index. The phenomenon implied that the AO pattern could trigger the temperature variability on the longer timescale in both locations. Similar situations were observed in the Orkhon case but for ENSO pattern.
The trend of extreme months has some commonalities with that of days for four locations (Figure 10). In particular, all of the monthly extremes from 1980 to 1989 fall in the interval of the WP index less than 0 for the Shikoku case. A similar state appears in the example of Taiwan with the ENSO. That suggests the dominant teleconnections are greatly influential on the monthly Tmin in these locations, in spite of the patterns with relatively weak strength.

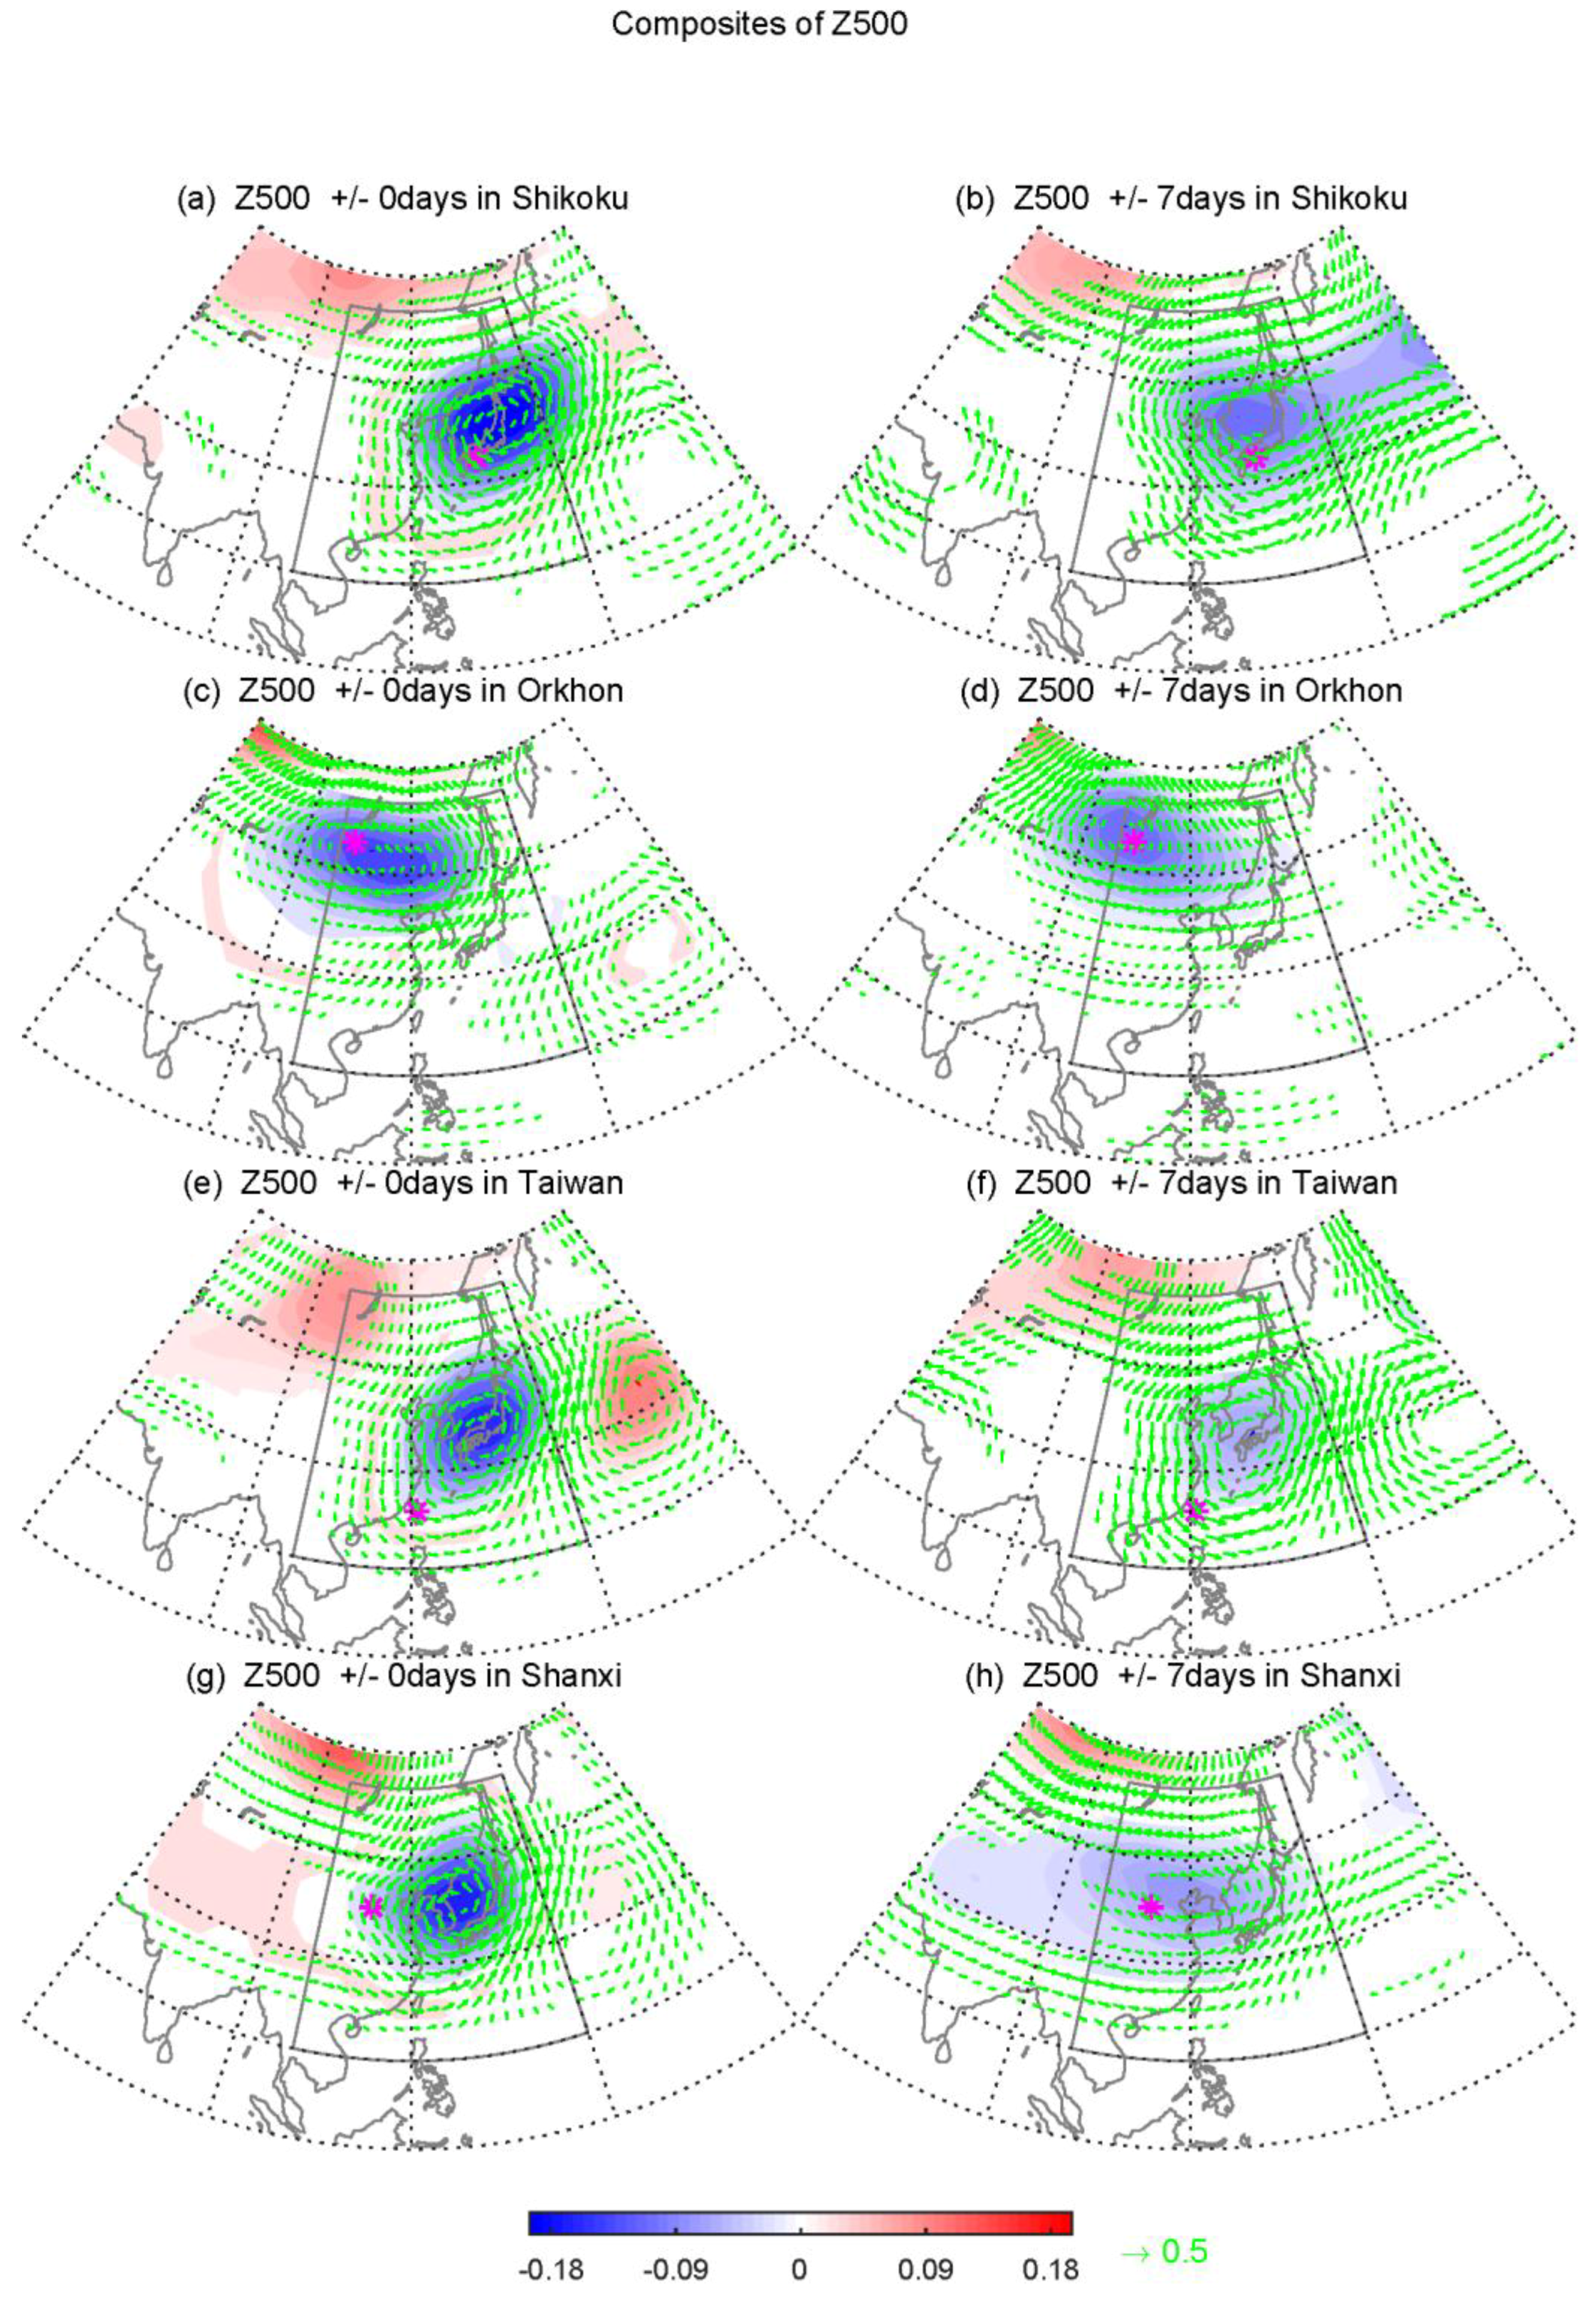
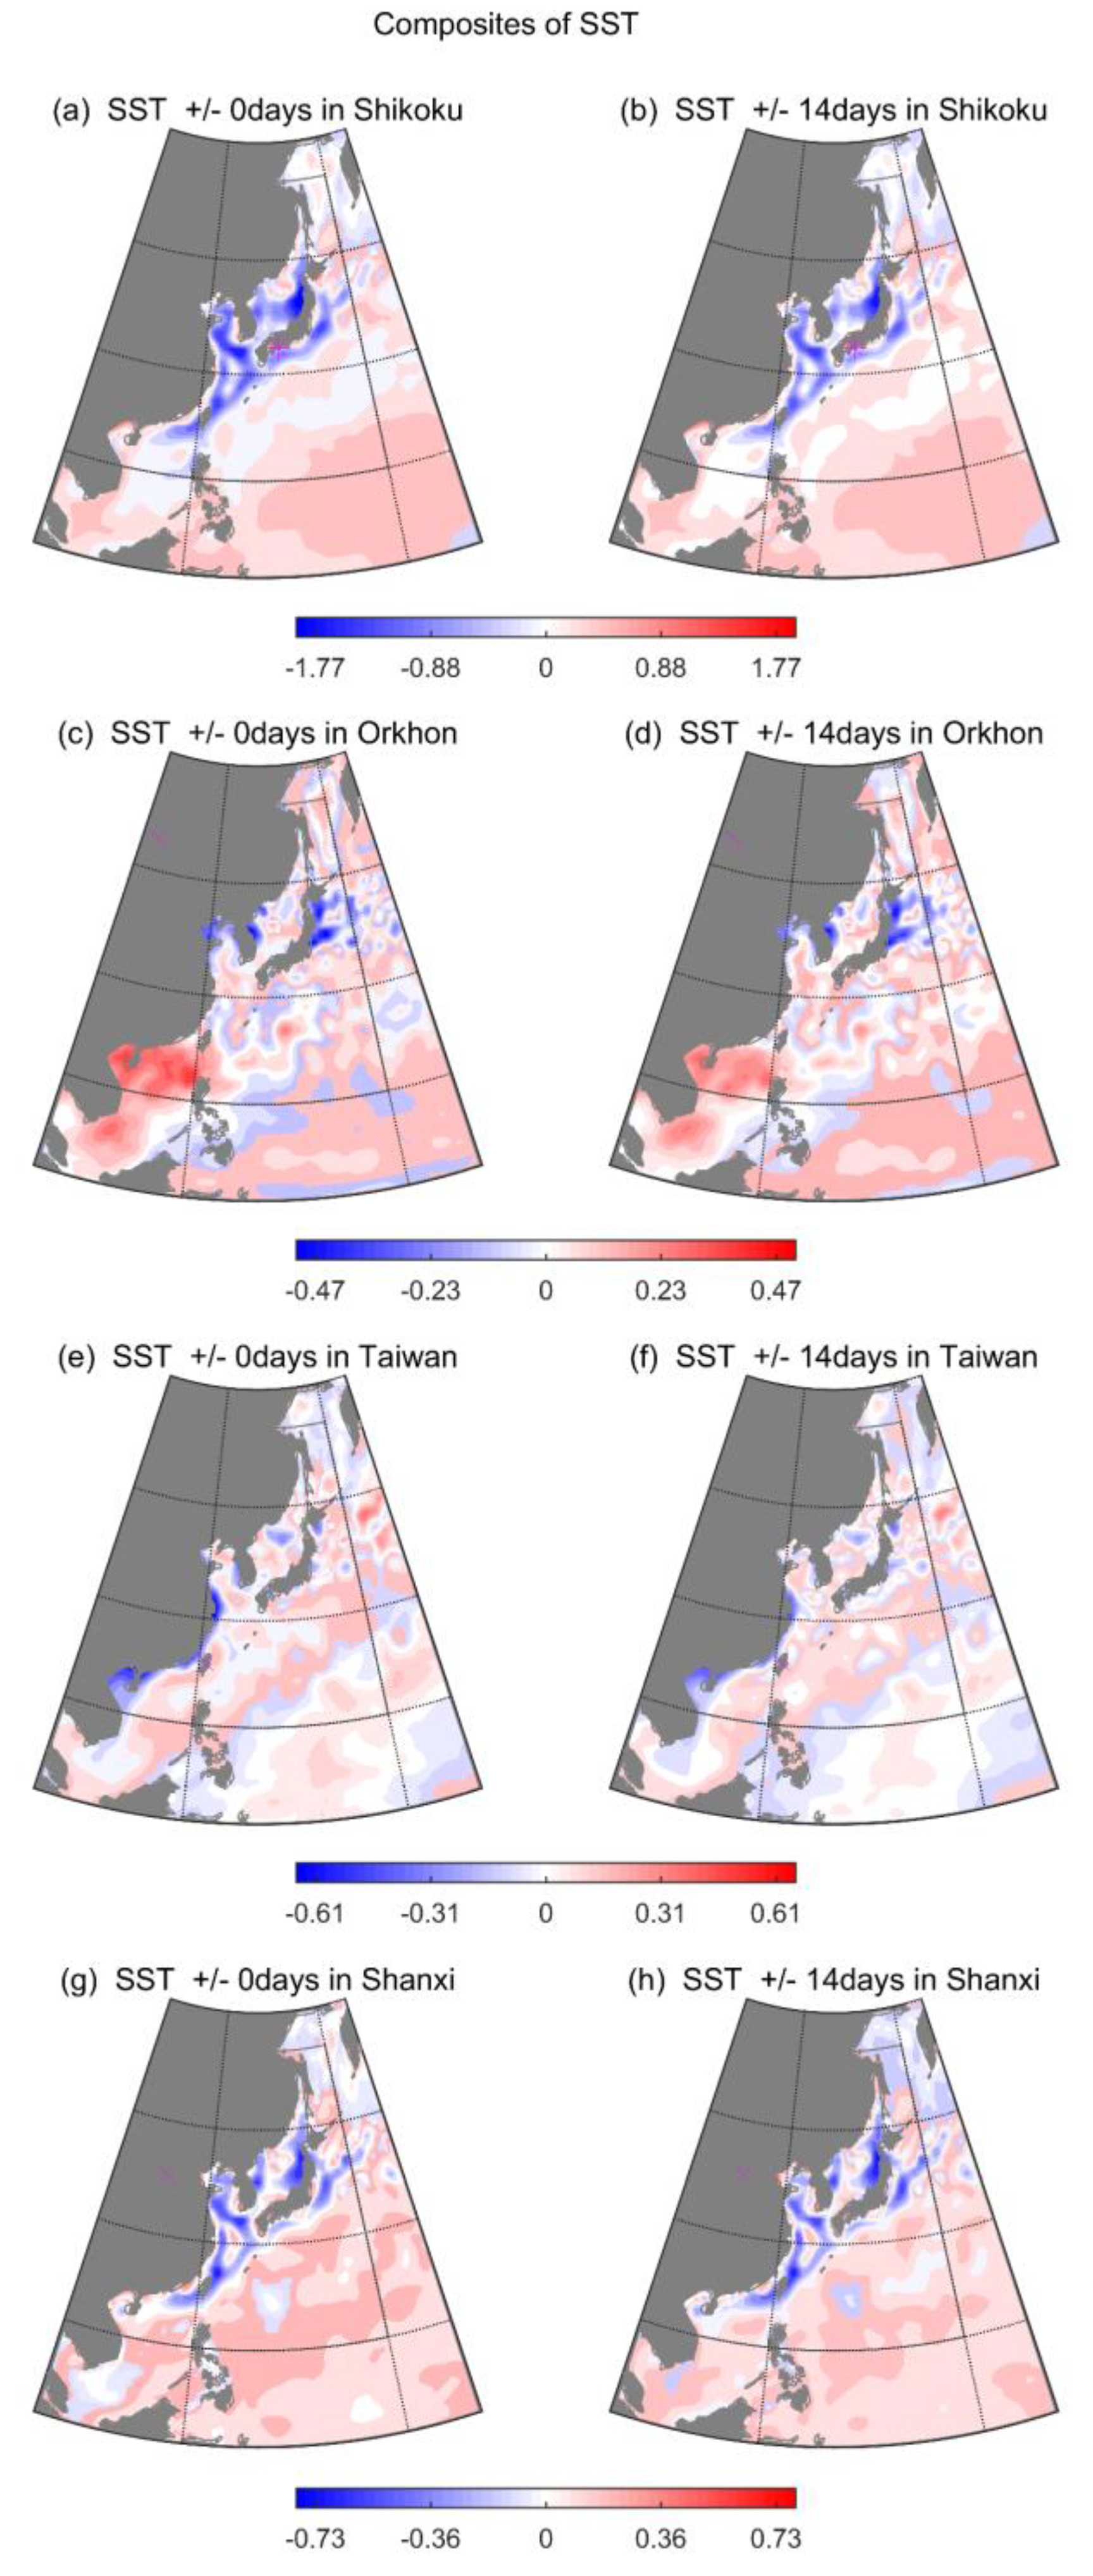
3.2.2. The Possible Formation Mechanisms of Cold Extremes for the Individual Cases

The composite analysis based on the Z500 anomalies is conducted to explore the relationship between the recurrent patterns and Tmin extremes depending on a different timescale. Figure 11 exhibits the anomalous Z500 composites for the extreme day, and 15 days including 7 days before and after the extreme day. Both cases of composite for the extreme day in Shikoku and Taiwan are identified with a strong cyclonic circulation downstream of the location as well as anticyclonic circulation upstream. This pattern is consistent with the wave train sign in the negative phase of WP. The composite of Orkhon presents the pronounced wave trains related to the AO-event. The wave trains also can be observed in the 15 day composites due to that the teleconnection usually lasting for multiple days. The composite of 15 days in Shikoku shows a significant difference with the composite of the extreme day. The cyclonic circulation becomes further elongated in the east–west direction and more closely resembles a typical WP-pattern (Figure 4b). Moreover, for the case of Orkhon, the AO-like pattern still persists strongly in the composite of Z500 anomalies with the 15 day period, even though the local atmospheric circulations are averaged out. That is indicative of that the local-synoptic patterns with the large-scale teleconnections triggering daily climate variability, whereas the large-scale patterns play a dominant role in the Tmin extremes for a longer period. In particular, the large-scale meteorological circulation is weakened evidently in the 15 day composites for Taiwan. The result suggests that the subtropical location is subjected more to local-synoptic systems than teleconnection patterns [21]. The composite for 15 days in Shanxi exhibits a similar change but the prevalent local weather events are primarily caused by the topography. Meanwhile, the anomalies in the composite for 15 days have a broader range compared to that for the extreme day.
The SST anomalies composites for the four locations are shown in Figure 12. There are few distinctions between the composites for the extreme day and 15-day periods, because large heat capacity in the ocean causes its stability [22]. The spatial distribution of SST anomaly in the case of Orkhon generally resembles that in an AO- event (Figure 5d). This SST pattern means that the frequency of extreme days in Orkhon could increase on the longer time scale under the influence of the SST anomalies in relation to the dominant pattern. For the case of Taiwan, the SST anomalies around the tropical Pacific are not evident as that in a typical La Niña event (Figure 5f). Meanwhile, the Shikoku case displays the contractive cold SST anomalies around the Kuroshio region (10° N–34° N, 120° E–150° E) and striking opposite signs over the western Pacific Warm Pool (0° N–15° N, 125° E–145° E) which differs from the SST anomalies in the negative phase of WP pattern (Figure 5b). The composite for Shanxi has some commonalities with the Shikoku, but with relatively weak strength.
In the composites for the extreme month (Figure 13), the Z500 anomalies in cases of Shikoku and Taiwan have a great similarity to the typical WP events but the former is closer than the latter. In Orkhon, the atmosphere circulation for the extreme month is identified with a more typical AO- pattern (Figure 4d) in comparison with that for the 15 days. The example of Shanxi shows the most significant area extension in its composite for the extreme month, in where the zonal negative Z500 anomalies spread from 60° E to the dateline. There are no commonalities with any teleconnections involved in this paper for Shanxi, which illustrates the less impact of these patterns on the temperature fluctuations in this location. Figure 14 depicts the SST anomaly composites at the same periods. It can be observed that the strong warm SST anomalies prevail over the western Pacific Warm Pool for the Taiwan case, which is a prominent feature during the phase of La Niña episode. Besides, the spatial distribution of SST anomalies resembles further that in the preferred phase of the dominant pattern for the case of Orkhon. The Shikoku and Shanxi cases exhibit the weak cold SST anomalies appear over the western Pacific Warm Pool, which resembles the WP- events plotted in Figure 5 but with the smaller area. Overall, the strength of SST anomalies is obviously increasing in the composites for the extreme month in comparison with the extreme day or 15 days. The results imply that the WP, AO and ENSO recurrent patterns have a closer association with the prevalence of extreme months than days.

4. Summary and Discussions

The effect of the large-scale teleconnection patterns on the temperature variability within East Asia during the boreal wintertime from 1979 to 2017 was examined in this study. The positive and negative phases were defined as when the index values falling at the upper and lower 25% of the indices distribution, respectively. In general, the WP and AO patterns could cause the pronounced warm and cold Tmin anomalies over almost the whole of East Asia. However, the Tmin anomalies in the ENSO events have characteristics of regional differences. The result was consistent with the previous findings [2,12,23,24].
A Monte Carlo method was used to identify quantitatively the relationship between these patterns and daily as well as monthly cold extremes. We found that the extreme days were primarily related to the negative phase of three patterns. Overall, the ENSO cycle exhibited a relatively weak effect on the cold extremes over East Asia in comparison with the WP and AO pattern. Wang and He [12] noted that the correlation between the Niño 3.4 index and the surface air temperature at 2 m over East Asia during the winter has reduced after the mid-70s. Li et al. [25] documented that the relationship between the EAWM and AO has strengthened since the 1980s. Moreover, Linkin and Nigam [26] considered that the North Pacific Oscillation pattern (NPO) in the sea level pressure field was related to the WP pattern in the mid-troposphere field. Yeh et al. [27] stated that the NPO was significantly enhanced after 1988. Those studies could explain the relatively weak effect of ENSO compared to WP and AO patterns. The spatial distribution of monthly cold extremes resembled that of daily cases but with a more scattered and smaller range because of the smaller sample size [20]. In particular, the extreme months were more significantly associated with the large-scale teleconnections due to that these patterns usually have a longer life cycle [2].
Sun et al. [15] pointed out that the turbulent heat flux (both sensible and latent heat fluxes) is strongly correlated with the SST variability over the southwestern North Pacific. This phenomenon implied that the warm SST anomalies at mid-latitudes could release energy into the atmosphere, which would augment (decrease) the temperature contrast at middle latitudes vs high latitudes (middle latitudes vs low latitudes). Correspondingly, the westerlies over the middle–high latitudes were stronger (weaker) than normal states based on the physical process of thermal wind. In consequence, the high-latitude (middle-latitude) region within East Asia was governed by an anticyclonic (cyclonic) circulation. In our study, the cold SST anomalies over the western North Pacific in the negative phase of WP and AO were favorable to the stability of cyclone at mid-latitudes. Hence, widespread negative Tmin anomalies and extremes appeared over most of the region within East Asia. Zhang, Sumi and Kimoto [10] showed that the anomalous SST pattern for an El Niño event was evident cold near the western Pacific Warm Pool. The cold SST anomalies around the equator suppressed the convective motion and enhanced subsidence of air due to the strong static stability of the lower layers of the atmosphere. Also, the cold SST anomalies could induce the equatorial Rossby wave. These factors contributed to the formation of a low-level anticyclone over the northern West Pacific together. Our study also exhibited a similar result but for the circulation system at the 500 hPa level. Besides, the dipole structure for SST anomalies in the West Pacific increased the temperature gradient at middle latitudes vs high latitudes and reduced the temperature gradient at middle latitudes vs low latitudes. This SST pattern could also favor to the sustainability of anticyclone. As a result, the coast of East Asia experienced relatively warm weather. However, the characteristics of the dipole for SST anomalies were not evident and have less effect on the persistence of cyclone in a La Niña event. That caused the asymmetry of climate states between the warm and cold ENSO events [28].
In addition, the composite analysis involved in Z500 and SST anomalies at individual regions on different time scales was performed to investigate the formation mechanism of Tmin anomalies. We found that the extreme days could be triggered by the synoptic-scale climate events with a smaller area, shorter duration and higher degree randomness other than teleconnections [21]. The phenomenon was indicative of that the teleconnections in combination with the synoptic-scale climate events determined together on the occurrence of the extreme days. Additionally, the subtropical and tropical areas were more subject to the synoptic-scale climate systems, while the large-scale recurrent patterns seemed to play a more important role in cold extremes in extratropical regions. Especially, since the teleconnections were more influential on the Tmin variability at the monthly time scale, the relationship between the large-scale recurrent patterns and extreme months was more prominent than extreme days.
The composite of SST anomalies at location primarily affected by the WP pattern was distinct from that in Figure 5b, while it has some commonalities with the Shanxi case that not subjected to any patterns involved in this study. Similarly, the case impacted by both WP and ENSO patterns exhibited the Z500 composite with a WP-event and SST composite with a La Niña event. Li and Wettstein [29] demonstrated that WP is a mid-latitude eddy-driven pattern. Tanaka et al. [30] claimed that the WP was maintained by available potential energy originated from the climatological-mean flow. In our study, the ambiguous connection between the WP pattern and SST anomalies maybe result from that the WP mainly is generated by the internal atmospheric mechanisms but less related to the oceanic process. In contrast, the ENSO cycle tended to reflect the oceanic states rather than atmospheric circulations [20]. This also led the ENSO cycle to present a less effect on the cold extremes over East Asia compared to the WP and AO pattern. On the other hand, recent studies reported that the ENSO events include two different types, EP (eastern-Pacific) and CP (central-Pacific). The CP ENSO was characterized by the SST anomalies in the tropical central Pacific, which evidently differed from the EP ENSO. The distinction of spatial distribution in SST anomalies for two types of ENSO could result in the occurrence of completely different climate events [31,32,33,34]. For instance, Feng et al. [31] found that the EP ENSO favored the positive precipitation anomalies over South China and negative precipitation anomalies around the Philippines and Indonesia during the wintertime, whereas the CP ENSO was related to the relatively weak dry and further northward anomalies over the Philippines. Hence, not classifying for the ENSO event may also cause its relatively weak association with the Tmin extremes in our work.
The study presented here has given insight into the relationship between the large-scale teleconnections and the cold extremes over East Asia during the boreal winter. However, the air–sea interaction mechanism involved in our paper is relatively rough and simple because of the uncertainty and complexity in the coupled systems. Hence, the further exploration of the role of the atmospheric and oceanic processes on climate variability will be our subject of forthcoming research.

Author Contributions

Conceptualization, Y.Y.; Data curation, N.X.; Funding acquisition, M.G.; Investigation, Y.Y.; Methodology, Y.Y.; Project administration, M.G.; Resources, Y.Y.; Software, Y.Y.; Supervision, M.G.; Visualization, Y.Y.; Writing—review & editing, Y.Y. and N.X.

Funding

This work was partly supported by the Youth Innovation Promotion Association of CAS (2016195), the Key Research Program of Frontier Science of Chinese Academy of Sciences (No. ZDBS-LY-7010), the Key Research Program of Center for Ocean Mega-Science CAS (No. COMS2019J02) and the National Natural Science Foundation of China (31570423).

Conflicts of Interest

The authors declare no conflict of interest.

References

  1. Barnston, A.G.; Livezey, R.E. Classification, seasonality and persistence of low-frequency atmospheric circulation patterns. Mon. Weather Rev. 1987, 115, 1083–1126. [Google Scholar] [CrossRef]
  2. Lim, Y.-K.; Kim, H.-D. Impact of the dominant large-scale teleconnections on winter temperature variability over East Asia. J. Geophys. Res. Atmos. 2013, 118, 7835–7848. [Google Scholar] [CrossRef] [Green Version]
  3. Yuan, J.; Tan, B.; Feldstein, S.B.; Lee, S. Wintertime North Pacific teleconnection patterns: Seasonal and interannual variability. J. Clim. 2015, 28, 8247–8263. [Google Scholar] [CrossRef] [Green Version]
  4. Harzallah, A.; Sadourny, R. Internal versus SST-forced atmospheric variability as simulated by an atmospheric general-circulation model. J. Clim. 1995, 8, 474–495. [Google Scholar] [CrossRef] [Green Version]
  5. Tan, B.; Chen, W. Progress in the study of the dynamics of extratropical atmospheric teleconnection patterns and their impacts on East Asian climate. Acta Meteorol. Sin. 2014, 72, 908–925. [Google Scholar] [CrossRef]
  6. Wallace, J.M.; Gutzler, D.S. Teleconnections in the geopotential height field during the northern hemisphere winter. Mon. Weather Rev. 1981, 109, 784–812. [Google Scholar] [CrossRef]
  7. Park, H.-J.; Ahn, J.-B. Combined effect of the Arctic Oscillation and the Western Pacific Pattern on East Asia winter temperature. Clim. Dyn. 2016, 46, 3205–3221. [Google Scholar] [CrossRef] [Green Version]
  8. Gong, D.Y.; Wang, S.W.; Zhu, J.H. East Asian winter monsoon and Arctic Oscillation. Geophys. Res. Lett. 2001, 28, 2073–2076. [Google Scholar] [CrossRef]
  9. Chen, W.; Lan, X.; Wang, L.; Ma, Y. The combined effects of the ENSO and the Arctic Oscillation on the winter climate anomalies in East Asia. Chin. Sci. Bull. 2013, 58, 1355–1362. [Google Scholar] [CrossRef] [Green Version]
  10. Zhang, R.H.; Sumi, A.; Kimoto, M. Impact of El Nino on the East Asian monsoon: A diagnostic study of the 86/87 and 91/92 events. J. Meteorol. Soc. Jpn. 1996, 74, 49–62. [Google Scholar] [CrossRef] [Green Version]
  11. Wang, S.; Huang, J.; He, Y.; Guan, Y. Combined effects of the Pacific Decadal Oscillation and El Nino-Southern Oscillation on global land dry-wet changes. Sci. Rep. 2014, 4, 6651. [Google Scholar] [CrossRef] [Green Version]
  12. Wang, H.; He, S. Weakening relationship between East Asian winter monsoon and ENSO after mid-1970s. Chin. Sci. Bull. 2012, 57, 3535–3540. [Google Scholar] [CrossRef] [Green Version]
  13. Liu, Y.; Wang, L.; Zhou, W.; Chen, W. Three Eurasian teleconnection patterns: Spatial structures, temporal variability, and associated winter climate anomalies. Clim. Dyn. 2014, 42, 2817–2839. [Google Scholar] [CrossRef]
  14. Sun, Y.; Xu, H.; Deng, J. Interdecadal variation in Pacific-Japan teleconnection patterns and possible causes. J. Atmos. Sci. 2014, 38, 1055–1065. [Google Scholar]
  15. Sun, J.; Wu, S.; Ao, J. Role of the North Pacific sea surface temperature in the East Asian winter monsoon decadal variability. Clim. Dyn. 2016, 46, 3793–3805. [Google Scholar] [CrossRef] [Green Version]
  16. Chen, S.; Chen, W.; Wei, K. Recent trends in winter temperature extremes in eastern China and their relationship with the Arctic Oscillation and ENSO. Adv. Atmos. Sci. 2013, 30, 1712–1724. [Google Scholar] [CrossRef]
  17. Huang, R.; Chen, J.; Wang, L.; Lin, Z. Characteristics, processes, and causes of the spatio-temporal variabilities of the East Asian monsoon system. Adv. Atmos. Sci. 2012, 29, 910–942. [Google Scholar] [CrossRef]
  18. Loikith, P.C.; Broccoli, A.J. Characteristics of observed atmospheric circulation patterns associated with temperature extremes over North America. J. Clim. 2012, 25, 7266–7281. [Google Scholar] [CrossRef]
  19. Hsu, H.H.; Chen, Y.L.; Kau, W.S. Effects of atmosphere-ocean interaction on the interannual variability of winter temperature in Taiwan and East Asia. Clim. Dyn. 2001, 17, 305–316. [Google Scholar] [CrossRef]
  20. Loikith, P.C.; Broccoli, A.J. The influence of recurrent modes of climate variability on the occurrence of winter and summer extreme temperatures over North America. J. Clim. 2014, 27, 1600–1618. [Google Scholar] [CrossRef]
  21. Zhu, Q.; Lin, J.; Shou, S.; Tang, D. Principles and Methods of Meteorology; China Meteorological Press: Beijing, China, 2000. [Google Scholar]
  22. Frankignoul, C. Sea surface temperature anamalies, planetary waves, and air-sea feedback in the middle latitudes. Rev. Geophys. 1985, 23, 357–390. [Google Scholar] [CrossRef]
  23. Li, Y.; He, J.; Jiang, A.; Zhou, B. Circulation structure features of Western Pacific teleconnection pattern in winter and its relation with China’s temperature and precipitation in winter. J. Meteorol. Sci. 2007, 27, 119–125. [Google Scholar]
  24. Wu, B.Y.; Wang, J. Winter Arctic Oscillation, Siberian High and East Asian winter monsoon. Geophys. Res. Lett. 2002, 29. [Google Scholar] [CrossRef]
  25. Li, F.; Wang, H.J.; Gao, Y.Q. On the strengthened relationship between the East Asian winter monsoon and Arctic Oscillation: A comparison of 1950-70 and 1983-2012. J. Clim. 2014, 27, 5075–5091. [Google Scholar] [CrossRef]
  26. Linkin, M.E.; Nigam, S. The North Pacific Oscillation-West Pacific teleconnection pattern: Mature-phase structure and winter impacts. J. Clim. 2008, 21, 1979–1997. [Google Scholar] [CrossRef]
  27. Yeh, S.-W.; Kang, Y.-J.; Noh, Y.; Miller, A.J. The North Pacific climate transitions of the winters of 1976/77 and 1988/89. J. Clim. 2011, 24, 1170–1183. [Google Scholar] [CrossRef]
  28. Xu, P.; Feng, J.; Chen, W. Asymmetric role of ENSO in the link between the East Asian winter monsoon and the following summer monsoon. J. Atmos. Sci. 2016, 40, 831–840. [Google Scholar]
  29. Li, C.; Wettstein, J.J. Thermally driven and eddy-driven jet variability in reanalysis. J. Clim. 2012, 25, 1587–1596. [Google Scholar] [CrossRef]
  30. Tanaka, S.; Nishii, K.; Nakamura, H. Vertical structure and energetics of the western pacific teleconnection pattern. J. Clim. 2016, 29, 6597–6616. [Google Scholar] [CrossRef]
  31. Feng, J.; Chen, W.; Li, Y. Asymmetry of the winter extra-tropical teleconnections in the northern hemisphere associated with two types of ENSO. Clim. Dyn. 2017, 48, 2135–2151. [Google Scholar] [CrossRef] [Green Version]
  32. Feng, J.; Chen, W.; Tam, C.Y.; Zhou, W. Different impacts of El Nino and El Nino Modoki on China rainfall in the decaying phases. Int. J. Climatol. 2011, 31, 2091–2101. [Google Scholar] [CrossRef]
  33. Feng, J.A.; Wang, L.; Chen, W.; Fong, S.K.; Leong, K.C. Different impacts of two types of Pacific Ocean warming on Southeast Asian rainfall during boreal winter. J. Geophys. Res. Atmos. 2010, 115. [Google Scholar] [CrossRef]
  34. Yang, S.; Jiang, X.W. Prediction of eastern and central Pacific ENSO events and their impacts on East Asian climate by the NCEP climate forecast system. J. Clim. 2014, 27, 4451–4472. [Google Scholar] [CrossRef]
Figure 1. Minimum surface air temperature (Tmin) anomalies (red and blue shading) over East Asia during the winter months from 1979 to 2017 in dependence of the strong positive or negative phase of teleconnections: (a,b) for Western Pacific pattern (WP) patterns; (c,d) for Arctic Oscillation (AO) patterns; (e,f) for El Niño-Southern Oscillation (ENSO) patterns. The grids with dots indicate the values lower than the 0.2 quantile or higher than the 0.8 quantile.
Atmosphere 10 00813 g001
Figure 2. The percentage of daily cold extremes in dependence of the strong positive or negative phase of teleconnections: (a,b) for WP patterns; (c,d) for AO patterns; (e,f) for ENSO patterns. Shaded grids with blue are significantly higher than expected chance (25%) at a 95% confidence level for percentages. The grids with dots indicate the values higher than 35%.
Atmosphere 10 00813 g002
Figure 3. Same as Figure 2, but for monthly cold extremes.
Atmosphere 10 00813 g003
Figure 4. Geopotential height anomalies at the 500 hPa level (red and blue shading) around East Asia in winter months from 1979 to 2017 in dependence of the strong positive or negative phase of teleconnections: (a,b) for WP patterns; (c,d) for AO patterns; (e,f) for ENSO patterns. The boundary and location of the cyclones and anticyclones are visualized by the zonal and meridional wind anomalies (green vectors) at 500 hPa level.
Atmosphere 10 00813 g004
Figure 5. Same as Figure 4, but for sea surface temperature (SST) anomalies in winter months.
Atmosphere 10 00813 g005
Figure 6. Scatterplots between the daily Tmin anomalies and teleconnection indices values for the individual cases: (a,e,i) for Shikoku during the negative phase of WP, AO and ENSO, respectively; (b,f,j) same as a, e, j, but for Orkhon; (c,g,k) same as a, e, j, but for Taiwan; (d,h,l) same as a, e, j, but for Shanxi. The scatterplots on the left side of the vertical red line represent the values at the lower 10% of the Tmin anomalies distribution. The horizontal blue lines present the upper and lower quartile of the teleconnection indices, respectively. The top-right-corner values from left to right represent separately the percentage of extreme days in the positive, normal and negative phases of modes.
Atmosphere 10 00813 g006
Figure 7. Same as Figure 6, but for monthly Tmin anomalies.
Atmosphere 10 00813 g007
Figure 8. Time series of yearly teleconnection indices during winter of 1979–2017: (a) for WP; (b) for AO; (c) for ENSO. The blue and red lines present the raw sequence and its nine-year smooth result respectively.
Atmosphere 10 00813 g008
Figure 9. Time series of year-average extreme cold days during winter of 1979–2017: (a) for Shikoku; (b) for Orkhon; (c) for Taiwan; (d) for Shanxi. The blue and red lines present the raw sequence and its nine-year smooth result respectively. The top-right-corner values from left to right display the p-values on correlations between the number of extreme days and WP, AO and ENSO teleconnection indices on the interannual (the first row) and interdecadal (the second row) timescale, respectively.
Atmosphere 10 00813 g009
Figure 10. Same as Figure 9, but for extreme cold months.
Atmosphere 10 00813 g010
Figure 11. Composite maps of winter geopotential height anomalies at the 500 hPa level for the extreme day (the left column), and 15 days including 7 days before and after the extreme day (the right column) in the four locations (labeled by magenta stars): (a,b) for Shikoku; (c,d) for Orkhon; (e,f) for Taiwan; (g,h) for Shanxi.
Atmosphere 10 00813 g011
Figure 12. Same as Figure 11, but for SST anomalies with the extreme day and 15 days including 7 days before and after the extreme day.
Atmosphere 10 00813 g012
Figure 13. Same as Figure 11, but for Z500 anomalies with the extreme month.
Atmosphere 10 00813 g013
Figure 14. Same as Figure 12, but for SST anomalies with the extreme month.
Atmosphere 10 00813 g014

