Article

Evaluation of Near-Surface Wind Speed Changes during 1979 to 2011 over China Based on Five Reanalysis Datasets

1
Key Laboratory of Meteorological Disaster of Ministry of Education, Joint International Research Laboratory of Climate and Environment Change, Collaborative Innovation Center on Forecast and Evaluation of Meteorological Disaster, Nanjing University of Information Science and Technology, Nanjing 210044, China
2
State Key Laboratory of Numerical Modeling for Atmospheric Sciences and Geophysical Fluid Dynamics (LASG), Institute of Atmospheric Physics, Chinese Academy of Sciences, Beijing 100029, China
3
CAS Center for Excellence in Tibetan Plateau Earth Sciences, Chinese Academy of Sciences (CAS), Beijing 100101, China
4
University of Chinese Academy of Sciences, Beijing 100049, China
*
Author to whom correspondence should be addressed.
Atmosphere 2019, 10(12), 804; https://doi.org/10.3390/atmos10120804
Submission received: 3 November 2019 / Revised: 1 December 2019 / Accepted: 2 December 2019 / Published: 12 December 2019
(This article belongs to the Section Meteorology)

Abstract

:
Wind speed data derived from reanalysis datasets has been used in the plan and design of wind farms in China, but the quality of these kinds of data over China remains unknown. In this study, the performances of five sets of reanalysis data, including National Centers for Environmental Predictions (NCEP)-U.S. Department of Energy (DOE) Reanalysis 2 (NCEP-2), Modern-ERA Retrospective Analysis for Research and Applications (MERRA), Japanese 55-year Reanalysis Project (JRA-55), Interim ECMWF Re-Analysis product (ERA-Interim), and 20th Century Reanalysis (20CR) in reproducing the climatology, interannual variation, and long-term trend of near-surface (10 m above ground) wind speed, for the period of 1979–2011 over continental China are comprehensively evaluated. Compared to the gridded data compiled from meteorological stations, all five reanalysis datasets reasonably reproduce the spatial distribution of the climatology of near-surface wind speed, but underestimate the intensity of the near-surface wind speed in most regions except for Tibetan Plateau where the wind speed is overestimated. All five reanalysis datasets show large weaknesses in reproducing the annual cycle of near-surface wind speed averaged over the continental China. The near-surface wind speed derived from the observations exhibit significant decreasing trends over most parts of continental China during 1979 to 2011. Although the spatial patterns of the linear trends reproduced by reanalysis datasets are close to the observation, the magnitudes are weaker in annual, spring, summer and autumn season. The qualities of all reanalysis datasets are limited in winter. For the interannual variability, except for winter, all five reanalysis datasets reasonably reproduce the interannual standard deviation but with larger amplitude. Quantitative comparison indicates that among the five reanalysis datasets, the MERRA (JRA-55) shows the relatively highest (lowest) skill in terms of the climatology and linear trend. These results call for emergent needs for developing high quality reanalysis data that can be used in wind resource assessment and planning.

1. Introduction

Wind energy, as a visible renewable energy resource, has attracted much attention in the recent decades. Wind power has been the fastest growing energy technology in the world for the last decades [1,2]. Development of wind farms has been regarded as a useful way for the mitigation to global warming caused by burning fossil fuels for energy. Investigation of near-surface wind changes is of crucial importance to the development of wind powers.
The near-surface wind speed show multi-scale changes and great efforts has been devoted to the study of near-surface wind speed change by the climate research community in recent years [3,4,5,6]. Observations indicate that many regions have been suffering a long-term decreasing trend in annual mean near-surface wind speed during the past few decades [7,8]. For example, in the United States, the mean annual 10 m (10 m above ground) wind speed decreased significantly over past 30–50 years, based on the data from 1300 stations over the contiguous USA [9]. In contrast, the monthly maximum winds are increasing, and monthly minima are decreasing within the United States during 1961–1990 [10]. The declining trends of the mean annual 10 m wind speeds over past 30–50 years are also found in Canada, Europe, Asia and North Africa [2,8,11,12,13,14,15]. In contrast, the annual mean 10 m wind speeds experience increasing trends in Nigeria [16], Australia [17] and Antarctica [18].
In China, the annual mean 10 m wind speeds generally exhibited a significant decreasing trend over the period of 1960 to 2009, based on meteorological stations data [19,20,21]. The linear trends of 10m wind speeds show regional differences in China. For example, the 10 m wind speeds show a weak increasing trend over the period of 1960 to 2009 in coastal area and Sichuan Basin (~30° N, 103° E). The dramatic decreasing trends are mainly evident in northwest China, northeast China, northern China and other areas [22]. The magnitudes of decreasing trends of wind speed are seasonal-dependent, with larger magnitude in cold seasons (spring and winter) but weaker magnitude in warm seasons (summer and autumn) [15,23].
Reanalysis datasets have been widely used in various climate studies because of their spatial and temporal continuity [24,25,26,27]. The reanalysis datasets have also been used in the investigation on wind energy. The daily wind speed at 80 m (80 m above ground) derived from the 30-year wind records from the North American Regional Reanalysis (NARR) show the large seasonal variability and interannual variability with the largest values in winter months and smallest values in summer months over Great Lakes region of the United States [28]. In addition, the daily maximum wind speeds derived from the National Centers for Environmental Prediction-National Center for Atmospheric Research (NCEP-NCAR) reanalysis data have shown increasing trend over the ocean in winter but weakening trend over continental Europe in summer between 1958 and 1998 over the region 47.5–65° N and 12.5W–22.5° E [6,28]. The CFS (Climate Forecast System) reanalysis data shows significant uncertainties and biases relative to measured wind speeds in U.S. Great Plains, such as their underestimation of wind at high elevations, at high measurement heights, and in unstable atmospheric conditions [29]. Over the offshore areas, the high-resolution simulation wind data is most similar to Advanced SCATteromete (ASCAT) [30]. A comparison of three sets of reanalysis data, including the NCEP-NCAR, NCEP-U.S. Department of Energy (DOE), and 40-year European Centre for Medium-Range Weather Forecasts (ECMWF) Re-Analysis (ERA-40), with the near-surface measurements of wind speeds found that the reanalysis datasets failed in reproducing the stilling trends observed at Australian stations [31]. Worldwide, the ERA-40 is better than JRA-55 and NECP-2 in reproducing the wave energy and they show best agreement in northern winter [32]. Compared to the ASCAT, the ERA5 and ERA-Interim show the similar spatial distributions and the spatial error patterns of annual mean wind over ocean, but ERA5 reduce the error in amplitude [33]. However, in Ellsworth Land Region, both ERA5 and ERA-Interim could reasonable reproduce the observation of mean wind speeds, and ERA-interim shows a smaller deviation than ERA5, especially in the coastal area [34]. In the Saskatchewan Prairies, the ERA5 and ERA-Interim have a negative wind speed bias in warm and cold season, and the ERA5 is slightly worse than ERA-Interim in warm season [35]. In Portugal, the ERA-Interim, MERRA, NCEP Climate Forecast System Reanalysis (NCEP-CFSR), NCEP Global Forecast System (NCEP-GFS), and NCEP FNL (Final) Operational Global Analysis (NCEP-FNL) data could provide a considerable improvement in wind simulation when compared to NCEP-2 and the ERA-Interim is the best one that could reasonable reproduce observed data [36].
In contrast to the efforts devoted to the study of wind speed changes over the world, our knowledge on the performance of the reanalysis data in measuring the near-surface wind speed changes over China is quite limited [37]. In this paper, we aim to provide a comprehensive evaluation on the performances of five sets of reanalysis data including NCEP-U.S. Department of Energy (DOE) Reanalysis 2 (NCEP-2), Modern-ERA Retrospective Analysis for Research and Applications (MERRA), Japanese 55-year Reanalysis Project (JRA-55), Interim ECMWF Re-Analysis product (ERA-Interim), and 20th Century Reanalysis (20CR) in reproducing the climatology, interannual variation, and long-term trends of near-surface wind speed over contiguous China. In our knowledge, this is the first endeavor of the Chinese climate research community devoted to such a comprehensive assessment.
Here, we use ERA-Interim instead of ERA5, because ERA-Interim and ERA5 show similar ability to reproduce wind speed and sometimes ERA-Interim is better than ERA5 based on the previous studies [33,34,35]. Compared to the ERA-Interim, ERA5 show a little improvement in reproducing wind over land [34,35], and ERA-Interim show best performance in wind speed [36]. In addition, ERA-Interim have a good ability in reproducing the temperature and precipitation over mainland China [38], but its performance in reproducing the near-surface wind is not clear.
The remainder of this paper is organized as follows. Section 2 describes the observational and reanalysis datasets and analysis method. In Section 3, the main results are presented, including climatology, linear trend, and interannual variability of 10 m wind speeds. The concluding remarks are presented in Section 4.

2. Data and Method

2.1. Data Description

The observation data is the monthly mean 10 m wind speed gridded observation dataset during 1979–2011 produced by National Climate Center (CN05.1). This is constructed by the “anomaly approach” during the interpolation but with more station observations (about 2400 stations) in China [39,40]. In the “anomaly approach”, a gridded climatology is first calculated, and then a gridded daily anomaly is added to the climatology to obtain the final dataset.
The monthly mean 10 m wind speed derived from the following five reanalysis datasets is used: (1) NCEP-U.S. Department of Energy (DOE) Reanalysis 2 (NCEP-2), which is an improved version of NCEP-1 [41]. (2) Modern-ERA Retrospective Analysis for Research and Applications (MERRA), which is a NASA reanalysis for the satellite era using a major new version of the Goddard Earth Observing System Data Assimilation System Version 5 (GEOS-5) [42]. (3) Japanese 55-year Reanalysis Project (JRA-55) [43]. (4) Interim ECMWF Re-Analysis product (ERA-Interim), which is to improve on certain key aspects of ERA-40 [44]. (5) The 20th Century Reanalysis (20CR) [45]. Detailed information of the five reanalysis datasets is presented in Table 1.
All datasets are bilinearly interpolated onto a common 1.25 by 1.25 grid. The reanalysis datasets from January 1979 to December 2011 are evaluated against the observation in this study.

2.2. Analysis Method

The ordinary linear trend analysis, regressed on time, is used to reveal the trend of 10m wind speeds. This method has been used in many studies to detect the yearly changes (i.e., linear trend) which are calculated by ordinary least squares (OLS) method. The Student’s t-test [46,47] is used to detect whether the linear trend is statistically significant. In addition, pattern correlation coefficient (PCC) and root-mean-square error (RMSE) are used to measure whether the reanalysis datasets are consistent with the observation.

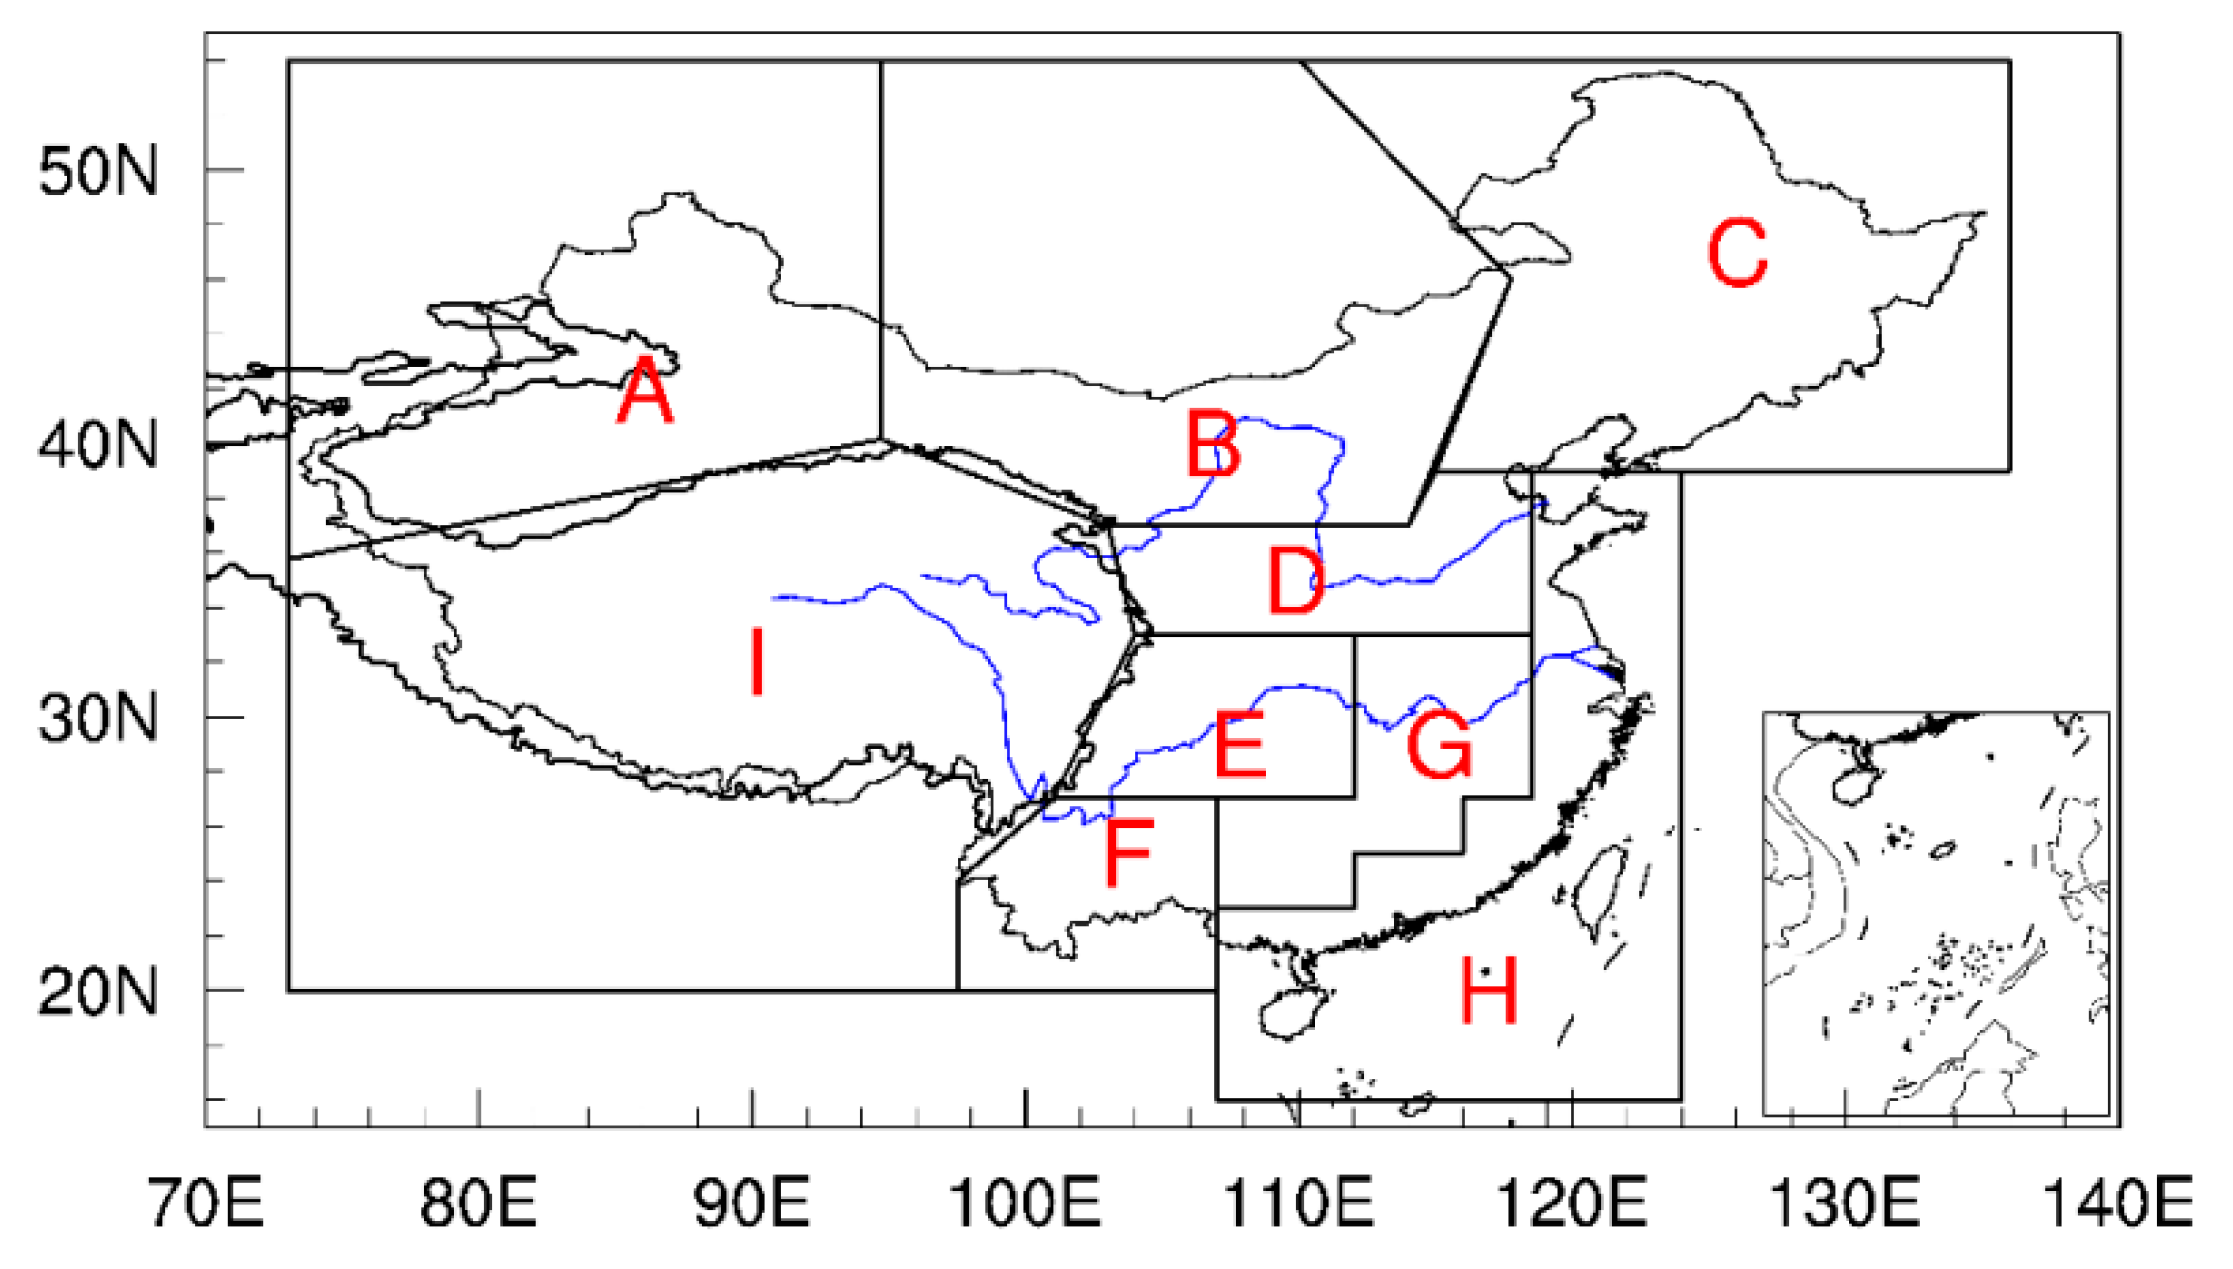
2.3. Division of Subregions in China

Wind speed show distinct regional characteristic [48]. Due to effect of certain climate systems, such as East Asian monsoon system and complex topography in China, the mean annual near-surface wind speed exhibits the maximum values in the northwest, northern, and coastal area and the minimum values in the Sichuan Basin [15]. In this study, nine subregions (Figure 1) were defined to investigate the characteristics of regional changes in wind speed based on climate features, topography, and wind resource.

3. Results

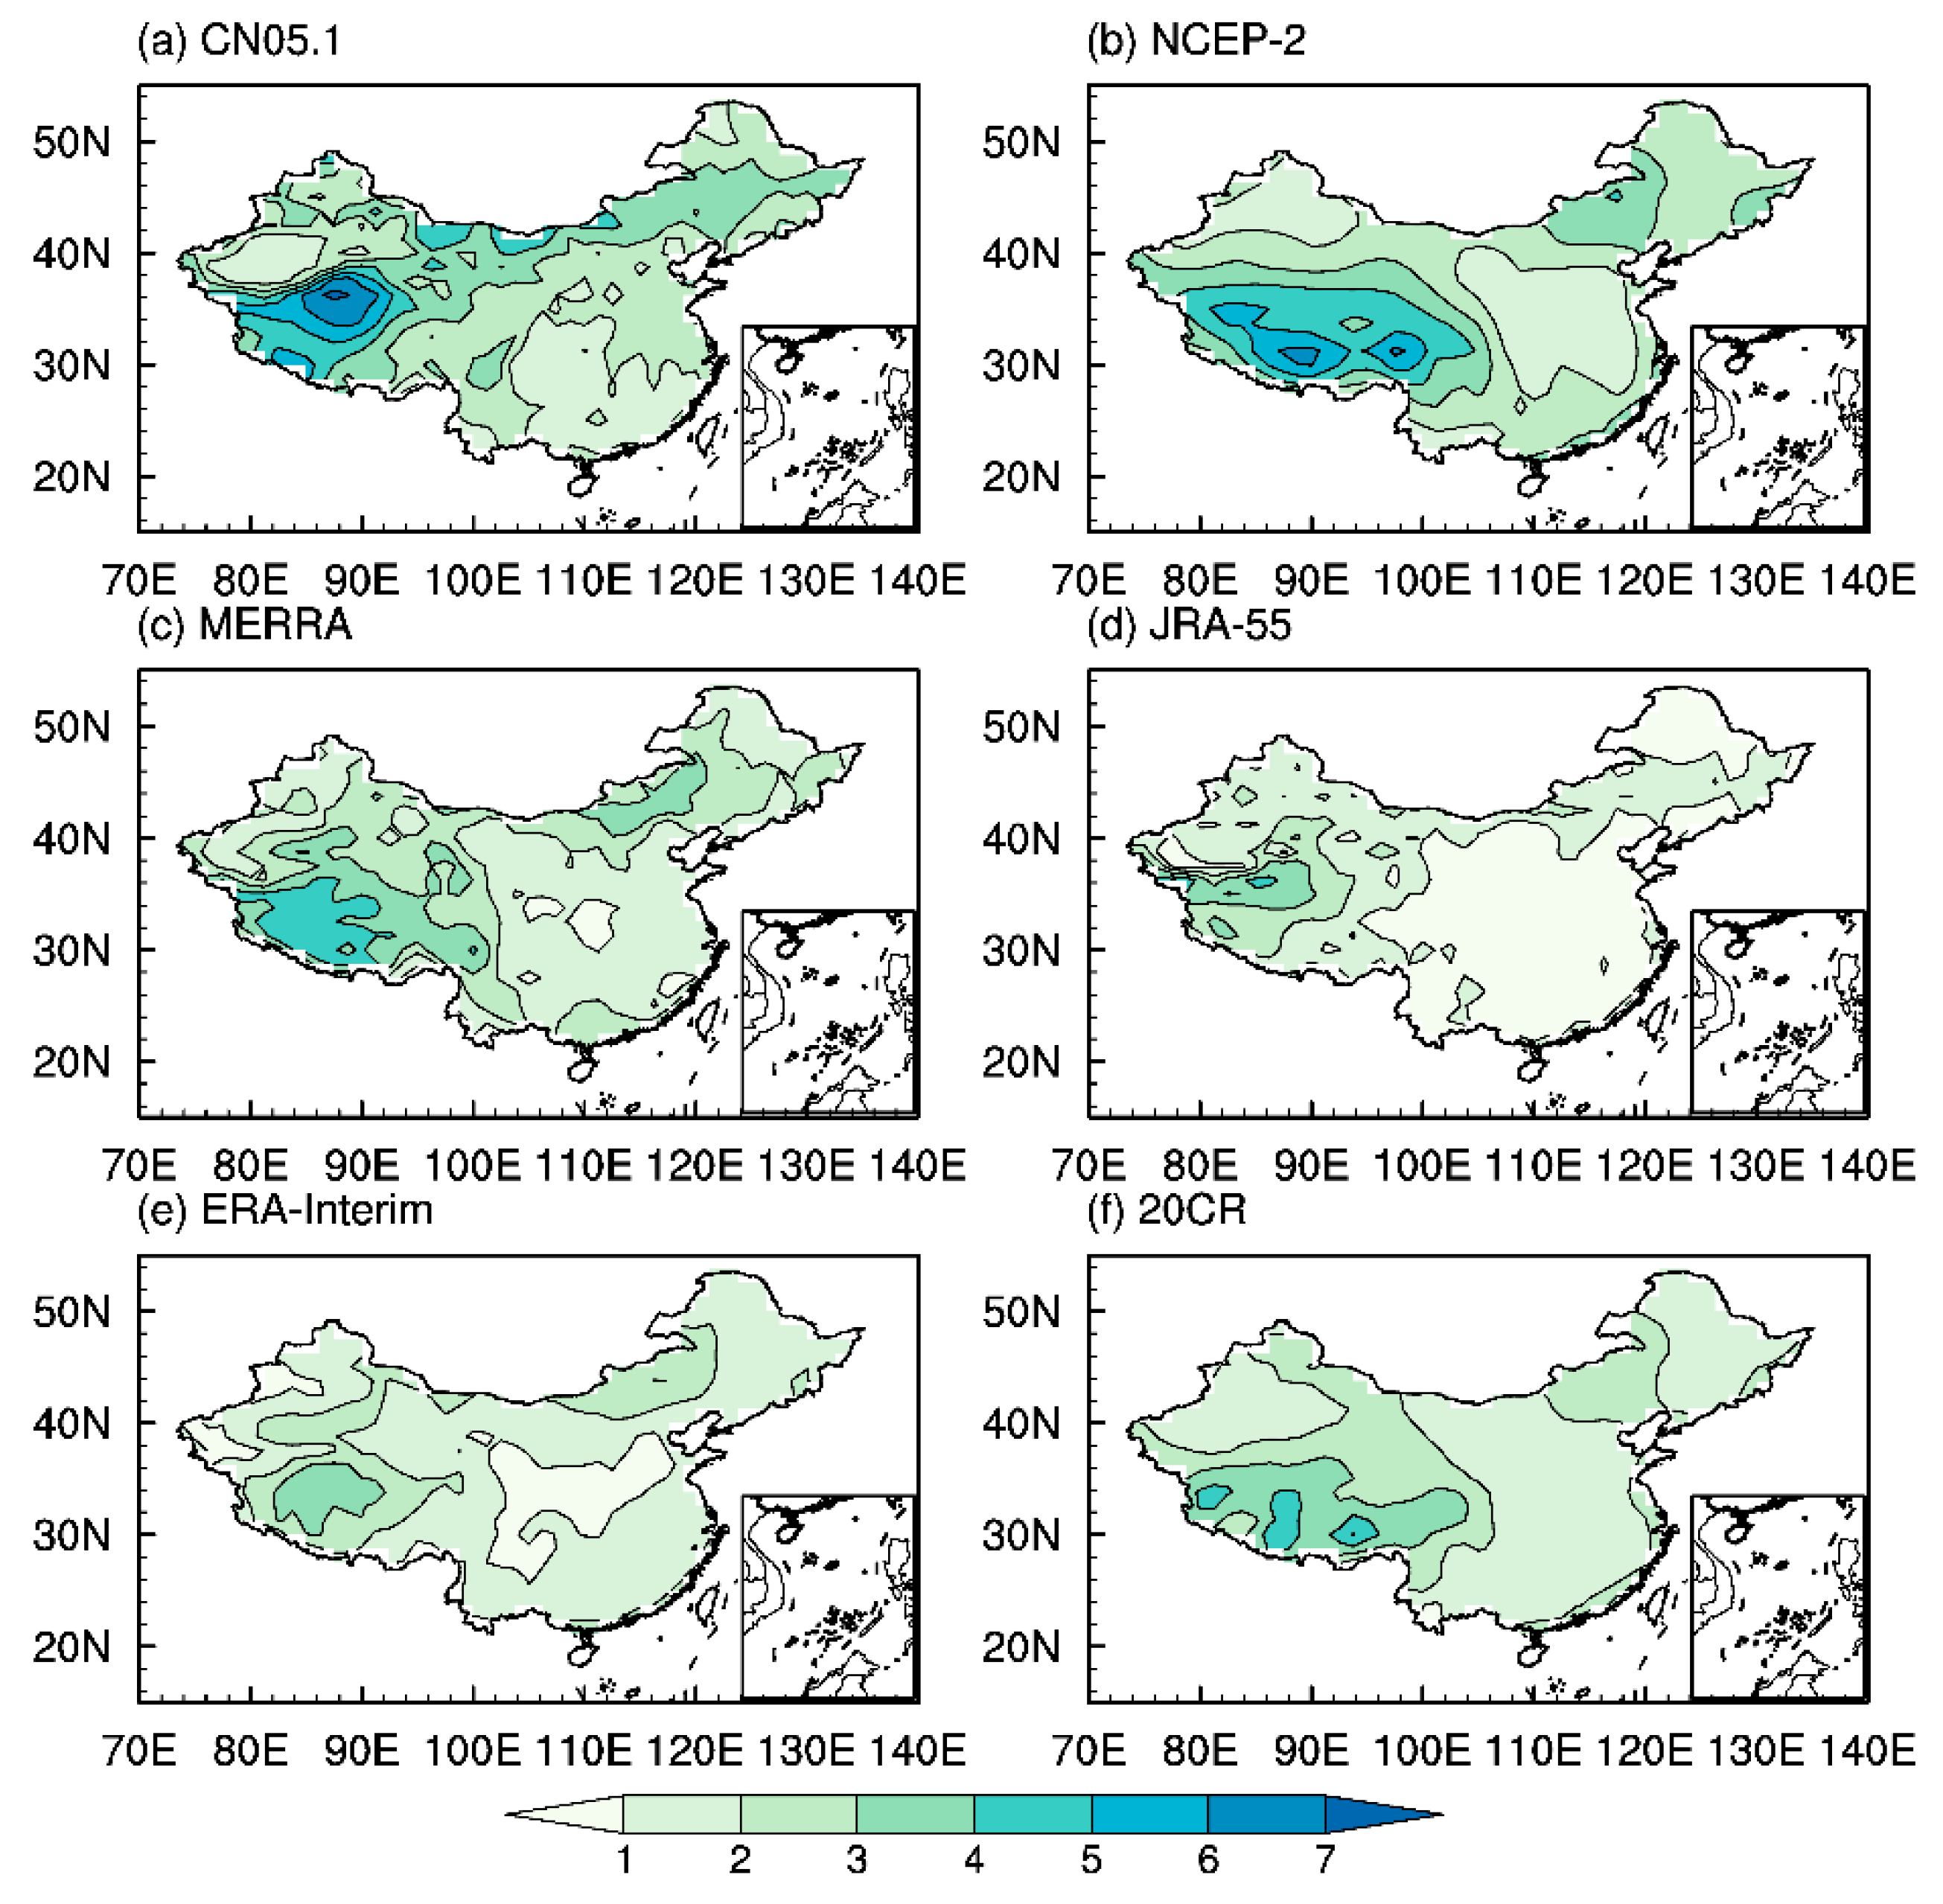
3.1. Climate Mean States of Near-Surface Wind Speed

The spatial pattern of 33 year averaged near-surface wind speeds derived from both reanalysis dataset and observation are shown in Figure 1. The quality of reanalysis datasets is measured by PCC and RMSE with reference to the observation. In the observational data CN05.1 (Figure 2a), the values of the mean annual near-surface wind speed vary between 1.0 and 7.0 m·s−1 across the entire continental China. The observation shows large values in the Inner Mongolia, the north of Xinjiang in the northwestern China and Tibetan Plateau, but low values in Sichuan Basin. Both MERRA and JRA-55 data can reproduce the maximum regions in the Inner Mongolia and the northern Xinjiang, while the others show weaknesses in reproducing the observed pattern. The mean annual near-surface wind speeds over Greater Khingan Range (~45° N, 115–122° E) and southern Tibetan Plateau are overestimated in five reanalysis. It should be noted that the mean annual near-surface wind speeds are ~1.0–2.0 m·s−1 less than observation over most area in all reanalysis datasets and greater than observation in main body of Tibetan Plateau in NCEP-2, MERRA, and 20CR and northwestern Tibetan Plateau in JRA-55 and ERA-Interim. It is ~1.0–3.0 m·s−1 greater than observation across the entire Tibetan Plateau, the south of Yangtze River (~30° N, 110–120° E), and Greater Khingan Mountains, whereas the northern Inner Mongolia and northern Xinjiang see an underestimation of near-surface wind speed.
The results of four seasons are also compared (see figures in Supplementary Material). The spatial distributions of mean spring (MAM), summer (JJA), autumn (SON), and winter (DJF) near-surface wind speeds are similar to mean annual near-surface wind speeds in observation, but the central values in spring are stronger than the annual mean. Similar to the mean annual near-surface wind speeds, both the maximum values and the corresponding locations are different among five reanalysis datasets in winter. The largest positive deviations between the observation and reanalysis datasets are seen over Tibetan Plateau in winter. Among four seasons, the value of near-surface wind speeds in spring is the largest in observation, whereas the maximum value is seen in winter in five reanalysis datasets (Table 2). The minimum value appears in the autumn in observation but in summer in MERRA, JRA-55, and ERA-Interim. Nonetheless, the difference between observation and reanalysis datasets is more than 1.0 m·s−1. Thus, the reanalysis datasets reasonable reproduce the spatial distribution of near-surface wind speed but have evident bias in magnitude in five reanalysis datasets. Among the five reanalysis datasets, the MERRA is the best one in comparison to the observation.
To provide regional details, the nine subregions of China (Figure 1) are defined based on the climate features following Lin et al. [40]. The Taylor diagram is used to determine whether the reanalysis datasets could reasonably reproduce the climatology of near-surface wind speeds over continental China and nine specific regions (Figure 3). All reanalysis datasets reasonably reproduce the space distribution of mean annual near-surface wind speeds with large pattern correlation coefficients (PCC) (larger than 0.9), although a RMSE lager than 1m·s−1 is also evident over China as whole (Figure 3a). Over the nine regions, the reanalysis datasets show poor performances in reproducing the climatology of annual mean wind speeds with relative lower PCC and larger RMSE in high latitude and complex terrain areas, such as region A, B, C, D, H, and I. The skill of JRA-55 is the lowest among the five reanalysis datasets.
The performances of the five reanalysis datasets are season-dependent (Figure 3b–e): the summer season generally sees a poor performance, whereas the autumn season generally witness a reasonable performance. Like annual mean conditions, the quality of reanalysis data is generally poor over the high latitude and complex terrain areas in four seasons. If we take the continental China as a whole for assessment, the MERRA shows the best performance, while the JRA-55 shows the lowest skill. For annual mean and seasonal mean conditions, the quality of JRA-55 data exhibits the lowest skill in eight regions (B–I region). The quality of other reanalysis data is regional dependent. For example, for annual and season mean near-surface wind speeds, the NCEP-2 shows reasonable performances over regions C, D, and F. The 20CR is the best one over regions A, E, and G, while the MERRA exhibit the best skill over regions B, H, and I. It should be noted that MERRA is ranked as the second-best datasets in reproducing the observed near-surface wind speeds over the other analyzed regions. However, MERRA shows reasonable performances in reproducing the climate of near-surface wind speeds over the regions A, B, C, and H where are rich in wind energy.
The performances of the five reanalysis datasets are seasonal dependent (Figure 3b–e), while summer season generally sees a poor performance, the autumn season generally witness a reasonable performance. Like annual mean conditions, the quality of reanalysis data is generally poor over the high latitude and complex terrain areas in four seasons. If we take the continental China as a whole for assessment, the MERRA shows the best performance, while the JRA-55 shows the lowest skill. For annual mean and seasonal mean conditions, the quality of JRA-55 data exhibit the lowest skill in eight regions (B–I region). The quality of other reanalysis data is regional dependent. For example, for annual and season mean near-surface wind speeds, the NCEP-2 shows reasonable performances over regions C, D, and F. The 20CR is the best one over regions A, E, and G, while the MERRA exhibit the best skill over regions B, H, and I. It should be noted that MERRA is ranked as the second-best datasets in reproducing the observed near-surface wind speeds over the other analyzed regions. However, MERRA shows reasonable performances in reproducing the climate of near-surface wind speeds over the regions A, B, C, and H, which are rich in wind energy.

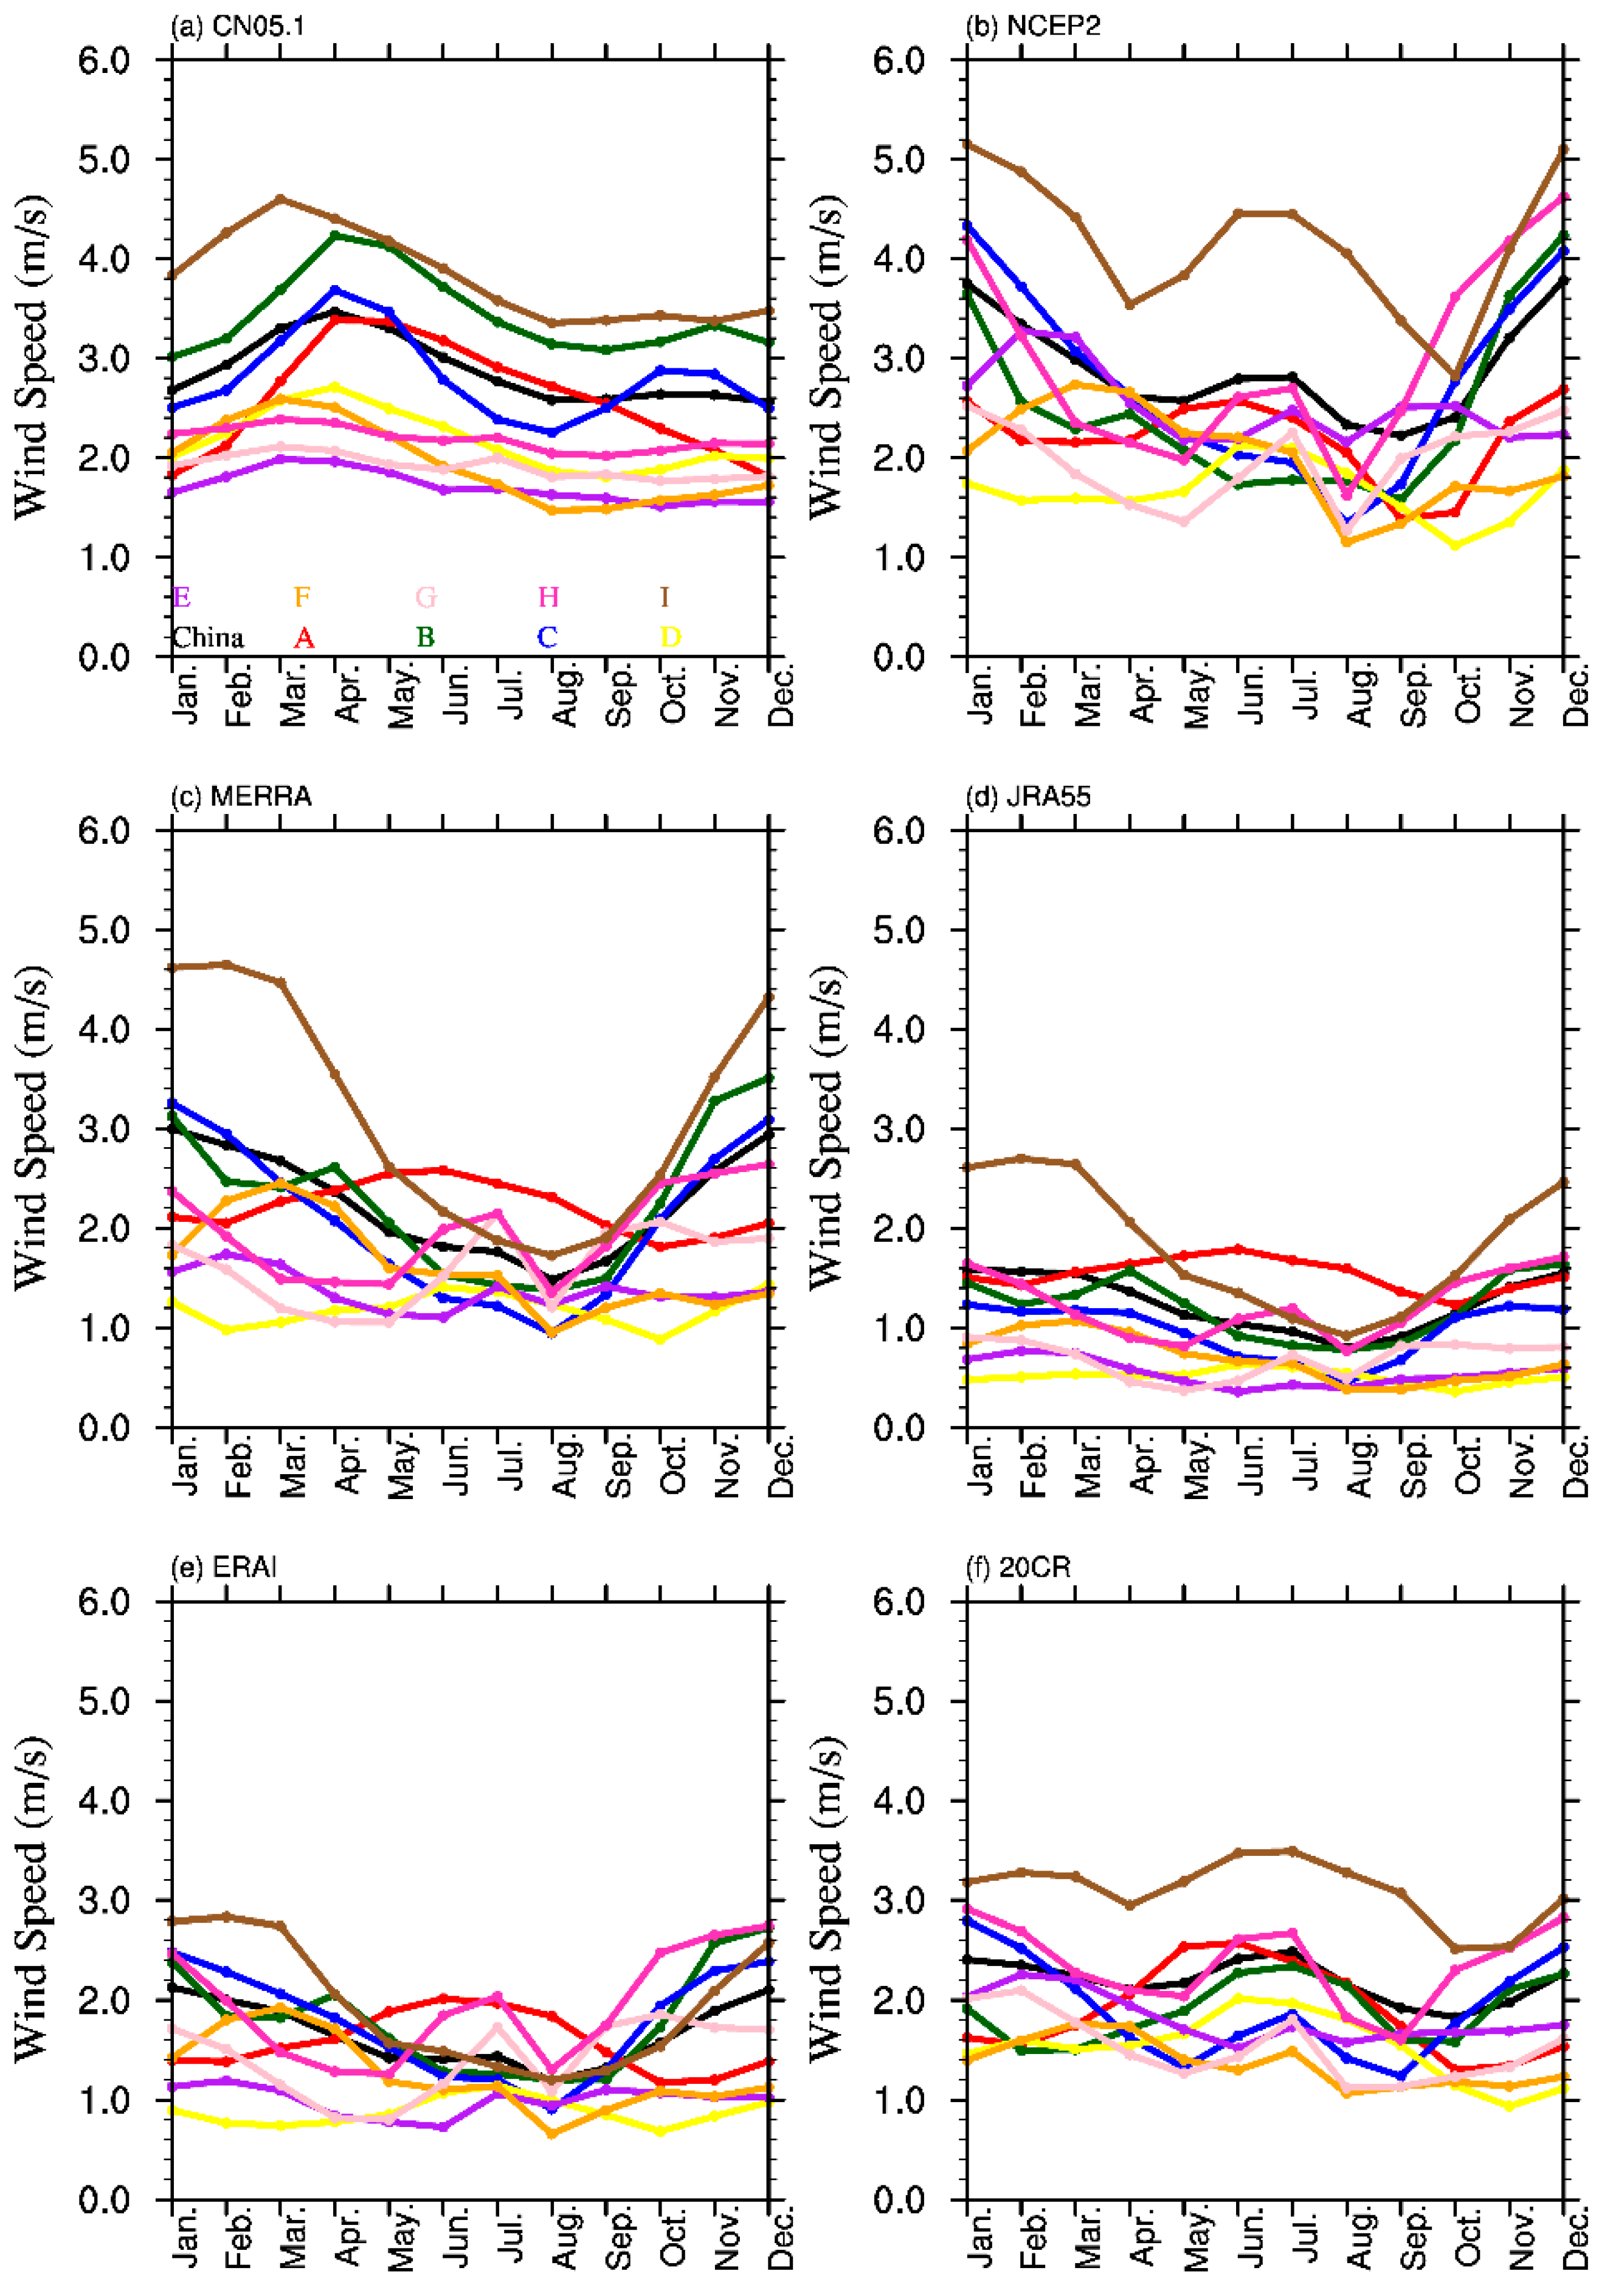
3.2. Annual Cycle of Near-Surface Wind Speed

In order to evaluate differences across different month, the monthly mean near-surface wind speeds are shown in Figure 4. In the observation, the maximum wind speed is seen in spring, while the minimum wind speed is seen in winter (Figure 4a). The wind speed increases from January to April, but decreases from April to December. The seasonal cycle of near-surface wind speeds in the nine regions are similar. Regions B and I have the high values in magnitude, while regions E and G have the lowest values. Features different to the observation are seen in the reanalysis datasets (Figure 4b–f). They all show the maximum wind speed in winter months. In MERRA, ERA-Interim, and JRA-55, the wind speed tends to decrease from January to August, but increase from August to December. The seasonal cycle of NCEP-2 and 20CR data resemble the curve of cosine type. The seasonal cycles over the nine regions derived from NCEP-2 data show similar characteristics. The other reanalysis datasets also show limitations in reproducing the seasonal cycle over the nine regions. Only in regions B, C, and I does the seasonal cycle of reanalysis resembles the observations. In other regions, the wind speed tends to peak in summer and winter and levels off in spring and autumn, this feature is however inconsistent with the observations. In summary, the reanalysis datasets are unable to reasonably reproduce the observed seasonal cycle of wind speed over China.

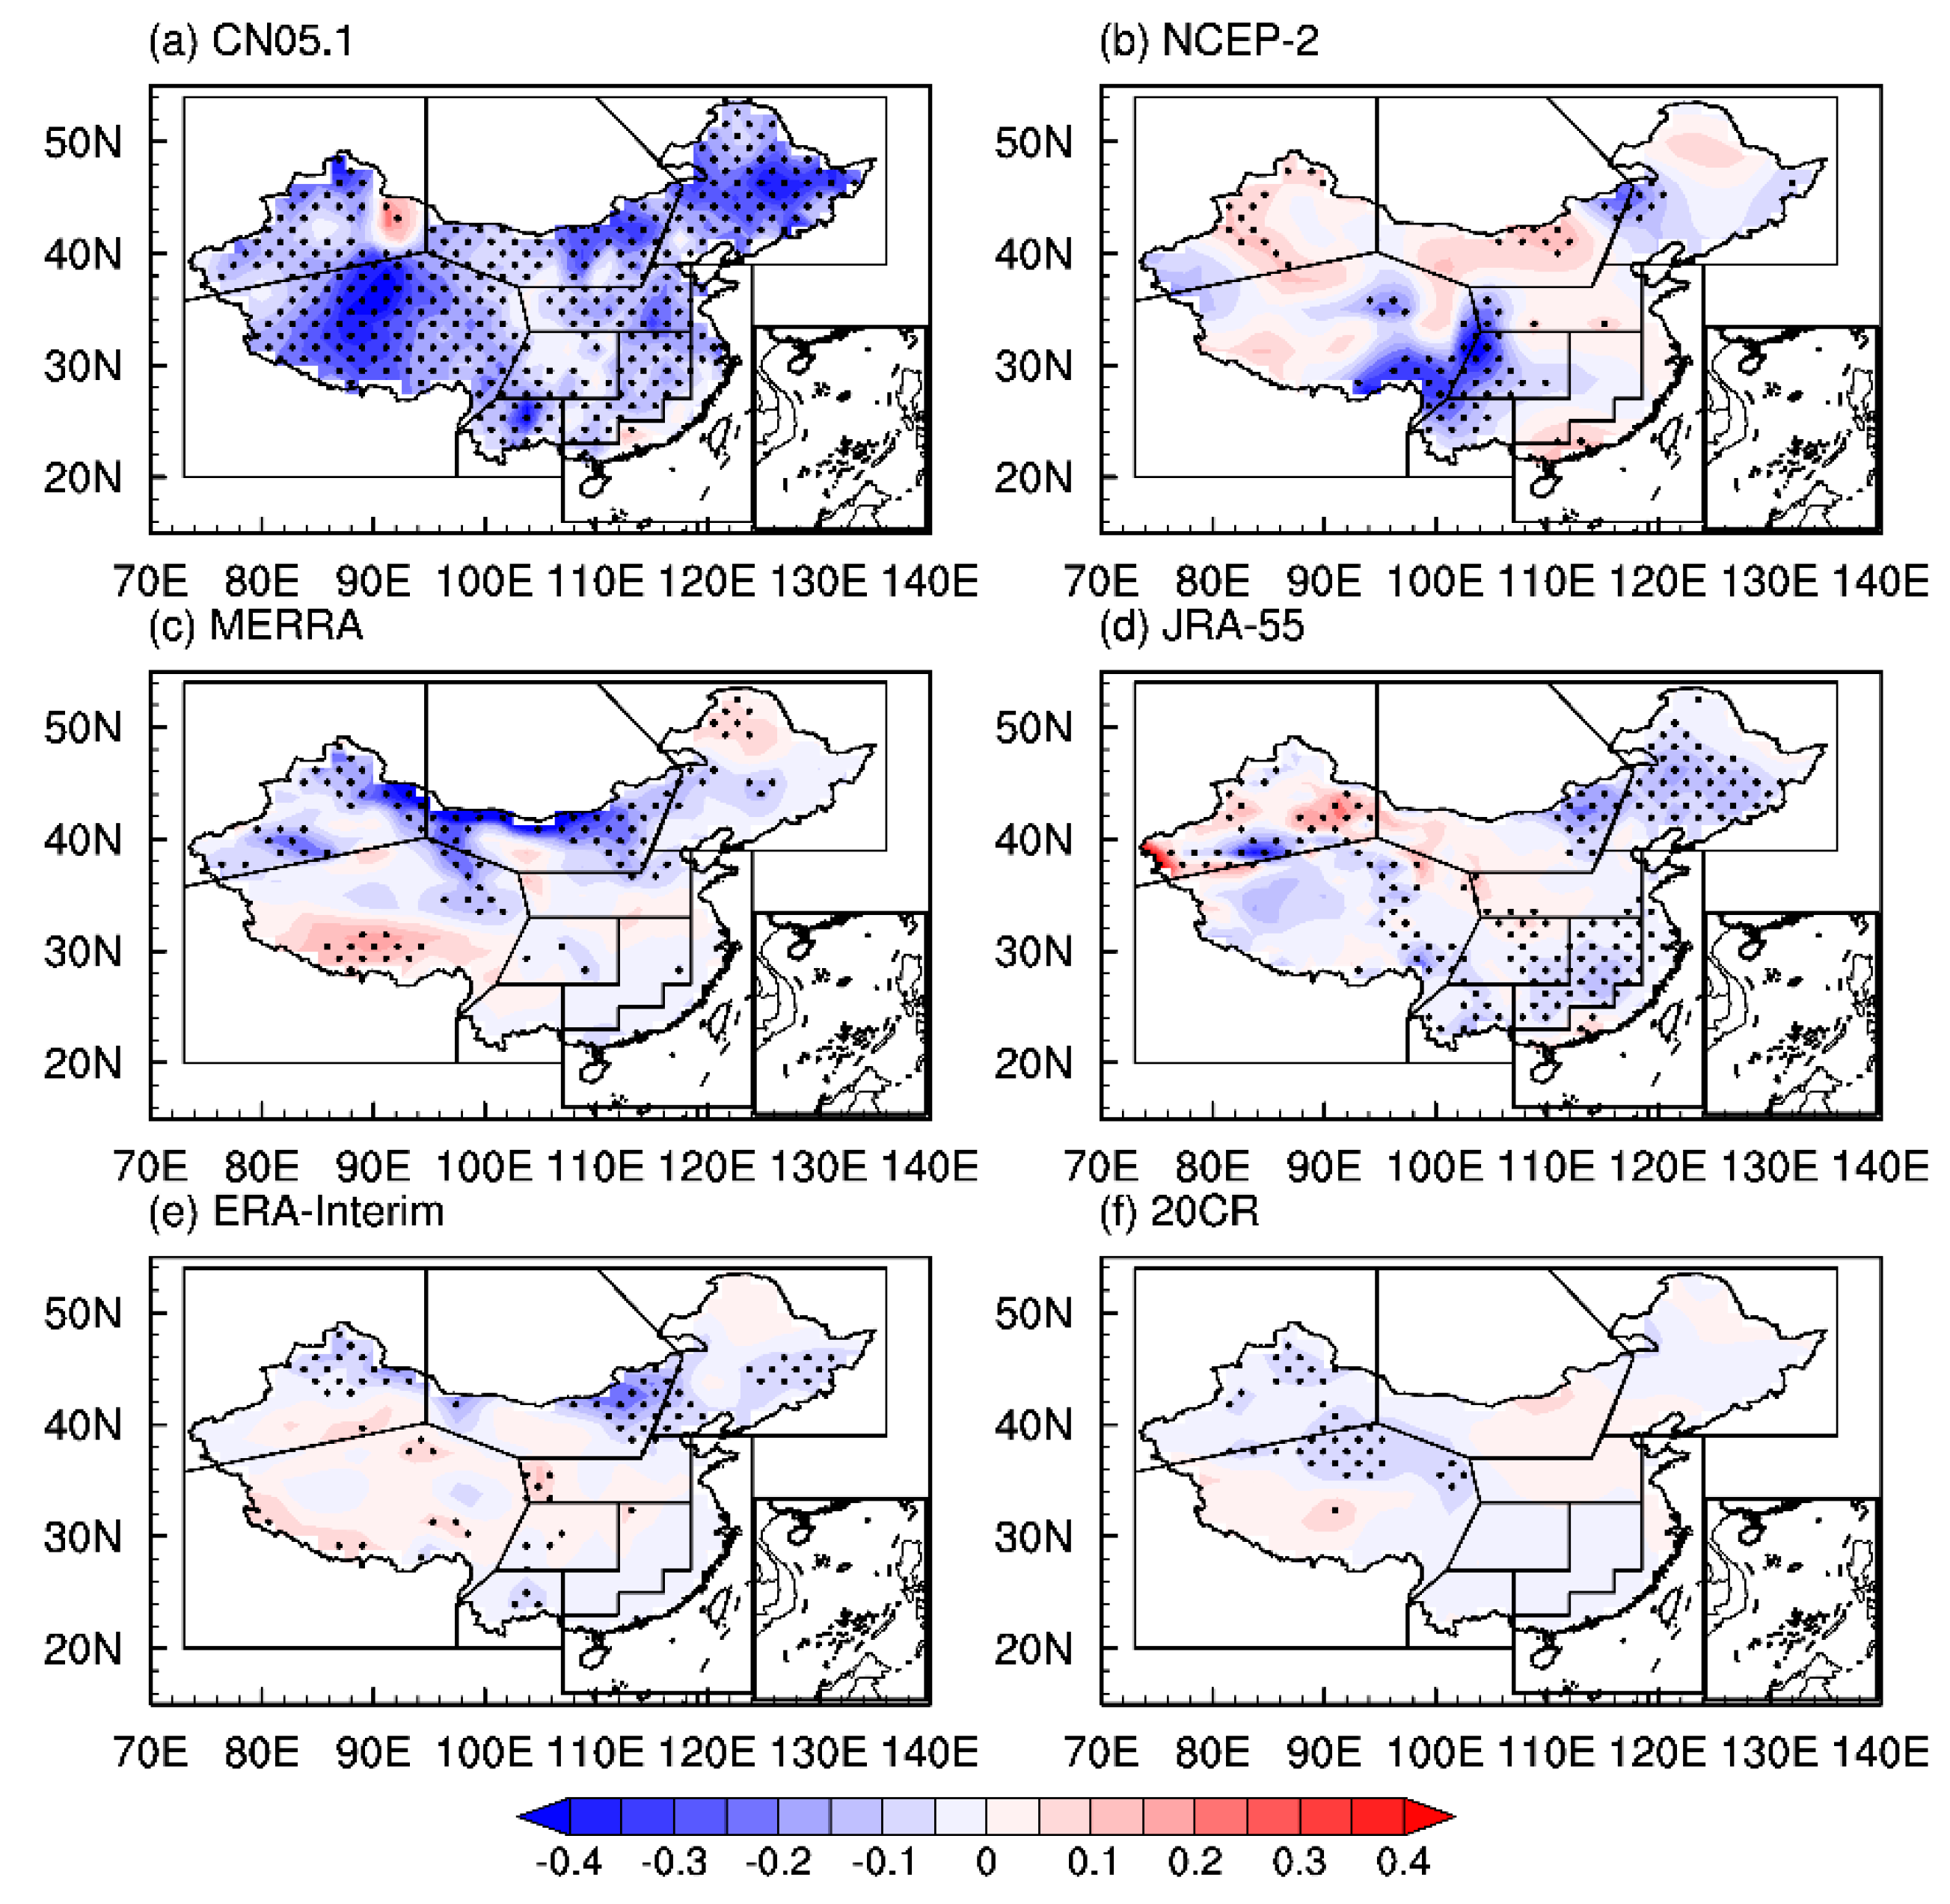
3.3. Linear Trend Analyses

To further examine changes in near-surface wind speeds, both the temporal and spatial trends in observations and five reanalysis datasets are examined for the period of 1979–2011. The trends for annual and seasonal mean wind speeds derived from the observation and the reanalysis datasets are compared in Figure 5. Decline trends are seen in both the observation and five reanalysis datasets for the annual mean condition (Figure 5a). The magnitudes of the trends derived from the five reanalysis are weaker than the observations. Only the trends in MERRA and JRA-55 are statistically significant at the 5% level. The annual trend derived from the MERRA data is the closest to the observation.
For the seasonal average (Figure 5a), the negative trends of near-surface wind speed in the observation are evident in all four seasons, with the largest magnitude in spring but the smallest magnitude in winter. The largest trend of spring time is seen in all reanalysis datasets. Among the reanalysis data, the NCEP-2 and MERRA data are close to the observation. No significant trend is seen in the ERA-Interim dataset. Note the observed trend in summer and autumn are well reproduced in MERRA data. The largest bias is seen in winter, when all the reanalysis datasets except for the JRA-55 show an increasing trend instead of the observed decline trend.
In Figure 5b–j, the decreasing trends of near-surface wind speed are evident over nine regions for the annual mean and season mean near-surface wind speeds. Among the four seasons, the trend in spring is the strongest. Among the nine regions, the decline trend over region I/E is the largest/smallest. All reanalysis datasets are unable to reproduce the observed trends, in particular for the most remarkable decline trend of the observation in spring. The reanalysis datasets show increasing trends of annual and season mean wind speed. The decreasing trends of the annual, summer, autumn, and winter mean wind speed over B region are overestimated by MERRA. The decreasing trends of annual and seasonal mean wind speed over region E are also overestimated by NCEP-2. The performance of NCEP-2 is poor in region H. In summary, our analysis shows that the reanalysis dataset could reproduce decline trends of mean annual wind speed with weak magnitude. For the seasonal trends, the reanalysis datasets show poor performance, in particular over the complex topography terrain. Among the five reanalysis datasets, MERRA show the best performance.
We further examine the spatial patterns of mean annual near-surface wind speed trends in Figure 6. In the observation, the significant decreasing trends are seen in most part of China except for the Sichuan basin and southern China where weak increasing trends are seen (Figure 6a). Differences are seen among the five reanalysis datasets in measuring the trends (Figure 6b–f). All the reanalysis datasets show increasing trends in the northern Greater Khingan Mountains, the south edge of Tibet Plateau, and North China Plain. Trends different to the observations are seen in Xinjiang and Inner Mongolia for NCEP-2, JRA-55, ERA-Interim, and 20CR data, meaning that reanalysis datasets, especially the MEERA, reproduce the major observed features over rich wind resource region, but the magnitude is weak. The abilities in reproducing linear trend over complex terrain are also weak in reanalysis datasets.
We also examine the patterns of mean seasonal near-surface wind speed trend (see the figures in Supplementary Material). In spring, the decline trends are seen in most part of China while an increasing trend is seen in Greater Higgnan Mountains, Sichuan basin, and the southern China. In winter, the decline trends are weaker in the reanalysis datasets. However, a rise in near-surface wind speed over most regions is seen in five reanalysis datasets in winter. In autumn, all the reanalysis data show poor performances, with the trends over Tibetan Plateau and North China Plain being contrary to the observations. Encouraging results are seen in spring and summer when all the five reanalysis datasets show similar patterns to the observation. The largest bias is found in winter.

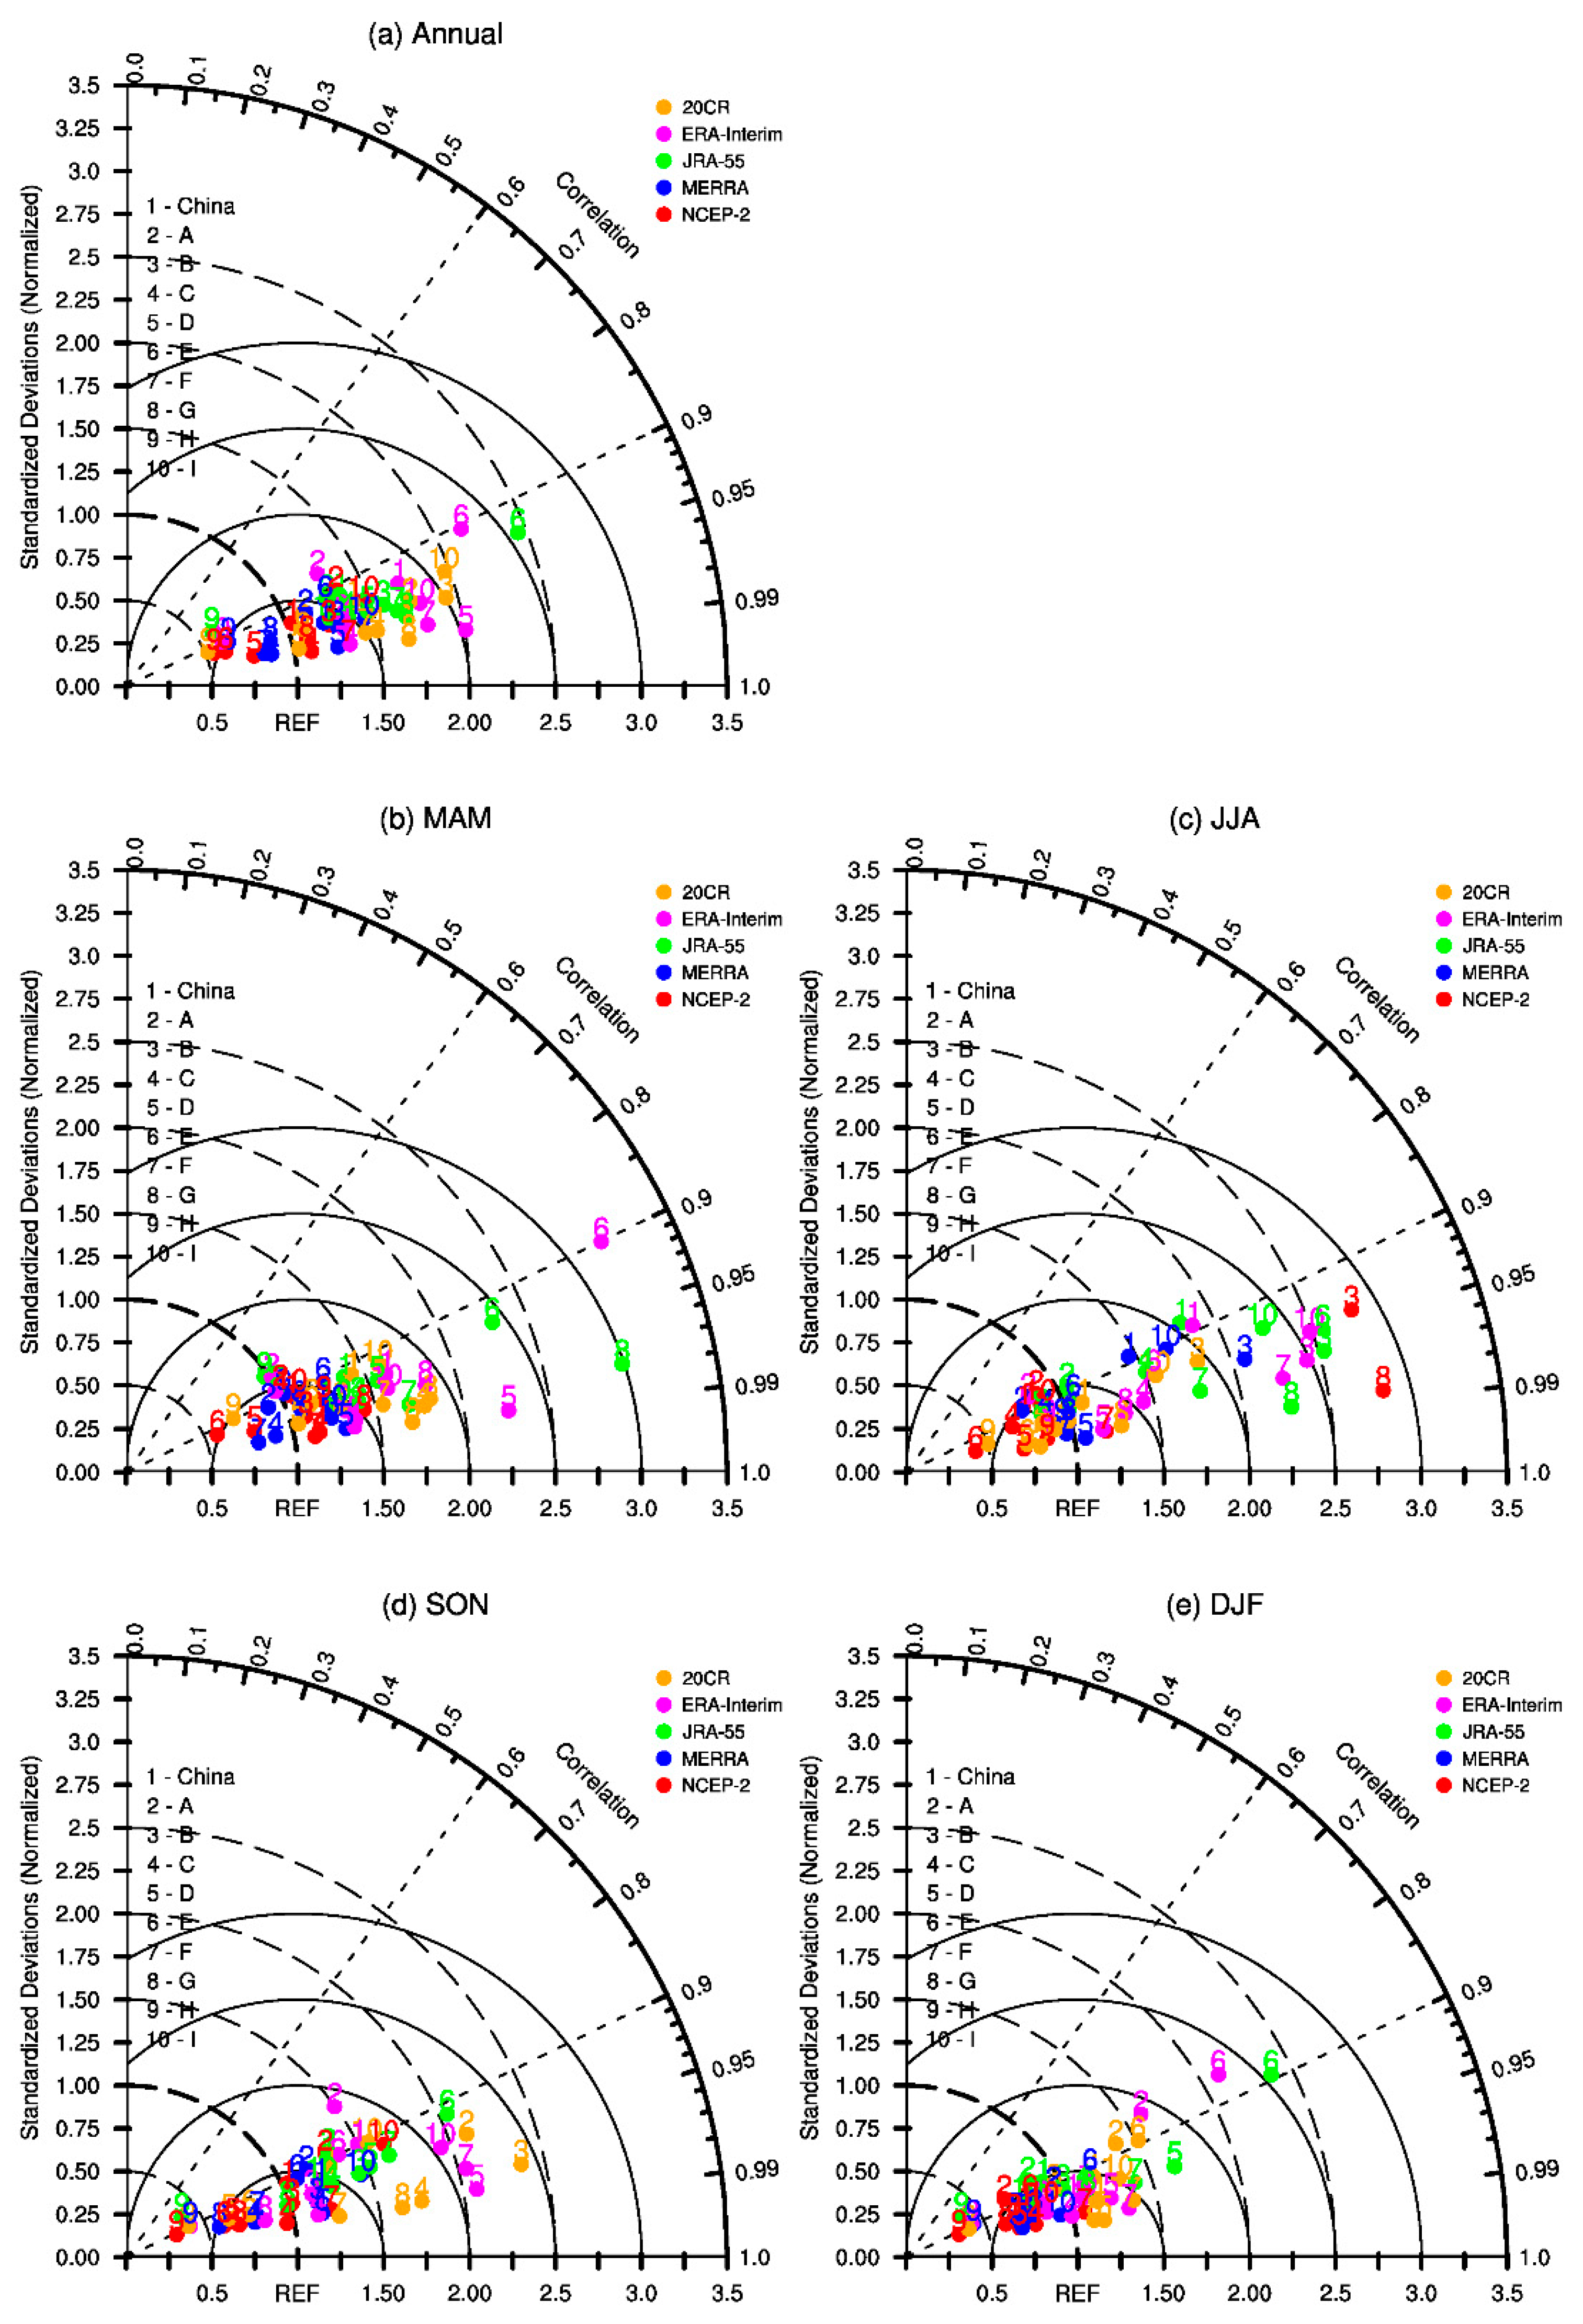
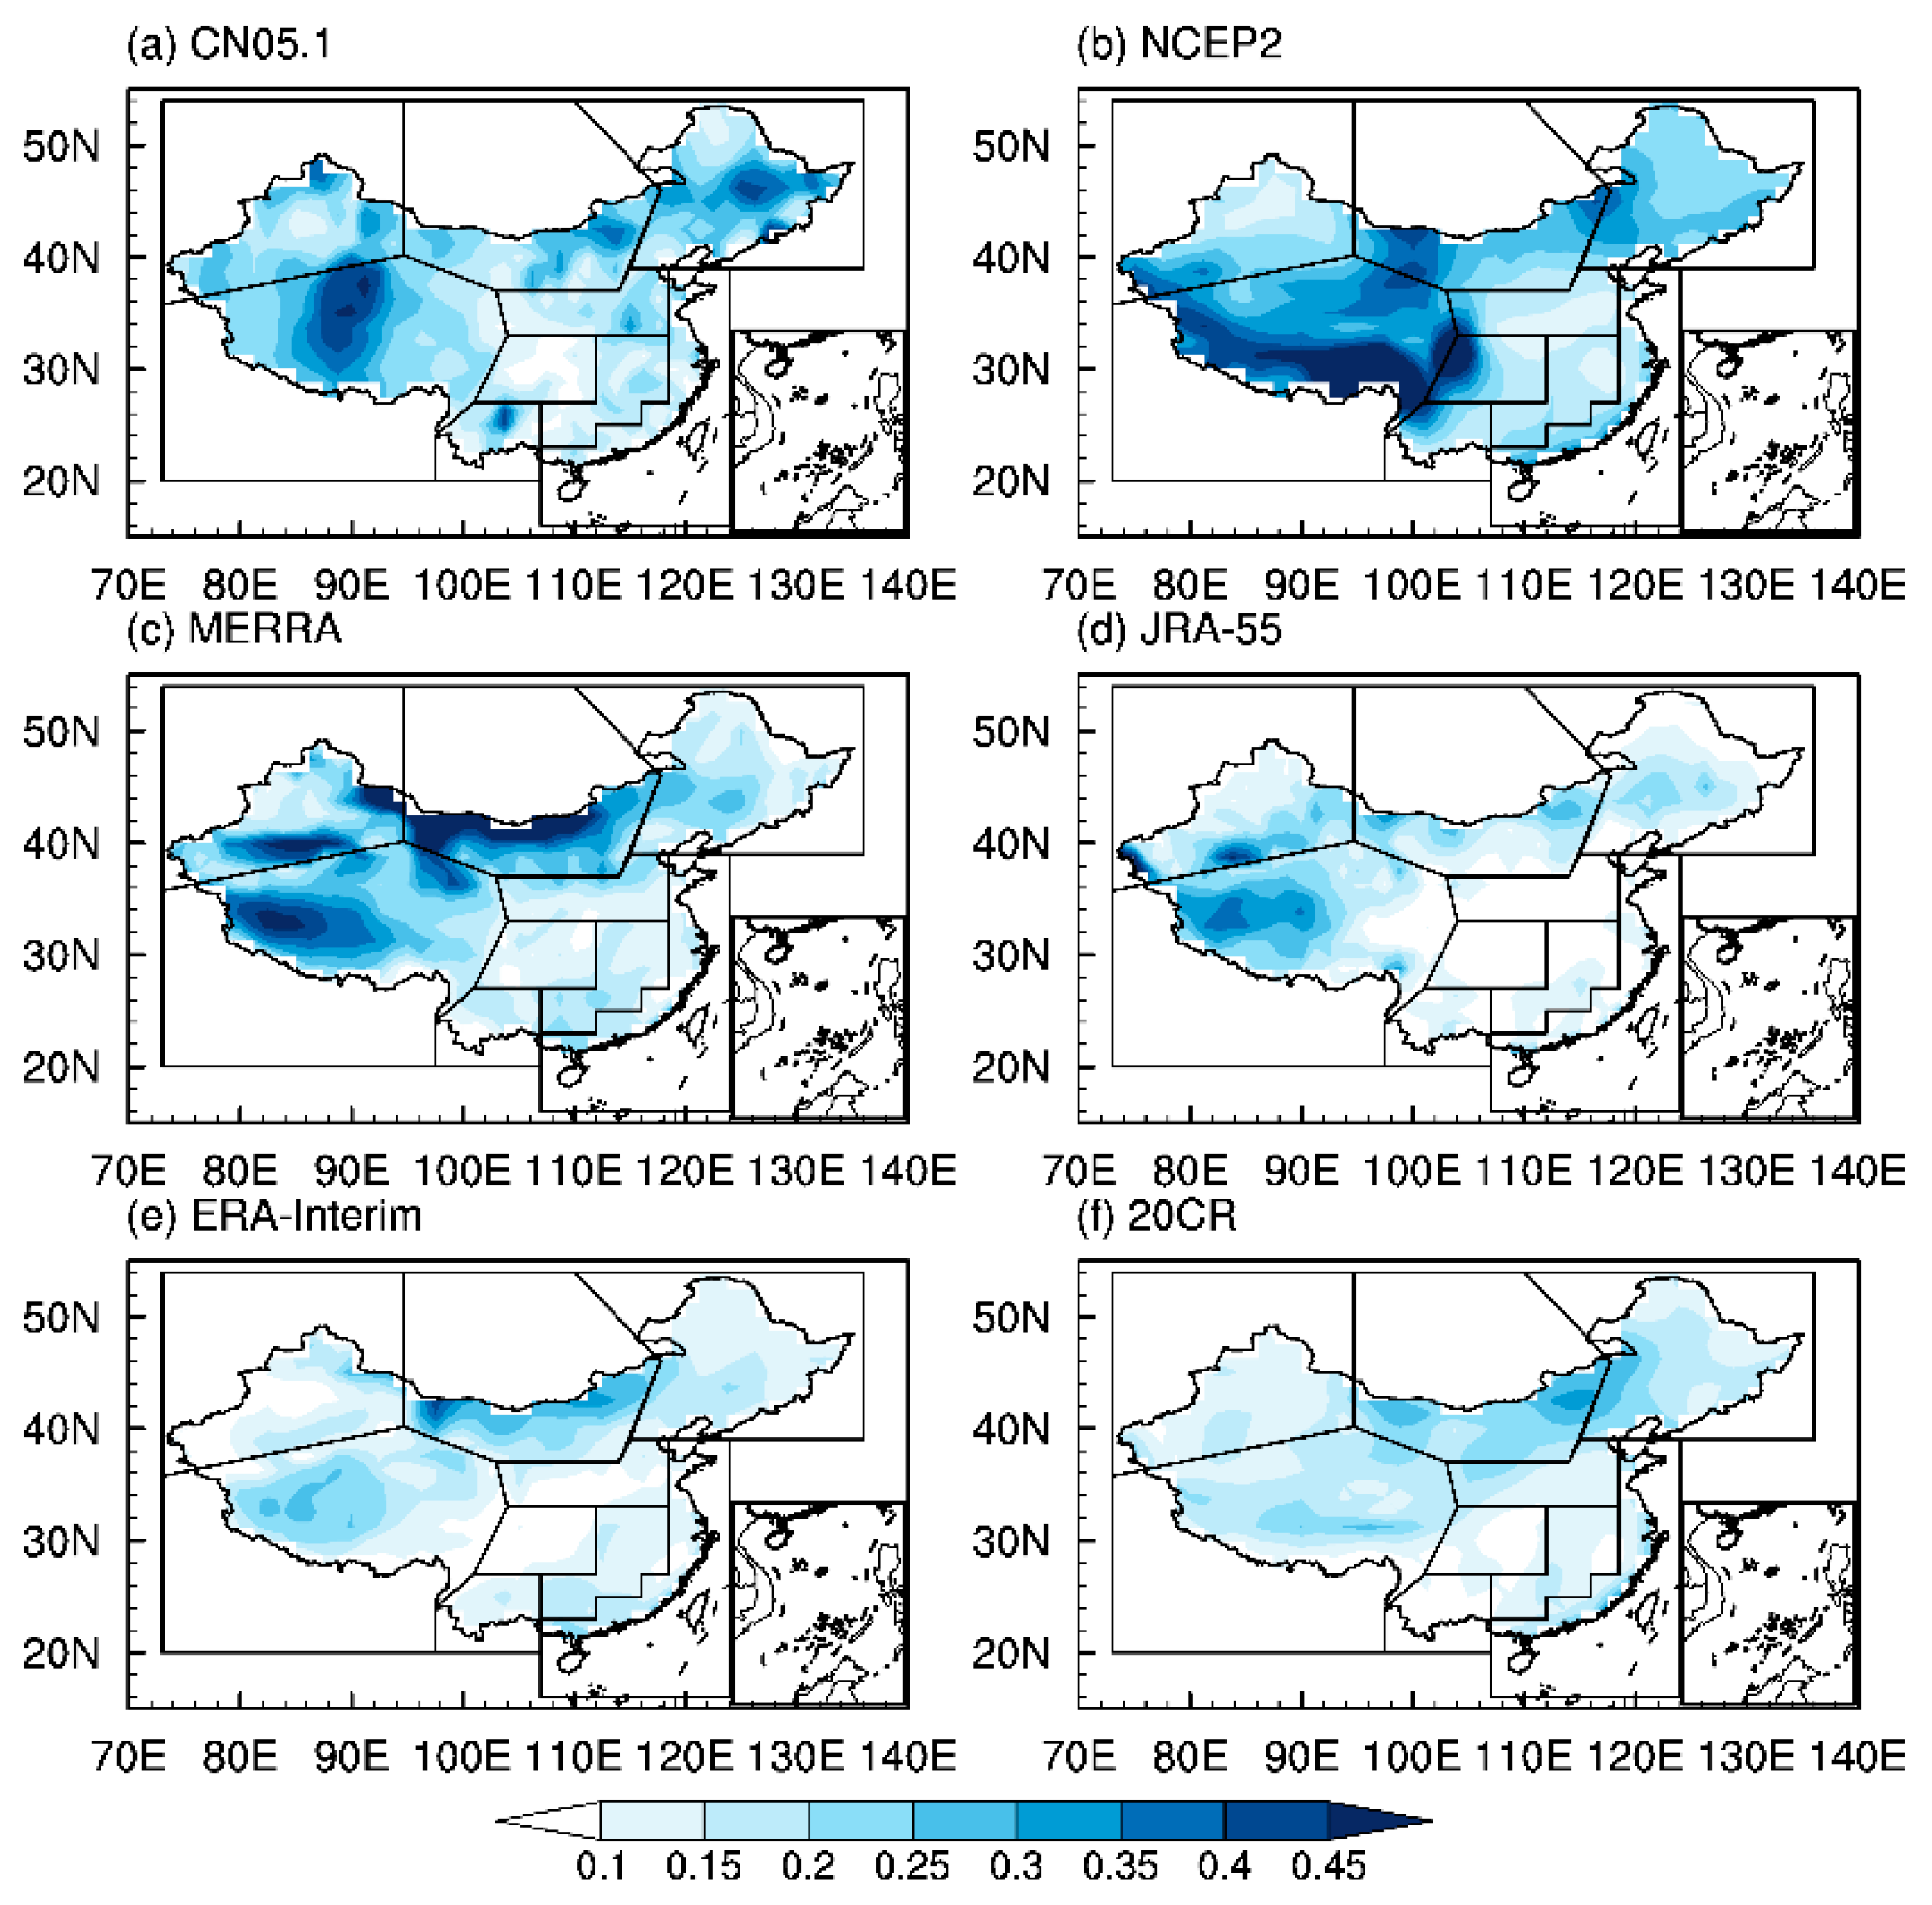
3.4. Interannual Variability

To reveal the interannual variability of the mean annual and seasonal near-surface wind speed over the period of 1979 to 2011, the time series of near-surface wind speed averaged over continental China derived from the reanalysis datasets are compared with that derived from the observations in Figure 7. While the interannual variability in the observation is not significant for the average over whole China, robust interannual variability is seen in the results derived from the reanalysis. For the annual mean average (Figure 7a), the MERRA and JRA-55 agree well with the observation, whereas both NCEP-2 and 20CR disagree with the observation. A further examination on the seasonal mean trend in Figure 7b–e finds that the results of MERRA and JRA-55 closely resemble the observation. Unfortunately, all the reanalysis data show poor performances in winter.
To quantitatively measure the performances of reanalysis data, the correlation coefficients between the observation and the reanalysis are compared in Table 3. The time series of anomalous wind speed derived from JRA-55 (0.577, 0.558, and 0.418 for annual, summer, and winter, respectively) and MERRA (0.578 and 0.58 for summer and autumn, respectively) show the highest correlation coefficients with the observation among the five reanalysis datasets. NCEP-2 and 20CR show the lower correlation coefficients. All five reanalysis datasets show the lowest correlation coefficient in winter. The reanalysis datasets show different performances over nine regions. All reanalysis datasets show the lowest correlations in regions A, C, D, H, and I, and highest correlations in regions B, F, and G. JRA-55 more closely resembles the observation, with high correlation coefficients (greater than 0.7), in regions C, G, and F. MERRA is closer to the observation in B region.
The spatial distributions of the interannual variability, which is measured by standard deviation of mean annual near-surface wind speeds during 1979 to 2014, are shown in Figure 8. Larger interannual variations of mean annual near-surface wind speeds are found in region A, B, C, and I, whereas smaller interannual variations are found in the other regions. All reanalysis datasets could reproduce the spatial distributions, with the regions A, B, C, and I have large interannual variations. We also note that both the locations and value of interannual standard deviations in reanalysis datasets are different from observation. For example, the lager interannual variation in region I is located in the central Tibet Plateau in observation, while they are found in the south edge of Tibet Plateau in reanalysis datasets. Both NCEP-2 and MERRA overestimate the interannual variations in region A and B, but underestimate the interannual variations in C region. JRA-55, ERA-Interim, and 20CR show the lower values of interannual variations across the whole China.
Seasonally (Figures are seen in Supplementary Material), the interannual variations in spring and winter are larger than those in summer and autumn. The spatial distributions in four seasons are like the annual mean wind speeds. In all reanalysis datasets, the larger interannual variations also are found in the spring and winter, but the magnitude are larger than the observed. All reanalysis datasets overestimate the interannual variations in the A, B, C, and I region in spring, summer, autumn, and winter. Thus, the performances of reanalysis data are quite limited in complex terrain areas.

4. Summary and Concluding Remarks

4.1. Summary

In this study, we evaluated the performance of five reanalysis datasets in reproducing the climatology, linear trend and interannual variability of near-surface wind speeds derived from are assessed by comparing to CN05.1 dataset over continental China.
The long-term mean near-surface wind speeds vary between 1.0 and 7.0 m·s−1 across the entire China. The large mean winds are found in the Inner Mongolia, Xinjiang, and Tibetan Plateau. The mean near-surface winds are weak in the Sichuan Basin. All five reanalysis datasets reasonably reproduce the climatology of near-surface wind speeds with PCCs higher than 0.8 and RMSEs less than 1.5 m·s−1. Compared to the observation, the near-surface wind speeds are smaller in reanalysis datasets. The reanalysis dataset show the higher skills over the flat regions than complex terrain region. Among the five reanalysis datasets, MERRA (JRA-55) does the best (worst) job of revealing the climatological spatial distribution over continental China.
Averaged over the continent, the near-surface wind speeds derived from observation dataset show an evident seasonal variation with maximum (minimum) near-surface wind speed in spring (winter). All subregions show the similar variations. In the reanalysis datasets, the near-surface winds are stronger than the observation in summer and winter. In spring and autumn, the near-surface winds are weaker. The skills of reanalysis datasets also are seasonal dependent with reasonable performance in the autumn.
The linear trend analysis for the mean annual wind speeds indicates that near-surface wind speeds dramatically decrease during 1979 to 2011 over continental China. The declines are stronger in the northeastern China and Tibetan Plateau than the other regions of China. Among the four seasons, the near-surface winds in spring have the highest rate of decrease over continental China and most subregions. That decreasing trend is underestimated in five reanalysis datasets. Only two datasets (MERRA and JRA-55) show the significant decreasing trend of mean annual near-surface wind speed over continental China as whole. MERRA is closest to the observation. All reanalysis datasets fail to reproduce the decline in winter over China. The poor performances exist in all nine subregions.
The near-surface wind speeds vary year-to-year over continental China as whole. The large interannual variability is seen in the spring and winter, whereas weak variation is found in the summer and autumn. The observed interannual variations exhibit evident regional differences. The lager interannual variations are found in the northern China and high altitude region and smaller interannual variations are found in the other region. The observed regional differences are underestimated in the reanalysis datasets. The changes from year to year are similar to the observed but more obvious in reanalysis datasets. The reproduce of the changes of near-surface wind speeds are reasonable in spring, summer, and autumn and unreasonable in winter.

4.2. Concluding Remarks

The poor performances of the reanalysis datasets in reproducing the trend in near-surface winds are also found over Netherlands [49], contiguous U.S. [5,29], Australia [31], and other areas [8,50]. The changes of land use may contribute the decline of near-wind speed [8,50,51,52]. The unassimilated surface observation of wind over land in the reanalysis may contribute that limitation [8,53].
In addition, although among the five reanalysis datasets, the MERRA (JRA-55) shows the relatively highest (lowest) skill in terms of the climatology and linear trend. The performance is also far behind the expectations. These results call for emergent needs for developing high quality reanalysis data that can be used in wind resource assessment and planning.

Supplementary Materials

The following are available online at https://www.mdpi.com/2073-4433/10/12/804/s1, Figure S1: Mean Wind Speed in Spring, Figure S2: Mean Wind Speed in Summer, Figure S3: Mean Wind Speed in Autumn, Figure S4: Mean Wind Speed in Winter. Figure S5: Linear Trend in Spring, Figure S6: Linear Trend in Summer, Figure S7: Linear Trend in Autumn, Figure S8: Linear Trend in Winter, Figure S9: Inter-annual Variation in Spring, Figure S10: Inter-annual Variation in Summer, Figure S11: Inter-annual Variation in Autumn, and Figure S12: Inter-annual Variation in Winter.

Author Contributions

Conceptualization, T.Z. and Z.J.; Data curation, J.Y.; Formal analysis, J.Y.; Investigation, J.Y. and T.Z.; Methodology, J.Y. and T.Z.; Validation, J.Y.; Writing – original draft, J.Y.; Writing – review & editing, T.Z., Z.J. and L.Z.

Funding

International Partnership Program of Chinese Academy of Sciences (No. 134111KYSB20160031) and National Key Research and Development Program of China (2017YFA0603804).

Acknowledgments

This work is supported by the International Partnership Program of Chinese Academy of Sciences (No. 134111KYSB20160031) and National Key Research and Development Program of China (2017YFA0603804).

Conflicts of Interest

The authors declare there is no conflicts of interest regarding the publication of this paper.

References

  1. Huang, J.; McElroy, M.B. A 32-year perspective on the origin of wind energy in a warming climate. Renew. Energy 2015, 77, 482–492. [Google Scholar] [CrossRef]
  2. Bandyopadhyay, A.; Bhadra, A.; Raghuwanshi, N.S.; Singh, R. Temporal Trends in Estimates of Reference Evapotranspiration over India. J. Hydrol. Eng. 2009, 14, 508–515. [Google Scholar] [CrossRef]
  3. Fant, C.; Adam Schlosser, C.; Strzepek, K. The impact of climate change on wind and solar resources in southern Africa. Appl. Energy 2016, 161, 556–564. [Google Scholar] [CrossRef] [Green Version]
  4. Fujibe, F. Urban warming in Japanese cities and its relation to climate change monitoring. Int. J. Climatol. 2011, 31, 162–173. [Google Scholar] [CrossRef]
  5. Pryor, S.C.; Ledolter, J. Addendum to Wind speed trends over the contiguous United States. J. Geophys. Res. 2010, 115. [Google Scholar] [CrossRef]
  6. Yan, Z.; Bate, S.; Chandler, R.E.; Isham, V.; Wheater, H. An Analysis of Daily Maximum Wind Speed in Northwestern Europe Using Generalized Linear Models. J. Clim. 2002, 15, 2073–2088. [Google Scholar] [CrossRef]
  7. McVicar, T.R.; Roderick, M.L.; Donohue, R.J.; Li, L.T.; Van Niel, T.G.; Thomas, A.; Grieser, J.; Jhajharia, D.; Himri, Y.; Mahowald, N.M.; et al. Global review and synthesis of trends in observed terrestrial near-surface wind speeds: Implications for evaporation. J. Hydrol. 2012, 416–417, 182–205. [Google Scholar] [CrossRef]
  8. Vautard, R.; Cattiaux, J.; Yiou, P.; Thépaut, J.-N.; Ciais, P. Northern Hemisphere atmospheric stilling partly attributed to an increase in surface roughness. Nat. Geosci. 2010, 3, 756–761. [Google Scholar] [CrossRef]
  9. Groisman, P.Y.; Knight, R.W.; Karl, T.R.; Easterling, D.R.; Sun, B.; Lawrimore, J.H. Contemporary Changes of the Hydrological Cycle over the Contiguous United States: Trends Derived from In Situ Observations. J. Hydrometeorol. 2004, 5, 64–85. [Google Scholar] [CrossRef] [Green Version]
  10. Klink, K. Trends in mean monthly maximum and minimum surface wind speeds in the coterminous United States, 1961 to 1990. Clim. Res. 1999, 13, 193–205. [Google Scholar] [CrossRef] [Green Version]
  11. Burn, D.H.; Hesch, N.M. A Comparison of Trends in Potential and Pan Evaporation for the Canadian Prairies. Can. Water Resour. 2006, 3, 173–184. [Google Scholar] [CrossRef] [Green Version]
  12. Mahowald, N.M.; Ballantine, J.A.; Feddema, J.; Ramankutty, N. Global trends in visibility: Implications for dust sources. Atmos. Chem. Phys. 2007, 7, 3309–3339. [Google Scholar] [CrossRef] [Green Version]
  13. Moratiel, R.; Snyder, R.L.; Durán, J.M.; Tarquis, A.M. Trends in climatic variables and future reference evapotranspiration in Duero Valley (Spain). Nat. Hazards Earth Syst. Sci. 2011, 11, 1795–1805. [Google Scholar] [CrossRef] [Green Version]
  14. Pirazzoli, P.A.; Tomasin, A. Recent near-surface wind changes in the central Mediterranean and Adriatic areas. Int. J. Climatol. 2003, 23, 963–973. [Google Scholar] [CrossRef]
  15. Xu, M.; Chang, C.-P.; Fu, C.; Qi, Y.; Robock, A.; Robinson, D.; Zhang, H.-M. Steady decline of east Asian monsoon winds, 1969–2000: Evidence from direct ground measurements of wind speed. J. Geophys. Res. 2006, 111. [Google Scholar] [CrossRef] [Green Version]
  16. Ogolo, E.O. Regional trend analysis of pan evaporation in Nigeria (1970 to 2000). J. Geogr. Reg. Plan. 2011, 4, 566–577. [Google Scholar]
  17. Troccoli, A.; Muller, K.; Coppin, P.; Davy, R.; Russell, C.; Hirsch, A.L. Long-Term Wind Speed Trends over Australia. J. Clim. 2012, 25, 170–183. [Google Scholar] [CrossRef] [Green Version]
  18. Turner, J.; Colwell, S.R.; Marshall, G.J.; Lachlan-Cope, T.A.; Carleton, A.M.; Jones, P.D.; Lagun, V.; Reid, P.A.; Iagovkina, S. Antarctic climate change during the last 50 years. Int. J. Climatol. 2005, 25, 279–294. [Google Scholar] [CrossRef]
  19. Cong, Z.T.; Yang, D.W.; Ni, G.H. Does evaporation paradox exist in China? Hydrol. Earth Syst. Sci. 2009, 13, 357–366. [Google Scholar] [CrossRef] [Green Version]
  20. Fu, G.; Yu, J.; Zhang, Y.; Hu, S.; Ouyang, R.; Liu, W. Temporal variation of wind speed in China for 1961–2007. Theor. Appl. Climatol. 2010, 104, 313–324. [Google Scholar] [CrossRef]
  21. Yin, Y.; Wu, S.; Chen, G.; Dai, E. Attribution analyses of potential evapotranspiration changes in China since the 1960s. Theor. Appl. Climatol. 2009, 101, 19–28. [Google Scholar] [CrossRef]
  22. Guo, H.; Xu, M.; Hu, Q. Changes in near-surface wind speed in China: 1969-2005. Int. J. Climatol. 2011, 31, 349–358. [Google Scholar] [CrossRef]
  23. Jiang, Y.; Luo, Y.; Zhao, Z.; Tao, S. Changes in wind speed over China during 1956–2004. Theor. Appl. Climatol. 2009, 99, 421–430. [Google Scholar] [CrossRef]
  24. Lin, R.; Zhou, T.; Qian, Y. Evaluation of Global Monsoon Precipitation Changes based on Five Reanalysis Datasets. J. Clim. 2014, 27, 1271–1289. [Google Scholar] [CrossRef]
  25. Ma, S.; Zhou, T. Robust Strengthening and Westward Shift of the Tropical Pacific Walker Circulation during 1979–2012: A Comparison of 7 Sets of Reanalysis Data and 26 CMIP5 Models. J. Clim. 2016, 29, 3097–3118. [Google Scholar] [CrossRef]
  26. Si, D.; Ding, Y. Decadal Change in the Correlation Pattern between the Tibetan Plateau Winter Snow and the East Asian Summer Precipitation during 1979–2011. J. Clim. 2013, 26, 7622–7634. [Google Scholar] [CrossRef]
  27. Zhou, T.-J. Atmospheric water vapor transport associated with typical anomalous summer rainfall patterns in China. J. Geophys. Res. 2005, 110. [Google Scholar] [CrossRef] [Green Version]
  28. Li, X.; Zhong, S.; Bian, X.; Heilman, W.E. Climate and climate variability of the wind power resources in the Great Lakes region of the United States. J. Geophys. Res. 2010, 115. [Google Scholar] [CrossRef] [Green Version]
  29. Rose, S.; Apt, J. Quantifying sources of uncertainty in reanalysis derived wind speed. Renew. Energy 2016, 94, 157–165. [Google Scholar] [CrossRef] [Green Version]
  30. Carvalho, D.; Rocha, A.; Gómez-Gesteira, M.; Silva Santos, C. Offshore winds and wind energy production estimates derived from ASCAT, OSCAT, numerical weather prediction models and buoys—A comparative study for the Iberian Peninsula Atlantic coast. Renew. Energy 2017, 102, 433–444. [Google Scholar] [CrossRef]
  31. McVicar, T.R.; Van Niel, T.G.; Li, L.T.; Roderick, M.L.; Rayner, D.P.; Ricciardulli, L.; Donohue, R.J. Wind speed climatology and trends for Australia, 1975–2006: Capturing the stilling phenomenon and comparison with near-surface reanalysis output. Geophys. Res. Lett. 2008, 35. [Google Scholar] [CrossRef] [Green Version]
  32. Marques, C.A.F.; Rocha, A.; Corte-Real, J. Comparative energetics of ERA-40, JRA-25 and NCEP-R2 reanalysis, in the wave number domain. Dyn. Atmos. Ocean. 2010, 50, 375–399. [Google Scholar] [CrossRef]
  33. Belmonte Rivas, M.; Stoffelen, A. Characterizing ERA-Interim and ERA5 surface wind biases using ASCAT. Ocean Sci. 2019, 15, 831–852. [Google Scholar] [CrossRef] [Green Version]
  34. Tetzner, D.; Thomas, E.; Allen, C. A Validation of ERA5 Reanalysis Data in the Southern Antarctic Peninsula—Ellsworth Land Region, and Its Implications for Ice Core Studies. Geosciences 2019, 9, 289. [Google Scholar] [CrossRef] [Green Version]
  35. Betts, A.K.; Chan, D.Z.; Desjardins, R.L. Near-Surface Biases in ERA5 Over the Canadian Prairies. Front. Environ. Sci. 2019, 7. [Google Scholar] [CrossRef]
  36. Carvalho, D.; Rocha, A.; Gómez-Gesteira, M.; Silva Santos, C. WRF wind simulation and wind energy production estimates forced by different reanalyses: Comparison with observed data for Portugal. Appl. Energy 2014, 117, 116–126. [Google Scholar] [CrossRef]
  37. Chen, L.; Li, D.; Pryor, S.C. Wind speed trends over China: Quantifying the magnitude and assessing causality. Int. J. Climatol. 2013, 33, 2579–2590. [Google Scholar] [CrossRef]
  38. Liu, Z.; Liu, Y.; Wang, S.; Yang, X.; Wang, L.; Baig, M.H.A.; Chi, W.; Wang, Z. Evaluation of Spatial and Temporal Performances of ERA-Interim Precipitation and Temperature in Mainland China. J. Clim. 2018, 31, 4347–4365. [Google Scholar] [CrossRef]
  39. Wu, J.; Gao, X. A gridded daily observation dataset over China region and comparison with the other datasets. Chin. J. Geophys. 2013, 56, 1102–1111. [Google Scholar] [CrossRef]
  40. Xu, Y.; Gao, X.; Shen, Y.; Xu, C.; Shi, Y.; Giorgi, F. A daily temperature dataset over China and its application in validating a RCM simulation. Adv. Atmos. Sci. 2009, 26, 763–772. [Google Scholar] [CrossRef]
  41. Kanamitsu, M.; Ebisuzaki, W.; Woollen, J.; Yang, S.-K.; Hnilo, J.J.; Fiorino, M.; Potter, G.L. NCEP–DOE AMIP-II Reanalysis (R-2). Bull. Am. Meteorol. Soc. 2002, 83, 1631–1644. [Google Scholar] [CrossRef]
  42. Rienecker, M.M.; Suarez, M.J.; Gelaro, R.; Todling, R.; Bacmeister, J.; Liu, E.; Bosilovich, M.G.; Schubert, S.D.; Takacs, L.; Kim, G.-K.; et al. MERRA: NASA’s Modern-Era Retrospective Analysis for Research and Applications. J. Clim. 2011, 24, 3624–3648. [Google Scholar] [CrossRef]
  43. Kobayashi, S.; Ota, Y.; Harada, Y.; Ebita, A.; Moriya, M.; Onoda, H.; Onogi, K.; Kamahori, H.; Kobayashi, C.; Endo, H.; et al. The JRA-55 Reanalysis: General Specifications and Basic Characteristics. J. Meteorol. Soc. Jpn. Ser. II 2015, 93, 5–48. [Google Scholar] [CrossRef] [Green Version]
  44. Berrisford, P.; Kållberg, P.; Kobayashi, S.; Dee, D.; Uppala, S.; Simmons, A.J.; Poli, P.; Sato, H. Atmospheric conservation properties in ERA-Interim. Q. J. R. Meteorol. Soc. 2011, 137, 1381–1399. [Google Scholar] [CrossRef]
  45. Compo, G.P.; Whitaker, J.S.; Sardeshmukh, P.D.; Matsui, N.; Allan, R.J.; Yin, X.; Gleason, B.E.; Vose, R.S.; Rutledge, G.; Bessemoulin, P.; et al. The Twentieth Century Reanalysis Project. Q. J. R. Meteorol. Soc. 2011, 137, 1–28. [Google Scholar] [CrossRef]
  46. Kendall, M.G. Rank Correlation Methods; Griffin: Oxford, UK, 1948. [Google Scholar]
  47. Mann, H.B. Nonparametric Tests Against Trend. Econometrica 1945, 13, 245–259. [Google Scholar] [CrossRef]
  48. Lin, C.; Yang, K.; Qin, J.; Fu, R. Observed Coherent Trends of Surface and Upper-Air Wind Speed over China since 1960. J. Clim. 2013, 26, 2891–2903. [Google Scholar] [CrossRef] [Green Version]
  49. Smits, A.; Klein Tank, A.M.G.; Können, G.P. Trends in storminess over the Netherlands, 1962–2002. Int. J. Climatol. 2005, 25, 1331–1344. [Google Scholar] [CrossRef]
  50. Bichet, A.; Wild, M.; Folini, D.; Schär, C. Causes for decadal variations of wind speed over land: Sensitivity studies with a global climate model. Geophys. Res. Lett. 2012, 39. [Google Scholar] [CrossRef]
  51. Han, S.; Tang, Q.; Zhang, X.; Di, X.; Kou, L. Surface wind observations affected by agricultural development over Northwest China. Environ. Res. Lett. 2016, 11. [Google Scholar] [CrossRef]
  52. Wu, J.; Zha, J.; Zhao, D. Evaluating the effects of land use and cover change on the decrease of surface wind speed over China in recent 30 years using a statistical downscaling method. Clim. Dyn. 2016, 48, 131–149. [Google Scholar] [CrossRef] [Green Version]
  53. Kalnay, E.; Cai, M. Impact of urbanization and land-use change on climate. Nature 2003, 423, 528–531. [Google Scholar] [CrossRef] [PubMed]
Figure 1. The distribution of nine regions: A (Xinjiang), B (Inner Mongolia), C (Notheast China), D (North China), E (Sichuan Basin), F (Southwest China), G (Central China), H (coastal area), and I (Tibetan Plateau).
Atmosphere 10 00804 g001
Figure 2. Spatial patterns of the long-term (1979–2011) mean annual near-surface wind speeds (unit: m·s−1) over China: (a) CN05.1, (b) NCEP-2, (c) MERRA, (d) JRA-55, (e) ERA-Interim, and (f) 20CR.
Atmosphere 10 00804 g002
Figure 3. Taylor diagram for displaying pattern statistics during annual (a), spring (b), summer (c), autumn (d), and winter (e) from 1979 to 2011. The numbers represent the China and nine regions, 1–10 represent China-I region respectively. The colors represent the different reanalysis datasets: NCEP-2 (red), MERRA (blue), JRA-55 (green), ERA-Interim (purple), and 20CR (yellow). The axis means the standardized deviations (Normalized) between reanalysis and observation. The angular coordinate means the pattern correlation coefficient between reanalysis and observation.
Atmosphere 10 00804 g003
Figure 4. Annual cycle of near-surface wind speed (unit: m·s−1) for CN05.1 (a), NCEP-2 (b), MERRA (c), JRA-55(d), ERA-Interim (e), and 20CR (f) over China (black), A (red), B (green), C (blue), D (yellow), E (purple), F (orange), G (pink), H (mauve), and I (tan) region. A–I represent different subregions shown in Figure 1.
Atmosphere 10 00804 g004
Figure 5. Linear trends (unit: m·s−1 per decades) of annual, spring, summer, autumn, and winter mean near-surface wind speeds for the observation (column) and reanalysis datasets (star) NCEP-2 (red), MERRA (blue), JRA-55(green), ERA-Interim (purple), and 20CR (yellow), respectively, over China (a) and nine subregions (bj).
Atmosphere 10 00804 g005
Figure 6. Spatial distributions of linear trends for mean annual near-surface wind speeds (unit: m·s−1·10a−1) from 1979 to 2011 for (a) CN05.1, (b) NCEP-2, (c) MERRA, (d) JRA-55, (e) ERA-Interim, and (f) 20CR. Areas with above 0.05 significance level using the Student’ s t-test are dotted.
Atmosphere 10 00804 g006
Figure 7. Time series of anomalous near-surface wind speed (unit: m·s−1) in annual (a), spring (b), summer (c), autumn (d), and winter (e) averaged over the continental China derived from CN05.1 (black), NCEP-2 (red), MERRA (green), JRA-55 (blue), ERA-Interim (purple), and 20CR (yellow).
Atmosphere 10 00804 g007
Figure 8. Interannual standard deviations of mean annual near-surface wind speed (units: m·s−1) during 1979 to 2011 over continental China: (a) observation, (b) NCEP-2, (c) MERRA, (d) JRA-55, (e) ERA-Interim, and (f) 20CR.
Atmosphere 10 00804 g008
Table 1. Detailed information of the five reanalysis datasets used in this study.
ProvidersTime PeriodeResolutionAssimilation Algorithm
NCEP-2NCEP + DOE1979–20112.5° × 2.5°3DVAR SSI
MERRANASA + GMAO1979–20111/3° × 2/3°GEOS-5 DAS
JRA-55JMA1979–20111.25° × 1.25°4DVAR
ERA-InterimECMWF1979–20110.75° × 0.75°4DVAR
20CRNOAA + DOE1979–20112.5° × 2.5°Ensemble Kalman Filter
Table 2. The domain-averaged near-surface wind speeds (unit: m·s−1) over China in annual, spring, summer, autumn, and winter.
AnnualSpringSummerAutumnWinter
CN05.12.8713.3562.7852.6192.732
NCEP-22.9012.7242.6442.6123.617
MERRA2.2632.3361.6872.1042.922
JRA-551.251.3480.9341.1511.568
ERA-Interim1.6671.6511.3451.5952.076
20CR2.1962.1772.3521.912.34
Table 3. The temporal correlation coefficients of anomalous near-surface wind speeds during 1979 to 2011 over China between observed data and five reanalysis datasets.
AnnualSpringSummerAutumnWinter
NCEP-20.3580.5020.0370.3090.228
MERRA0.5450.5780.50.580.321
JRA-550.5770.5650.5580.5420.418
ERA-Interim0.4230.4410.4540.4080.236
20CR0.3560.4610.3050.220.073

