Article

Evaluation of the Rossby Centre Regional Climate Model Rainfall Simulations over West Africa Using Large-Scale Spatial and Temporal Statistical Metrics

1
School of Computer and Software, Nanjing University of Information Science and Technology, Nanjing 210044, China
2
Jiangsu Engineering Center of Network Monitoring, Nanjing University of Information Science and Technology, Nanjing 210044, China
3
Collaborative Innovation Center on Forecast and Evaluation of Meteorological Disasters/Key Laboratory of Meteorological Disaster, Ministry of Education, Nanjing University of Information Science and Technology, Nanjing 210044, China
4
School of Atmospheric Science, Nanjing University of Information Science and Technology, Nanjing 210044, China
5
School of Geographical Sciences, Nanjing University of Information Science & Technology, Nanjing 210044, China
6
Information Technology Department, King Saud University, Riyadh 11451, Saudi Arabia
7
Nanjing Institute of Technology, Jiangsu, Nanjing 211167, China
*
Author to whom correspondence should be addressed.
Atmosphere 2019, 10(12), 802; https://doi.org/10.3390/atmos10120802
Submission received: 27 October 2019 / Revised: 22 November 2019 / Accepted: 10 December 2019 / Published: 12 December 2019
(This article belongs to the Section Meteorology)

Abstract

:
Climate models are usually evaluated to understand how well the modeled data reproduce specific application-related features. In Africa, where multisource data quality is an issue, there is a need to assess climate data from a general perspective to motivate such specific types of assessment, but mostly to serve as a basis for data quality enhancement activities. In this study, we assessed the Rossby Centre Regional Climate Model (RCA4) over West Africa without targeting any application-specific feature, while jointly evaluating its boundary conditions and accounting for observational uncertainties. Results from this study revealed that the RCA4 signal highly modifies the boundary conditions (global climate models (GCMs) and reanalysis data), resulting in a significant reduction of their biases in the dynamically downscaled outputs. The results, with respect to the observational ensemble members, are in line with the differences between the observation datasets. Among the RCA4 simulations, the ensemble mean outperformed all individual simulations regardless of the statistical metric and the reference data used. This indicates that the RCA4 adds value to GCMs over West Africa, with no influence of observational uncertainty, and its ensemble mean reduces model-related uncertainties.

1. Introduction

Global climate models (GCMs) represent the scientific basis of what is known about the overall climate system, including its components, processes, and their different interactions. GCMs are therefore a fundamental tool for understanding climate variations and dynamics. Unlike other climate data sources, such as satellite, radar, and on-site measurement data where only the past and present climate is measured or estimated, GCM outputs are provided with past, present, and future climate variables. This feature thus allows a variety of applications that were infeasible with past and present climate data repositories. Although useful for general climate information purposes, GCMs suffer from uncertainty in process representation, error propagation, uncertainty in observational data, and sensitivity in resolution [1]. This final drawback is particularly common when GCMs are used to resolve regional-scale features due to being originally designed to serve global needs in terms of providing likely accurate climate information. A common and widely adopted solution within the climate research community is the use of high-resolution regional climate models (RCMs) driven by GCMs or reanalysis data as boundary conditions of the domain area being modeled [2].
Like GCMs, RCMs result from the representation of climate processes, but with a particular emphasis on resolving regional-scale climate features. As improved and regionally resolved versions of GCMs, the availability of RCMs for past, present, and future climate data has provided new possibilities not only for understanding regional-scale historical climate phenomena, but also for inferring their likelihood in the future. RCMs are thus important tools for local governments, institutions, researchers, and local communities [1,3].
The improvements in resolution provided by RCMs are not error-free. Being derived from GCM data means RCMs might be subjected to GCM-inherited errors [4]. The various uses of regional climate data suggest that different assumptions and considerations are required for different features and metrics with respect to the domain of application and highlight the need for systematic methods of identifying well-performing datasets. The awareness of the scientific climate community to such problems has resulted in a set of practices widely known as model validation.
Since the Intergovernmental Panel on Climate Change (IPCC) Assessment Report 1, the community has significantly improved our understanding of the climate system. The increase in the power and availability of computers has helped to considerably progress climate science. The different phases of the Coupled Model Intercomparison Project (CMIP) [5], under the auspices of the World Climate Research Program (WCRP), have consistently provided a wide range of datasets to advance the boundaries of climate science. This is particularly true for CMIP phases, such as CMIP3 [6] and CMIP5 [7], from which most of the present-day climate information is derived. Although the understanding of the global and regional climate systems has improved, climate models must be continually evaluated to increase their accuracy.
For Africa, where climate change has been reported to impact many economic and social activities [8], evaluating climate models is of the highest priority to perfect our knowledge of the African climate system, but mostly for understanding the implications of climate change for Africa and for preparing adaptation and mitigation plans to face the negative impacts.
This pressing need has triggered a series of research projects and investigations in different regions of Africa. The inability of some GCMs to capture the main characteristics of climate variables, such as precipitation and temperature, has induced a unique avenue for the use of RCM output made available through the Coordinated Regional Downscaling Experiment (CORDEX) [3]. Many investigations [9,10,11,12,13,14,15] have been conducted under the CORDEX framework with a special interest in present and future African climate features. Some studies [15,16,17,18] have confirmed RCMs’ ability to reproduce general climate features and have strongly recommended their use for projecting climate variables over African regions.
Within African regions, West Africa is one of the most populated, with an economy fundamentally based on rain-fed agriculture [7]. The climate research community has undertaken many efforts to understand climate change impacts on the West African economy, with a special emphasis on rainfall. To strengthen these efforts, data collection and modeling projects, such as West African Monsoon Modeling and Evaluation (WAMME) [19,20], African Multidisciplinary Monsoon Analysis (AMMA) [21,22], and the ensemble-based predictions of climate changes and their impacts (ENSEMBLES) [23], were initiated. Evaluations of the CORDEX RCMs’ abilities to reproduce the West African monsoon, seasonal change, and climatology represent the key contributions [24,25,26,27] in terms of performance evaluation over the region.
According to studies surveyed in the IPCC Assessment Report 5 [1], most research projects related to model evaluation are performed for temperature and precipitation and can be categorized into two general tendencies in the model evaluation literature: (1) The use of large-scale performance metrics to quantify model agreement with observation, targeting broad features of model performance that are not related to any particular application; and (2) more specialized performance tests aimed at assessing aspects of simulations that might impact future projection. West African regional climate model assessment studies [24,25,26,27] almost all fall into the second abovementioned category. Concerning recent GCM-driven RCM simulations over Africa, very few studies [12,14,27] are available in the literature and use only one RCM over the whole African domain or some of its sub-areas. One such study is the one over West Africa [27] which focuses on the ability of the Rossby Centre Regional Climate Model (RCA4) to reproduce West African climate features using nine dynamically downscaled GCMs against the Global Precipitation Climatology Project (GPCP) product version 2.3.
Climate datasets are useful for many applications. For better insights of the general quality of precipitation RCM data in regions like West Africa, where gauge networks have a low density, it has been recently recommended [28,29,30,31,32] that accounting for observational uncertainties in gridded available datasets is crucial, and implies the use of more than one observation dataset for evaluation purposes, in order to avoid misleading evaluation conclusions. Being the result of a GCM–RCM model chain, evaluation of GCM-driven RCM outputs’ general quality must include broad assessment of GCMs in order to understand the potential improvements introduced by the RCMs with respect to different observations, as it was adopted in [12,14].
In this study, we apply the mentioned recent recommendations related to model assessment studies, over West Africa, using the RCA4 model, which downscales 10 GCMs as well as the ERA-Interim reanalysis data. Each pixel’s time series in the driven GCMs and the resulted RCM outputs are compared to the corresponding time series in the observational data to show the spatial variation of their agreement under different statistical metrics. To understand the variation over time, each time step’s maps in both the GCMs and the RCA4 outputs are compared to the corresponding map from observations. To provide evaluation results with respect to the native temporal resolution of the observational datasets without any aggregation or transformation, we restrict the analysis to the monthly scale.

2. Materials and Methods

2.1. Study Area

West Africa is a sub-region of the sub-Saharan part of Africa. As can be seen in Figure 1, West Africa is located approximately between latitudes 0° and 28° N and longitudes 20° W and 20° E. To allow the use of this study’s results in different domains, the United Nation geoscheme’s region and sub-region repartitions were used. West Africa borders the Gulf of Guinea to the south and the northern boundaries of Mauritania, Mali, and Niger to the north, and is surrounded by the Atlantic Ocean to the west and the Republic of Cameroon and the Republic of Chad to the east. As highlighted in Figure 1, the major high elevations over West Africa include the Air Mountains of Niger, the Jos Plateau of Nigeria, the Guinea Highlands, and the mountainous regions of the Fouta Djallon, which mostly receive higher amounts of rainfall throughout the year. As an area with a typical climate system known as the West African Monsoon (WAM), many studies [24,25,26,27] have investigated the ability of regional climate models to simulate the WAM. For the sake of brevity in result description, we refer to the southern part (0°–15° N) as the Guinea coast and the northern part (15° N and above) as the Sahel.

2.2. Data Description

2.2.1. Observation Data

The availability of observational data in Africa is a widely known problem. The issue is related to the rainfall gauge network in Africa having one of the lowest densities among all the continents, except for Antarctica [33]. In West Africa, the gauge network distribution is sparse and thus challenging due to the complex and non-uniform topography [34]. As suggested by Maidment et al. [35], rainfall estimates derived from satellite imagery, reanalysis, and the numerical weather prediction (NWP) model outputs are of greater importance in such areas. In conformity with recent recommendations in [28,29,30,31,32], concerning the importance of accounting for observational uncertainty when evaluating climate models, this study uses three observational datasets, namely the Climate Research Unit’s precipitation Time-Series data version 4.02 (CRU TS v4.02), the University of Delaware precipitation data version 5.01 (UDEL v5.01), and the Global Precipitation Climatology Project version 2.3 (GPCP v2.3). The three datasets are used to assess the performances of both the GCMs and the ERA-Interim reanalysis data, as well as their RCA4 downscaled versions.
The CRU datasets [36] were developed by the Climate Research Unit, from the School of Environmental Sciences of the University of East Anglia (Norwich, England). The latest version (CRU TS 4.02) used in this study is available from 1901 to 2017 overall land areas except for Antarctica at a 0.5° resolution. The CRU datasets provide a variety of estimates such as cloud cover, diurnal temperature range, frost day frequency, potential evapotranspiration, precipitation, relative humidity, sunshine duration, daily mean minimum and maximum temperatures, vapor pressure, wet day frequency, and wind speed. The precipitation product used in this study is essentially made of multi-source rain gauges. Only monthly precipitation data were used for a temporal span of 1980–2005.
The UDEL datasets [37] were developed by the Center for Climate Research and the Department of Geography, from the University of Delaware (Newark, United States of America). The latest version (UDEL v5.01) used in this study has a 1900–2014 time span, with a 0.5° spatial resolution available over land for only monthly timescales. The UDEL datasets provide only two estimates, which are precipitation, and air temperature estimates. In the present study, the monthly precipitation data, obtained from a combination of different gauge stations, are used for the study period of 1980–2005.
The GPCP datasets [38] were originally developed under the World Climate Research Programme (WCRP) with the support of an international group of precipitation experts. The latest version [39] (GPCP v2.3) used in this study is a merger of both rain gauges and a variety of satellite-derived precipitation estimates covering both land and oceans, available from 1979–present at a 2.5° spatial resolution. For the sake of uniformity among the observational datasets used in the present study, GPCP v2.3 precipitation monthly data are regridded at a 0.5° spatial resolution using bilinear interpolation to match CRU and UDEL’s grids with consideration of the 1980–2005 timespan.

2.2.2. RCM Data

We evaluated a set of RCM simulations driven by CMIP5 GCMs over West Africa. The RCM simulation outputs used here result from the dynamic downscaling of 10 CMIP5 GCMs and 1 reanalysis data using the RCA4, originally developed by the Swedish Meteorological and Hydrological Institute (SMHI) under the CORDEX initiative. RCA4 [40] is a product of major improvements on RCA3 [41]. The RCA4 simulated outputs are available for the CORDEX Africa domain at a spatial resolution of 0.44° × 0.44° (~50 × 50 km) with a temporal coverage ranging from 1951 to 2005. Only the historical simulations were used in this study. Details on the GCMs and the reanalysis data used in the downscaling experiment are provided in Table 1. The resulting outputs from the 10 CMIP5 models and the ERA-Interim reanalysis data, dynamically downscaled by RCA4 were obtained from the Deutsches Klimarechenzentrum GmbH (DRKZ) website [42].

2.3. Methods and Metrics

2.3.1. Data Preprocessing

The study has considered the historical period of 1980–2005 in accordance with the ERA-Interim data temporal span, in order to analyze the differences between GCMs and reanalysis forcing, while accounting for the impact of observational uncertainty on such results. The GPCP v2.3 precipitation dataset, which has a native spatial resolution of 2.5°, was regridded to a 0.5° spatial resolution that matches CRU TS v4.02 and UDEL v5.02 grids. The RCA4 version, interpolated from the 0.44° native spatial resolution to 0.5° resolution was acquired directly from [42], and used in this study, since the interpolated grids exactly match the observational dataset grids.
To further investigate and attribute potential biases in the RCA4 outputs, the parent GCMs were regridded to a 0.5° spatial resolution and evaluated with the same observational datasets. In order to explore possible physical attribution of the observed bias patterns, the differences between reanalyzed and simulated sea level pressure as well as the prevailing atmospheric circulation patterns over West Africa at different levels were investigated for the June–September (JJAS) season. Note that, for a complete attribution analysis over West Africa the availability of all the circulation levels is required to track low-level westerly flow, mid-level Africa Easterly Jet (AEJ), and upper-level Tropical Easterly Jet (TEJ). Unfortunately, only the 200, 500, and 850 hPa levels were available as part of the RCA4 dynamically downscaled output and were used to give an insight into what may explain the bias patterns detected in this study. Concerning the rainfall estimates, differences in the estimation units were noticed. The precipitation estimates from both GCM and RCM data were provided in terms of flux (kg/m2s), whereas the majority of the observational estimates were provided in terms of monthly accumulated rainfall amount (mm/month). To overcome this challenge, we converted the precipitation flux into monthly accumulated rainfall using every month’s data matrix with the following formula:
T m m / m o n t h = 86400 × n d a y / m o n t h ×   F kg / m 2 s
where T m m / m o n t h is the considered month’s data matrix in mm/month, 86,400 represents the number of seconds per day, n d a y / m o n t h is the number of days in the considered month, and F kg / m 2 s is the considered month’s original precipitation flux data matrix. For the remaining part of this manuscript, we refer to the short name in Table 1 as representing the GCMs or reanalysis data and we used “RCA4 (short name)” for the corresponding dynamically downscaled output.

2.3.2. Evaluation Metrics

The evaluation of GCMs and RCMs against observations is a challenging task since its outcomes can be misleading if not conducted carefully and objectively. Assessment studies are subject to, and dependent on, the objective functions selected or investigated. This is true in the context of RCM rainfall data, where mostly specific rainfall features are assessed [24,25,26,27]. Although one emerging tendency in recent years, is the general assessment of climate model data quality without any assumptions or any specific feature [1], few studies have investigated the aforementioned possibility for RCMs over West Africa.
To provide general quality assessment results without targeting any specific feature, we designed broad statistical metrics with an emphasis on the agreement between model outputs and the observational data from a spatiotemporal distribution viewpoint. The specific metrics we used included:
(1)
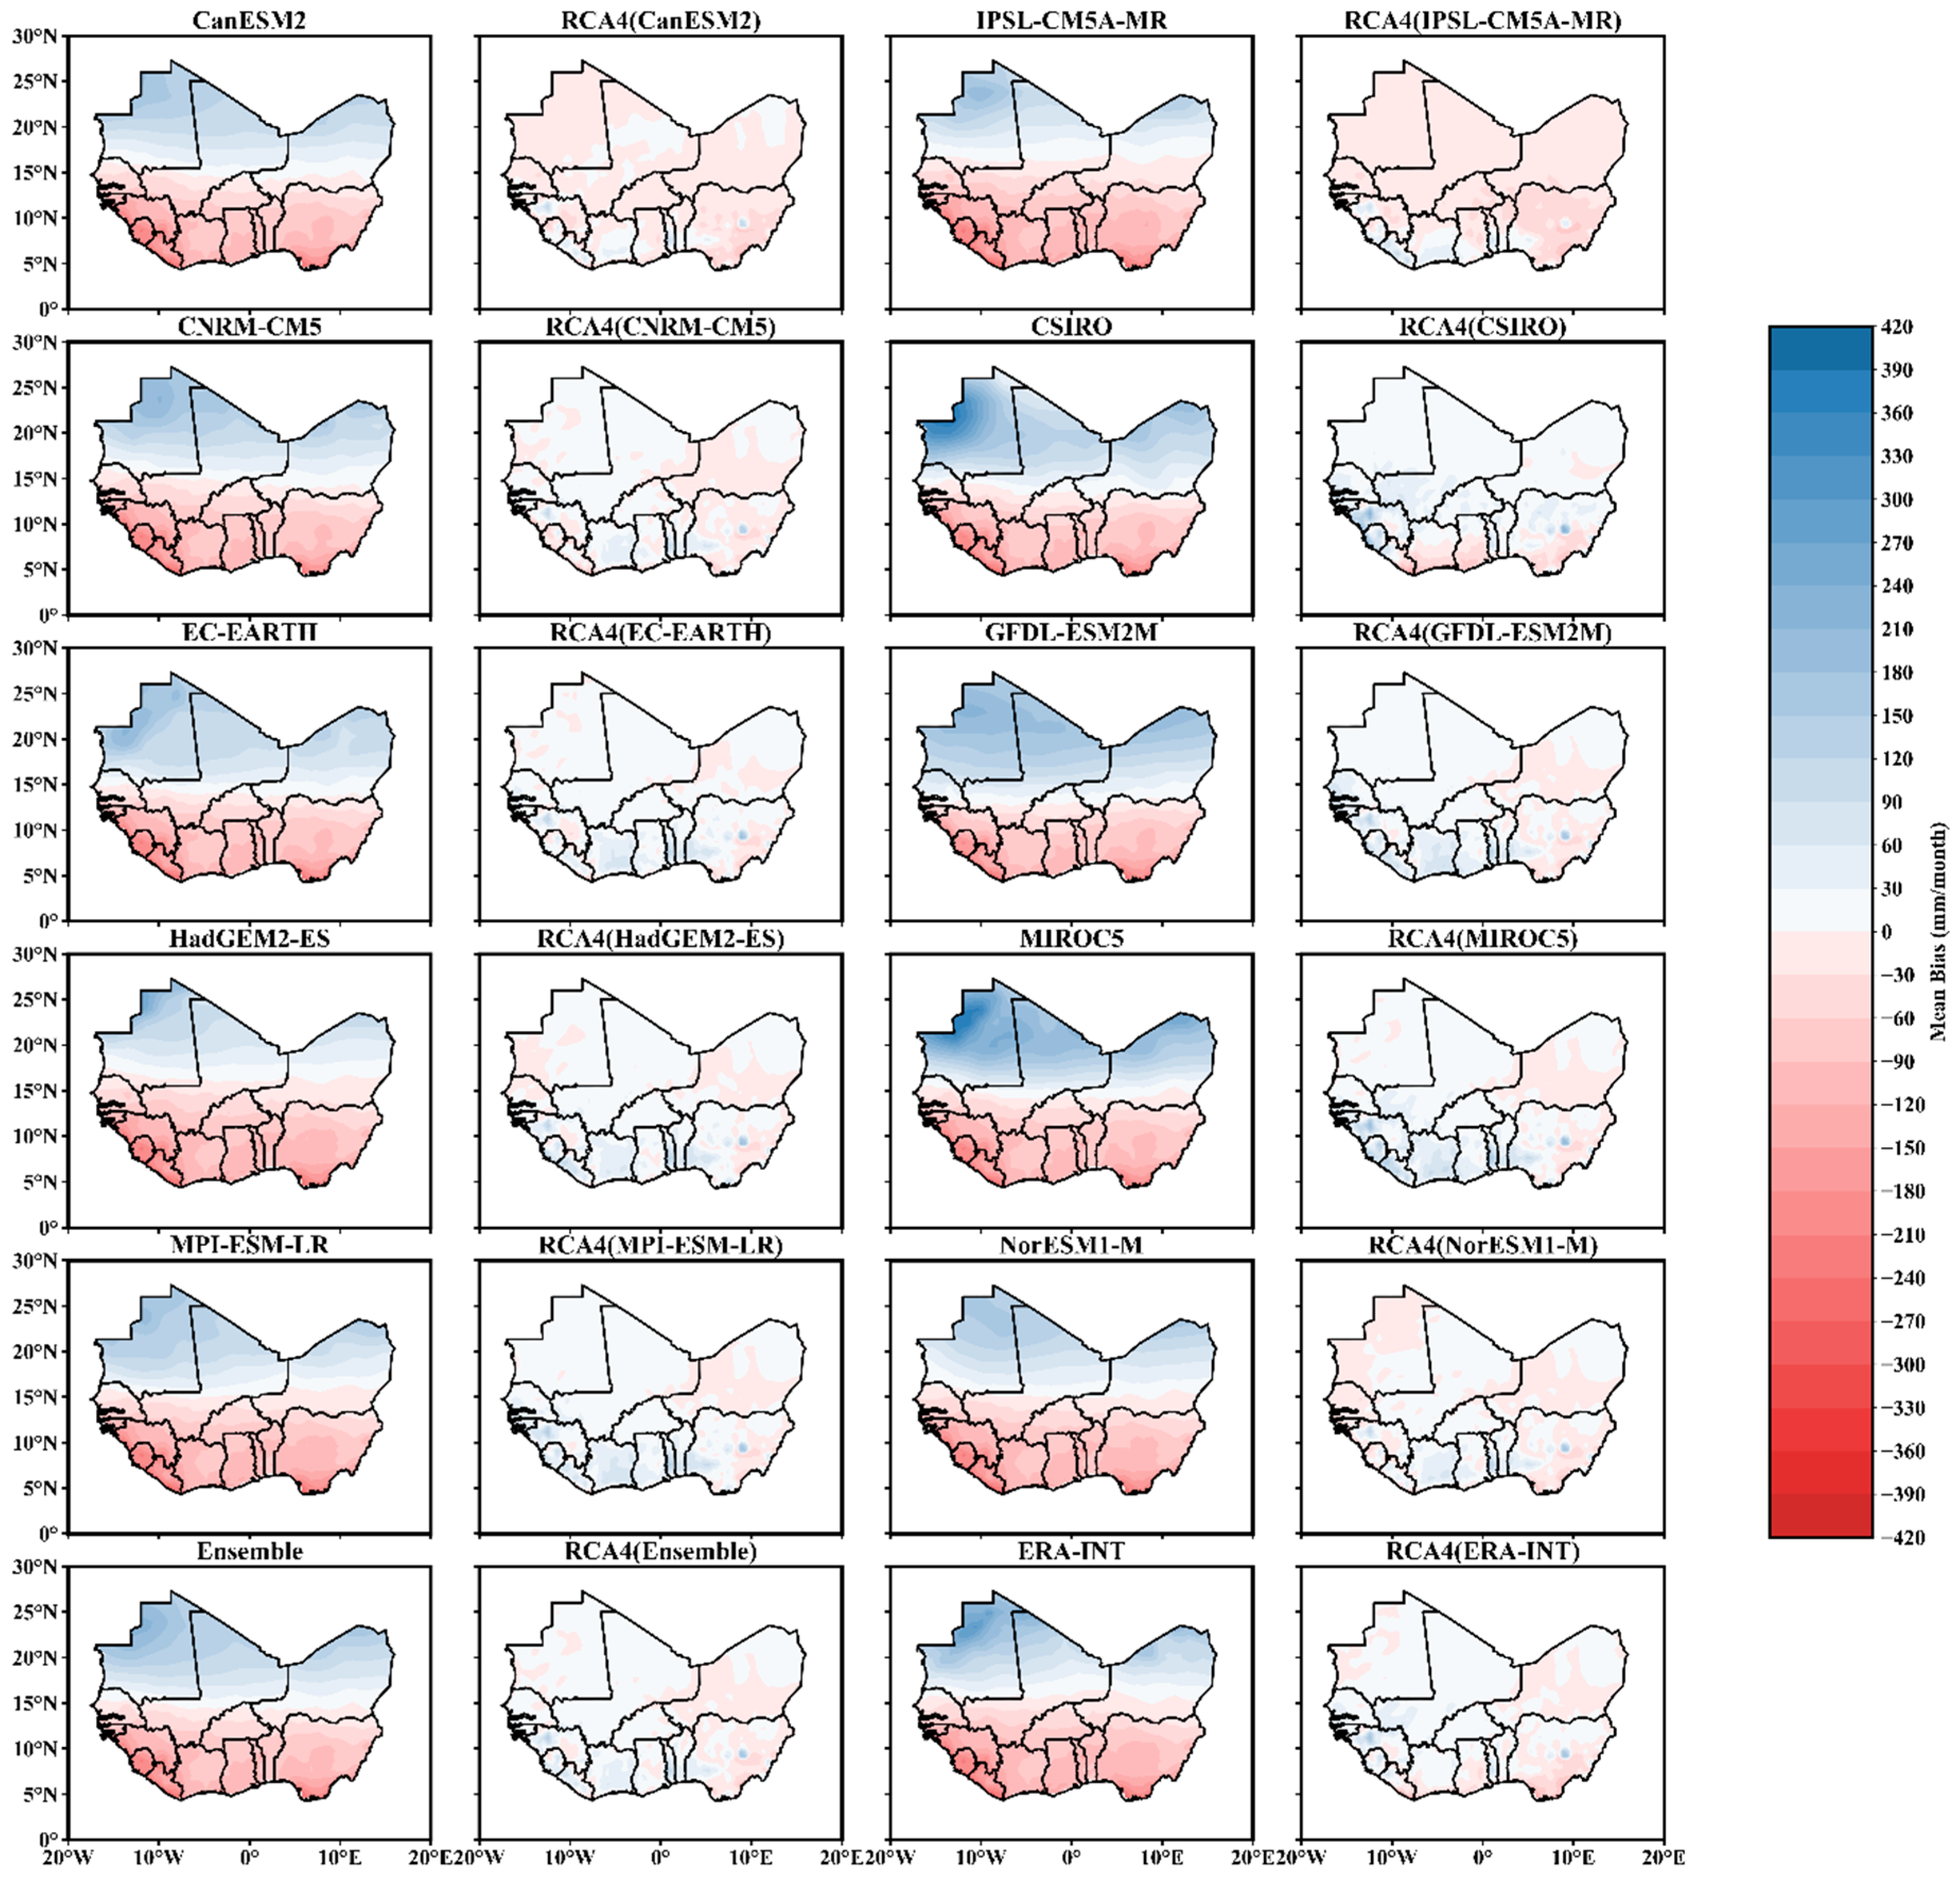
Spatial pattern of temporal mean bias (SPTMB): The pattern of the temporal mean bias between the RCMs and the reference data over each grid cell within the study area.
(2)
Spatial pattern of temporal 95th percentile bias (SPT95PB): The pattern of the temporal 95th percentile bias between the RCMs and the reference data over each grid cell within the study area.
(3)
Temporal pattern of spatial mean bias (TPSCC): the variation in the correlation coefficient between the RCMs and the reference map at each time step.
The listed metrics were obtained from well-known statistical metrics such as the mean bias (MB), and 95th percentile bias, customized to a space-and-time scenario. The mathematical formulas of the metrics are as follows:
M B = P M ¯ P O ¯
95 P B = P M 95 P O 95
C C = k = 1 N ( P o k P o k ¯ ) ( P M k P M k ¯ ) k = 1 N ( P o k P 0 k ¯ ) 2 k = 1 n ( P M k P M k ¯ ) 2
where P M ¯ is the mean of the model distribution, P O ¯ is the mean value of the observation distribution, P M 95 the 95th percentile of the model considered distribution, P O 95 the 95th percentile of the observation distribution. P M k is the model estimate for the considered data point k within the model distribution, P O k is the observed value for the considered data point k within the observation distribution, and N is the length of the distributions being analyzed.

3. Results

3.1. Observational Uncertainties

Gauge measured rainfall datasets are conventionally considered as “the ground truth” for alternative dataset evaluation. Unfortunately, straightforward use of the in situ dataset is often less attractive, due to the lack of spatial and temporal completeness. A widely adopted solution for such a problem is the uses of gridded datasets, which are derived from in situ data, and alternative high-quality datasets by the means of interpolation methods. Consequently, gridded datasets are subject to biases that may be related to the interpolation method employed or the density of the rain gauge network used. The latter drawback is particularly common in areas such as Africa where rain gauge networks are known to be uneven and scarce [33]. Due to the reliability on gridded datasets to carry on evaluation studies, one recent recommendation for better evaluation [28,29,30,31,32] has been the use of more than one observational dataset in order to account for uncertainties that may exist in such datasets and to assess their impact on evaluation results. In this section, we report the potential differences between the three observational datasets used in the present study emphasize on the spatial pattern of temporal mean and 95th percentile.
Figure 2 shows the spatial pattern of temporal mean of the three observation datasets used in this study on the top panel and the spatial pattern of the temporal 95th percentile in the bottom panel. The three datasets capture the spatial northward propagation and graduate retreat of rainfall, both in the mean and the 95th percentile, known to be one of the key rainfall feature over West Africa.
The gridded observational products additionally show relatively high rainfall bands (100–300 mm/month) in the mean over major parts of the Guinea coast and light ones over the Sahel, which fall in a range of 0 to 25 mm/month. This systematic distinction is better captured in the 95th percentile where rainfall amounts greater than 200 mm/month are observed over the Guinea coast, while rainfall amounts less than 200 mm/month are found over the Sahel. One noticeable feature present in all the observation datasets is the rainfall maxima located over the southern part of Nigeria as well the Guinea highlands shown in the mean and the 95th percentile results.
Slight differences are however present across the ensemble of observations especially over the Guinea Coast. For instance, unlike the GPCP v2.3, which shows a relatively smoothed east to west rain band over the Guinea coast, CRU TSv4.02 and UDEL v5.01 depict some discontinuities, especially over countries like Ivory Coast, Ghana, Togo, and Benin. The highest average rainfall amounts (250–300 mm/month) are observed with UDEL v5.01, particularly over Guinea highlands. Although relatively high values are present in CRU TSv4.02 and GPCP v2.3, they are lower than UDEL v5.01 respectively by a factor of nearly 20% and 30%. Overall, UDEL v5.01 spatially shows the highest mean and 95th percentile amplitudes, followed by GPCP v2.3 and CRU TSv4.02.

3.2. Evaluation Results

Figure 3 shows the SPTMB results with respect to CRU TSv4.02 for both the GCMs and their RCA4-based downscaled outputs. Overestimating tendencies across the ensemble of downscaled GCMs, with a light amplitude (0–30 mm/month) over the Sahel and relatively high overestimation features are observed over the Jos Plateau in Nigeria and the Atakora Mountains over Togo with amplitudes varying from 60–210 mm/month.
The mentioned overestimation is much pronounced (120–210 mm/month) especially over the Jos Plateau for all the simulations except RCA4 (CanESM2) and RCA4 (IPSL-CM5A-MR). All the simulations show major overestimation tendencies except RCA4 (CanESM2), and RCA4 (IPSL-CM5A-MR), for which underestimations are depicted over major parts of the study domain. For all the RCA4 ensemble members, slightly dry biases (–30 to 0 mm/month), are however present over the Air mountains of Niger whereas moderate (–30 to −60 mm/month) dry biases are observed over the southern part of Nigeria. The latter dry bias depicts a stronger gradient (60–120 mm/month), in RCA4 (CanESM2), and RCA4 (IPSL-CM5A-MR), while similar bias tendencies are observed at the extreme southern part of Nigeria in RCA4 (CSIRO) and RCA4 (NorESM1-M). The Ensemble mean typically outperformed all individual RCA4 simulations while sharing some features with the ERA-INT dynamically downscaled version, which shows a slightly larger spread in its bias values.
Unlike the RCA4-driven simulation, the GCMs and the ERA-INT (Figure 3) show systematic wet biases over the Sahel with a northward amplitude progression, while southward increasing dry biases are observed over the Guinea coast. High overestimation (120–240 mm/month) is found over the northwestern part of Mauritania, Mali, and Niger with specifically pronounced patterns (270–390 mm/month) in CSIRO and MIROC5. Dry biases are rather marked in all the GCM simulations with higher amplitude (150–210 mm/month) over the southern part of Nigeria and the Guinea Highlands.
Further investigation considering the 95th percentile of each pixel over West Africa, with respect to the CRU TSv4.02, resulted in the SPT95PB findings (Figure 4). From Figure 4, we observe a northward increase of the overestimating bias gradient over the Sahel, and the southward increase of the underestimating gradient over the Guinea Coast for the GCMs are depicted with a highly pronounced pattern (similar to Figure 3 and consistent with literature). These similarities are also observed over areas, such as the northern part of Nigeria and the Guinea highlands, with high underestimation biases ranging from −450 to −300 mm/month as well as the Air Mountains of Niger and the northwestern part of Mauritania, where overestimation biases are found to be above 600 mm/month. CSIRO and MIROC5 were found to show extremely wet biases (750–1000 mm). A significant improvement is clearly visible among the ensemble of RCA4 dynamically downscaled GCMs with a slightly strong gradient than that of the mean bias results in Figure 3, which depicts clearly pronounced patterns over the Jos Plateau, the Guinea highlands, and the Atakora Mountains.
The evaluation exercise with consideration of the GPCP v2.3 as the reference dataset for GCMs and their RCA4 regionally resolved versions was equally carried out using the SPTMB and the SPT95PB. The results presented in Figure 5 and Figure 6 indicate striking similarities of the GCMs and RCA4 outputs performances with those observed with CRU TS v4.02 as the reference dataset. Exceptions are however found in the ensemble of RCA4 dynamically downscaled members, such as RCA4 (CanESM2), RCA4 (IPSL-CM5A-MR), RCA4 (NorESM1-M), and RCA4 (ERA-INT), for which the underestimation patterns observed over the Sahel are more expanded. Figure 6 still shows a pronounced gradient compared to Figure 5, and a clear highlight of high overestimation biases over the JOS plateau, the Guinea highlands, and the Atakora Mountains. The RCA4 ensemble mean outperformed all individual simulations while showing slight differences over the Sahel in comparison with the RCA4 (ERA-INT). Among the ensemble of GCMs, the particularly less-pronounced underestimation pattern, depicted along the Guinea highlands can be explained by the fact that GPCP v2.3 has the lowest rainfall amounts over the specific area.
The SPTMB and the SPT95PB results with respect to the UDELv5.01 observational datasets (as shown in Figure 7 and Figure 8) tend not to deviate much from previous results, in conformity with the slight differences observed among the three observational datasets used in the present study. The performances, with respect to UDEL v5.01, replicate some of the GPCP v2.3 results, especially those observed with RCA4 (CanESM2), RCA4 (IPSL-CM5A-MR), RCA4 (NorESM1-M), and RCA4 (ERA-INT). The higher mean rainfall values of the UDEL v5.01 observed in Figure 2 tend to influence the GCMs results by showing high underestimation over the Guinea highlands, but mostly by extending the southern Nigerian dry biases northward, while covering new areas like the southern part of Togo and Ghana.
This particular feature is the direct consequence of the UDEL v5.01 related discontinuities observed along the coastal high amplitude rainfall band in comparison with GPCP v2.3, for which the mentioned band appears to be much smoother.
Overall, results clearly highlight a systematic reduction of biases in the RCA4 regional climate model outputs compared with the driving GCMs and the ERA-INT reanalysis data, regardless of the observational ensemble member used for validation. This is further confirmed from the TPSCC results presented in Figure 9, where the monthly averaged spatial correlation coefficient shows a significant improvement with respect to the three observational datasets. In fact, the parent GCMs and the ERA-INT reanalysis data show negative correlation values throughout the year, with values ranging mostly from 0 to −0.8, while their RCA4 downscaled versions report positive correlation values ranging mostly from 0.4 to 0.9. In accordance with results from the SPTMB and the SPT95PB, the RCA4 dynamically downscaled ensemble mean and RCA4 (ERA-INT) show the highest correlation coefficient throughout the year. It is however worth mentioning that, the GPCP v2.3 datasets tend to show inferior results to those of CRU v4.02 and UDEL v5.01, which may be due to the observational differences. The relatively low correlation coefficient observed in dry months such as December, January, and February is probably due to relatively large year to year variability in those months.
Figure 10 and Figure 11 give a summarized illustration of the present study by presenting the SPTMB and SPT95PB results from a distributional point of view, for both the GCMs and the RCA4-based downscaling versions, while accounting for the performances with respect to the three observational datasets. The results show that in general, the GCMs and the ERA-INT dataset majorly underestimated the three observational datasets, with a spread in line with the differences observed within the observational ensemble for both the mean bias and the 95th percentile. Regardless of the reference data and the statistical metric that is used, the results of the RCA (ERA-INT) show a systematic reduction from the extremely dry to median biases, by roughly 100 mm/month for the mean bias and by 350 mm/month for the 95th percentile bias, indicating good performances of the RCA4 regional model. These results are further improved in RCA4 simulations driven by IPSL-CM5A-MR, CNMR-CM5, EC-EARTH, HadGEM2-ES, MIROC5, and MPI-ESM-LR which result in good performances of the RCA4 ensemble mean for both the mean bias and the 95th percentile bias results. In accordance with previously described results, CSIRO- and GFDL-ESM2M-driven RCA4 results appeared to show the most deviating performances for all the metrics and the reference datasets. Slightly larger uncertainties are observed for the 95th percentile bias GCM-driven downscaling results with respect to the observational data used but show a tendency to be canceled out by the ensemble mean.
Overall, observational uncertainties do not affect the mean biases but can become challenging when dealing with months with extreme rainfall amounts. The ensemble mean appeared in the case of West Africa, to confirm the fact that the ensemble mean could be a prominent uncertainty reducer.
Figure 12, Figure 13 and Figure 14 depict the sea level pressure, overlaid respectively by the wind direction at 200,500 and 850 hPa. The results show that the Guinea coast is dominated by strong high pressure, whereas the Sahel depicts a ridge of weak high pressure. Both the GCMs and their corresponding downscaled versions capture this major feature except in the GFDL-ESM2M model. This feature can be directly related to the northward gradual retreat of rainfall over West Africa, but cannot convincingly explain the biases from both GCMs and their dynamically downscaled version. At 200 hPa (Figure 12), the simulation clearly depicts the well-known Tropical Easterly Jet (TEJ) [43,44] which is concentrated around 5° to 10° N with a maximum speed of 22 m/s. Weakened wind patterns are however depicted over the major part of the Sahel with respect to ERA-INT and its dynamically downscaled version. However, slightly pronounced speeds are present in the RCA4 outputs, especially in the eastern part of the Sahel.
At 500 hPa (Figure 13), both the GCMs and their dynamically downscaled version show almost the same wind direction pattern with respect to ERA-INT and RCA4 (ERA-INT) with a maximal speed of 11 m/s. Although being a bit far from the often-used level (650–700 hPa) for the AEJ [43,44], the results from Figure 13 depicts wind direction with a similar structure. Weaker magnitudes are observed between the 10° to 20° N along the whole study area for GCMs, while those weaker magnitudes are concentrated only over Mauritania and Mali for the dynamically downscaled versions.
At 850 hPa (Figure 14), westerlies known as West African Westerly Jet (WAWJ) [26] originated from the Atlantic Ocean and moving eastward are well depicted by the GCMs but exhibit noticeable recurved direction that could be justified by the topographic and regionally resolved features integrated by the downscaling process. These westerlies are mostly located within 0° to 10° N with a maximum speed of 9 m/s while the Sahel is overlaid by easterlies. This easterlies are mostly weak in the GCMs between 10° to 20° N compared to their downscaled versions but tend to be as strong as the westerlies after the 20° N. This particular feature suggests a relatively high overestimation of the wind speed within the 10° and the 20° N with respect to ERA-INT and RCA4 (ERA-INT), especially over Mali and Niger.

4. Discussion

The results of the study have shown that the systematic GCM bias reduction by the RCA4 regional model is improved for both general statistical features, such as the SPTMB and the SPT95PB, regardless of the observational ensemble member. This improvement was also observed between the ERA-INT and its RCA4 dynamically downscaled version. The fundamental reason for such improvement is related to the fact that GCMs are tuned based on the agreement between the global mean top-of-atmosphere energy balance and observations [45], while RCMs are calibrated with respect to the current climate simulation driven by reanalysis [46]. This is justifiable by the fact that GCMs are produced to provide global mean estimates, while RCMs focus on producing a regionally resolved distribution of key variables such as precipitation and temperature. A particular source of such a bias reduction is thus less likely, but one plausible reason might reside in the major conceptual differences between GCMs and RCMs. Furthermore, the assessment of sea level pressure and wind speed at 200,500 and 850 hPa (Figure 12, Figure 13 and Figure 14) generally show relatively similar patterns in depicting the majors circulation features over West Africa and reinforces the idea that the RCA4 bias reduction might not be the resulting effect of a better representation of general circulation patterns over West Africa. Even if such aspects of the RCA4 may help explain the relatively good downscaling results, there is a need to have circulation-related quantities at all the different levels for a complete attribution study. More importantly, the extent to which the RCA4 model has been tuned to agree with present-day climate should be clearly stated by modelers, in order to ensure whether the downscaling experiment resulted in good performances because of an improvement of the dynamics or just because of model post-processing and tuning activities as it was suggested by Knutti et al. [47].
The quantitative nature of the reduction introduced by the RCA4, as shown in Figure 9, Figure 10 and Figure 11 obviously suggests that the RCA4 regional signal strongly influences the boundary conditions from driven-GCMs as pointed out in [48]. For the West African area, it is however worth mentioning as shown in Figure 10 and Figure 11, and described in the previous section, that the RCA4’s influence varies with respect to the type of boundary condition but also the feature being assessed. This explains why the bias spread in ERA-INT is different from the one from GCM-driven simulation, and more importantly the general spread differences between the SPTMB and SPT95PB. Overall, these particular features of the RCA4 represent substantial evidence against the general skepticism related to the value-added by regional climate models.
One major concern of this study was the consideration of observational uncertainty by using three observational datasets, in order to assess its potential impact on the evaluation results. As it can be seen from Figure 3, Figure 4, Figure 5, Figure 6, Figure 7 and Figure 8, the RCA4 outputs are within the observational uncertainties, although slight uncertainty from driving models is also present in GCM-driven outputs. The best performing RCA4 ensemble members like RCA4 (IPSL-CM5A-MR), RCA4 (CNMR-CM5), RCA4 (EC-EARTH), RCA4 (HadGEM2-ES), RCA4 (MIROC5), and RCA4 (MPI-ESM-LR) are equally not influenced by observational uncertainty.
The same conclusions were suggested by Nukulini et al. [15], stating that the biases of many RCMs over Africa were comparable with observational differences in terms of magnitude. The persistent biases observed in all the RCA4 simulations, with respect to the three observational datasets, located over the Jos Plateau in Nigeria, the Atakora mountains in Togo, and the Guinea highlands, reinforce the idea of shared biases among the observational ensemble used in this study, and are in line with the findings reported by Akinsanola et al. [27]. The presence of such biases over commonly known highlands and areas over West Africa indicate, as underlined by Sylla et al. [49], that the RCA4 model’s shortcomings might be related to the schemes representing small-scale processes such as the complex orography and the atmospheric deep convection which are the key drivers of the West African rainfall variability.
Further cautionary notes concerning the factors like the RCA4’s internal variability and the performance metrics employed in this study, are essential for the use of these results. It is also worth mentioning that the purpose of this study was to assess the RCA4 model’s general quality without targeting any specific application-related feature. Thus, the results from this study may be altered when specific type of assessments are conducted, since the ensemble of RCA4 outputs have their pros and cons.
The present findings however represent the first attempt toward general assessment of regional climate model simulations over West Africa and can constitute a basis for regional model post-processing or model output statistics such as bias-correction, statistical downscaling, and model ensemble averaging, which are usually applied to datasets as a whole. This is true in the context of model uncertainty reduction, for which the simple ensemble average turned out to be a good solution in the context of this study. The diverse performances observed among the ensemble of GCM-driven RCA4 simulations indicate that a weighted ensemble approach might further enhance uncertainty reduction. Finally, yet importantly, the diverse spatial variability of biases observed among the RCA4 outputs can represent a basis for a grid-based ensemble weighting algorithm.

5. Conclusions

In this study, we comprehensively evaluated the Rossby Centre Regional Climate Model (RCA4) dynamical downscaling experiment driven by GCMs and reanalysis over West Africa. The driving GCMs and reanalysis data, as well as their RCA4, regionally-resolved versions were evaluated with respect to three observational datasets, namely the CRU TS v4.02, the UDELv5.01, and the GPCP v2.3 datasets, for the sake of accounting for observational uncertainties and understanding their effect on the evaluation results. In order to provide a broad type of assessment without targeting specific application-related features, we introduced three performance metrics: the SPTMB, the SPT95PB, and the TPSCC, as they reflect key performance features from a general point of view.
Our investigation provides insightful findings on the general performance of the RCA4 dynamical downscaling experiment outputs and their GCMs and reanalysis driving boundary conditions while highlighting the improvement introduced by the experiment with respect to the spatiotemporal performance metrics. Northward progressing wet biases over the Sahel and southward increasing dry biases represent the principal structure of GCMs and ERA-Interim biases, whereas the strongly influencing RCA4 signal is found to significantly reduce biases from the different boundary conditions and thus producing outputs with better results. The RCA4 results appeared to be within the observational uncertainty ranges; although a slight influence of driving model uncertainties was observed within the ensemble mean of GCM-driven simulations. The ensemble of GCM-driven RCA4 simulations outperformed all individual ensemble members and was found to be a good model uncertainty reducer with respect to all the observational ensemble members. Individual RCA4 ensemble members such as RCA4 (IPSL-CM5A-MR), RCA4 (CNMR-CM5), RCA4 (EC-EARTH), RCA4 (HadGEM2-ES), RCA4 (MIROC5), and RCA4 (MPI-ESM-LR) appear to show relatively good results. Some persistent biases were however found over the JOS plateau, the southern part of Nigeria, the Guinea highlands, and the Atakora mountains suggesting RCA4 deficiencies in representing small-scale processes over West Africa. A complete attribution of such biases was not possible due to the fact that circulation quantities were not available for all levels. The differences observed between the GCMs and their downscaled versions for the wind speed at 200, 500, and 850 hPa levels were not sufficient to draw a conclusion especially in the context of regional climate modeling where some fine-tuning activities take place.
As a result, from a broad type of assessment with the sake of exploring the general quality of the RCA4 outputs, the findings from this study might be used for model post-processing and enhancing activities such as bias-correction, statistical downscaling, and ensemble averaging. Gridded spatial metrics-based data quality enhancement could represent a valuable application of the results from this study and will be explored in upcoming studies.

Author Contributions

Conceptualization, G.T.G. and T.M.; methodology, G.T.G. and T.M.; software, G.T.G.; validation, T.M., G.T., and A.A.; formal analysis, G.T.G. and I.K.N.; investigation, G.T.G., T.M., G.T., and A.A.; resources, T.M., G.T., and A.A.; data curation, G.T.G. and B.A.; writing—original draft preparation, G.T.G., T.M., G.T., and Y.T.; writing—review and editing, G.T., A.A., I.K.N., and Y.T.; visualization, G.T.G. and T.M.; supervision, T.M.; project administration, T.M., G.T., and A.A.; funding acquisition, T.M., A.A., and Y.T.

Funding

This work was supported in part by the National Science Foundation of China (No. U1736105, No. 61572259) and by a grant from the Research Center of the Female Scientific and Medical Colleges, Deanship of Scientific Research, King Saud University.

Acknowledgments

We are grateful to WCRP and START for setting up and funding the CORDEX-Africa initiative as well as all the downscaling groups and institutions that made their results available to the public. We are also grateful to the Climate Research Unit (CRU) and the University of Delaware, for granting access to the observational datasets in accordance with their specific data use and citation policies. The first author especially acknowledges Nanjing University of Information Science and Technology for granting him the scholarship under which the present study was conducted.

Conflicts of Interest

The authors declare no conflict of interest.

References

  1. IPCC. Climate Change 2013: The Physical Science Basis. In Contribution of Working Group I to the Fifth Assessment Report of the Intergovernmental Panel on Climate Change; Stocker, T.F., Qin, D., Plattner, G.-K., Tignor, M., Allen, S.K., Boschung, J., Nauels, A., Xia, Y., Bex, V., Midgley, P.M., Eds.; Cambridge University Press: Cambridge, UK; New York, NY, USA, 2013; 1535p. [Google Scholar] [CrossRef] [Green Version]
  2. Giorgi, F. Regional climate modeling: Status and perspectives. J. Phys. IV (Proc.) 2007, 139, 101–118. [Google Scholar] [CrossRef]
  3. Giorgi, F.; Jones, C.; Asrar, G.R. Addressing climate information needs at the regional level: The CORDEX framework. World Meteorol. Organ. (WMO) Bull. 2009, 58, 175. [Google Scholar]
  4. Hong, S.Y.; Kanamitsu, M. Dynamical downscaling: Fundamental issues from an NWP point of view and recommendations. Asia-Pac. J. Atmos. Sci. 2014, 50, 83–104. [Google Scholar] [CrossRef]
  5. Meehl, G.A.; Boer, G.J.; Covey, C.; Latif, M.; Stouffer, R.J. The Coupled Model Intercomparison Project (CMIP). Bull. Am. Meteorol. Soc. 2000, 81, 313–318. [Google Scholar] [CrossRef] [Green Version]
  6. Meehl, G.A.; Covey, C.; Delworth, T.; Latif, M.; McAvaney, B.; Mitchell, J.F.B.; Taylor, K.E. THE WCRP CMIP3 Multimodel Dataset: A New Era in Climate Change. Res. Bull. Am. Meteorol. Soc. 2007, 88, 1383–1394. [Google Scholar] [CrossRef] [Green Version]
  7. Taylor, K.E.; Stouffer, R.J.; Meehl, G.A. An Overview of CMIP5 and the Experiment Design. Bull. Am. Meteorol. Soc. 2012, 93, 485–498. [Google Scholar] [CrossRef] [Green Version]
  8. IPCC. Climate Change 2007: The Physical Science Basis: Contribution of Working Group I to the Fourth Assessment Report of the Inter-Governmental Panel on Climate Change; Cambridge University Press: Cambridge, UK, 2007. [Google Scholar]
  9. Laprise, R.; Hernández-Díaz, L.; Tete, K.; Sushama, L.; Šeparović, L.; Martynov, A.; Valin, M. Climate projections over CORDEX Africa domain using the fifth-generation Canadian Regional Climate Model (CRCM5). Clim. Dyn. 2013, 41, 3219–3246. [Google Scholar] [CrossRef] [Green Version]
  10. Buontempo, C.; Mathison, C.; Jones, R.; Williams, K.; Wang, C.; McSweeney, C. An ensemble climate projection for Africa. Clim. Dyn. 2014, 44, 2097–2118. [Google Scholar] [CrossRef] [Green Version]
  11. Mariotti, L.; Diallo, I.; Coppola, E.; Giorgi, F. Seasonal and intraseasonal changes of African monsoon climates in 21st century CORDEX projections. Clim. Chang. 2014, 125, 53–65. [Google Scholar] [CrossRef]
  12. Dosio, A.; Panitz, H.-J.; Schubert-Frisius, M.; Lüthi, D. Dynamical downscaling of CMIP5 global circulation models over CORDEX-Africa with COSMO-CLM: Evaluation over the present climate and analysis of the added value. Clim. Dyn. 2015, 44, 2637–2661. [Google Scholar] [CrossRef] [Green Version]
  13. Dosio, A. Projection of temperature and heat waves for Africa with an ensemble of CORDEX Regional Climate Models. Clim. Dyn. 2016, 49, 493–519. [Google Scholar] [CrossRef]
  14. Moufouma-Okia, W.; Jones, R. Resolution dependence in simulating the African hydroclimate with the HadGEM3-RA regional climate model. Clim. Dyn. 2015, 44, 609–632. [Google Scholar] [CrossRef]
  15. Nikulin, G.; Jones, C.; Giorgi, F.; Asrar, G.; Büchner, M.; Cerezo-Mota, R.; Christensen, O.B.; Déqué, M.; Fernandez, J.; Hänsler, A.; et al. Precipitation climatology in an ensemble of CORDEX-Africa regional climate simulations. J. Clim. 2012, 25, 6057–6078. [Google Scholar] [CrossRef] [Green Version]
  16. Jenkins, G.S.; Gaye, A.T.; Sylla, B. Late 20th century attribution of drying trends in the Sahel from the Regional Climate Model (RegCM3). Geophys. Res. Lett. 2005, 32. [Google Scholar] [CrossRef]
  17. Sylla, M.B.; Giorgi, F.; Stordal, F. Large-scale origins of rainfall and temperature bias in high-resolution simulations over southern Africa. Clim. Res. 2012, 52, 193–211. [Google Scholar] [CrossRef] [Green Version]
  18. Diallo, I.; Giorgi, F.; Sukumaran, S.; Stordal, F.; Giuliani, G. Evaluation of RegCM4 driven by CAM4 over Southern Africa: Mean climatology, interannual variability and daily extremes of wet season temperature and precipitation. Theor. Appl. Climatol. 2015, 121, 749–766. [Google Scholar] [CrossRef]
  19. Druyan, L.M.; Feng, J.; Cook, K.H.; Xue, Y.; Fulakeza, M.; Hagos, S.M.; Ibrah, S.S. The WAMME regional model intercomparison study. Clim. Dyn. 2010, 35, 175–192. [Google Scholar] [CrossRef] [Green Version]
  20. Xue, Y.; De Sales, F.; Lau, W.M.; Boone, A.; Feng, J.; Dirmeyer, P.; Poccard-Leclercq, I. Intercomparison and analyses of the climatology of the West African Monsoon in the West African Monsoon Modeling and Evaluation project (WAMME) first model intercomparison experiment. Clim. Dyn. 2010, 35, 3–27. [Google Scholar] [CrossRef] [Green Version]
  21. Redelsperger, J.L.; Thorncroft, C.D.; Diedhiou, A.; Lebel, T.; Parker, D.J.; Polcher, J. African Monsoon Multidisciplinary Analysis: An international research project and field campaign. Bull. Am. Meteorol. Soc. 2006, 87, 1739–1746. [Google Scholar] [CrossRef] [Green Version]
  22. Ruti, P.M.; Williams, J.E.; Hourdin, F.; Guichard, F.; Boone, A.; Van Velthoven, P.; Gaertner, M.A. The West African climate system: A review of the AMMA model inter-comparison initiatives. Atmos. Sci. Lett. 2011, 12, 116–122. [Google Scholar] [CrossRef]
  23. Paeth, H.; Hall, N.M.; Gaertner, M.A.; Alonso, M.D.; Moumouni, S.; Polcher, J.; Gaye, A.T. Progress in regional downscaling of West African precipitation. Atmos. Sci. Lett. 2011, 12, 75–82. [Google Scholar] [CrossRef]
  24. Gbobaniyi, E.; Sarr, A.; Sylla, M.B.; Diallo, I.; Lennard, C.; Dosio, A.; Nikulin, G. Climatology, annual cycle and interannual variability of precipitation and temperature in CORDEX simulations over West Africa. Int. J. Clim. 2013, 34, 2241–2257. [Google Scholar] [CrossRef]
  25. Sylla, M.B.; Diallo, I.; Pal, J.S. West African monsoon in state-of the-art regional climate models. Clim. Var. Reg. Themat. Patterns 2013. [Google Scholar] [CrossRef] [Green Version]
  26. Akinsanola, A.A.; Ogunjobi, K.O.; Gbode, I.E.; Ajayi, V.O. Assessing the capabilities of three regional climate models over CORDEX Africa in simulating West African summer monsoon. Adv. Meteorol. 2015, 1–13. [Google Scholar] [CrossRef] [Green Version]
  27. Akinsanola, A.A.; Ajayi, V.O.; Adejare, A.T.; Adeyeri, O.E.; Gbode, I.E.; Ogunjobi, K.O.; Abolude, A.T. Evaluation of rainfall simulations over West Africa in dynamically downscaled CMIP5 global circulation models. Theor. Appl. Climatol. 2018, 132, 437–450. [Google Scholar] [CrossRef]
  28. Tozer, C.R.; Kiem, A.S.; Verdon-Kidd, D.C. On the uncertainties associated with using gridded rainfall data as a proxy for observed. Hydrol. Earth Syst. Sci. 2012, 16, 1481–1499. [Google Scholar] [CrossRef] [Green Version]
  29. Pinya, M.A.S.; Sørup, H.J.D.; Christensen, O.B.; Madsen, H.; Rosbjerg, D.; Mikkelsen, P.S.; Arnbjerg-Nielsen, K. On the importance of observational data properties when assessing regional climate model performance of extreme precipitation. Hydrol. Earth Syst. Sci. 2013, 17, 4323–4337. [Google Scholar] [CrossRef] [Green Version]
  30. Sylla, M.B.; Giorgi, F.; Coppola, E.; Mariotti, L. Uncertainties in daily rainfall over Africa: Assessment of gridded observation products and evaluation of a regional climate model simulation. Int. J. Clim. 2013, 33, 1805–1817. [Google Scholar] [CrossRef]
  31. Prein, A.F.; Gobiet, A. Impacts of uncertainties in European gridded precipitation observations on regional climate analysis. Int. J. Clim. 2017, 37, 305–327. [Google Scholar] [CrossRef]
  32. Kotlarski, S.; Szabó, P.; Herrera, S.; Räty, O.; Keuler, K.; Soares, P.M.; Cardoso, R.M.; Bosshard, T.; Pagé, C.; Boberg, F.; et al. Observational uncertainty and regional climate model evaluation: A pan-European perspective. Int. J. Clim. 2019, 39, 3730–3749. [Google Scholar] [CrossRef]
  33. Washington, R.; Harrison, M.; Conway, D.; Black, E.; Challinor, A.; Grimes, D.; Todd, M. African climate change: Taking the shorter route. Bull. Am. Meteorol. Soc. 2006, 87, 1355–1366. [Google Scholar] [CrossRef]
  34. Akinsanola, A.A.; Ogunjobi, K.O.; Ajayi, V.O.; Adefisan, E.A.; Omotosho, J.A.; Sanogo, S. Comparison of five gridded precipitation products at climatological scales over West Africa. Meteorol. Atmos. Phys. 2017, 129, 669–689. [Google Scholar] [CrossRef]
  35. Maidment, R.I.; Grimes, D.I.F.; Allan, R.P.; Greatrex, H.; Rojasc, O. Leo O Evaluation of satellite based and model re-analysis rainfall estimates for Uganda. Meteorol. Appl. 2013, 20, 308–317. [Google Scholar] [CrossRef] [Green Version]
  36. Harris IP, D.J.; Jones, P.D.; Osborn, T.J.; Lister, D.H. Updated high-resolution grids of monthly climatic observations–the CRU TS3. 10 Dataset. Int. J. Clim. 2014, 34, 623–642. [Google Scholar] [CrossRef] [Green Version]
  37. Willmott, C.J. Terrestrial Air Temperature and Precipitation: Monthly and Annual Time Series (1950–1996). 2000. Available online: http://climate.geog.udel.edu/~climate/html_pages/README.ghcn_ts.Html (accessed on 27 October 2019).
  38. Adler, R.F.; Huffman, G.J.; Chang, A.; Ferraro, R.; Xie, P.P.; Janowiak, J.; Rudolf, B.; Schneider, U.; Curtis, S.; Bolvin, D.; et al. The version-2 global precipitation climatology project (GPCP) monthly precipitation analysis (1979–present). J. Hydrometeorol. 2003, 4, 1147–1167. [Google Scholar] [CrossRef]
  39. Adler, R.; Sapiano, M.; Huffman, G.; Wang, J.J.; Gu, G.; Bolvin, D.; Chiu, L.; Schneider, U.; Becker, A.; Nelkin, E.; et al. The Global Precipitation Climatology Project (GPCP) monthly analysis (new version 2.3) and a review of 2017 global precipitation. Atmosphere 2018, 9, 138. [Google Scholar] [CrossRef] [Green Version]
  40. Samuelsson, P.; Gollvik, S.; Kupiainen, M.; Kourzeneva, E.; van de Berg, W.J. The Surface Processes of the Rossby Centre Regional Atmospheric Climate Model (RCA4); SMHI: Norrköping, Sweden, 2015.
  41. Samuelsson, P.; Jones, C.G.; Will’ En, U.; Ullerstig, A.; Gollvik, S.; Hansson, U.L.F.; Jansson, E.; Kjellströ, M.C.; Nikulin, G.; Wyser, K. The Rossby Centre Regional Climate Model RCA3: Model description and performance. Tellus A Dyn. Meteorol. Oceanogr. 2011, 63, 4–23. [Google Scholar] [CrossRef] [Green Version]
  42. CERA-WDCC. Available online: https://cera-www.dkrz.de (accessed on 4 February 2019).
  43. Nicholson, S.E. The West African Sahel: A review of recent studies on the rainfall regime and its interannual variability. ISRN Meteorol. 2013, 2013, 32. [Google Scholar] [CrossRef]
  44. Akinsanola, A.A.; Zhou, W. Dynamic and thermodynamic factors controlling increasing summer monsoon rainfall over the West African Sahel. Clim. Dyn. 2019, 52, 4501–4514. [Google Scholar] [CrossRef]
  45. Hourdin, F.; Mauritsen, T.; Gettelman, A.; Golaz, J.C.; Balaji, V.; Duan, Q.; Folini, D.; Ji, D.; Klocke, D.; Qian, Y.; et al. The art and science of climate model tuning. Bull. Am. Meteorol. Soc. 2017, 98, 589–602. [Google Scholar] [CrossRef]
  46. Rummukainen, M. State-of-the-art with regional climate models. Wiley Interdiscip. Rev. Clim. Chang. 2010, 1, 82–96. [Google Scholar] [CrossRef]
  47. Knutti, R. The End of Model Democracy? Clim. Chang. 2010, 102, 395–404. [Google Scholar] [CrossRef]
  48. Tamoffo, A.T.; Moufouma-Okia, W.; Dosio, A.; James, R.; Pokam, W.M.; Vondou, D.A.; Fotso-Nguemo, T.C.; Guenang, G.M.; Kamsu-Tamo, P.H.; Nikulin, G.; et al. Process-oriented assessment of RCA4 regional climate model projections over the Congo Basin under 1.5 °C and 2 °C global warming levels: Influence of regional moisture fluxes. Clim. Dyn. 2019, 53, 1911–1935. [Google Scholar] [CrossRef]
  49. Sylla, M.B.; Giorgi, F.; Ruti, P.M.; Calmanti, S.; Dell’Aquila, A. The impact of deep convection on the West African summer monsoon climate: A regional climate model sensitivity study. Q. J. R. Meteorol. Soc. 2011, 137, 1417–1430. [Google Scholar] [CrossRef]
Figure 1. Topographic map of the study domain overlaid by the Coordinated Regional Downscaling Experiment (CORDEX) interpolated 0.5° × 0.5° grid setting used in this study.
Atmosphere 10 00802 g001
Figure 2. The spatial pattern of temporal rainfall considering 1980–2005 period with the top panel illustrating the mean and the bottom panel showing the 95th percentile for CRU TS 4.02, UDEL v5.01, and GPCP v2.3 observational datasets.
Atmosphere 10 00802 g002
Figure 3. The spatial pattern of temporal rainfall mean bias considering the 1980–2005 period for GCMs and their corresponding RCA4 dynamically downscaled outputs with respect to CRU TS v4.02.
Atmosphere 10 00802 g003
Figure 4. The spatial pattern of temporal rainfall 95th percentile bias considering the 1980–2005 period for GCMs and their corresponding RCA4 dynamically downscaled outputs with respect to CRU TS v4.02.
Atmosphere 10 00802 g004
Figure 5. The spatial pattern of temporal rainfall mean bias considering the 1980–2005 period for GCMs and their corresponding RCA4 dynamically downscaled outputs with respect to GPCP v2.3.
Atmosphere 10 00802 g005
Figure 6. The spatial pattern of temporal rainfall 95th percentile bias considering the 1980–2005 period for GCMs and their corresponding RCA4 dynamically downscaled outputs with respect to GPCP v2.3.
Atmosphere 10 00802 g006
Figure 7. The spatial pattern of temporal rainfall mean bias considering the 1980–2005 period for GCMs and their corresponding RCA4 dynamically downscaled outputs with respect to UDEL v5.01.
Atmosphere 10 00802 g007
Figure 8. The spatial pattern of temporal rainfall 95th percentile bias considering the 1980–2005 period for GCMs and their corresponding RCA4 dynamically downscaled outputs with respect to UDEL v5.01.
Atmosphere 10 00802 g008
Figure 9. The temporal pattern of spatial rainfall correlation coefficient considering the 1980–2005 period for GCMs and their corresponding RCA4 dynamically downscaled outputs with respect to all the three datasets.
Atmosphere 10 00802 g009
Figure 10. Summary of GCMs and their corresponding RCA4 dynamically downscaled performances with respect to the three observational datasets for the mean bias.
Atmosphere 10 00802 g010
Figure 11. Same as Figure 10 for the 95th percentile Bias.
Atmosphere 10 00802 g011
Figure 12. Climatology of mean sea level pressure (shaded, hPa) and 200 hPa wind (vectors, m/s) during the June–September (JJAS).
Atmosphere 10 00802 g012
Figure 13. Climatology of mean sea level pressure (shaded, hPa) and 500 hPa wind (vectors, m/s) during JJAS.
Atmosphere 10 00802 g013
Figure 14. Climatology of mean sea level pressure (shaded, hPa) and 850 hPa wind (vectors, m/s) during JJAS.
Atmosphere 10 00802 g014
Table 1. List of global climate models (GCMs) and reanalysis data dynamically downscaled by Rossby Centre Regional Climate Model (RCA4) and used in this study.
Modeling Center (or Group)GCM/Reanalysis Output NameShort Name
Canadian Centre for Climate Modelling and AnalysisCCCma-CanESM2CanESM2
Centre National de Recherches Météorologiques / Centre Européen de Recherche et Formation Avancée en Calcul ScientifiqueCNRM-CERFACS-CNRM-CM5CNRM-CM5
Commonwealth Scientific and Industrial Research Organization in collaboration with Queensland Climate Change Centre of ExcellenceCSIRO-QCCC CSIRO-Mk3.6.0CSIRO
EC-EARTH consortiumICHEC-EC-EARTHEC-EARTH
NOAA Geophysical Fluid Dynamics LaboratoryNOAA-GDFL-GDFL-ESM2MGFDL-ESM2M
Met Office Hadley Centre (additional HadGEM2-ES realizations contributed by Instituto Nacional de Pesquisas Espaciais)MOHC-HadGEM2-ESHadGEM2-ES
Institut Pierre-Simon LaplaceIPSL-IPSL-CM5A-MRIPSL-CM5A-MR
Atmosphere and Ocean Research Institute (The University of Tokyo), National Institute for Environmental Studies, and Japan Agency for Marine-Earth Science and TechnologyMIROC-MIROC5MIROC5
Max-Planck-Institut für Meteorologie (Max Planck Institute for Meteorology)MPI-M-MPI-ESM-LRMPI-ESM-LR
Norwegian Climate CentreNCC-NorESM1-MNorESM1-M
European Centre for Medium-Range Weather Forecasts (ECMWF)ERA-INTERIMERA-INT

