Abstract
To prevent adverse health effects, the World Health Organization promotes the diffusion of the ultraviolet radiation index (UVI), with messages promoting precautionary behaviors, through a scale that considers extreme UVI values to be larger than 11.0. This scale came from a proposal from Canada, a country with a mostly light-skinned population, which experiences maximum UVI values up to 10.0. A modified scale was proposed, adapted to the skin types and the UVI levels in South America, which considers extreme values larger than 16.0. The records from 2010 to 2014 indicated that UVI is frequently larger than 11.0 (40.0–76.1% of the days per month) in Quito (Ecuador). The number of days per month with levels larger than 16.0 varied between 0.7% and 32.0%. We found that the maximum UV index levels do not occur necessarily around the local solar noontime. As the basis for a self-warning system in Quito and based on their skin type and UVI levels, people should know the exposure time before damage can take place. The Tropospheric Emission Monitoring Internet Service (TEMIS) computed the UVI at local solar noontime and under clear-sky conditions. The records from 2010 to 2014 were congruent with the corresponding TEMIS values. We did not identify any trend of the daily TEMIS UVI values during 1979 to 2018, which, used as a proxy, suggested the real UVI levels in Quito during 2010 to 2018 varied in a range similar to 1979–2009.
1. Introduction
Ultraviolet radiation (UV) corresponds to the part of the electromagnetic spectrum with wave lengths between 100 and 400 nm. The Sun is the primary source of human exposure to UV. Moderate UV doses are beneficial to health because they stimulate blood circulation, they are antiseptic, and they promote the production of vitamin D in the skin [1,2,3]. However, excessive exposure to UV is dangerous to health. The most common short-term effects correspond to tanning (pigmentation) and skin burn (solar erythema). Long-term exposure produces premature skin aging (photoaging), skin cancer (photocarcinogenesis) [4], and cataracts and other eye diseases. The International Agency for Research on Cancer (IARC) classified excessive exposure to UV as carcinogenic to humans [5].
The UV covers three long-wave bands: UVA (315–400 nm, 3.94–3.10 eV), UVB (280–315 nm, 4.43–3.94 eV), and UVC (100–280 nm, 12.4–4.43 eV). In its trajectory through the atmosphere, UV can be absorbed, reflected, and scattered. The UVB absorption depends, to a high degree, on the amount of ozone (O3) in the atmosphere. Atmospheric nitrogen and oxygen mainly reflect and scatter UV. Depending on their nature, aerosols can absorb, reflect, or scatter UV.
For clear-sky conditions (cloudless), the maximum UV level takes place at the solar noon moment, which is the time when the Sun is highest in the sky, and it crosses the meridian of a specific longitude.
The influence of clouds is complicated because they can absorb, reflect, and scatter UV. During cloudy days, they can notably reduce UV at the surface. However, in days with the partial presence of clouds, UV can be greater than in clear-sky conditions.
UV reaching the surface consists of about 95% UVA and 5% UVB. The atmosphere absorbs UVC completely [5]. UVA produces aging of the skin, light tanning, and photocarcinogenic effects. UVA can affect the DNA, promoting the formation of thymine dimers [6]. Although O3 absorbs most of the UVB, it has a larger potential to cause both sunburns and photocarcinogenic effects [3].
For preventing its negative effects, it is necessary to report information on UV radiation, with messages promoting proper precautionary behaviors. For this purpose, the World Health Organization (WHO) classified the UV levels at the surface, using the Ultraviolet Radiation index (UV index, UVI), which evaluates the UVA and UVB levels [7]. The UV index is a dimensionless indicator, which is defined by Equation (1) [8,9]:
where ker is a scaling factor originally equal to 40 m2 W−1, Eλ is the erythemal (sunburn) action spectrum, which describes the relative effect of the UV spectrum at different wavelengths, and Ser is the spectral solar irradiance at the surface (W m−2 nm−1).
The WHO scale considers five categories of this indicator: low (<2.0), moderate (3.0–5.0), high (6.0–7.0), very high (8.0–10.0), and extreme (>11.0) [8].
The origin of the WHO scale was a proposal for Canada [10], a country with maximum UVI up to 10.0, and with a mostly light-skin population, which is more sensitive to UV exposure [11]. On the other hand, about 5 billion people (89% of the world’s population) live in places with maximum UVI levels above 10.0. In the Andean region of Latin America, the maximum UVI values are typically larger than 11.0 [11,12]. There, a mostly dark-skin population resides, who are less sensitive to UV exposure.
These concerns were discussed in 2006, in Santiago (Chile), during the Third Latin American Congress of Photobiology and Photomedicine. Participants signed the Consensus of Santiago, which recognized the usefulness of the UVI but adapted to each region. This Consensus was ratified in 2009, in Quito (longitude: –78.5°, latitude: –0.2°), the capital of Ecuador, during the International Congress about Monitoring and Diffusion of the UVI in Latin America [3,13].
In 2013, in Arequipa (Peru), the VI Latin American Congress of Photobiology and Photomedicine took place. Participants again discussed the applicability of the WHO scale. They signed an accord, which supports the proposal by Zaratti et al. (2014) [11], who modified the WHO scale for its use in Latin America. This proposal considered UVI values ranging from 1.0 to 25.0. Based on the skin type and the UVI level, they estimated the exposure time (in minutes) before a detectable reddening of the skin can take place. The UV dose to produce the detectable skin damage was defined as the minimum erythemal dose (MED).
Based on a similar approach, the Ecuadorian Foundation of Psoriasis (FEPSO), and the Physics Institute from Rosario-Argentina (IFIR) proposed a modification for Latin America [3]. This proposal works with 16.0 as an extreme value. It corresponds to exposure times of about 20 to 30 min, for producing perceptible skin damage to people with skin types IV (Mediterranean, Asian, Hispanic) and V (Latin American, Light-skinned black, Indian) [11,14,15], which are the predominating skin types in Quito.
The urban region of Quito is located near the Equator line (Figure 1), at 2850 MASL. These features imply high UVI levels. Also, the UVI variation during the yearly cycle depends on the abundance of O3 in the atmosphere, the perpendicularity of the solar radiation over the Equatorial region, the cloudiness and rainfall pattern, and aerosols effects.
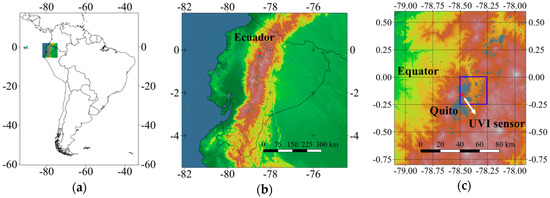
Figure 1.
Location of: (a,b) Ecuador; (c) Quito, and the ultraviolet radiation index (UVI) sensor. Dashed lines show part of the TEMIS grid for the UV index. The blue square is the cell (column 406, row 360) holding the UVI sensor.
This article explores the following issues:
- The maximum UVI levels measured in Quito and their dynamics during the yearly cycle.
- The UVI trend from 1979 to 2018.
- Why it is necessary to have a self-warning system in Quito.
1.1. UV Index Monitoring in Quito
The air-quality network in Quito has released UVI information since 2010, based on measurements by a multichannel radiometer (Biospherical Instruments INC. GUV-2511 No 251112008139), which is located in the central–northern region of the city (Figure 1). This sensor measures the UV levels at six key wavelengths (305, 313, 320, 340, 380, and 395 nm), and the photosynthetically active radiation (400–700 nm) [13]. The UV index is obtained by Equation (2), which was provided by the sensor’s manufacturer:
where Ed305, Ed313, Ed320, and Ed340 are the irradiance at 305, 313, 320, and 340 nm, respectively (µW cm−2 nm−1).
Based on the recommendations from the International Congress, which took place in Quito in 2009, the air-quality network delivers the UV index according to the FEPSO-IFIR proposal through its webpage.
On the other hand, the National Institute of Meteorology and Hydrology (INAMHI, from its Spanish acronym) also delivers the UV index measurements for Quito based on its sensor, and the forecasting for Ecuador, using the WHO scale [16]. As the UVI levels in Quito are frequently larger than 11.0, and the messages indicate they are extreme, some entities wondered if the reasons for these extreme UVI values are associated with climate change or the decrease of the stratospheric O3 [17].
1.2. The TEMIS UV Index Dataset
Based on an updated approach, the Tropospheric Emission Monitoring Internet Service (TEMIS) [18] from the Royal Netherlands Meteorological Institute, computed the UV index at local solar noontime and under clear-sky conditions, for a grid (1440 columns × 720 rows) of 0.25° by 0.25°, covering the entire world. For this purpose, it assimilated a merged global O3 field, which was the result of the reanalysis of various satellites (Multi-Sensor Re-Analysis, MSR-2), according to the algorithm by Van der A et al. [19,20]. Currently, this dataset covers the period 1979–2018, and although it provides the UV index for clear-sky conditions, it is an essential reference for comparison purposes and trend analysis.
2. Method and Results
2.1. Local solar noontime and UV index records in Quito
Using the NOAA Solar Calculator [21], we obtained the local solar noontime in Quito during the yearly cycle (Figure 2), which varies between 11:57 (November) and 12:28 (February).
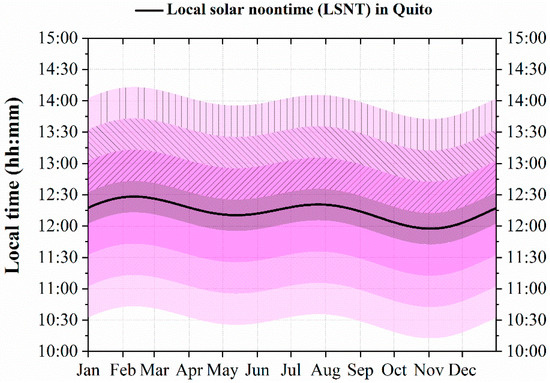
Figure 2.
Local solar noontime (LSNT) in Quito (longitude: −78.5°, latitude: −0.2°, 2850 MASL) during the yearly cycle [21] and 30 min periods before and after LSNT ± 15 min.
We received the records from the air-quality network [22], which describe the UVI values per minute. To characterize the UVI levels for exposure, we obtained the UVI arithmetic mean values for 30 min, centered on the local solar noontime. This period is approximately the exposure time required before perceptible skin damage occurs at a UV index of 16.0, to people with skin type V (Latin American, light-skinned Black, Indian) [11], which is the predominant skin type in Quito.
To explore the variation, we additionally generated the UVI mean values for 30 min during three consecutive periods, before and after the 30 min period centered on the local solar noontime (Figure 2). For comparison purposes, we considered, as extreme values, both the UVI levels larger or equal to 11.0 (WHO scale) and larger or equal to 16.0 (FEPSO-IFIR scale).
Between January and April of 2010 and 2012 mainly, UVI values larger than 16.0 were measured. Table 1 shows a summary of the UVI records larger than 19.0. The highest UVI record is 21.3, measured on 2 February 2010. During the following seven days, the UV index (mean during 30 min centered on local solar noontime) varied between 3.1 and 18.4.

Table 1.
Maximum UV (ultraviolet radiation) index records in Quito during 2010 to 2014.
UV records at local solar noontime can be equal to (e.g., 2 February 2010, 21.3), larger (e.g., 15 March 2012, 19.9 versus 19.7), or less (e.g., 12 March 2012, 18.2 versus 19.6, Figure 3) than the mean value during 30 min centered on the local solar noontime.
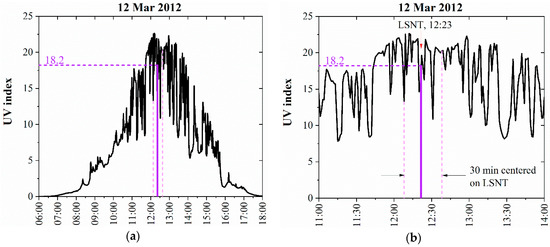
Figure 3.
(a) UV index in Quito during 12 March 2012. (b) Detailed UV index from 11:00 to 14:00. The vertical violet solid line indicates the LSNT and the corresponding record.
2.2. UV Index Records Versus TEMIS Dataset
We compared the UVI records at the local solar noontime, with the corresponding UVI estimations provided by TEMIS [18] for the location of Quito (Figure 4). Although following the shape, the UVI records showed some days with values over or under the TEMIS data. According to the air-quality network from Quito, some days lacked monitoring due to operational inconveniences. Also, during the second semester of 2012, the UVI sensor was returned to the manufacturer for calibration.
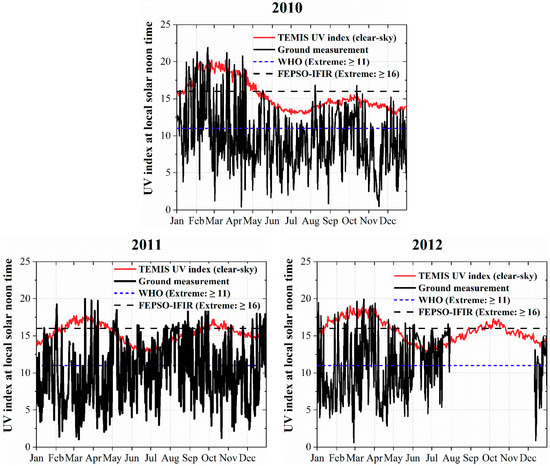
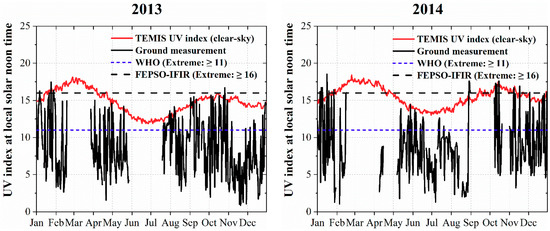
Figure 4.
UV index at local solar noontime in Quito during 2010 to 2014. Records (black line). TEMIS values for clear-sky conditions (red line).
After the comparison, for our analysis, we selected the period 2010–2014 (Figure 4). The records of these five years were congruent with the TEMIS UV index values. The TEMIS data depicted curves with soft variations during the year.
As persistent convective movements promote the formation of clouds in the Andean region of Ecuador, the clear-sky condition is not common in Quito. For a complementary comparison, we explored the images provided by the Aqua satellite [23], which crosses the Equator daily, at 13:30 (local time). We selected the images of 14 days of 2010–2014 with clear-sky or almost-clear-sky conditions (Figure 5a), assuming the same situation took place at local solar noontime. For these days, the linear correlation between the TEMIS UV index and the corresponding records showed a coefficient correlation (R2) of 0.87 (Figure 5b). The ratio between the UV index records to the corresponding TEMIS value varied from 0.9 to 1.1. However, 11 pairs were over the one-to-one line (y = x). The differences between the UV index records in comparison with the TEMIS values varied between −1.4 and 1.9, with a median of 0.9.
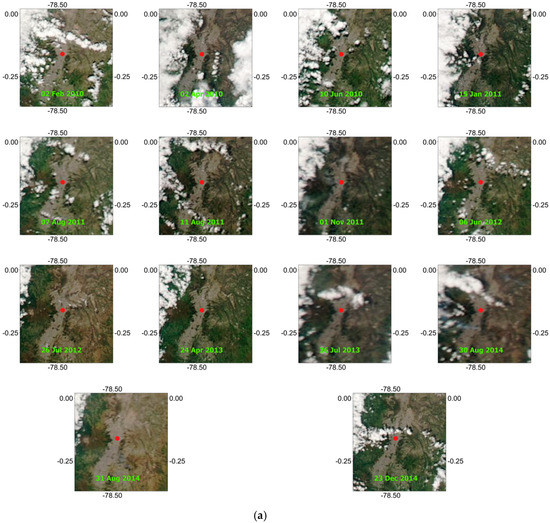
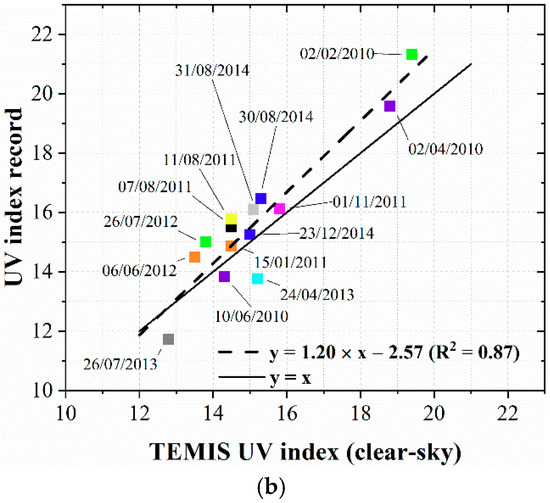
Figure 5.
(a) Images of Quito by the Aqua satellite (13:30 local time) for selected days of 2010–2014. The red dot indicates the location of the UV sensor. (b) TEMIS UV index values (clear-sky conditions, local solar noontime) versus the corresponding UV index record at local solar noontime.
The largest mean UVI records during 30 min centered on the local solar noontime of March and September varied between 16.4 and 19.7 and between 12.9 and 17.1, respectively (Figure 6).
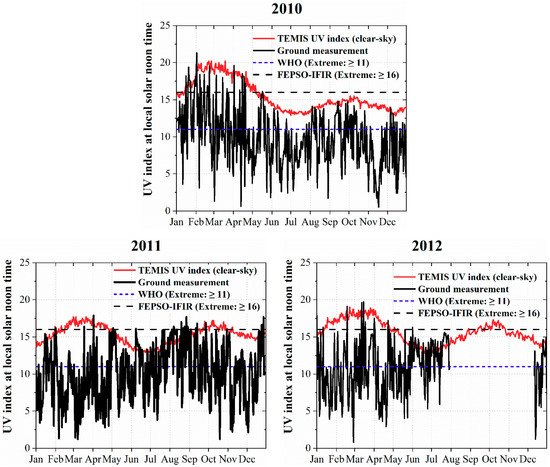
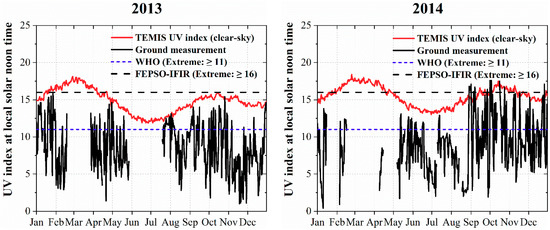
Figure 6.
UV index in Quito during 2010 to 2014. Mean values during 30 min centered on the local solar noontime, based on records (black line). TEMIS values at the local solar noontime for clear-sky conditions (red line).
According to the WHO scale, during 2010 to 2014, the percentage of days with extreme UVI values (≥11.0) during 30 min centered on the local solar noontime varied between 25.0% and 50.0% (Figure 7a). Conversely, when using the FEPSO-IFIR scale (≥16.0), this percentage varied between 0.0% and 10.0%. Interestingly, when including the other 30 min periods of Figure 2, the percentage of days with extreme UVI values (≥16.0) increased to 0.7%–32.0% (Figure 7b), with the largest belonging to March (32.0%), and then, February (14.9%), April (14.3%), January (12.3%), September (10.2%), and August (10.0%).
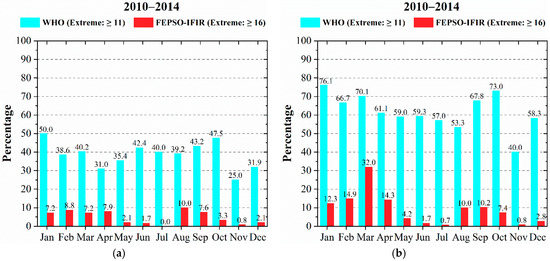
Figure 7.
Percentage of days per month with extreme UV index values in Quito: (a) for mean values during 30 min centered on the local solar noontime; (b) for mean values during 30 min (not necessarily centered on the local solar noontime).
During most months, the maximum extreme UVI levels were more frequently measured during the 30 min centered on the local solar noontime (Figure 8). However, for March, the maximum values were more frequent during the 30 min period before the period centered on the local solar noontime (12 days and 5 days, respectively).
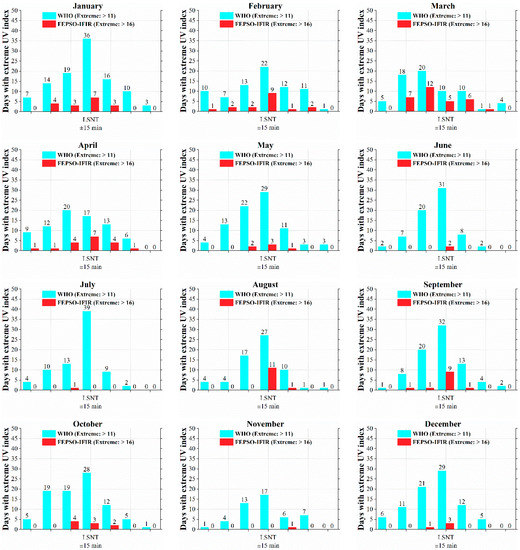
Figure 8.
Number of days per month with extreme UV index values in Quito, distributed in 30 min periods.
2.3. Processes Affecting UV Index
To interpret the UVI variation during the yearly cycle, we generated the following information:
- The variation of distance between the Earth and the Sun, and the solar declination angle. We used the approach and parameters suggested by Stull [24]. The Sun–Earth distance varies between 147.0 (3 January) and 152.0 Gigameters (Gm) (5 July). The Earth is closest to the Sun during the perihelion (3 January, distance of 147 Gm) (Figure 9a). During the equinox of March, the distance increases to 148.9 Gm. The maximum distance (152 Gm) takes place at the aphelion (4 July). During the September equinox, the distance decreases to 150 Gm. Hence, the Earth is 1.1 Gm closer to the Sun during the March equinox, in comparison with the September equinox.
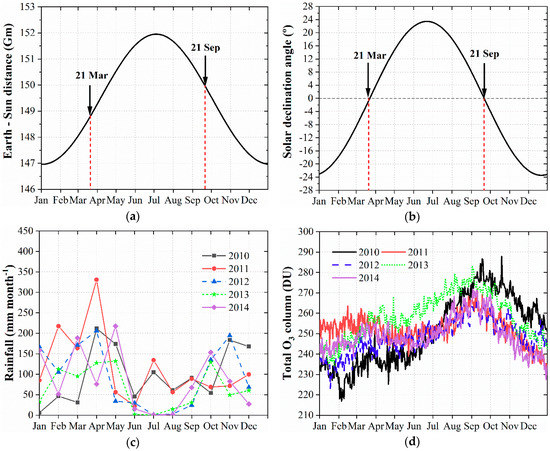 Figure 9. (a) Sun–Earth distance (Gm). (b) Solar declination angle (°). (c) Rainfall (mm month−1) during 2010 to 2014 (Belisario station, Central–Northern Quito). (d) Daily total O3 column (DU) of Quito during 2010 to 2014 [18].
 - The solar radiation flux on the external layer of the atmosphere, during the March and September equinoxes, was calculated by using the parameters suggested by Stull [24]. The solar radiation flux during the March equinox (1381.5 W m−2) is 1.6% larger than the flux during the September equinox (1360.4 W m−2).
- The declination angle, which corresponds to the angle formed between the ecliptic plane (Earth’s orbit around the Sun) and the equatorial plane of the Earth) (Figure 9b). This angle is 0° during the March and September equinoxes, when the solar radiation reaches the equatorial zone perpendicularly.
- Monthly rainfall during 2010 to 2014 in Central–Northern Quito. We processed the hourly records from the Belisario air-quality station. In Quito, typically during the yearly cycle, there is a defined pattern of rainfall. The first rainy period takes place from March to May. Although with smaller intensity, a second rainy period happens during October to November. Between June and September, there is a period with little rain. This behavior is presented in Figure 9c, which indicates the monthly values of rainfall during 2010 to 2014, measured in the Belisario station (Central–Northern Quito). During March to April, typically the rainiest months, clouds are common. On the contrary, during August and September, months with less rainfall, there are more non-clouded or partially clouded days.
- From the MSR-2 dataset [18], we extracted the daily values of the total O3 column of Quito, for the period 2010–2014. The daily total O3 column during March and September varied between 248.3 ± 15.2 DU (mean ± 2SD) (Dobson Unit, one DU corresponds to the number of O3 molecules required to create a layer of pure O3 0.01 mm thick at a temperature of 0 °C and a pressure of 1 atm [25]), and 267.9 ± 14.7 DU, respectively (Figure 9d), according to the information from TEMIS [18]. There was only one instance where total O3 column values in 2010–2014 fell below 220.0 DU, which occurred between 2 and 9 February 2010 and reached a minimum of 216.9 DU on 5 February 2010.
For each day (one file per day) of the period 1979–2018 (40 years, 14,607 days), from the MSR-2 dataset [18], we extracted the UV index at local solar noontime and in clear-sky conditions, for the cell corresponding to the location of the UVI sensor in Quito (column 406, row 360). This information was used to analyze the UVI trend from 1979 to 2018. The linear fit of time (x) versus the daily UV index (y) of 1979–2018 for Quito (Figure 10a) was almost parallel to the x-axis (y = −0.000007 × x + 15.46). The fit of 1979–2009 (y = −0.00001 × x + 15.48) was similar to the fit of 1979–2018. Moreover, the fit (y = −0.00003 × x + 15.42) of 2010–2018 (Figure 10c) showed a slight negative tendency (slope = −0.00003). None of the fits of Figure 10 showed a positive trend. The UV index (local noontime and clear-sky conditions) of 1979–2009 varied between 15.4 ± 3.2, which was similar to the 15.3 ± 3.2, the range of 2010–2018 (Figure 10d).
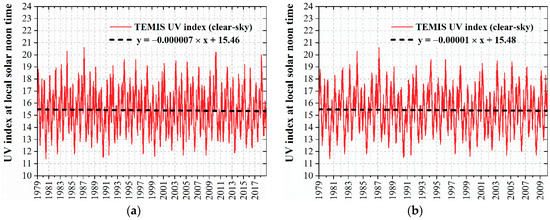
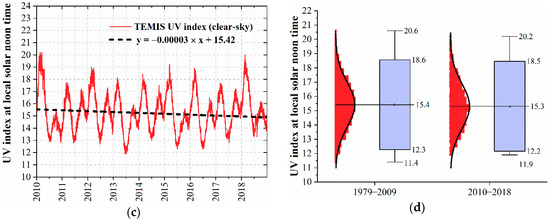
Figure 10.
Daily UV index at local solar noontime and in clear-sky conditions for Quito [18]: trend during (a) 1979–2018, (b) 1979–2009, (c) 2010–2018. (d) Statistical distribution, mean, mean ± 2 standard deviations, and maximum/minimum UV index during 1979–2009 and 2010–2018.
Apart from the first days of February of 2010, other days with total O3 column values close to 220 DU were 7 February 1987 (220.3 DU) and 20 December 2009 (220.4 DU) (Figure 11a). The total O3 column of Quito [18] during 1979 to 2018 varied between 251.3 ± 21.6 DU (Figure 11b).
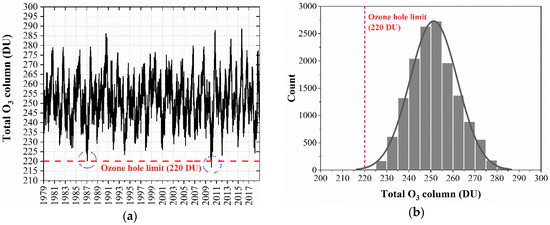
Figure 11.
Total O3 column (DU) of Quito [18]: (a) values of the period 1979–2018; (b) statistical distribution.
The monthly mean values computed for the daily datasets of the period 1979–2018 indicated the minimum values of the total O3 column corresponded to January (242.1 ± 16.1 DU), and the maximum to September (264.2 ± 17.1 DU) (Figure 12a). These values were consistent with the total O3 concentrations reported by Cazorla [26], who performed twelve observations in Quito from April to September of 2014 and 2015, measuring abundances between 225 and 279 DU (mean 247 DU).
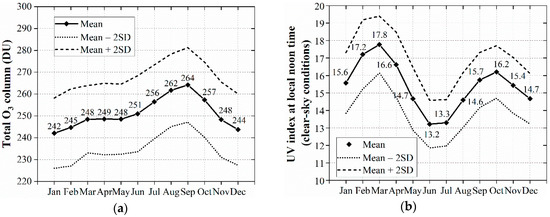
Figure 12.
Monthly mean values of Quito, computed for the daily datasets of the period 1979–2018 [18]: (a) total O3 column (DU); (b) UV index at local noon time for clear-sky conditions.
The monthly means of the period 1979–2018 [18] indicated that the maximum UV index values (local noontime and clear-sky conditions) correspond to March (17.8 ± 1.6), and February (17.2 ± 2.0) (Figure 12b).
3. Discussion
Results indicate that, in Quito, it is common to have UVI values larger than 11.0, which are considered extreme, according to the WHO scale. Moreover, although with less frequency, the results indicate that the measured UVI values can be larger than 16.0, which is into the extreme range, according to the FEPSO-IFIR scale. Extreme values (≥16.0) were measured mainly between January to April, and from August to October.
The percentage of days with extreme UVI values reduced from 0.7% to 4.2% (FEPSO-IFIR scale) from May to July (Figure 7b), due to the larger Earth–Sun distance (Figure 9a) and larger values of the declination angle (Figure 9b).
The period with more frequent extreme UVI during March was the 30 min before the period centered on the local solar noontime. This result highlights that the maximum UVI levels are not necessarily measured around noontime, when the flux of solar radiation arrives directly to the external layer of the atmosphere over the equatorial region. Larger UVI values were observed in other periods, before or after the noontime, potentially due to the solar scattering by partially cloudy conditions, a situation that can increase the UVI values by about 20% at the surface [12]. During a UV-monitoring campaign in North Carolina, Estupiñan et al. [27] verified that, in partially cloudy conditions, the UVB increased by 27%, during times scales less than one hour. Hence, under partially cloudy conditions, the UV effects can be stronger in comparison with clear-sky exposures. For 2010–2014, at local noontime in Quito, we observed that ratios of the UVI records to the corresponding TEMIS values increased by up to 27%, which was in agreement with the ratios reported in the literature. This effect explains, at least in part, why most of the days in Figure 5b showed larger UV index values in comparison with the corresponding TEMIS values.
On 12 March 2012 (Figure 3), the mean UV index during the 30 min centered on local noontime was larger than the corresponding record at local solar noontime. This situation is most likely as a result of transient clouds, which momentarily reduces the intensity of the UV index.
We highlight the congruence between the highest UVI value measured during 2010 to 2014 (21.3, 2 February 2010) and the corresponding atmospheric O3 abundance of Quito. The total O3 column was unusually low on 2 February 2010 (218.1 DU; Table 1; Figure 9d). At least in part, we attribute the reduction in the UV index during the seven days following 2 February 2010 to clouds. According to the images provided by the Aqua satellite [23], cloudy conditions took place during these days.
Due to its location, the urban region of Quito presents a unique combination of components which promote the presence of extreme UVI levels. Two of the most important are its location near the Equator and its height (2850 MASL). The later implies higher UVI levels in comparison with places at the same latitude but at sea level.
As the declination angle is 0° during the March and September equinoxes, the solar radiation perpendicularly reaches the equatorial zone. This feature explains why the highest extreme UVI values take place mainly around March and September.
Additionally, the larger UVI values around March in comparison with September are explained by the following elements:
- The Earth is 1.1 Gm closer to the Sun during the March equinox, in comparison with the September equinox. As a consequence, the flux of solar radiation during the March equinox (1381.5 W m−2) is 1.6% larger than the flux during the September equinox (1360.4 W m−2). Hence, the UV flux at the external layer of the atmosphere in March is larger than in September.
- On average, during 1979 to 2018, the total O3 column in March and September varied between 248.5 ± 15.4 DU and 264.1 ± 17.1 DU, respectively. The lower O3 abundance during March allowed more UV to reach the surface in comparison with September.
Although March is cloudy in Quito, the results suggest that clouds do not sufficiently attenuate the solar radiation. Therefore, during this month, the largest percentage of days with extreme UVI values (≥16.0) takes place. As UV radiation is directly involved in the production of tropospheric O3, larger concentrations should occur in March rather than September, but larger O3 concentrations are observed in September [28]. Some components are behind the tropospheric O3 production, such as the emission of precursors (nitrogen oxides and volatile organic compounds), O3 arriving from boundaries, UV levels, and rate of photochemical reactions. The highlighted feature contributes to the complexity of the dynamics of the tropospheric O3 in Quito.
The term “ozone hole” is usually defined as the geographical area within the 220 DU contour [29]. According to the total O3 column data generated by TEMIS during 1979 to 2018, six days at the beginning of February of 2010 showed values smaller than 220 DU. Therefore, this information indicates that during 0.04% of days in 1979–2018 (40 years, 14,607 days), the abundance of O3 reached concentrations smaller than the limit of the ozone hole. We infer that in Quito, values less than 220 DU are rare (Figure 11b). Over 40 years, the total O3 column in Quito varied between 251.3 ± 21.6 DU.
Based on satellite data, Herman [30] deduced that during 1979 to 2008 (30 years), the UVI levels significantly increased in all the latitudes, except for in the equatorial region. This finding is consistent with the results of our study, which did not find a tendency of the UVI in Quito (noontime and clear-sky conditions) during 1979 to 2009.
The results of our study suggest that, during 1979 to 2018, there was no increase in the UVI levels in Quito, and the measured UVI levels since 2010 lie within the historical range of 1979–2009. The results also suggest that, at least since 1979, the total O3 column of Quito did not show a negative trend, which is consistent with the fact that total O3 in the tropics has only been affected by chemical ozone depletion to a small extent [29]. Ball et al. [31] reported a continuing downward trend in the lower stratosphere O3 between 60° S and 60° N. They also indicated the total O3 column appears not to have decreased in these latitudes because of increases in tropospheric O3. However, Krzyścin and Baranowski [32] reported an O3 recovery on a global scale, following the decline in the 1980s and 1990s. Although the UVI levels of Quito suggest the total O3 column did not decrease, this is a topic that deserves specific study. Also, the trend of the tropospheric O3 and its contribution to the total O3 column require more research.
The percentage of days with extreme UVI values, using the WHO scale, varied between 40.0% and 76.1% (Figure 7b). Therefore, for these percentages of days per month, people should avoid excessive solar radiation exposure. This message, according to Zaratti et al. [11], is not appropriate for South America, taking into account the origin and conception of the WHO scale. Using the FEPSO-IFIR scale, people should avoid excessive exposition between 0.7% and 32.0% of the days per month. For UVI of 16.0 and after 30 min of exposition, there will be detectable damage (1 MED) to people with skin type V (South American). However, the exposure time is different for other types [11]: 10–13 min for skin types I and II (Celtic, Pale), 17 min for skin type III (Caucasian), 20 min for skin type IV (Mediterranean), and 63 min for skin type VI (Black).
Although the FEPSO-IFIR scale seems appropriate for Latin America, UVI values larger than 11.0 are indeed extreme for the light-skinned population living there. As the exposure times proposed by Zaratti et al. [11] take into account both the skin type and UVI levels up 25.0, this information should be the basis for a self-warning system. Based on their skin type and UVI levels, people should know the exposure time before damage can take place. For this reason, it is necessary to promote the diffusion of real and forecasted UVI records.
For the largest UVI record measured in Quito (21.3, 2 February 2010), the maximum exposure times per skin type, suggested by Zaratti et al. [11], are as follows: 8–10 min for types I and II, 13 min for type III, 16 min for type IV, 25 min for type V, and 48 min for type VI.
The suggested exposure times to UV—as the proposed by Zaratti et al. [11]—were established as an exclusive function of skin damage. This approach is coherent because it assigns longer times to dark-skinned people, due to their lower sensitivity. However, these times do not take into account the effects on the eyes, which would not show differences or types, as in the case of skin. The UV effects on eyes deserve additional research. As a preventive behavior, people should always protect their eyes, especially from 11:00 to 14:00.
4. Conclusions and Summary
In Quito, UVI levels greater than 11.0 are typical, but they are considered extreme according to the WHO scale. However, this scale is not suitable for South America because its origin came from a proposal for high-latitude countries, and mostly with a light-skinned population, where it is not common for UVI levels to be greater than 11.0, and for this reason, they are extreme for those countries.
In Quito, the UVI can be larger than 16.0, mainly from January to April, and less frequently from August to October. The FEPSO-IFIR scale classifies the UVI levels equal to or larger than 16.0 as extreme. Although the FEPSO-IFIR scale seems appropriate for Latin America because it takes into account the predominant skin types, UVI values larger than 11.0 are indeed extreme for the light-skinned population living in Quito. As the exposition times proposed by Zaratti et al. [11] take into account both the skin type and UVI levels up 25.0, this information should be the basis for the adoption of a self-warning system.
Our results suggest that, during 1979 to 2018, there is no increase in the UVI levels in Quito, and the measured UVI levels since 2010 are within the historical range belonging to 1979–2009. According to the total O3 column data by TEMIS, during 1979 to 2018, six days at the beginning of February of 2010 showed values less than 220 DU. During 0.04% (6 out of 14,607) of the days from the period 1979–2018 (40 years), the abundance of O3 reached concentrations smaller than the limit of the ozone hole. We infer that, in Quito, values smaller than 220 DU are exceptional.
Maximum UV levels in Quito do not necessarily occur around the local solar noontime. In days with a partial presence of clouds, UV can be larger than for clear-sky conditions. It is imperative that people, based on their skin type, know the maximum time of solar radiation exposure before damage can take place. For this reason, it is necessary to promote education and diffusion campaigns.
Observations of the O3 abundance are scarce in Ecuador, and it is necessary to promote campaigns to describe the O3 dynamics in detail. This information will allow a complete comparison with values by other approaches, such as TEMIS, which allows a better understanding of the relationship with UV index at the surface.
Although the TEMIS dataset showed congruence with the UV index records in Quito, more research is necessary to assess the accuracy of that dataset.
Although, in this contribution, we did not identify the UV trend during 1979 to 2018, its long-term behavior should be studied in the future.
Author Contributions
Conceptualization, methodology, validation, formal analysis, and writing—review and editing, R.P.; data curation, E.C. and C.F.
Funding
This research was funded by the Universidad San Francisco de Quito Poli-Grants 2019–2020.
Acknowledgments
We give our thanks to the air-quality network from Quito, especially to Valeria Díaz and Agustín Bolaños. This research is part of the project “Emisiones y Contaminación Atmosférica en el Ecuador 2019–2020”. We thank John Skukalek for checking the English grammar. Three reviewers provided helpful comments that improved the manuscript.
Conflicts of Interest
The authors declare no conflicts of interest.
References
- Holick, M.F. Sunlight, UV-Radiation, Vitamin D and Skin Cancer: How Much Sunlight Do We Need? In Sunlight, Vitamin D and Skin Cancer Advances in Experimental Medicine and Biology; Reichrath, J., Ed.; Springer: New York, NY, USA, 2008; Volume 624, pp. 1–15. [Google Scholar]
- McKenzie, R.; Liley, B.; Johnston, P.; Scragg, R.; Stewart, R.; Reederc, A.; Allend, M. Small doses from artificial UV sources elucidate the photo-production of vitamin D. Photochem. Photobiol. Sci. 2013, 9, 1726–1737. [Google Scholar] [CrossRef] [PubMed]
- Cañarte, C.; Salum, G.; Ipiña, A.; Piacentini, R. Índice ultravioleta como indicador de riesgo en la piel. In Dermatología. Ibero-Americana-Online; Rondón, A., Roberto, J., Piquero, J., Pérez, R., Roberto, C., Rondón, N., Eds.; Fundación Piel Latinoamericana: Caracas, Venezuela, 2010; Volume 87, pp. 1–26. [Google Scholar]
- Schrempf, M.; Haluza, D.; Simic, S.; Scragg, R.; Riechelmann, S.; Graw, K.; Seckmeyer, G. Is multidirectional UV exposure responsible for increasing melanoma prevalence with altitude? A hypothesis based on calculations with a 3D-human exposure model. Int. J. Environ. Res. Public Health 2016, 13, 961. [Google Scholar] [CrossRef] [PubMed]
- IARC. Radiation. In A Review of Human Carcinogens; IARC Monographs: Lyon, France, 2012; Volume 100 D, p. 341. [Google Scholar]
- Rochette, P.J.; Therrien, J.P.; Drouin, R.; Perdiz, D.; Bastien, N.; Drobetsky, E.A.; Sage, E. UVA-induced cyclobutane pyrimidine dimers form predominantly at thymine-thymine dipyrimidines and correlate with the mutation spectrum in rodent cells. Nucleic Acids Res. 2003, 31, 2786–2794. [Google Scholar] [CrossRef] [PubMed]
- McKinlay, A.F.; Diffey, B.L. A reference action spectrum for ultraviolet induced erythema in human skin. CIE 1987, 6, 17. [Google Scholar]
- OMS. WHO/SDE/OEH/02.2. In Índice UV Solar Mundial. Guía Práctica; Organización Mundial de la Salud: Ginebra, Suiza, 2003; p. 28. [Google Scholar]
- Turner, E.C.; Manners, J.; Morcrette, C.J.; O′Hagan, J.B.; Smedley, A.R.D. Toward a new UV Index diagnostic in the Met Office′s forecast model. J. Adv. Model. Earth Syst. 2017, 9, 2654–2671. [Google Scholar] [CrossRef]
- Heckman, C.; Liang, K.; Riley, M. Awareness, understanding, use, and impact of the UV index: A systematic review of over two decades of international research. Prev. Med. 2019, 123, 71–83. [Google Scholar] [CrossRef] [PubMed]
- Zaratti, F.; Piacentini, R.; Guillén, H.; Cabrera, S.; Liley, J.; Mckenzie, L. Proposal for a modification of the UVI risk scale. Photochem. Photobiol. Sci. 2014, 13, 980–985. [Google Scholar] [CrossRef] [PubMed]
- Liley, J.; McKenzie, R. Where on earth has the highest UV? In UV Radiation and Its Effects: An Update; Miscellaneous Series; RSNZ: Dunedin, New Zealand, 2006; Volume 68, pp. 36–37. [Google Scholar]
- Secretaría de Ambiente. Informe anual 2009. In La calidad del aire en Quito; Municipio del Distrito Metropolitano de Quito: Quito, Ecuador, 2010; p. 190. [Google Scholar]
- Ash, C.; Town, G.; Bjerring, P.; Webst, S. Evaluation of a novel skin tone meter and the correlation between Fitzpatrick skin type and skin color. Photonics Lasers Med. 2015, 4, 177–186. [Google Scholar] [CrossRef]
- Fitzpatrick, T.B. The validity and practicality of Sun-reactive skin types I through VI. Arch. Dermatol. 1988, 124, 869–871. [Google Scholar] [CrossRef] [PubMed]
- INAMHI. Instituto Nacional de Meteorología e Hidrología. Available online: https://abeltran94.wixsite.com/inamhi (accessed on 28 September 2019).
- Acción Ecológica. Estamos Bajo la Amenaza de la Radiación Ultravioleta. La causa? Se Erosiona la Capa de Ozono. Available online: http://www.accionecologica.org/editoriales/2345-2019-01-07-18-12-33 (accessed on 14 October 2019).
- TEMIS. Tropospheric Emission Monitoring Internet Service. Available online: http://www.temis.nl/index.php (accessed on 10 October 2019).
- Allaart, M.A.F.; Eskes, H.J. Extended and refined multi sensor reanalysis of total ozone for the period 1970–2012. Atmos. Meas. Tech. 2015, 8, 3021–3035. [Google Scholar]
- Allaart, M.A.F.; Eskes, H.J. Multi-Sensor Reanalysis (MSR) of Total Ozone, Version 2 Dataset; Royal Netherlands Meteorological Institute: De Bilt, The Netherlands, 2015. [Google Scholar]
- NOAA. NOAA Solar Calculator. Available online: https://www.esrl.noaa.gov/gmd/grad/solcalc/ (accessed on 10 February 2019).
- Secretaría de Ambiente. Datos Horarios Historicos Red Monitoreo Aire. Available online: http://www.quitoambiente.gob.ec/ambiente/index.php/datos-horarios-historicos (accessed on 21 September 2019).
- NASA Worldview. Available online: https://worldview.earthdata.nasa.gov/ (accessed on 13 November 2019).
- Stull, R.B. Meteorology for Scientist and Engineers, 2nd ed.; Brooks/Cole: Pacific Grove, CA, USA, 2000; pp. 23–42. [Google Scholar]
- NASA. NASA Ozone Watch. Available online: https://ozonewatch.gsfc.nasa.gov/facts/dobson_SH.html (accessed on 14 October 2019).
- Cazorla, M. Ozone structure over the equatorial Andes from balloon-borne observations and zonal connection with two tropical sea level sites. J. Atmos. Chem. 2016, 74, 377–398. [Google Scholar] [CrossRef]
- Estupiñan, J.; Raman, S.; Crescenti, G.; Streicher, J.; Barnard, R. Effects of clouds and haze on UV-B radiation. J. Geophys. Res. Atmos. 1996, 101, 16807–16816. [Google Scholar] [CrossRef]
- Secretaría de Ambiente. Informe de la Calidad del Aire de QUITO 2017; Municipio del Distrito Metropolitano de Quito: Quito, Ecuador, 2018; p. 49.
- Salawitch, R.; Fahey, D.; Hegglin, M.; McBride, L.; Tribett, W.; Doherty, S. Twenty Questions and Answers About the Ozone Layer: 2018 Update, Scientific Assessment of Ozone Depletion: 2018; World Meteorological Organization: Geneva, Switzerland, 2019; p. 88. [Google Scholar]
- Herman, J.R. Global increase in UV irradiance during the past 30 years (1979–2008) estimated from satellite data. J. Geophys. Res. 2010, 115, D04203. [Google Scholar] [CrossRef]
- Ball, W.T.; Alsing, J.; Mortlock, D.J.; Staehelin, J.; Haigh, J.D.; Peter, T.; Tummon, F.; Stübi, R.; Stenke, A.; Anderson, J.; et al. Evidence for a continuous decline in lower stratospheric ozone offsetting ozone layer recovery. Atmos. Chem. Phys. 2018, 18, 1379–1394. [Google Scholar] [CrossRef]
- Krzyścin, J.W.; Dariusz, B.; Baranowski, D.B. Signs of the ozone recovery based on multi sensor reanalysis of total ozone for the period 1979–2017. Atmos. Environ. 2019, 199, 334–344. [Google Scholar] [CrossRef]
© 2019 by the authors. Licensee MDPI, Basel, Switzerland. This article is an open access article distributed under the terms and conditions of the Creative Commons Attribution (CC BY) license (http://creativecommons.org/licenses/by/4.0/).