Analysis of Agricultural Drought Risk Based on Information Distribution and Diffusion Methods in the Main Grain Production Areas of China

 and
and
Abstract
:1. Introduction
2. Materials and Methods
2.1. Materials
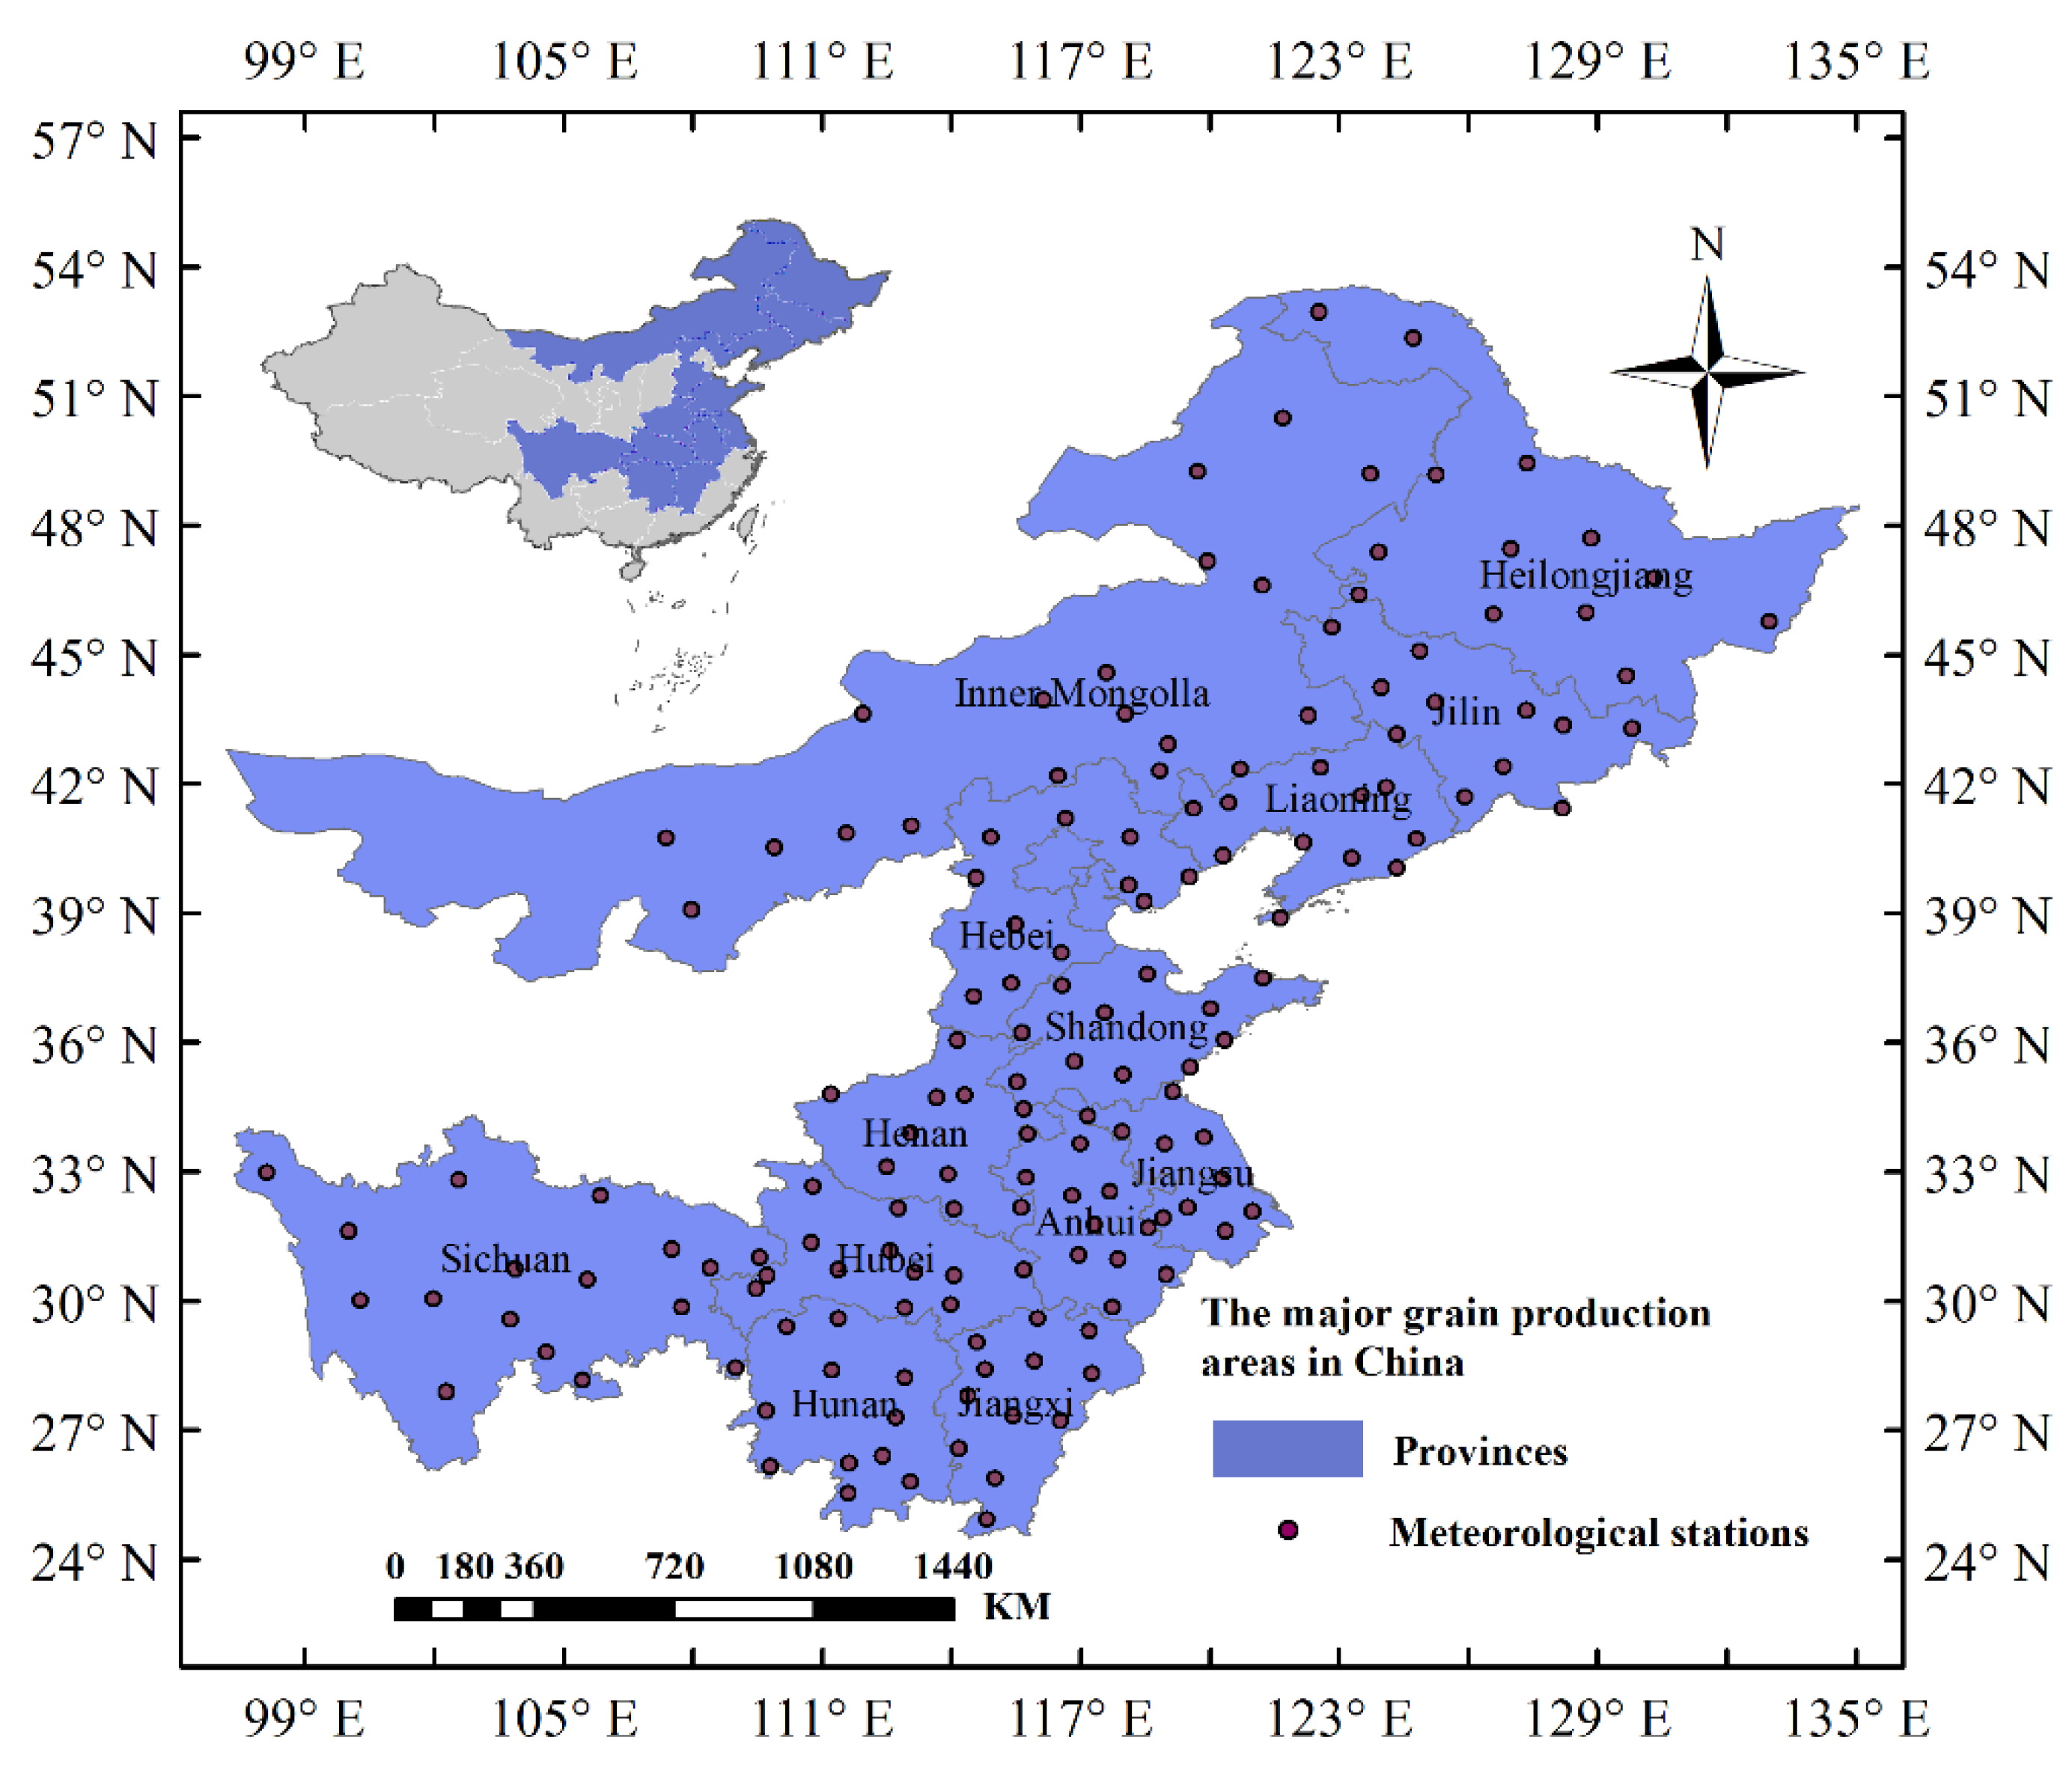
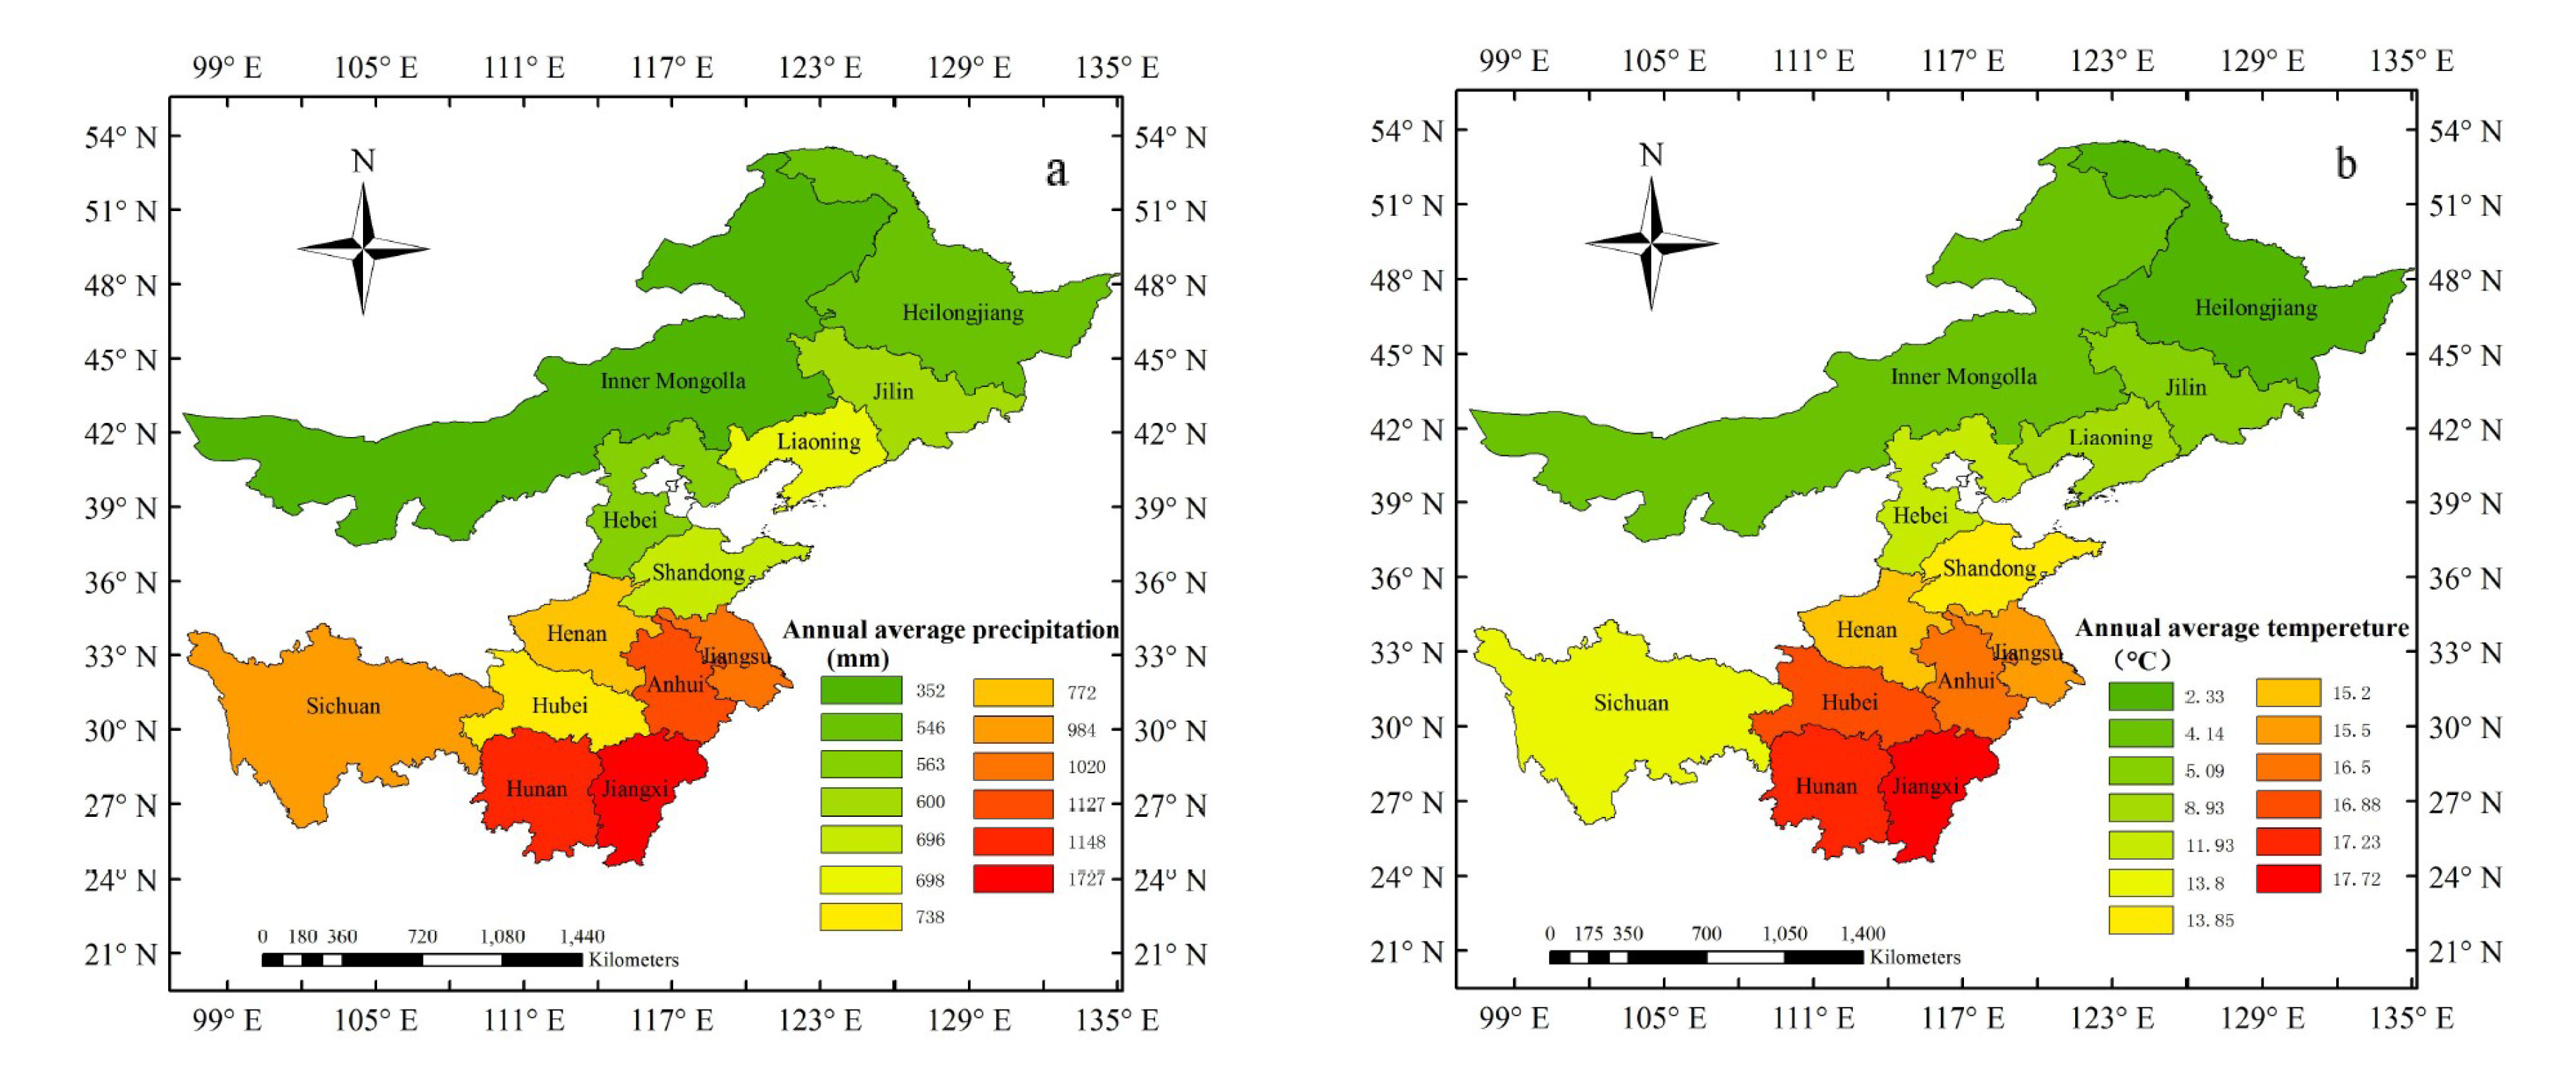
2.1.1. Study Region
2.1.2. Data
2.2. Methods
2.2.1. Drought Damage Index
2.2.2. Drought Meteorological Index
2.2.3. Information Distribution and Diffusion Methods
Effective Learning of Samples is one of the Key Aspects of Risk Analysis
Two-Dimensional Normal Information Diffusion Method
2.2.4. Vulnerability and Risk Evaluation
2.2.5. The Conditional Probability of the Risk
- (1)
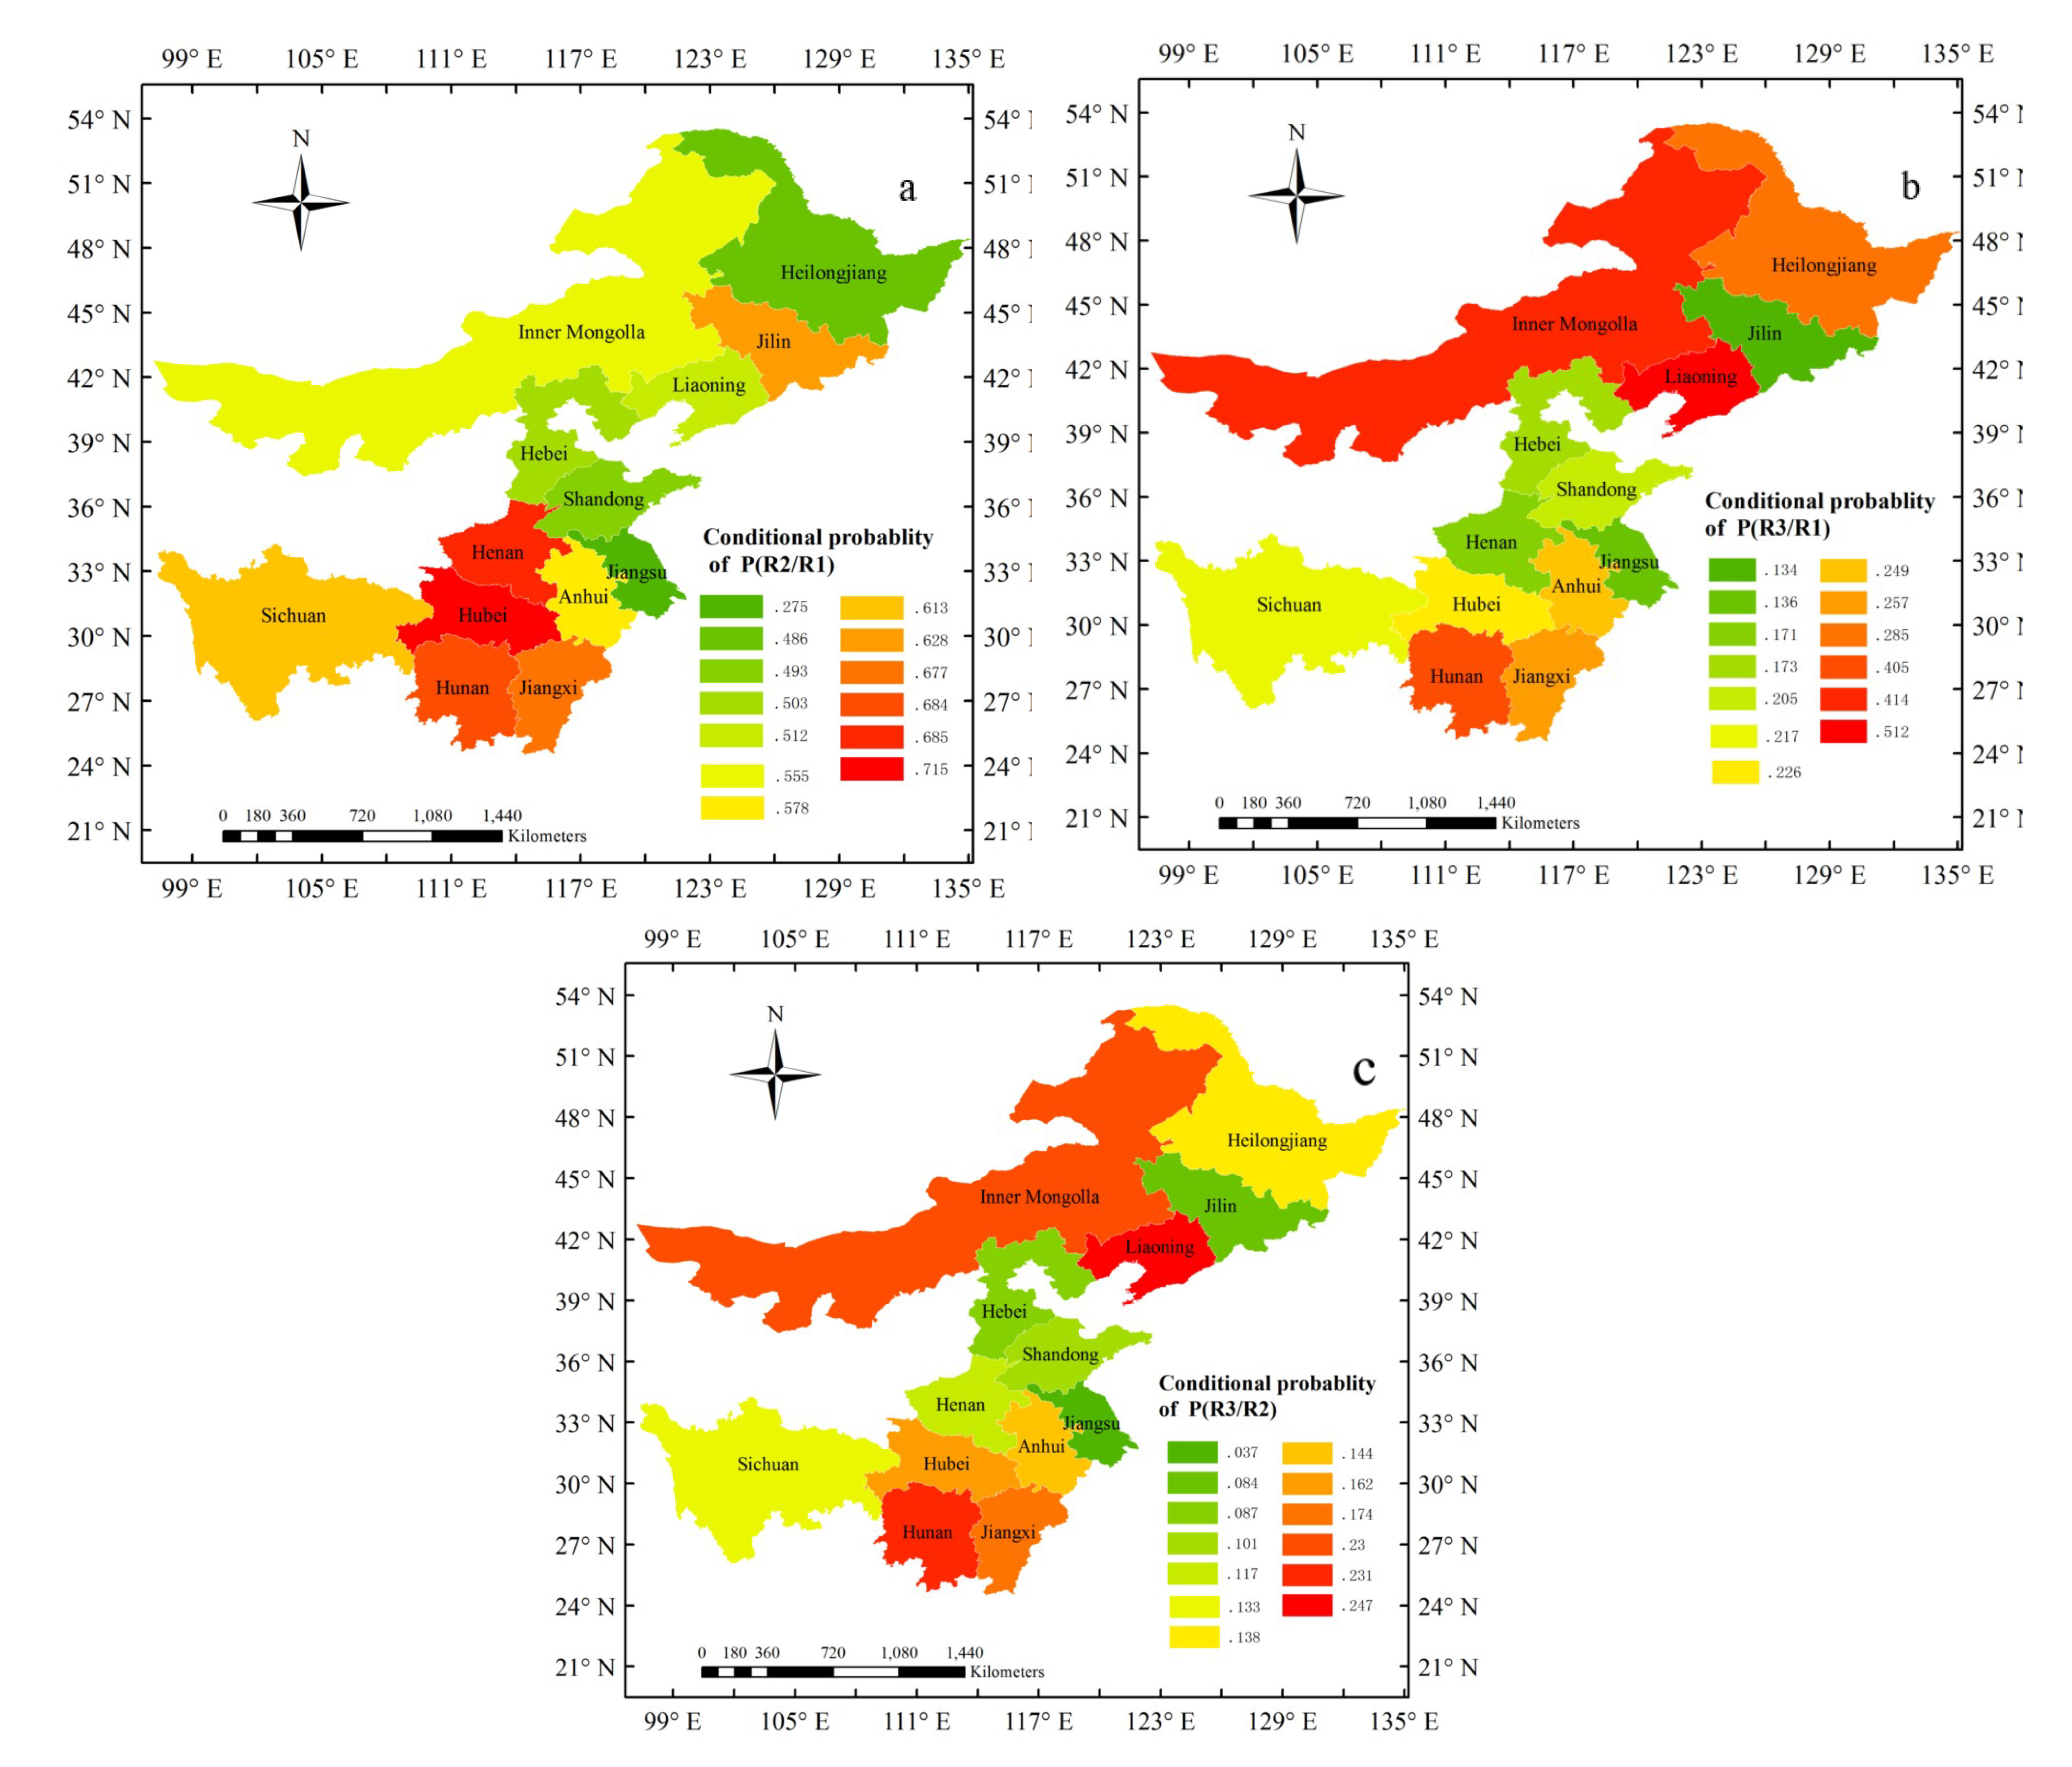
- The probability that a drought-affected event will occur under the condition that the drought-induced event has already occurred, expressed as P(R2/R1):
- (2)
- The probability that a lost harvest event will occur under the condition that the drought-induced event has already occurred, expressed as P(R3/R1):
- (3)
- The probability that a lost harvest event will occur under the condition that the drought-affected event has already occurred, expressed as P(R3/R2):
3. Results
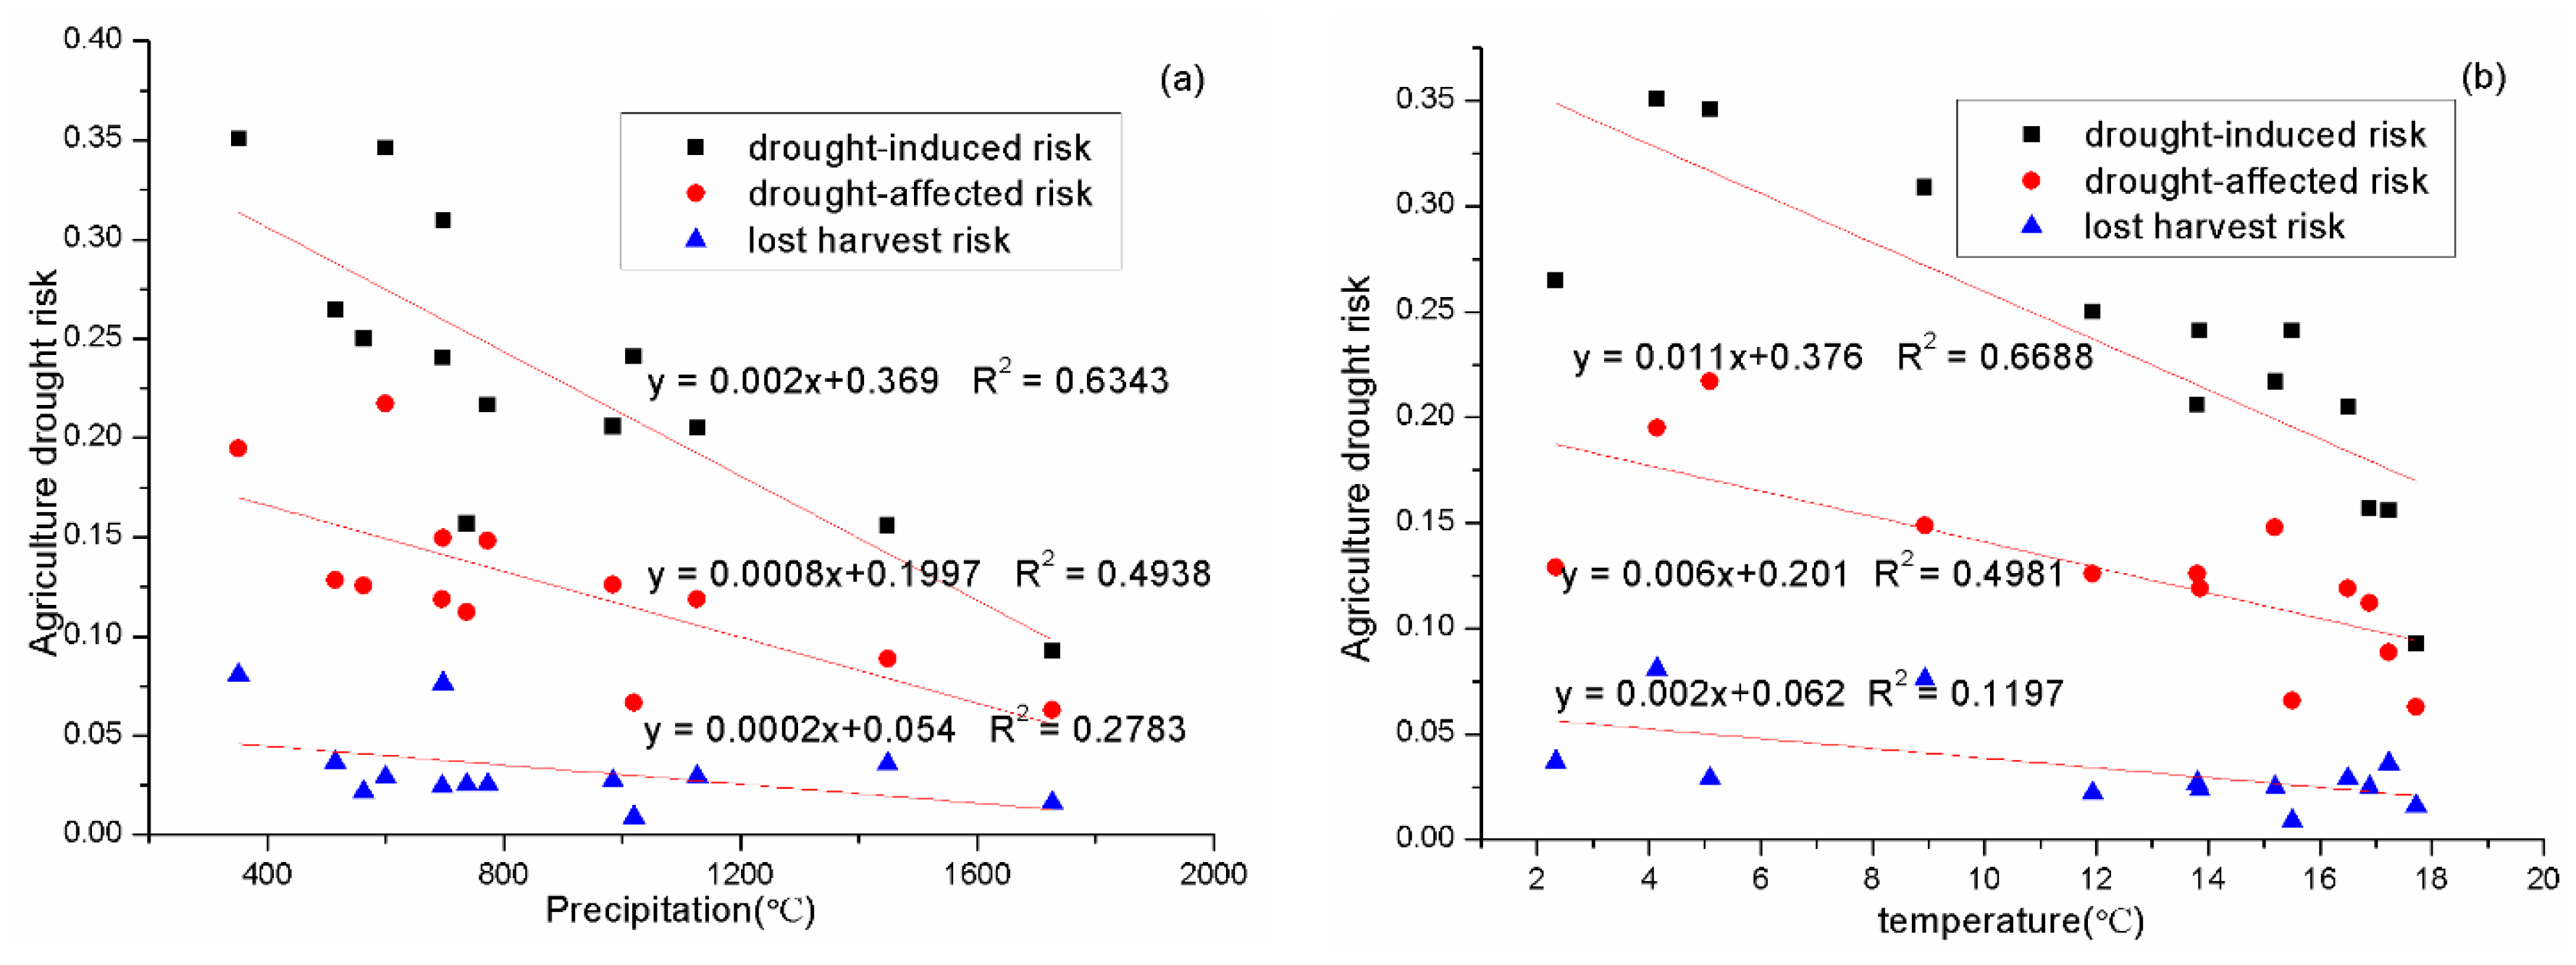
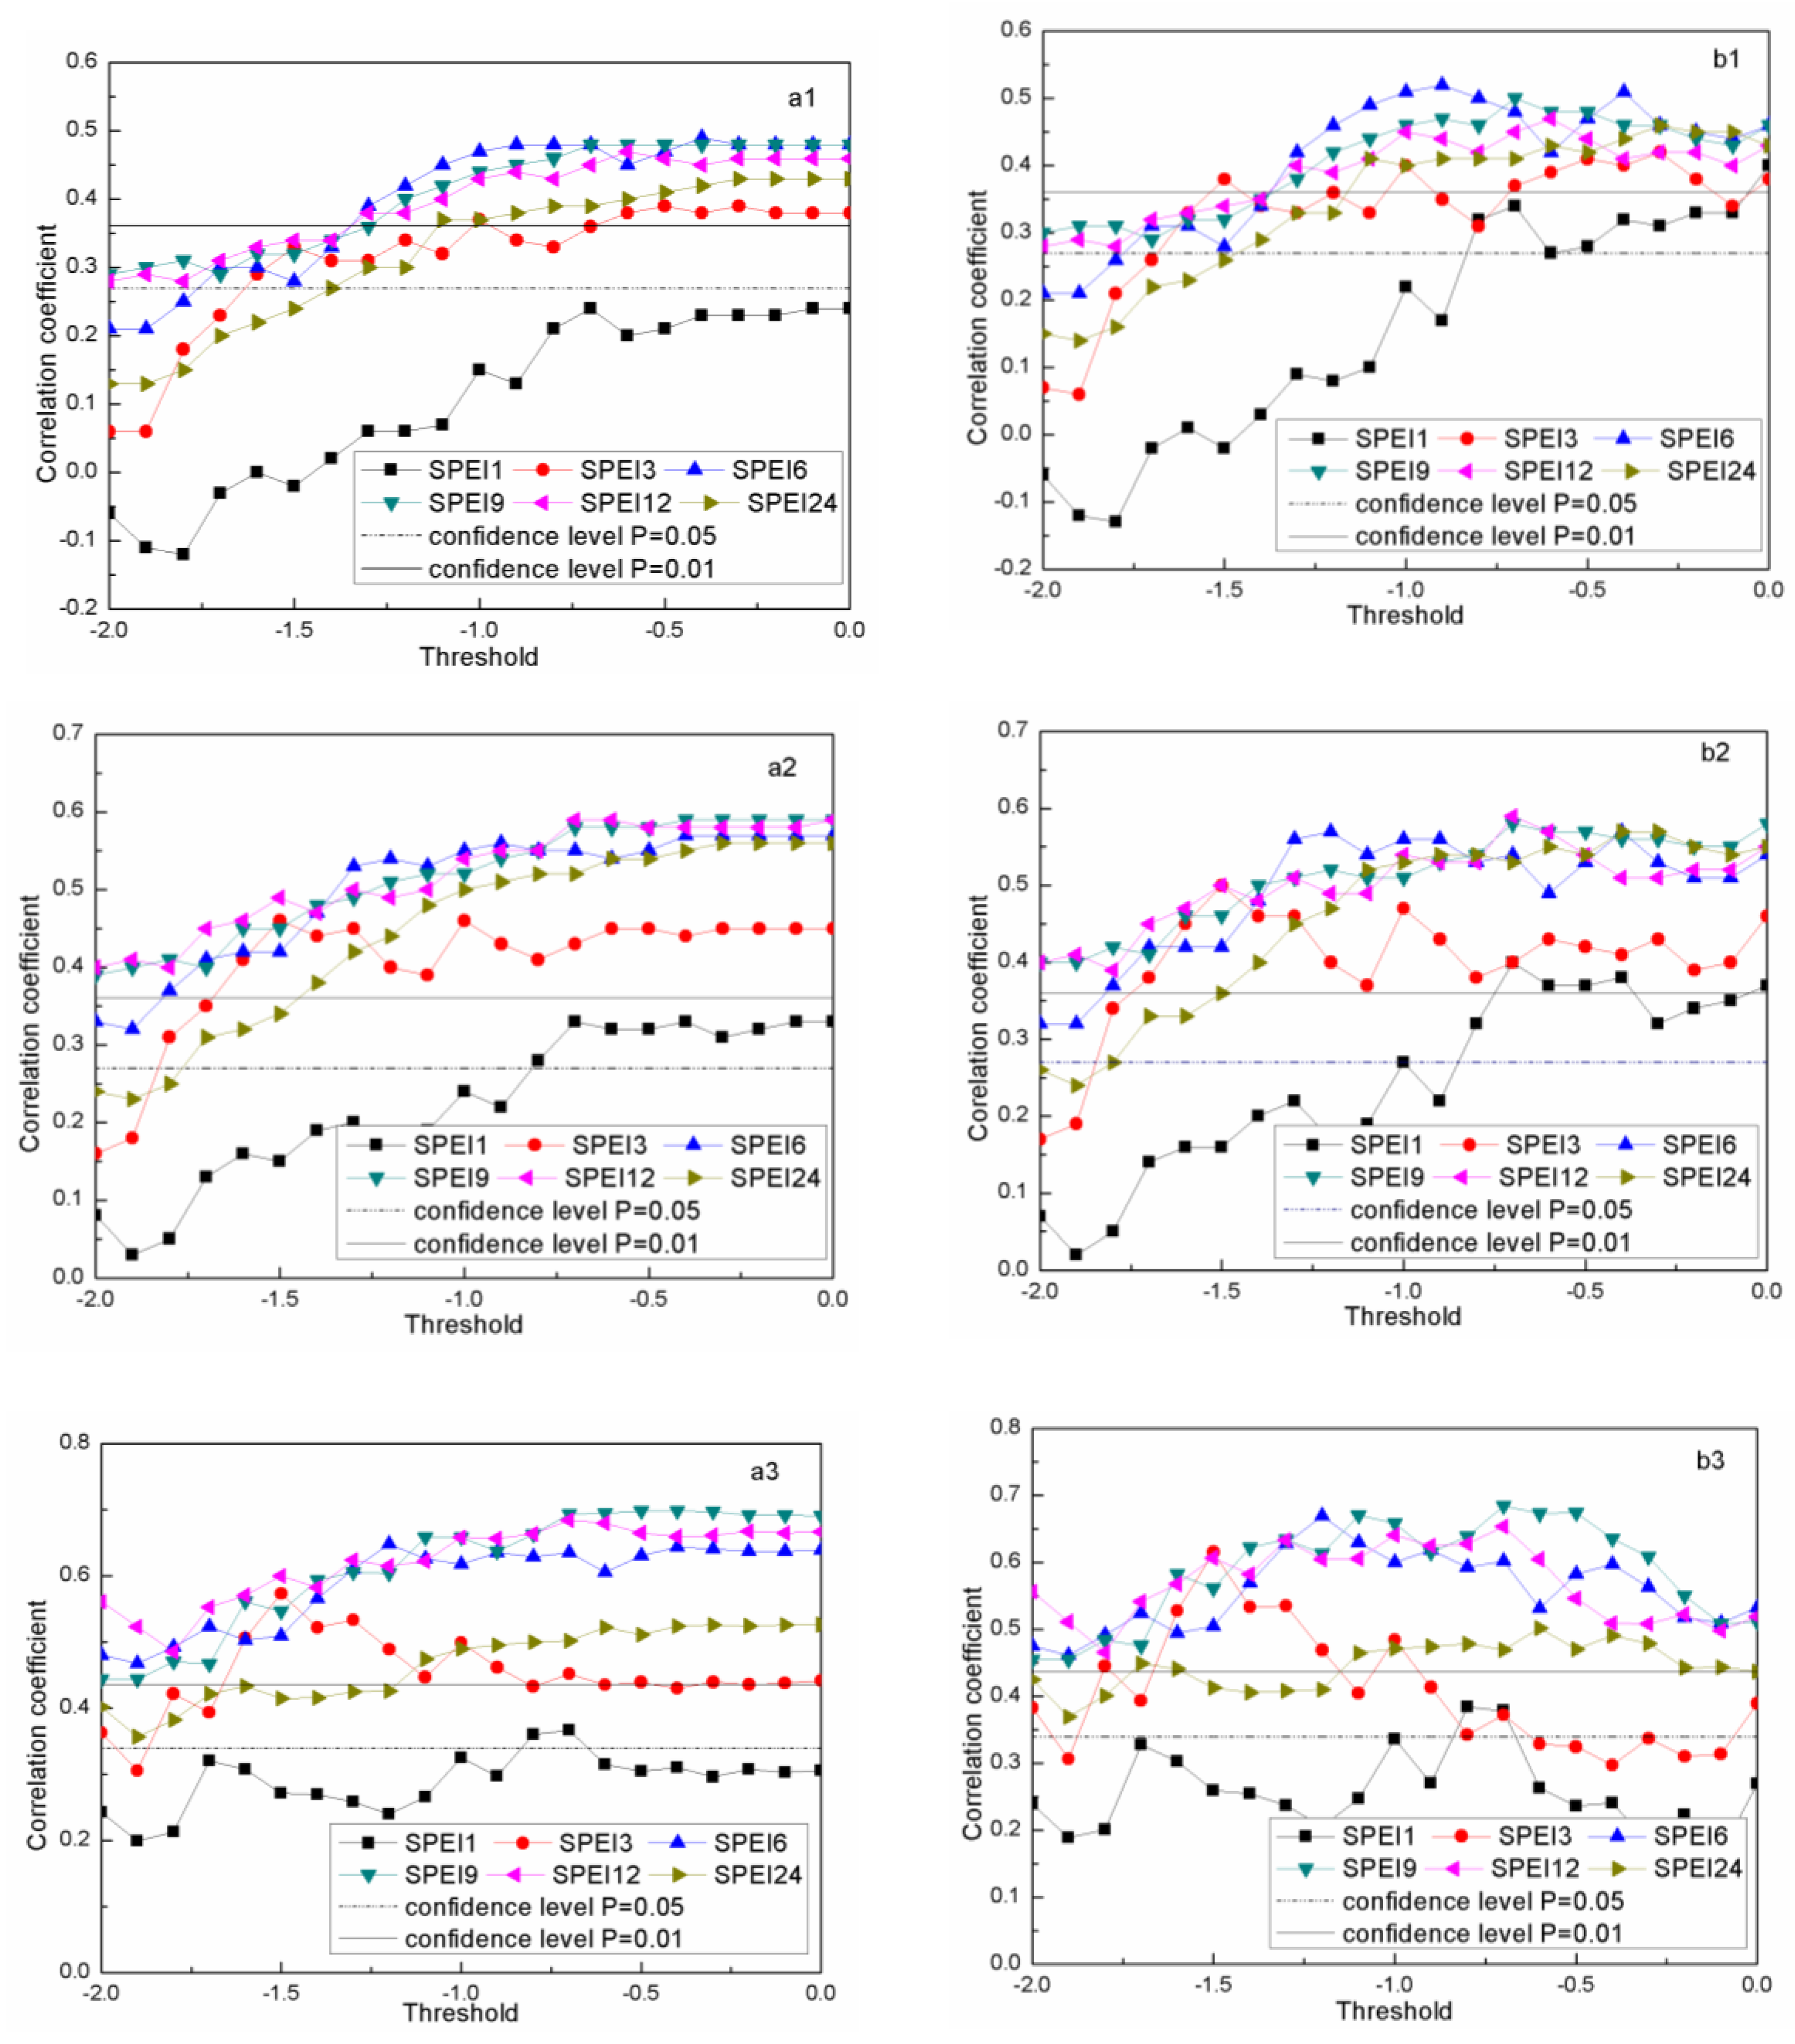
3.1. Correlation Analysis Between Drought Strength and Drought Damage Rates
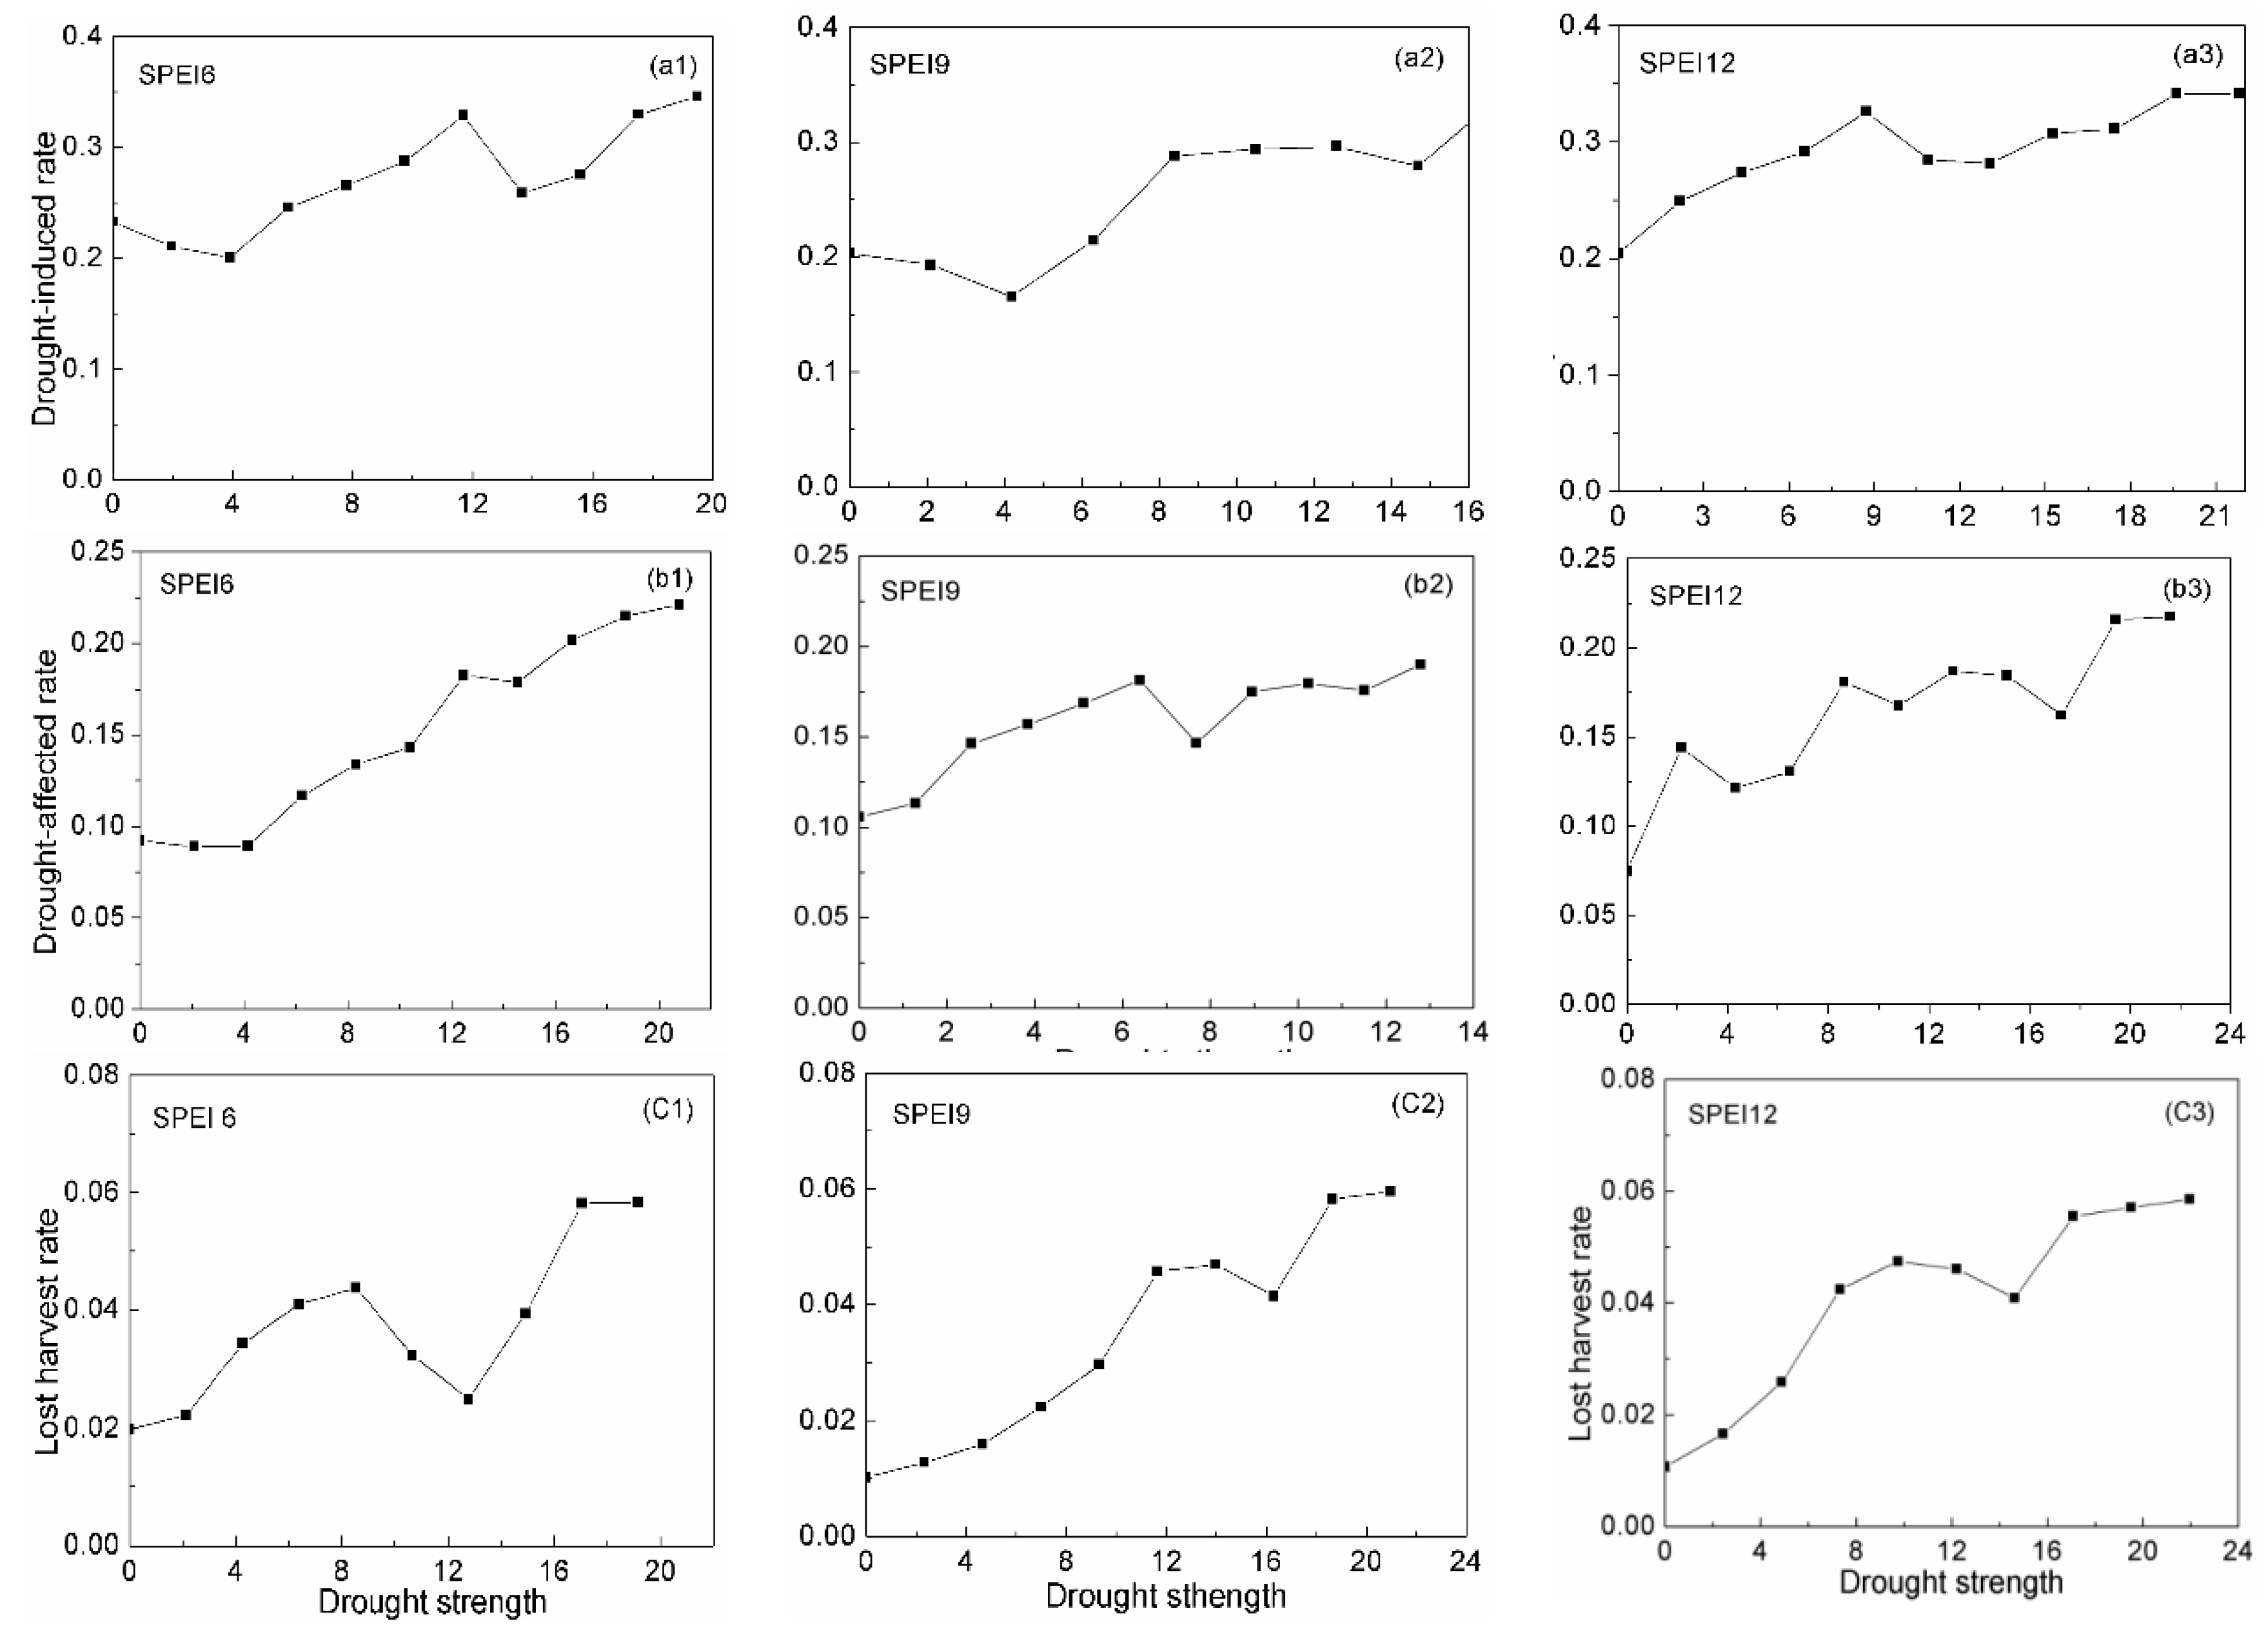
3.2. The Vulnerability Curve Between Drought Strength and Drought Damage Rates
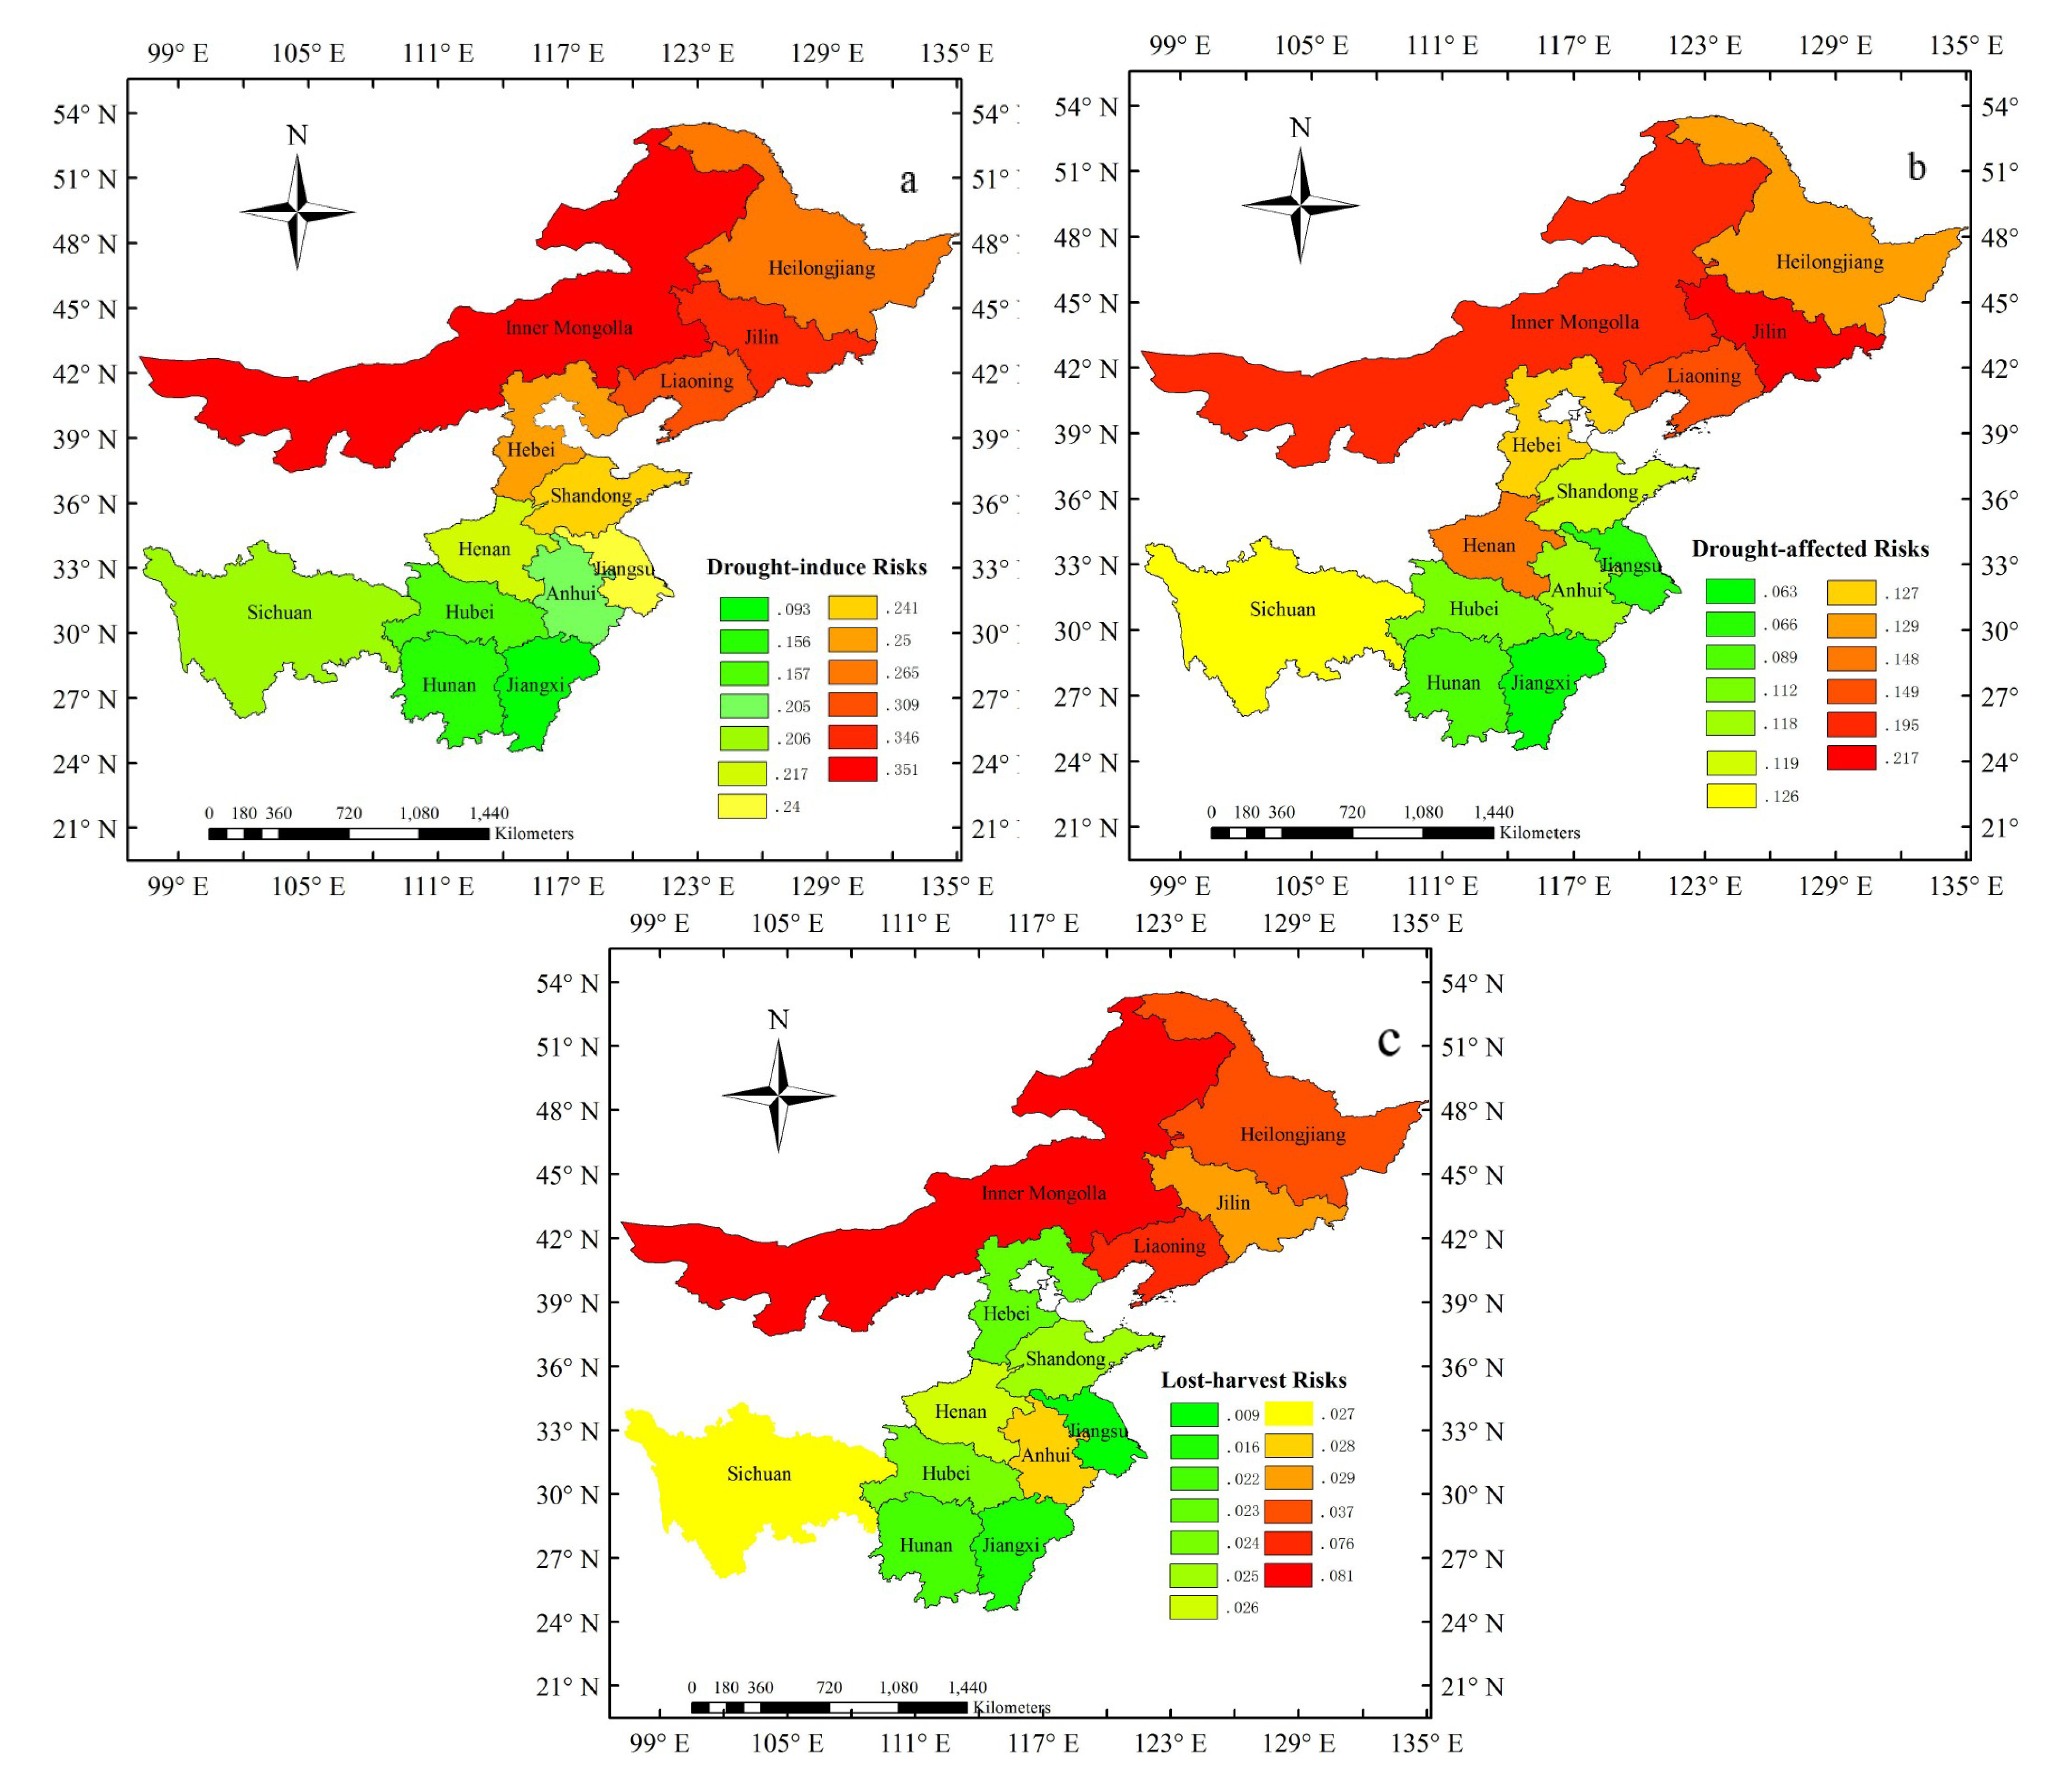
3.3. Agriculture Drought Risk Analysis
3.4. The Conditional Probability of the Agricultural Drought Risk
4. Discussion
5. Conclusions
Author Contributions
Funding
Acknowledgments
Conflicts of Interest
References
- Kim, H.; Park, J.; Yoo, J.; Kim, T.W. Assessment of drought hazard, vulnerability, and risk: A case study for administrative districts in South Korea. J. Hydro-Environ. Res. 2015, 9, 28–35. [Google Scholar] [CrossRef]
- Touma, D.; Ashfaq, M.; Nayak, M.A.; Kao, S.C.; Diffenbaugh, N.S. A multi-model and multi-index evaluation of drought characteristics in the 21st century. J. Hydrol. 2015, 526, 196–207. [Google Scholar] [CrossRef]
- Park, S.; Im, J.; Jang, E.; Rhee, J. Drought assessment and monitoring through blending of multi-sensor indices using machine learning approaches for different climate regions. Agric. Water Manag. 2016, 216, 157–169. [Google Scholar] [CrossRef]
- Chen, H.T.; Duan, C.Q.; Qiu, L.; Chen, X.N.; Wang, W.C. Characteristic analysis of drought for corn based on information diffusion and fractal technology. Trans. Chin. Soc. Agric. Eng. 2018, 34, 141–148. (In Chinese) [Google Scholar]
- Fontaine, M.M.; Steinemann, A.C. Assessing vulnerability to natural hazards: Impact-based method and application to drought in Washington state. Nat. Hazards 2009, 10, 11–18. [Google Scholar] [CrossRef]
- Leng, G.Y.; Tang, Q.H.; Rayburgc, S. Climate change impacts on meteorological, agricultural and hydrological droughts in China. Glob. Planet. Chang. 2015, 126, 23–34. [Google Scholar] [CrossRef]
- Gu, L.; Chen, J.; Xu, C.Y. Synthetic impacts of internal climate variability and anthropogenic change on future meteorological droughts over China. Water 2018, 10, 1702. [Google Scholar] [CrossRef]
- Dracup, J.A.; Lee, K.S.; Paulson, E.G., Jr. On the definition of droughts. J. Water Resour. Res. 1980, 16, 297–302. [Google Scholar] [CrossRef]
- Tang, M.; Zhang, B.; Zhang, Y.Z. Assessment of Spring and Summer Meteorological Droughts Based on SPEI and SPI in Eastern Agricultural Region of Qinghai Province. J. Nat. Res. 2017, 6, 12. [Google Scholar]
- Wu, J.; Zhou, L.; Mo, X.; Zhou, H.; Zhang, J.; Jia, R. Drought monitoring and analysis in China based on the Integrated Surface Drought Index (ISDI). Int. J. Appl. Earth Obs. Geoinform. 2015, 41, 23–33. [Google Scholar] [CrossRef]
- Maxwell, J.T.; Knapp, P.A.; Ortegren, J.T. Changes in the Mechanisms Causing Rapid Drought Cessation in the Southeastern United States of America. Geophys. Res. Lett. 2017, 44, 12–476. [Google Scholar] [CrossRef]
- Zhao, S.; Cong, D.; He, K. Spatial-Temporal Variation of Drought in China from 1982 to 2010 Based on a modified Temperature Vegetation Drought Index (mTVDI). Sci. Rep. 2017, 7, 17473. [Google Scholar] [CrossRef] [PubMed]
- Jiang, S.Z.; Liang, C.; Cui, N.B. Impacts of climatic variables on reference evapotranspiration during growing season in Southwest China. Agric. Water Manag. 2019, 216, 365–378. [Google Scholar] [CrossRef]
- Huang, W.; Yang, X.; Li, M. Evolution characteristics of seasonal drought in the south of China during the past 58 years based on standardized precipitation index. Trans. Chin. Soc. Agric. Eng. 2010, 26, 50–59. (In Chinese) [Google Scholar]
- Lu, Y.; Yan, D.; Qin, T.; Song, Y.; Weng, B.; Yuan, Y.; Dong, G. Assessment of Drought Evolution Characteristics and Drought Coping Ability of Water Conservancy Projects in Huang-Huai-Hai River Basin, China. Water 2016, 8, 378. [Google Scholar] [CrossRef]
- Lee, S.-H.; Yoo, S.-H.; Choi, J.-Y.; Bae, S. Assessment of the Impact of Climate Change on Drought Characteristics in the Hwanghae Plain, North Korea Using Time Series SPI and SPEI: 1981–2100. Water 2017, 9, 579. [Google Scholar] [CrossRef]
- Barkey, B.L.; Bailey, R.T. Estimating the Impact of Drought on Groundwater Resources of the Marshall Islands. Water 2017, 9, 41. [Google Scholar] [CrossRef]
- Yan, H.; Wang, S.Q.; Wang, J.B.; Lu, H.Q.; Guo, A.H.; Zhu, Z.C.; Myneni, R.B.; Shugart, H.H. Assessing spatiotemporal variation of drought in China and its impact on agriculture during 1982–2011 by using PDSI Indices and Agriculture Drought Survey Data. Geophys. Res. Atmos. 2016, 121, 2283–2298. [Google Scholar] [CrossRef]
- McKee, T.B.; Doeskin, N.J.; Kleist, J. The relationship of drought frequency and duration to time scales. In Proceedings of the 8th Conference on Applied Climatology, Anaheim, CA, USA, 17–22 January 1993; American Meteor Society: Anaheim, CA, USA, 1993; pp. 179–184. [Google Scholar]
- Vicente-Serrano, S.M.; Beguería, S.; López-Moreno, J.I. A Multiscalar Drought Index Sensitive to Global Warming: The Standardized Precipitation Evapotranspiration Index. J. Clim. 2010, 23, 1696–1718. [Google Scholar] [CrossRef]
- UNISDR. Terminology on Disaster Risk Reduction. 2009. Available online: https://www.unisdr.org/we/inform/terminology (accessed on 12 June 2019).
- Xie, Z.; Xu, J.; Deng, Y. Risk analysis and evaluation of agricultural drought disaster in the major grain-producing areas, China. Geomat. Nat. Hazards Risk 2016, 7, 1691–1706. [Google Scholar] [CrossRef]
- Shahid, S.; Behrawan, H. Drought risk assessment in the western part of Bangladesh. Nat. Hazards 2008, 46, 391–413. [Google Scholar] [CrossRef]
- Cheng, J.; Tao, J.P. Fuzzy Comprehensive Evaluation of Drought Vulnerability Based on the Analytic Hierarchy Process-An Empirical Study from Xiaogan City in Hubei Province. Agric. Agric. Sci. Procedia 2010, 1, 126–135. [Google Scholar]
- Rajsekhar, D.; Singh, V.P.; Mishra, A.K. Integrated drought causality, hazard, and vulnerability assessment for future socioeconomic scenarios: An information theory perspective. J. Geophys. Res. Atmos. 2015, 120, 6346–6378. [Google Scholar] [CrossRef]
- De Silva, M.M.G.T.; Akiyuki, K. Socioeconomic Vulnerability to Disaster Risk: A Case Study of Flood and Drought Impact in a Rural Sri Lankan Community. Ecol. Econ. 2018, 152, 131–140. [Google Scholar] [CrossRef]
- Hlalele, B.M. Application of the force-field technique to drought vulnerability analysis: A phenomenological approach. Jàmbá J. Disaster Risk Stud. 2019, 11, 1–6. [Google Scholar] [CrossRef] [PubMed]
- Ahmadalipour, A.; Moradkhani, H.; Castelletti, A.; Magliocca, N. Future drought risk in Africa: Integrating vulnerability, climate change, and population growth. Sci. Total Environ. 2019, 662, 672–686. [Google Scholar] [CrossRef] [PubMed]
- Zeng, Z.Q.; Wu, W.X.; Li, Z.L.; Zhou, Y.; Guo, Y.H.; Huang, H. Agricultural Drought Risk Assessment in Southwest China. Water 2019, 11, 1064. [Google Scholar] [CrossRef]
- Fan, L.L.; Wang, H.R.; Liu, Z.P.; Li, N. Quantifying the relationship between drought and water scarcity using Copulas: Case study of Beijing-Tianjin-Hebei metropolitan areas in China. Water 2018, 10, 1622. [Google Scholar] [CrossRef]
- Wang, R.; Zhang, J.; Guo, E.L. Integrated drought risk assessment of multi-hazard-affected bodies based on copulas in the Taoerhe Basin, China. Theor. Appl. Climatol. 2019, 135, 577–592. [Google Scholar] [CrossRef]
- Huang, C.F.; Moraga, C. Extracting fuzzy if-then rules by using the information matrix technique. J. Comput. Syst. Sci. 2005, 70, 26–52. [Google Scholar] [CrossRef]
- Li, Q.; Zhou, J.; Liu, D.; Jiang, X. Research on flood risk analysis and evaluation method based on variable fuzzy sets and information diffusion. Saf. Sci. 2012, 50, 1275–1283. [Google Scholar] [CrossRef]
- Wang, Y.; Zhao, W.; Zhang, Q.; Yao, Y.B. Characteristics of drought vulnerability for maize in the eastern part of Northwest China. Sci. Rep. 2019, 9, 964. [Google Scholar] [CrossRef] [PubMed]
- Wang, F.X.; Zuo, D.D.; Feng, G.L. Analysis of the drought vulnerability characteristics in Northeast China based on the theory of information distribution and diffusion. Acta Phys. Sin. 2014, 63, 229201. [Google Scholar]
- Jiang, S.Z.; Yang, R.X.; Cui, N.B.; Zhao, L.; Liang, C. Analysis of Drought Vulnerability Characteristics and Risk Assessment Based on Information Distribution and Diffusion in Southwest China. Atmosphere 2018, 9, 239. [Google Scholar] [CrossRef]
- Hargreaves, G.H.; Samani, Z.A. Reference crop evapotranspiration from temperature. Appl. Eng. Agric. 1985, 1, 96–99. [Google Scholar] [CrossRef]
- Anderson, M.C.; Hain, C.; Wardlow, B.; Pimstein, A.; Mecikalski, J.R.; Kustas, W.P. Evaluation of drought indices based on thermal remote sensing of evapotranspiration over the continental United States. J. Clim. 2011, 24, 2025–2044. [Google Scholar] [CrossRef]
- Thiessen, A.H. Precipitation averages for large areas. Mon. Weather Rev. 1911, 39, 1082–1084. [Google Scholar] [CrossRef]
- Wang, Y.F.; Chen, X.W.; Chen, Y.; Liu, M.B.; Gao, L. Flood/drought event identification using an effective indicator based on the correlations between multiple time scales of the Standardized Precipitation Index and river discharge. Theor. Appl. Climatol. 2017, 128, 159–168. [Google Scholar] [CrossRef]
- Huang, C.F.; Guo, J.; Ai, F.L.; Wu, T. Basic paradigm of risk analysis in flood disaster and its application. J. Nat. Disasters 2013, 22, 11–23. (In Chinese) [Google Scholar]
- He, D.; Wang, J.; Pan, Z.H.; Dai, T.; Wang, E.L.; Zhang, J.P. Changes in wheat potential productivity and drought severity in Southwest China. Theor. Appl. Climatol. 2017, 130, 477–486. [Google Scholar] [CrossRef]
- Lu, H.; Zhang, X.Y.; Liu, S.D. Risk assessment to China’s agricultural drought disaster in county unit. Nat. Hazards 2012, 61, 785–801. [Google Scholar]
- Wang, H.J.; Chen, Y.N.; Pan, Y.P.; Chen, Z.S.; Ren, Z.G. Assessment of candidate distributions for SPI/SPEI and sensitivity of drought to climatic variables in China. Int. J. Climatol. 2019, 39, 4392–4412. [Google Scholar] [CrossRef]
- Potop, V.; Boroneant, C.; Mozny, M.; Stepanek, P.; Skalak, P. Observed spatiotemporal characteristics of drought on various time scales over the Czech Republic. Theor. Appl. Climatol. 2014, 115, 563–581. [Google Scholar] [CrossRef]
- David, O.G.; de la Cruz Bartolón, J.; Heidy, V. Castellano Bahena. Drought Vulnerability Indices in Mexico. Water 2019, 10, 1671. [Google Scholar]
- Djebou, D.C.S. Dagbegnon ClementSohoulande Djebou. Bridging drought and climate aridity. J. Arid Environ. 2017, 144, 170–180. [Google Scholar] [CrossRef]
- Dagbegnon, C.; Sohoulande Djebou, D.C.S.; Singh, V.P. Impact of climate change on the hydrologic cycle and implications for society. Environ. Soc. Psychol. 2016, 1, 36–49. [Google Scholar]


| Grade | Type | SPEI Value |
|---|---|---|
| 0 | Normal | >−0.5 |
| 1 | Mild drought | (−1.00, −0.5) |
| 2 | Moderate drought | (−1.5, −1) |
| 3 | Severe drought | (−2.0, −1.5) |
| 4 | Extreme drought | <−2.0 |
| Provinces | SPEI1 | SPEI3 | SPEI6 | SPEI9 | SPEI12 | SPEI24 | |
|---|---|---|---|---|---|---|---|
| CC1 | 0.48 ** | 0.60 ** | 0.64 ** | 0.60 ** | 0.46 ** | 0.16 | |
| Anhui | CC2 | 0.56 ** | 0.69 ** | 0.72 ** | 0.66 ** | 0.49 ** | 0.14 |
| CC3 | 0.49 ** | 0.57 ** | 0.60 ** | 0.54 ** | 0.42 ** | 0.36 ** | |
| CC1 | 0.07 | 0.23 | 0.37 ** | 0.43 ** | 0.41 ** | 0.24 | |
| Hebei | CC2 | 0.36 * | 0.45 ** | 0.61 ** | 0.61 ** | 0.57 ** | 0.45 ** |
| CC3 | 0.30 * | 0.36 ** | 0.55 ** | 0.62 ** | 0.61 ** | 0.60 ** | |
| CC1 | 0.16 | 0.17 | 0.20 | 0.18 | 0.18 | −0.06 | |
| Henan | CC2 | 0.37 ** | 0.38 ** | 0.44 ** | 0.41 ** | 0.36 * | −0.02 |
| CC3 | 0.31 * | 0.30 * | 0.31 * | 0.28 * | 0.27 * | 0.09 | |
| CC1 | 0.17 | 0.35 * | 0.25 | −0.11 | 0.19 | 0.18 | |
| Heilongjiang | CC2 | 0.28 ** | 0.42 ** | 0.32 * | 0.02 | 0.24 | 0.24 |
| CC3 | 0.16 | 0.36 * | 0.25 | 0.36 * | 0.15 | 0.15 | |
| CC1 | 0.57 ** | 0.57 ** | 0.55 ** | 0.47 ** | 0.35 * | 0.15 | |
| Hubei | CC2 | 0.60 ** | 0.51 ** | 0.54 ** | 0.42 ** | 0.35 * | 0.21 |
| CC3 | 0.61 ** | 0.57 ** | 0.66 ** | 0.62 ** | 0.44 ** | 0.15 | |
| CC1 | 0.45 ** | 0.44 ** | 0.35 * | 0.19 | 0.11 | 0.03 | |
| Hunan | CC2 | 0.34 ** | 0.40 ** | 0.29 * | 0.17 | 0.08 | 0.04 |
| CC3 | 0.37 ** | 0.36 ** | 0.18 | 0.04 | 0.01 | 0.09 | |
| CC1 | 0.25 | 0.55 ** | 0.45 ** | 0.38 ** | 0.30 * | 0.31 * | |
| Jilin | CC2 | 0.24 | 0.61 ** | 0.48 ** | 0.48 ** | 0.41 ** | 0.35 * |
| CC3 | 0.27 * | 0.56 ** | 0.50 ** | 0.51 ** | 0.46 ** | 0.35 * | |
| CC1 | 0.68 ** | 0.75 ** | 0.79 ** | 0.74 ** | 0.67 ** | 0.41 ** | |
| Jiangsu | CC2 | 0.63 ** | 0.59 ** | 0.59 ** | 0.47 ** | 0.35 * | 0.06 |
| CC3 | 0.60 ** | 0.64 ** | 0.76 ** | 0.69 ** | 0.60 ** | 0.60 ** | |
| CC1 | 0.60 ** | 0.71 ** | 0.64 ** | 0.51 ** | 0.35 * | 0.04 | |
| Jiangxi | CC2 | 0.52 ** | 0.61 ** | 0.61 ** | 0.45 ** | 0.30 * | 0.01 |
| CC3 | 0.47 ** | 0.59 ** | 0.49 ** | 0.35 * | 0.21 | −0.04 | |
| CC1 | 0.44 ** | 0.68 ** | 0.76 ** | 0.72 ** | 0.67 ** | 0.50 ** | |
| Liaoning | CC2 | 0.54 ** | 0.73 ** | 0.84 ** | 0.83 ** | 0.77 ** | 0.56 ** |
| CC3 | 0.55 ** | 0.82 ** | 0.89 ** | 0.81 ** | 0.81 ** | 0.69 ** | |
| Inner Mongolia | CC1 | 0.41 ** | 0.46 ** | 0.51 ** | 0.46 ** | 0.36 * | 0.30 * |
| CC2 | 0.31 ** | 0.41 ** | 0.55 ** | 0.51 ** | 0.42 ** | 0.34 ** | |
| CC3 | 0.43 ** | 0.60 ** | 0.69 ** | 0.66 ** | 0.60 ** | 0.46 ** | |
| CC1 | 0.24 | 0.39 ** | 0.49 ** | 0.48 ** | 0.47 ** | 0.43 ** | |
| Shandong | CC2 | 0.33 * | 0.46 ** | 0.57 ** | 0.59 ** | 0.59 ** | 0.56 ** |
| CC3 | 0.37 * | 0.57 ** | 0.65 ** | 0.70 ** | 0.68 ** | 0.53 ** | |
| CC1 | 0.23 | 0.32 * | 0.43 ** | 0.42 ** | 0.32 * | 0.08 | |
| Sichuan | CC2 | 0.33 * | 0.36 * | 0.48 ** | 0.52 ** | 0.40 ** | 0.15 |
| CC3 | 0.61 ** | 0.57 ** | 0.66 ** | 0.62 ** | 0.44 ** | 0.15 |
| Provinces | SPEI1 | SPEI3 | SPEI6 | SPEI9 | SPEI12 | SPEI24 | |
|---|---|---|---|---|---|---|---|
| S1 | −1.5 | −0.9 | −1.1 | ||||
| Anhui | S2 | −1.5 | −1.3 | −1.1 | |||
| S3 | −1.5 | −1.3 | −1.4 | ||||
| S1 | −0.6 | −0.8 | −0.8 | ||||
| Hebei | S2 | −0.1 | −0.1 | −0.5 | |||
| S3 | −0.1 | −0.1 | −0.7 | ||||
| S1 | −0.6 | −0.8 | −0.8 | ||||
| Henan | S2 | −0.1 | −0.1 | −0.5 | |||
| S3 | −2 | −0.7 | −0.5 | ||||
| S1 | −1 | −2 | −0.1 | ||||
| Heilongjiang | S2 | −0.6 | −1.8 | −0.1 | |||
| S3 | −0.1 | −0.1 | −0.7 | ||||
| S1 | −1.6 | −0.1 | −0.7 | ||||
| Hubei | S2 | −1.6 | −0.7 | −1.3 | |||
| S3 | −1.6 | −1.6 | −1.6 | ||||
| S1 | −0.2 | −0.3 | −0.1 | ||||
| Hunan | S2 | −0.2 | −1 | −0.1 | |||
| S3 | −0.2 | −0.8 | |||||
| S1 | −1.8 | −0.5 | −0.1 | ||||
| Jilin | S2 | −1.9 | −0.5 | −0.4 | |||
| S3 | −1.8 | −1 | −0.6 | ||||
| S1 | −1.8 | −1.4 | −1.9 | ||||
| Jiangsu | S2 | −0.6 | −1.4 | −1.4 | |||
| S3 | −1.8 | −1.8 | −1.5 | ||||
| S1 | −0.6 | −0.8 | −0.1 | ||||
| Jiangxi | S2 | −0.7 | −0.8 | −1.9 | |||
| S3 | −1.7 | −0.7 | −1.9 | ||||
| S1 | −0.6 | −0.1 | −0.1 | ||||
| Liaoning | S2 | −0.8 | −0.2 | −0.1 | |||
| S3 | −1.6 | −1.7 | −1.7 | ||||
| Inner Mongolia | S1 | −0.4 | −0.4 | −0.3 | |||
| S2 | −0.1 | −0.1 | −0.1 | ||||
| S3 | −1.5 | −1.5 | −1.5 | ||||
| S1 | −0.4 | −0.1 | −0.6 | ||||
| Shandong | S2 | −0.4 | −0.4 | −0.6 | |||
| S3 | −1.2 | −0.4 | −0.7 | ||||
| S1 | −0.6 | −1 | −1 | ||||
| Sichuan | S2 | −0.6 | −1 | −1.6 | |||
| S3 | −1.6 | −1.6 | −1.6 |
| SPEI1 | SPEI3 | SPEI6 | SPEI9 | SPEI12 | SPEI24 | Average | Rank | ||
|---|---|---|---|---|---|---|---|---|---|
| R1 | 0.178 | 0.170 | 0.267 | 0.205 | 9 | ||||
| Anhui | R2 | 0.117 | 0.102 | 0.137 | 0.118 | 9 | |||
| R3 | 0.019 | 0.046 | 0.023 | 0.028 | 5 | ||||
| R1 | 0.251 | 0.250 | 0.250 | 0.250 | 5 | ||||
| Hebei | R2 | 0.121 | 0.129 | 0.128 | 0.126 | 7 | |||
| R3 | 0.019 | 0.022 | 0.025 | 0.023 | 10 | ||||
| R1 | 0.212 | 0.211 | 0.226 | 0.217 | 8 | ||||
| Henan | R2 | 0.200 | 0.119 | 0.126 | 0.148 | 4 | |||
| R3 | 0.026 | 0.023 | 0.027 | 0.026 | 7 | ||||
| Heilong Jiang | R1 | 0.244 | 0.251 | 0.299 | 0.265 | 4 | |||
| R2 | 0.120 | 0.132 | 0.134 | 0.129 | 5 | ||||
| R3 | 0.041 | 0.026 | 0.043 | 0.037 | 3 | ||||
| R1 | 0.148 | 0.156 | 0.167 | 0.157 | 11 | ||||
| Hubei | R2 | 0.077 | 0.134 | 0.125 | 0.112 | 10 | |||
| R3 | 0.016 | 0.022 | 0.038 | 0.024 | 9 | ||||
| R1 | 0.107 | 0.162 | 0.199 | 0.156 | 12 | ||||
| Hunan | R2 | 0.033 | 0.097 | 0.136 | 0.089 | 11 | |||
| R3 | 0.014 | 0.021 | 0.029 | 0.022 | 11 | ||||
| R1 | 0.491 | 0.280 | 0.267 | 0.346 | 2 | ||||
| Jilin | R2 | 0.351 | 0.152 | 0.149 | 0.217 | 1 | |||
| R3 | 0.005 | 0.049 | 0.033 | 0.029 | 4 | ||||
| R1 | 0.152 | 0.157 | 0.414 | 0.240 | 7 | ||||
| Jiangsu | R2 | 0.047 | 0.074 | 0.078 | 0.066 | 12 | |||
| R3 | 0.008 | 0.011 | 0.008 | 0.009 | 13 | ||||
| R1 | 0.089 | 0.096 | 0.093 | 0.093 | 13 | ||||
| Jiangxi | R2 | 0.047 | 0.068 | 0.073 | 0.063 | 13 | |||
| R3 | 0.015 | 0.014 | 0.019 | 0.016 | 12 | ||||
| R1 | 0.313 | 0.279 | 0.336 | 0.309 | 3 | ||||
| Liaoning | R2 | 0.127 | 0.142 | 0.179 | 0.149 | 3 | |||
| R3 | 0.058 | 0.075 | 0.095 | 0.076 | 2 | ||||
| Inner Mongolia | R1 | 0.384 | 0.334 | 0.334 | 0.351 | 1 | |||
| R2 | 0.168 | 0.208 | 0.208 | 0.195 | 2 | ||||
| R3 | 0.081 | 0.081 | 0.080 | 0.081 | 1 | ||||
| R1 | 0.240 | 0.228 | 0.254 | 0.241 | 6 | ||||
| Shandong | R2 | 0.114 | 0.122 | 0.120 | 0.119 | 8 | |||
| R3 | 0.027 | 0.021 | 0.025 | 0.025 | 8 | ||||
| R1 | 0.206 | 0.242 | 0.168 | 0.206 | 10 | ||||
| Sichuan | R2 | 0.119 | 0.134 | 0.125 | 0.126 | 6 | |||
| R3 | 0.017 | 0.020 | 0.023 | 0.027 | 6 |
| P(R2|R1) | P(R3|R1) | P(R3|R2) | |
|---|---|---|---|
| Anhui | 0.578 | 0.249 | 0.144 |
| Hebei | 0.503 | 0.173 | 0.087 |
| Henan | 0.684 | 0.171 | 0.117 |
| Heilongjiang | 0.486 | 0.285 | 0.138 |
| Hubei | 0.715 | 0.226 | 0.162 |
| Hunan | 0.569 | 0.405 | 0.231 |
| Jilin | 0.628 | 0.134 | 0.084 |
| Jiangsu | 0.275 | 0.136 | 0.037 |
| Jiangxi | 0.677 | 0.257 | 0.174 |
| Liaoning | 0.483 | 0.512 | 0.247 |
| Inner Mongolia | 0.555 | 0.414 | 0.230 |
| Shandong | 0.493 | 0.205 | 0.101 |
| Sichuan | 0.613 | 0.217 | 0.133 |
© 2019 by the authors. Licensee MDPI, Basel, Switzerland. This article is an open access article distributed under the terms and conditions of the Creative Commons Attribution (CC BY) license (http://creativecommons.org/licenses/by/4.0/).
Share and Cite
Niu, K.; Hu, Q.; Zhao, L.; Jiang, S.; Yu, H.; Liang, C.; Wang, Y. Analysis of Agricultural Drought Risk Based on Information Distribution and Diffusion Methods in the Main Grain Production Areas of China. Atmosphere 2019, 10, 764. https://doi.org/10.3390/atmos10120764
Niu K, Hu Q, Zhao L, Jiang S, Yu H, Liang C, Wang Y. Analysis of Agricultural Drought Risk Based on Information Distribution and Diffusion Methods in the Main Grain Production Areas of China. Atmosphere. 2019; 10(12):764. https://doi.org/10.3390/atmos10120764
Chicago/Turabian StyleNiu, Kaijie, Qingfang Hu, Lu Zhao, Shouzheng Jiang, Haiying Yu, Chuan Liang, and Yintang Wang. 2019. "Analysis of Agricultural Drought Risk Based on Information Distribution and Diffusion Methods in the Main Grain Production Areas of China" Atmosphere 10, no. 12: 764. https://doi.org/10.3390/atmos10120764
APA StyleNiu, K., Hu, Q., Zhao, L., Jiang, S., Yu, H., Liang, C., & Wang, Y. (2019). Analysis of Agricultural Drought Risk Based on Information Distribution and Diffusion Methods in the Main Grain Production Areas of China. Atmosphere, 10(12), 764. https://doi.org/10.3390/atmos10120764