Article

Near Real-Time Monitoring of Formaldehyde in a Low-Energy School Building

by
Claire Trocquet
1,2,
Pierre Bernhardt
1,2,
Maud Guglielmino
1,
Isabelle Malandain
1,
Céline Liaud
2,
Stéphanette Englaro
2 and
Stéphane Le Calvé
1,2,*
1
Université de Strasbourg, CNRS, ICPEES UMR 7515, F-67000 Strasbourg, France
2
In’Air Solutions, 25 rue Becquerel, 67000 Strasbourg, France
*
Author to whom correspondence should be addressed.
Atmosphere 2019, 10(12), 763; https://doi.org/10.3390/atmos10120763
Submission received: 18 October 2019 / Revised: 26 November 2019 / Accepted: 27 November 2019 / Published: 30 November 2019
(This article belongs to the Special Issue Green Buildings and Indoor Air Quality)

Abstract

:
The emergence of new super-insulated buildings to reduce energy consumption places the quality of indoor air at the center of the debate. Among the indoor air pollutants, aldehydes are often present, and formaldehyde is of major interest regarding its multiple sources and its health impact. Therefore, French regulations expect to reduce formaldehyde concentrations below 10 μg m−3 in public buildings by 2023. Formaldehyde and other aldehydes were measured for two weeks during an intensive field campaign conducted in a school recently built and equipped with programmable dual-flow ventilation. Aldehydes were monitored with the ISO 16000-3 reference method based on sampling with 2,4-dinitrophenylhydrazine (DNPH) tubes while formaldehyde concentration was continuously measured by using a sensitive near real-time formaldehyde microanalyzer with a detection limit of 1 µg m−3. Formaldehyde was the major aldehyde. Its concentrations varied in the range of 2–25 µg m−3 and decreased by half when mechanical ventilation was ON, while the other ones were always below 5 µg m−3. In addition, an excellent agreement was observed between the different analytical techniques deployed to quantify formaldehyde levels. The microanalyzer was able to measure fast variations of formaldehyde concentration in the studied room, according to the building's ventilation periods.

Graphical Abstract

1. Introduction

Buildings are responsible for about 40% of the total world annual energy consumption [1]. To reduce this exorbitant energy consumption of buildings, new buildings are now designed and built to minimize energy losses for about 10–15 years. A low-energy building is characterized by an energy-efficient design and technical features that enable it to provide high living standards and comfort with low energy consumption. These super-insulated buildings can nevertheless be deleterious because the pollutants emitted inside can be imprisoned. Therefore, a simple or double-flow mechanical ventilation is often used to limit this risk and renew indoor air. The double-flow mechanical ventilation is now preferred since it allows, through an exchanger, to recover the heat of the extracted air and to transfer it to the blown air.
Although the pollution levels in conventional buildings have been largely studied, in particular, in France, with the large-scale investigations by the French indoor air quality observatory (OQAI) [2], not much is known about the indoor air quality of low-energy buildings, be it private dwellings [3] or public use buildings such as schools [4]. Indoor Air Quality (IAQ) in schools is of particular importance because of the significant amount of time spent there by children, who have a high susceptibility to pollutants. To evaluate the exposure of occupants to pollutants in these environments, it is, therefore, necessary to quantify the pollutants levels and their concentration time profiles to better understand the main pollution determinants (sources, sinks, and processes).
Formaldehyde is both an indoor and outdoor air pollutant [5]. Nevertheless, it is mainly a major indoor air pollutant regarding its multiple sources in this confined environment: building materials, furniture, combustion, etc. [6,7]. Several studies [8,9] have shown that indoor formaldehyde levels are several times higher than outdoor ones and vary, typically, between 10 and 100 μg m−3 [9,10,11]. Formaldehyde’s impacts on health are numerous [12]. Casset and coworkers have shown the implication of formaldehyde in allergic diseases like allergic asthma [13]. From 2004, formaldehyde has been classified as carcinogenic to humans by the International Agency for Research on Cancer [13,14]. French formaldehyde guideline values have been suggested for indoor air: 10 and 50 µg m−3 for long- and short-term exposures, respectively [15]. Thus, French recommendations aim at reducing formaldehyde levels in public buildings to 10 μg m−3 by 2023 (Decree n° 2011–1727 published in 2011) [16]. This is why sensitive and transportable instruments performing in situ formaldehyde analysis are required. Table 1 summarizes in a nonexhaustive way the analytical methods dedicated to airborne formaldehyde quantification [17,18,19,20,21,22,23,24,25,26].
The reference method ISO16000-3 (ISO, 2001), recommended by air monitoring agency (ASTM International, 2009, Conshohocken, PA, USA), uses a 2,4-dinitrophenylhydrazine (DNPH)-tube sample coupled to an offline analysis by HPLC/UV, which implies costly and time-consuming analyses. To overcome these drawbacks, many real-time miniature and portable devices have been developed [27,28,29] where chemical reagents react specifically with formaldehyde to produce color change on the detection element. Nevertheless, for the major part of devices, continuous monitoring was not possible since the reaction on the solid detection element was not reversible. In addition, the sensitivity of such sensors was usually insufficient to quantify the very low formaldehyde levels targeted by regulations.
Another type of analytical devices based on the formaldehyde uptake into an aqueous solution coupled to either fluorescence or UV spectroscopic detection has also been developed, specifically, in our laboratory [17,18,30]. The final formaldehyde microanalyzer prototype is a compact portable instrument weighing less than 4 kg. The analytical device is standalone and programmable thanks to a homemade Windows software and exhibits response and resolution time of 10 min and 2 s, respectively.
During the MERMAID project (Representative Experimental Measurements and Detailed Indoor Model), air quality was first evaluated in a set of ten French recently new school buildings, by way of passive samplings [4]. In a second stage, the gas and particulate composition of the air was investigated in one of the buildings with high-time resolution instruments [31].
The objectives of this study are two-fold: firstly, to provide experimental data on the temporal variations of aldehydes concentrations in a Low-Energy building, and secondly, to test, under real conditions, a new formaldehyde analyzer which has already been validated by previous laboratory studies [17,18]. Therefore, this work reports formaldehyde and aldehydes measurements in indoor air for two weeks during the MERMAID intensive field campaign performed in a junior high school recently built according to the French thermal regulation of 2005. The campaign took place during the winter holidays from 23 February 2015 to 6 March 2015. The school was equipped with dual flow controlled mechanical ventilation in order to ensure a good air exchange rate (more than 2 h−1) to provide a healthier atmosphere inside classrooms, the student performance being highly related to indoor air quality as already mentioned in the literature [32,33]. Formaldehyde concentration was continuously monitored with a recent portable formaldehyde analyzer based on a microfluidic device whereas other aldehydes were measured by using the conventional reference method ISO16000-3 based on sampling with active DNPH tubes. The results were then interpreted and analyzed by correlating concentration levels and ventilation periods. In addition, the formaldehyde measurements obtained with the miniaturized analyzer were then compared to those obtained with the reference method ISO16000-3 and with the previous formaldehyde analyzer developed in our laboratory [30]. In our better knowledge, this is the first study reporting real-time airborne formaldehyde measurements in a low-energy school recently built and equipped with double-flow ventilation.

2. Experiments

Here are described the three analytical techniques used in this work for gaseous formaldehyde quantification, including our new formaldehyde microfluidic device, the first generation of formaldehyde analyzer developed in our laboratory [30] and the reference method ISO16000-3 using a DNPH tube [34]. Some information related to the investigated school, especially to its ventilation system and air sampling conditions, is also given.

2.1. Reference Method ISO 16000-3 Using DNPH Tube

The reference ISO 16000-3 method for aldehydes detection is based on active sampling using 2,4-Dinitrophenylhydrazine (DNPH) tube (Waters, Sep-Pak, Saint-Quentin-en-Yvelines, France) followed by hydrazones quantification by HPLC-UV [34]. This method allows the quantification of all aldehydes present in ambient air. In this study, air is sampled with two automatic sampling devices, namely DNPH MP4V and DNPH MP8V, composed of a mass flow controller (Bronkhorst, Nijverheidsstraat, The Netherlands), a gas pump (830 KNDC, KNF) and 4 or 8 ways, each one equipped with two solenoid valves (VDW23-6G-3, SMC). These two autosamplers operate at either 0–500- or 0–2000-mL min−1, respectively. Once sampling achieved, DNPH tubes are stored at 4 °C and then eluted with 2–3 mL of acetonitrile (Sigma Aldrich, 99.8%). An amount of 20 µL of the resulting hydrazones solution is then injected and quantified by HPLC/UV using an external calibration, hydrazones being separated through a nonpolar C18 column and detected at 360 nm [5,11]. This offline method is not formaldehyde-specific, very time-consuming, and requires bulky and expensive equipment.

2.2. First Generation of Formaldehyde Analyzer

The first generation of formaldehyde analyzer has been developed in our laboratory (Zheng, 2010). This patented analytical method [30] was based on three highly coupled steps: (1) uptake of gaseous formaldehyde into an aqueous solution through a microporous tube with an uptake yield of 93 ± 12%, using 300 mL min−1 of air and a liquid flow of 1200 µL min−1; (2) a chemical reaction between formaldehyde and fluoral-p via a Hantzsch reaction (see detailed mechanism in Figure S1); and (3) Fluorescence detection of the reaction product, 3.5-diacetyl-1.4-dihydrolutidine (DDL). Fluoral-p is in situ produced by a reaction of acetylacetone (Sigma-Aldrich, 98%, Saint-Quentin-Fallavier, France) in the presence of acetic acid (Sigma-Aldrich, 98%) and ammonium acetate (Sigma-Aldrich, 99%) according to the procedure previously reported [35].
The uptake part of this device is represented in Figure S2 and operates in “stop and flow” mode. The liquid reagent flow passes either through the microporous tube or by a bypass, two 3-way solenoid valves allowing to switch between the two fluidic circuits. While the liquid flows through the bypass to obtain the baseline signal, the air is simultaneously sampled around the microporous tube previously filled with the reagent. This is later immobile and concentrates formaldehyde from the gas phase for typically 4 min, which corresponds to the uptake step. Afterward, the two 3-way solenoid valves switch, the reagent then flows through the fluidic microporous tube to eluate the trapped formaldehyde to an oven maintained at 65 °C, permitting the achievement of the full reaction in less than 3 min. The fluorescence is continuously measured with a time resolution of 2 s, enabling the visualization of the peak of 3.5-diacetyl-1.4-dihydrolutidine (DDL), this later being proportional to its concentration, similarly to the chromatographic approach. The fluorescence of DDL is excited by an LED centered at 415 nm and is then collected perpendicularly on a photomultiplier preceded by a 530 ± 40 nm band-pass filter (Hamamatsu) to prevent any interferences.
Its detection limit lower than 1 µg m−3 and its resulting temporal resolution of 10 min can be considered as enough for indoor air monitoring. However, its use for field campaign is quite constraining due to its high reagents consumption (1.1 mL min−1, i.e., 66 mL h−1 or 1584 mL day−1), its weight (8 kg excluding reagents and waste bottles), and its size (28.5 cm × 23 cm × 38 cm).

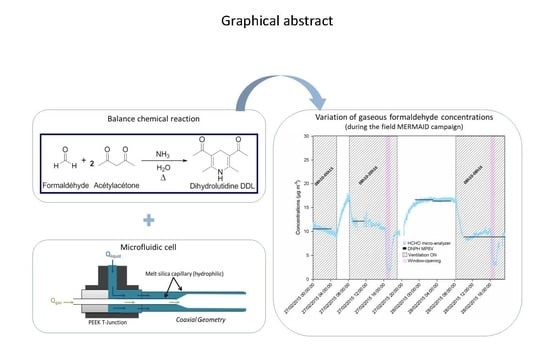
2.3. Formaldehyde Microanalyzer Based on a Microfluidic Device

The analytical method recently developed in our laboratory was already detailed in our previous studies [17,18]. As shown in Figure 1, this analytical method is also based on three highly coupled steps: (1) the uptake of gaseous formaldehyde into an aqueous acetylacetone solution at room temperature; (2) the chemical reaction between formaldehyde and acetylacetone via the Hantzsch mechanism [36]; and (3) the fluorescence detection of the reaction product, i.e., 3.5-diacetyl-1.4-dihydrolutidine (DDL).
Air is sampled at 20 mL min−1 by a mass flow controller (IQ+Flow, Bronkhorst) combined to a mini air pump (270 EC, Schwarzer) to maintain a stable gas flow injected coaxially into the capillary of 150 cm long and 530 µm ID. At the same time, the aqueous acetylacetone liquid solution prepared according to the same procedure mentioned above is continuously injected at 17 µL min−1 by a micro peristaltic pump through a specific Tee into the same capillary [17,18]. The coinjection of both the gas mixture and the aqueous acetylacetone solution into the capillary (see Figure S3) permits a diphasic flow to be obtained. Depending on gas and liquid flows ratio, three different flow regimes can be obtained: bubble, slug, and annular flow [17,18,37]. Guglielmino et al. (2017a, 2017b) have shown that the annular flow allows the improvement of the uptake of gaseous formaldehyde into the acetylacetone solution leading to an uptake yield of about 90–100%. Then, the gas escapes from the liquid through a microporous tube and the resulting gas-free formaldehyde liquid solution enters a temperature-regulated oven at 65 °C where the reaction with acetylacetone solution occurs (see detailed mechanism in Figure S1). For the given liquid flow rate of 17 µL min−1, the reaction time of about 3.5 min is controlled through the length of the tubing installed inside the oven. Finally, the gas-free solution enters the fluorescence cell for DDL detection, DDL being excited by an LED centered at 415 nm and fluorescence being collected on a photomultiplier (Hamamatsu, Massy, France) coupled to a 530 ± 40 nm band-pass filter. The fluorescence signal is then amplified with a gain set to 50% and averaged on two seconds.
Within these experimental conditions, the analytical set-up has a temporal resolution of two seconds and a response time of ten minutes, corresponding to the residential time of the liquid to reach the detection cell. Its liquid reagent consumption becomes moderated (1.02 mL h−1 or 24.5 mL day−1) so that with 100 mL of liquid reagent, its autonomy reaches 98 h, i.e., 4.1 days. The analytical instrument is 45 cm in length, 33 cm wide, and 15 cm in height, corresponding to a weight of 4 kg including its chemical reagent, waste bottles, and its aluminum suitcase (see Figure S4). This analytical instrument is fully controlled by homemade Windows software, providing data acquisition, data processing, and automatic concentration calculation. Finally, its low weight and size combined with its low reagent consumption make it comfortable to use for in-situ measurements.

2.4. Description of the School Building and the Chosen Classroom

As indicated in Figure S5, the studied building was a junior high school located in a residential area of northern France (50°16’39” North, 3°58’24” East). This school was newly constructed according to the French energy regulation of 2005 (RT 2005) and building materials were chosen for their environmental qualities in order to limit the pollutant emissions. The investigated classroom is represented in Figure S6 together with the sampling lines, the analytical instruments, and the locations of ventilation inlet and ventilation extraction. The chosen classroom was located on the southern first floor and had three doors and three double windows. The walls were painted, and vinyl covered the floor. Its volume was approximately equal to 140 m3 (6.6 m width × 7.9 m length × 2.7 m height).

2.5. Sampling Conditions

Indoor and outdoor pollutant levels, temperature, and relative humidity were monitored by numerous instruments with typical high time resolution of 1 min during this field campaign. The analytical instruments were placed in the adjacent room (see Figure S6). Sampling lines were made of ¼-inches Teflon tubes (Figure S5), with each formaldehyde instrument having its own sampling line. As shown in Figure S5, the sampling lines were arranged near the classroom center at approximately 1.20 m above the ground. The sampling flow rates were fixed at 20 and 300 mL min−1 for the formaldehyde microanalyzer and the formaldehyde analyzer, respectively. For the reference method, sampling flows varied between 200 and 1300 mL min−1 for different durations corresponding to final sampling volumes of 60–160 L.
Additional airborne aldehydes measurements were conducted at the ventilation inlet placed in the ceiling. For this, the end of the sampling tube was then placed 10 cm inside the vent.

2.6. Ventilation

2.6.1. Description of the Ventilation System

To provide comfort and a healthier atmosphere to the occupants, the school is equipped with a dual-flow controlled Mechanical Ventilation system with Heat Recovery. Outdoor air is mixed with a part of recycled indoor air, and the mixture is filtered, heated, and then propelled into the classrooms. When ventilation is active, the flow rate measured by CO2 decay is 300 m3 h−1, which corresponds to an air renewal rate of 2.1 h−1 [38]. When the ventilation is inactive, the airflow is only 30 m3 h−1, which corresponds to the leakage of the room and the airflow pumped by the various instruments. This ventilation system was programmed and activated according to the pupils’ presence to limit their pollutant exposure. It was deactivated during students’ absence or short breaks between two courses for reasons of energy consumption.

2.6.2. Classroom Ventilation Conditions during the Field Measurements

The field campaign was performed from 23 February 2015 to 6 March 2015 during the winter school holidays. Table S1 summarizes the ventilation scenarios undertaken for the 8 days where both formaldehyde analyzers operated simultaneously. For three days, the three windows were open for almost 1 h, either after a long period of ventilation, i.e., 27 or 28 February 2015 (ventilation ON) or without ventilation at all, i.e., 1 March 2015 (ventilation OFF). The last period aimed at reproducing the ventilation conditions usually used in this school (see Table S1) when the pupils were present. Thus, from 2 to 4 March 2015, the ventilation was switched ON from 8:10 to 9:45 (lecture), OFF from 9:45 to 10:10 (break), ON again from 10:10 to 11:45 (lecture), OFF from 11:45 to 13:30 (lunch break), and finally ON from 13:30 till the end of lectures at 17:20. Whatever the ventilation mode, indoor air was rapidly renewed, with outdoor air inducing rapid changes of formaldehyde concentration which constituted ideal conditions for testing the analytical instruments described above.

3. Results

3.1. Instruments Calibration and Detection Limits

Table 2 summarizes and compares the analytical performances of the three techniques used during the field MERMAID campaign, namely the reference method ISO16000-3 using a DNPH tube, the first generation of home-made formaldehyde analyzer and the new formaldehyde microanalyzer. Before any measurement campaign, precise calibration of the instruments is essential, either in the laboratory or directly on site. Therefore, the next sections describe the calibration procedures and the results obtained for each technique.

3.1.1. Reference Method ISO 16000-3 Using DNPH tube

The calibration of the HPLC-UV device used to analyze DNPH tube was performed in the laboratory before the field campaign. Linear calibration curves exhibiting correlation coefficients higher than 0.99 were obtained for concentrations of standard hydrazones solutions ranging between 0.5 and 10 mg L−1. This range is representative of those found during the field measurements. Assuming a typical sampling air volume of 100 L and considering a signal/noise ratio equal to 3, the limits of detection in air were found to be (in units of ng m−3) 8 (formaldehyde), 14 (acetaldehyde), 12 (propionaldehyde), 14 (benzaldehyde), and 27 (hexanal). The residual aldehydes concentrations in DNPH tubes were calculated from two or more blank tubes and then subtracted to the raw values obtained for field measurements.

3.1.2. First Generation of Formaldehyde Analyzer

Controlled gaseous formaldehyde concentrations were generated by a formaldehyde source previously developed in our laboratory [27,30] and operating typically at a total flow rate of 1500–2000 mL min−1. This formaldehyde source was then connected to the instrument inlet using 6 mm PTFE tubing. The gas calibration was realized before the field campaign at the same time as the microanalyzer for concentrations ranging from 16 to 50 µg m−3. Each generated gaseous formaldehyde concentration was controlled by performing air sampling at the formaldehyde source outlet on DNPH tube and determined according to the procedure described above and related to the reference method ISO 16000-3. The sampling flow ranged between 1200 and 1600 mL min−1 to obtain a final sampling volume of 70–120 L.
The fluorescence signal obtained with this first generation of formaldehyde analyzer increased linearly with the gaseous formaldehyde concentration, and the correlation coefficient was larger than 0.99. The resulting detection limit was evaluated to be smaller than 1 µg m−3.

3.1.3. Formaldehyde Microanalyzer Based on a Microfluidic Device

Concerning the novel formaldehyde microanalyzer, both liquid and gas calibrations were conducted before the field campaign for concentrations ranging from 15 to 285 µg L−1 and from 16 to 102 µg m−3 for liquid and gas, respectively. Again, known gaseous formaldehyde concentrations were generated by the same formaldehyde source while aqueous formaldehyde solutions were prepared from a commercial solution (Sigma-Aldrich, formaldehyde solution ACS reagent 37%) which was subsequently diluted with pure water.
Figure S7 represents the fluorescence signals obtained with the microanalyzer for the targeted liquid and gas concentrations, with the intensity of the signal being proportional to the formaldehyde concentration. Corresponding calibration curves with correlations coefficients higher than 0.995 are displayed in Figure S8 for both gaseous and liquid phases. The simultaneous gas and liquid calibrations permit the derivation of the yield of the formaldehyde uptake as follows [17]:
y i e l d   =   n H C H O   e x p e r i m e n t a l l y   u p t a k e n H C H O   t h e o r i t i c a l × 100   =   G a s e o u s   c a l i b r a t i o n   s l o p e L i q u i d   c a l i b r a t i o n   s l o p e × 100
Therefore, using the ratio of the two calibration slopes, a formaldehyde uptake yield of 102% was achieved, confirming the full uptake of gaseous formaldehyde in these experimental conditions.
Limits of detection (LD) and quantification (LQ) for gas analysis are equal to 1.2 µg m−3 and 4.0 µg m−3, respectively, for a time-resolution of 2 s. For liquid detection, LD and LQ are equal to 1.2 µg L−1 and 3.9 µg L−1. These LD and LQ have been extrapolated from the smallest formaldehyde concentration detected in the detection cell. Indeed, ratios Signal over Noise (S/N) have been determinate for each calibration with the intensity of the smallest signal, then, we can calculate the LQ equivalent to a ratio S/N equal to 10 and the LD corresponding to a ratio S/N equal to 3. Note that the sensitivity can be significantly improved when the time resolution increases from 2 to 60 or 120 s.

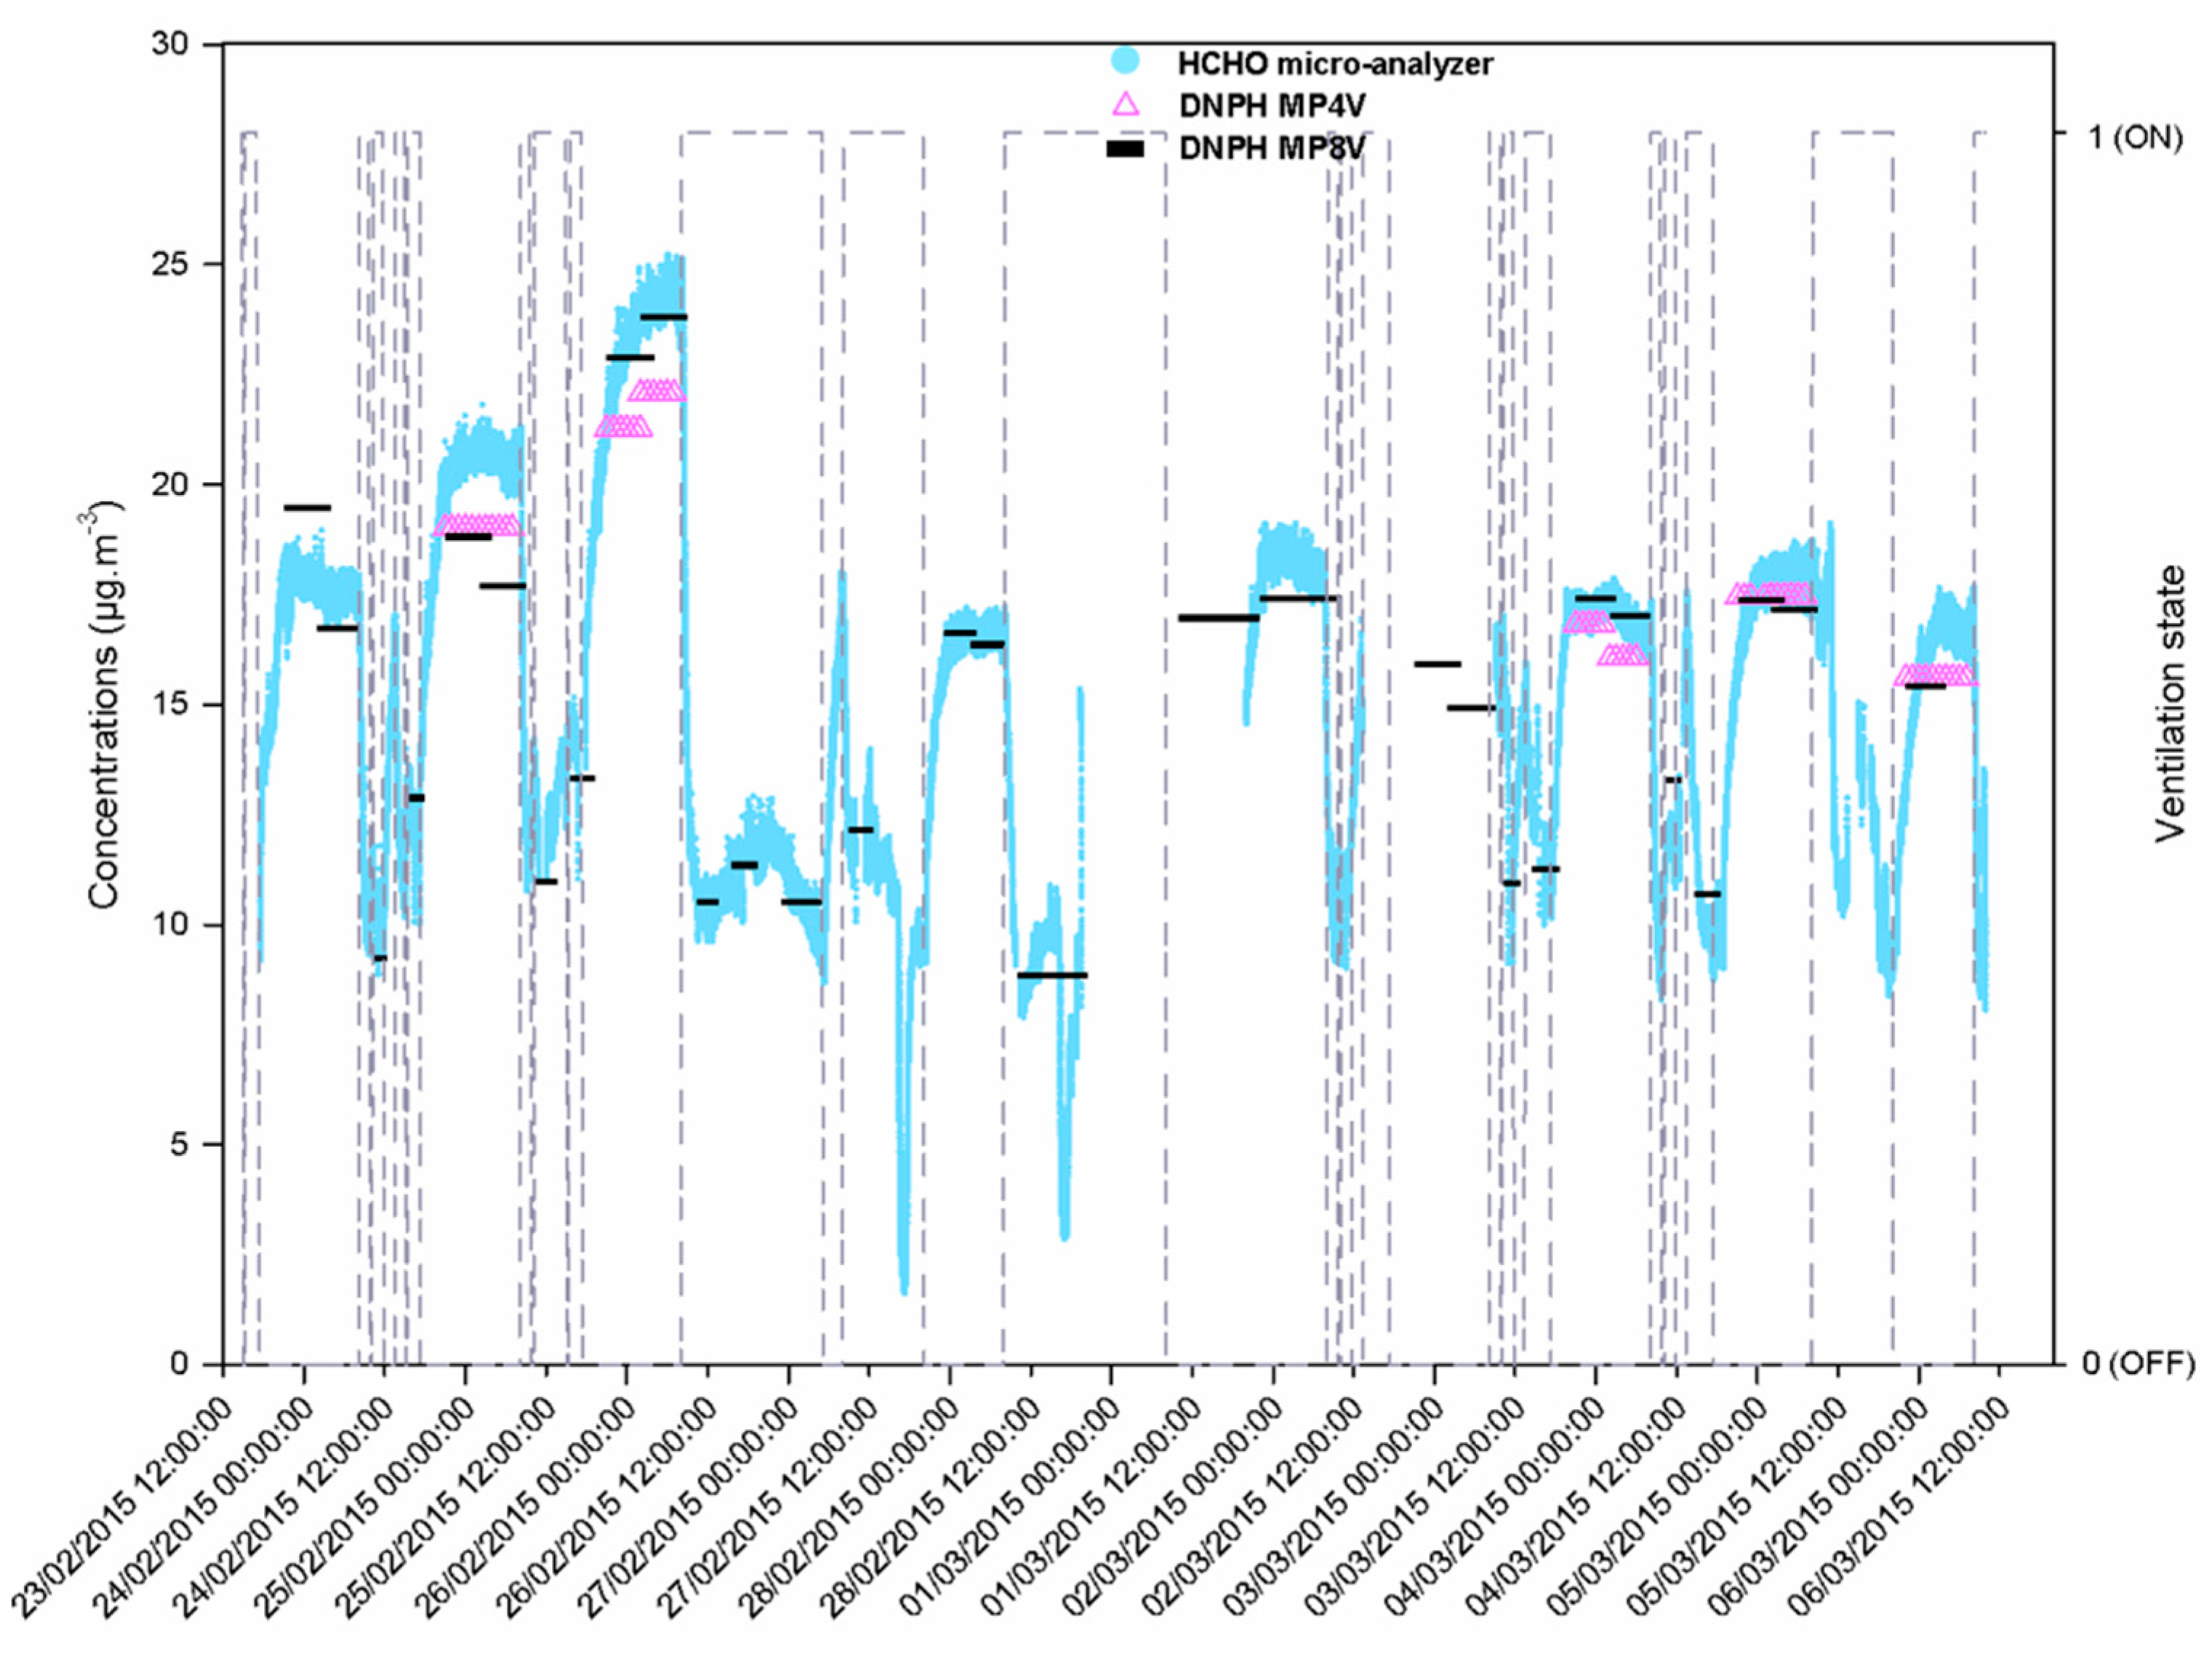
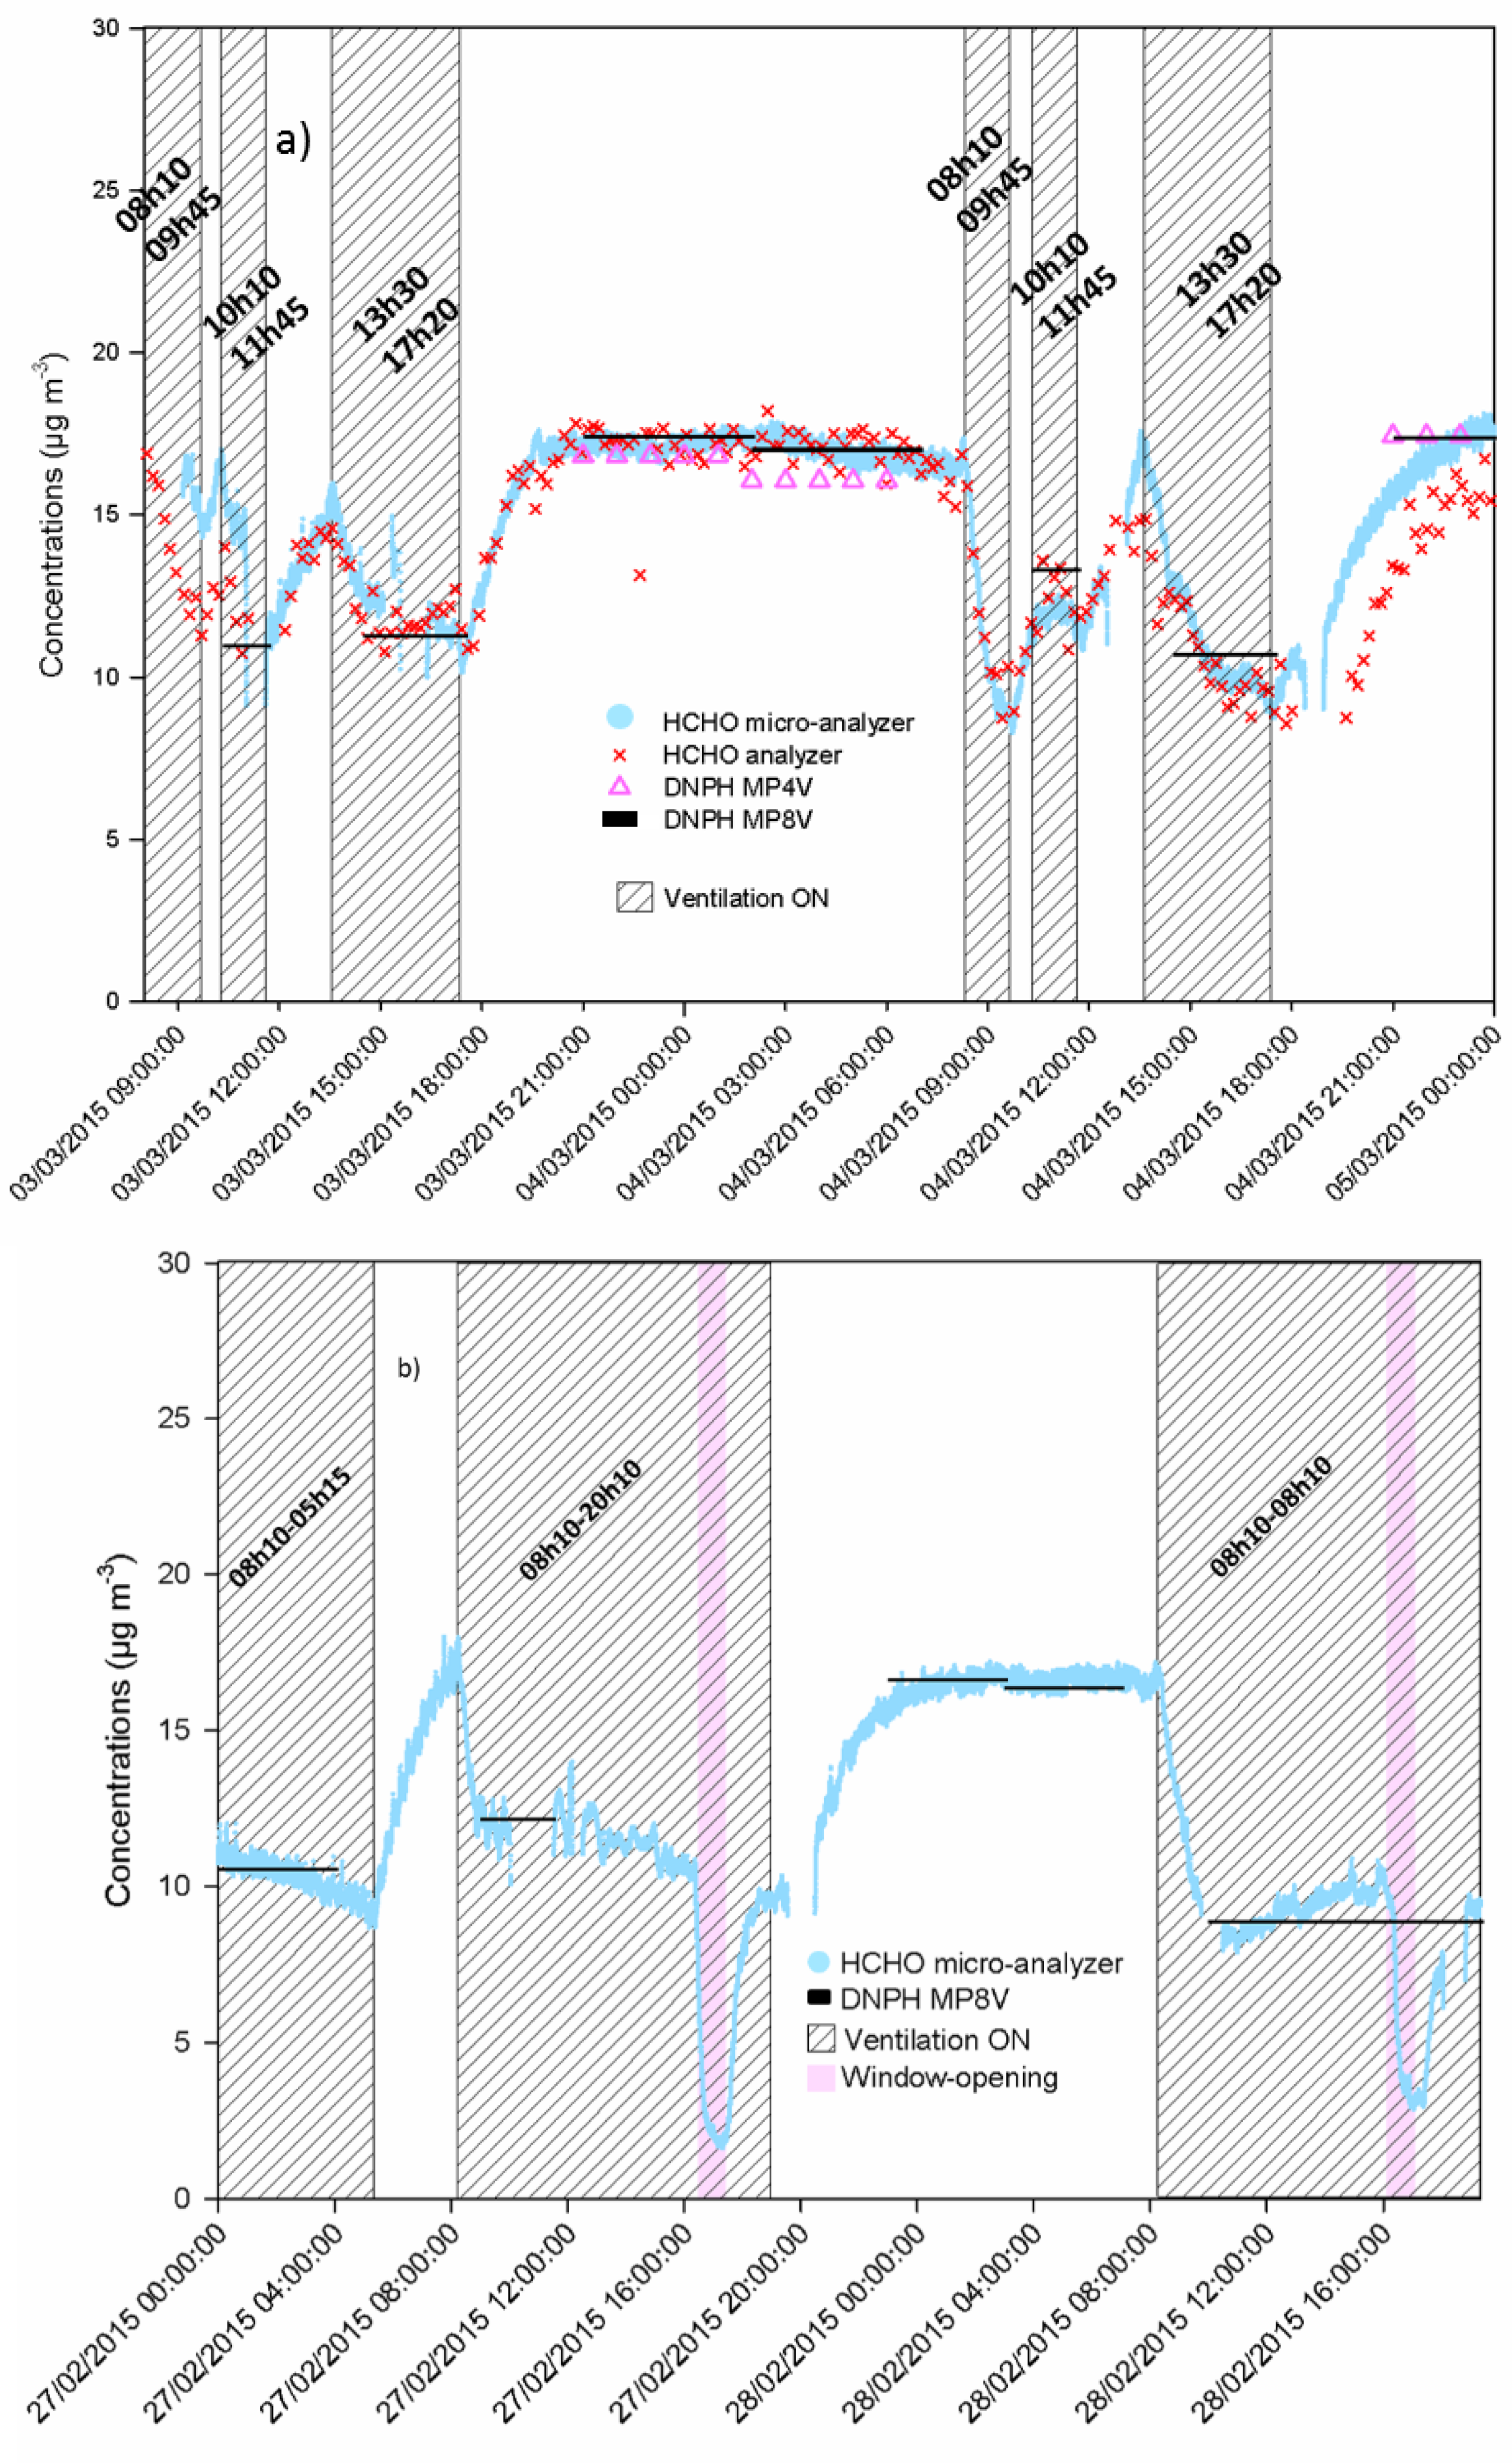
3.2. Formaldehyde Monitoring in the Classroom

When the instruments were installed and calibrated, both the formaldehyde analyzer and microanalyzer worked continuously for 11 consecutive days (see Figure 2).
Classroom doors and windows were maintained closed during the experiments and no one could enter inside the studied classroom, except for a few very brief moments to open/close the windows. The ventilation conditions were programmed in advance for at least a full day. When the windows were closed, both indoor temperature and Relative Humidity (RH) varied in the range 19–26 °C and 20–40%, respectively. RH increased up to 60% when the windows were open for one hour. Significant variations were measured between periods with and without ventilation, showing the effect of the ventilation and the microanalyzer performances. Formaldehyde concentrations were measured in the range 2–25 µg m−3, depending on the ventilation status.
The formaldehyde concentration was monitored using the three analytical techniques including under usual ventilations conditions where the ventilation was stopped several times, as shown for Tuesday 3 March and Wednesday 4 March in Figure 3a, where the activated ventilation periods of the building are drawn in grey. On Tuesday 3 March, the ventilation was then stopped at 17:20 at the end of class. Once ventilation was OFF, the formaldehyde concentration increased to reach a maximum (18 µg m−3 for 3 March 2015 nights) after about two hours. The ventilation was switched ON at 8:10 am on Wednesday 4 March for the beginning of the class and the formaldehyde concentration decreased instantly from 18 µg m−3 down to 10 µg m−3 in 95 min. Then, the ventilation system was switched OFF during the morning break. Even during a very short break time of 25 min, the formaldehyde concentration increased up to 12–13 µg m−3 (see Figure 3a). During the lunch break of 105 min, this increase in formaldehyde concentration was more pronounced to reach approximately the previous night level. Next, at 13:30, the automatic ventilation system was switched ON again and the concentration of formaldehyde decreased again down to 10 µg m−3. Finally, the ventilation was stopped again at 17:20 and a similar increase of formaldehyde level than that observed during the previous night occurred.
The formaldehyde concentration was also monitored during long periods of activated ventilation. As illustrated in Figure 2, the minimum formaldehyde concentration was again about 10 µg m−3. Whatever the day, the efficiency of the building ventilation was proven with the very fast decrease of formaldehyde concentrations after the ventilation started. Indeed, concentrations are approximately divided by two during ventilation period. However, although mechanical ventilation was maintained ON, it is important to underline that the additional effect of the outdoor air supply from windows opening on indoor formaldehyde concentration is significantly more efficient than mechanical ventilation (Figure 3b) and led to a decrease in formaldehyde concentration down to 2 µg m−3 in less than 30 min. Indeed, three windows were opened at 16:15 for one hour on 27 and 28 February. After closing the windows, the formaldehyde concentration increased slowly to return to approximately its initial level of 10 µg m−3.

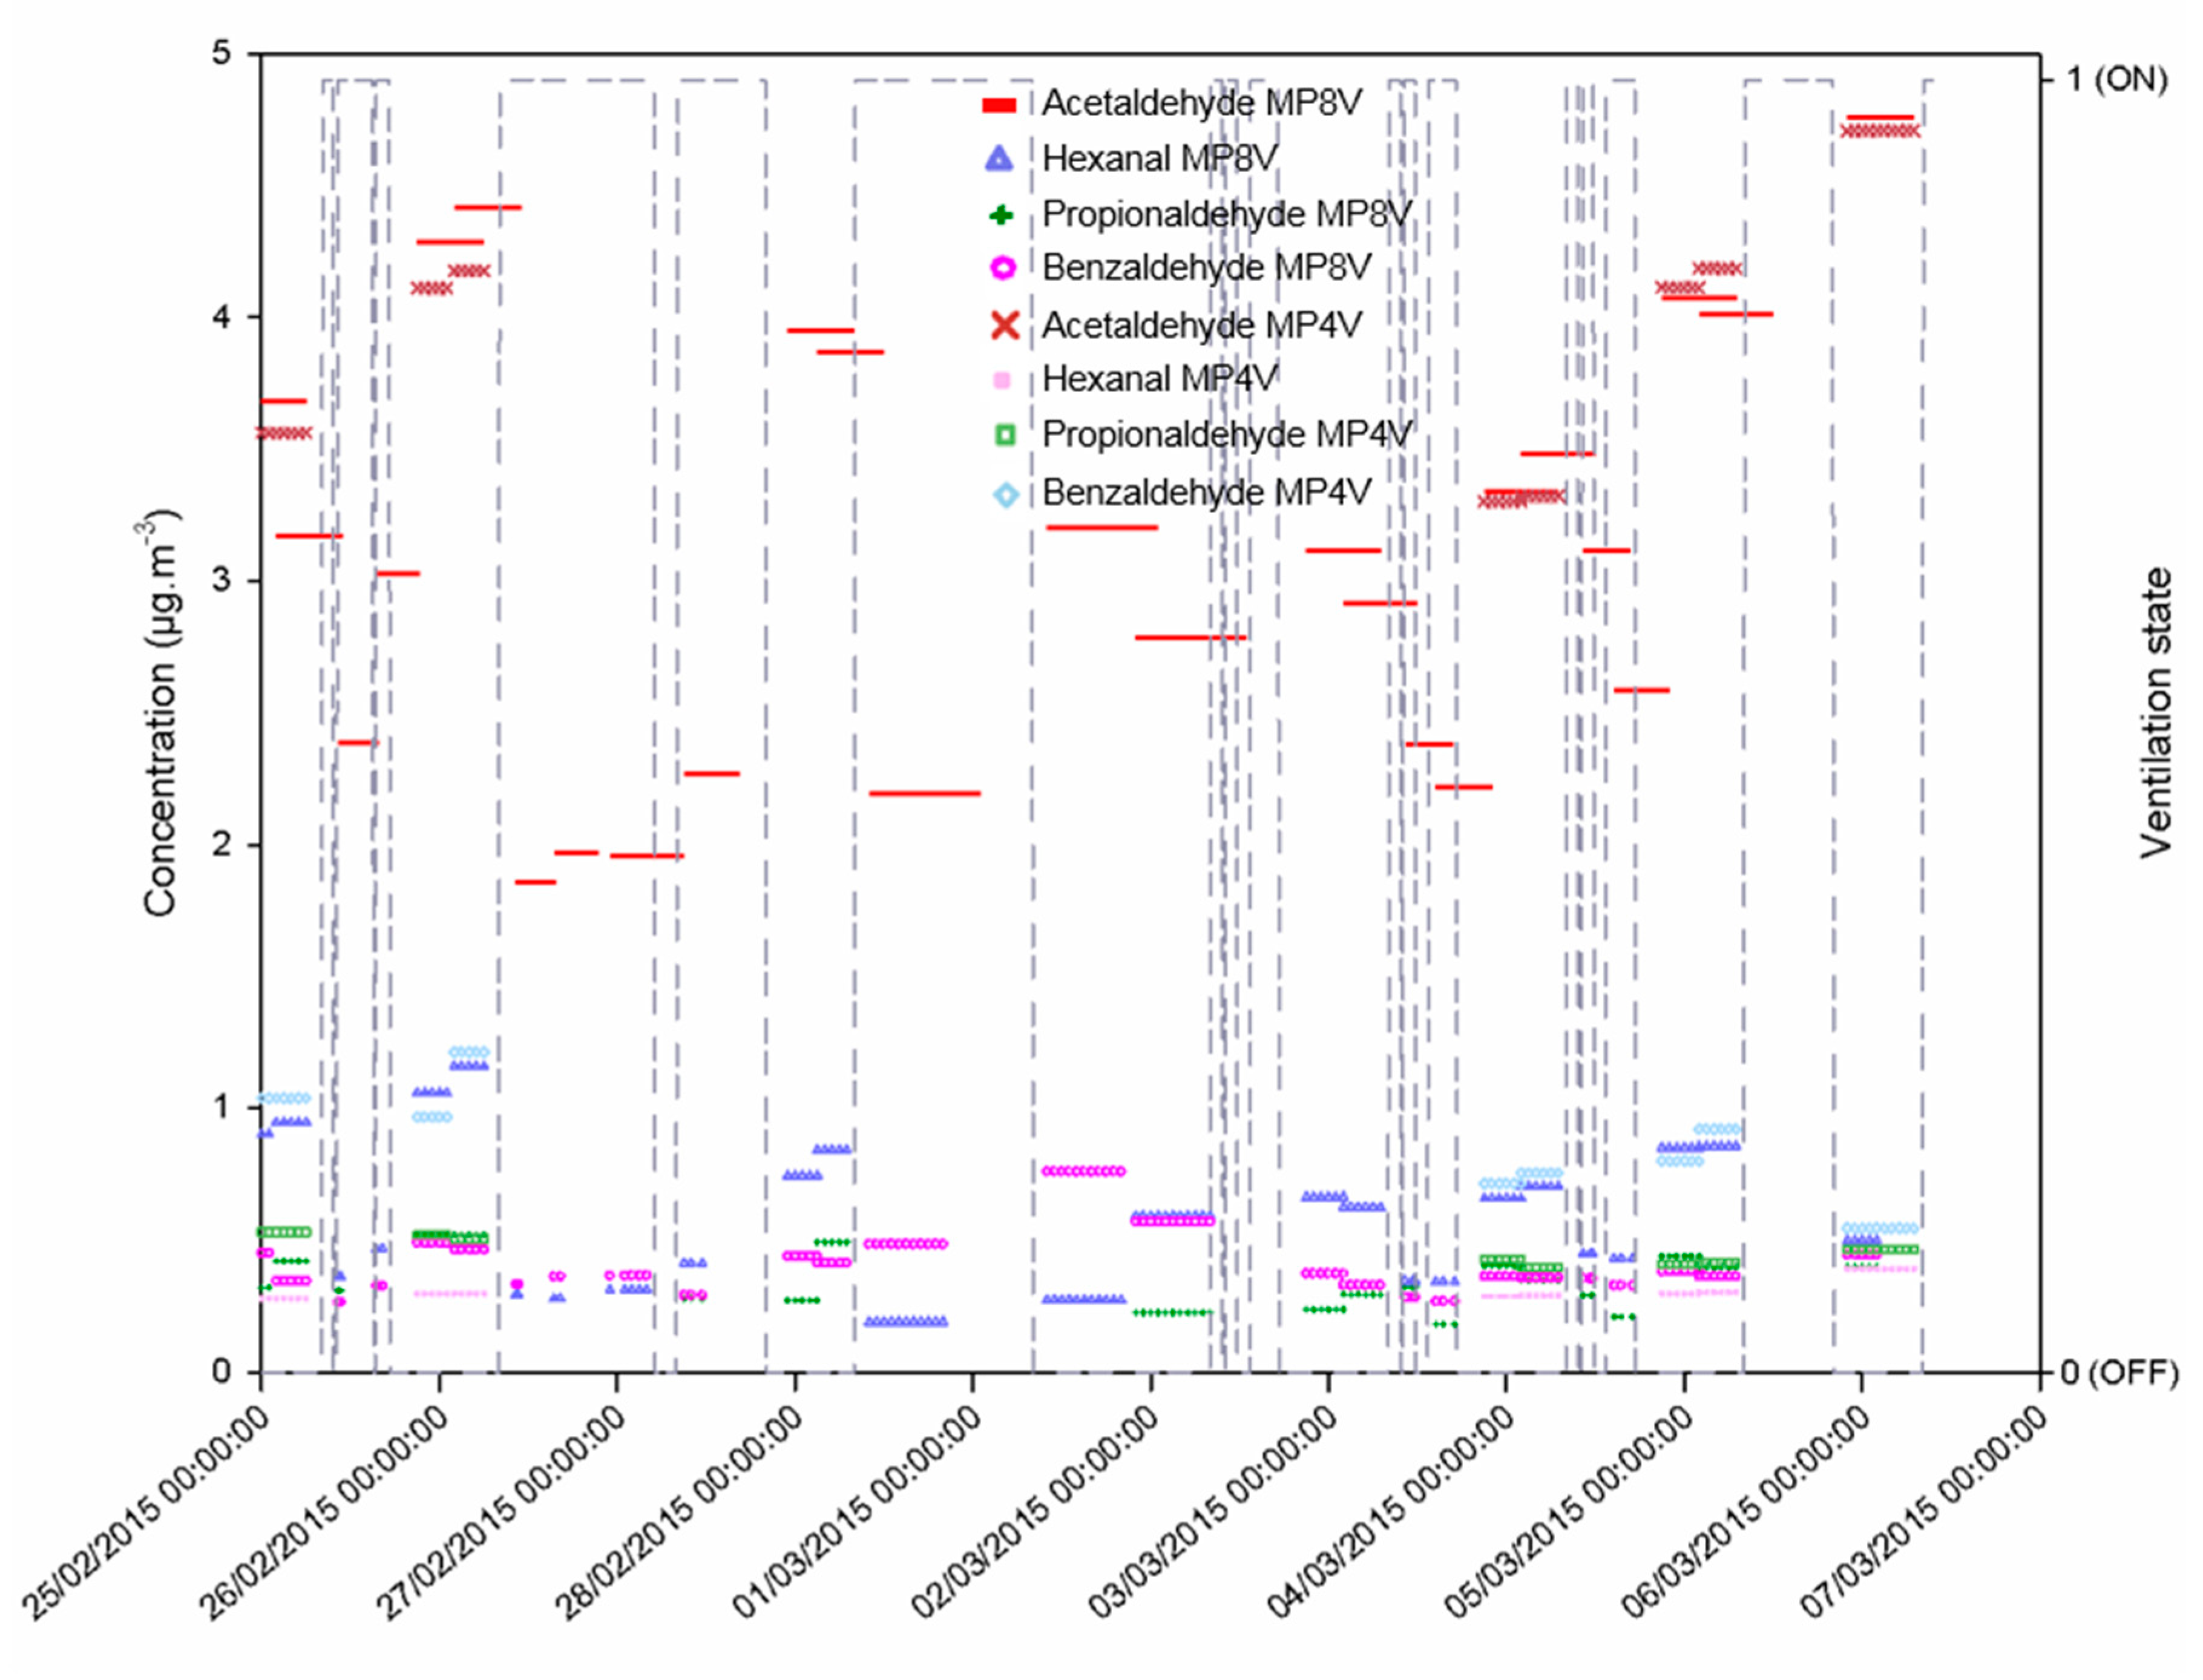
3.3. Monitoring of Other Aldehydes in the Classroom

The other aldehydes concentrations inside the classroom were measured using the reference ISO 16000-3 method based on DNPH derivatization from 24 February to 7 March 2015 (see Figure 4). Except formaldehyde, acetaldehyde was the main aldehyde detected, as was previously observed by previous studies in indoor air [4,11,39]. Its concentrations ranged between 2 and 5 µg m−3, whereas the concentrations of the remaining aldehydes, i.e., hexanal, propanal, and benzaldehyde were lower than 1 µg m−3. For all aldehydes, their concentrations were significantly lower when ventilation was switched ON, showing that they are emitted by indoor sources, as well as formaldehyde.

3.4. Monitoring of Outdoor Aldehydes Concentrations

All outdoor aldehydes concentrations were measured using the reference ISO 16000-3 method from 24 February to 7 March 2015. Formaldehyde and acetaldehyde were the only two aldehydes detected. The formaldehyde and acetaldehyde concentrations were in the range 0.9–2.6 and 0.8–1.3 µg m−3, respectively, except for 5 March, where formaldehyde and acetaldehyde levels increased up to 5.5 and 3.2 µg m−3, respectively.

3.5. Monitoring of Aldehydes Concentrations at Ventilation Inlet

The air injected into the investigated room is a mixture containing 50% recycled air and 50% fresh outdoor air, all passing through a filter’s assembly.
All the aldehydes concentrations were measured using the reference ISO 16000-3 method from 24 February to 7 March 2015, at the vent inlet during ventilation periods (see Figure S9) in order to control whether these pollutants could be injected into the room by fresh air and not only issued by the materials emissions. Again, formaldehyde and acetaldehyde were the two major aldehydes. The formaldehyde concentrations were in the range of 3.5–8.3 µg m−3, whereas those of acetaldehyde varied between 1.1 and 2.7 µg m−3. Traces of propanal were found in about 50% of the vent samples, although neither hexanal nor benzaldehyde was quantified.
The formaldehyde concentrations measured at the ventilation inlet were significantly lower than those monitored inside the classroom but slightly higher than those measured outdoor. The same behavior was observed for all the aldehydes, highlighting that they are mainly emitted by indoor sources, the outdoor contribution being limited.

4. Discussion

4.1. Comparison of the Formaldehyde Concentrations Measured by Different Techniques

To validate the analytical performances of our new formaldehyde microanalyzer, its results were compared with the two other analytical methods deployed during this field campaign, i.e., the first generation of formaldehyde analyzer and the reference ISO 16000-3 method where two automatic sampling devices were used, namely DNPH MP4V and DNPH MP8V.
As illustrated in both Figure 2 and Figure 3, the results obtained with the three different analytical techniques are in very good agreement.
Figure 5 represents the formaldehyde concentrations measured with our new formaldehyde microanalyzer versus those obtained by the reference ISO 16000-3 method and the first generation of formaldehyde analyzer, respectively, for the same given sampling time. Thus, for comparison with formaldehyde concentrations resulting in sampling on DNPH tubes over several hours, the corresponding average microanalyzer formaldehyde concentrations were calculated. Figure 5a exhibits the excellent agreement of our data recorded in the range 8–24 µg m−3 (from 26 to 28 February) for our microanalyzer and the reference method based on DNPH tubes. The slope of 1.03 highlights a reasonable average deviation of 3% between the two instruments. In a similar manner, Figure 5b shows excellent agreement in the measured formaldehyde concentrations range of 8–18 µg m−3, between microanalyzer values and those determined with the previous laboratory formaldehyde analyzer between 3 and 4 March. Again, a small average deviation of 1% was observed between our two real-time instruments.
Furthermore, it is important to underline that the reference technique, i.e., using sampling on a DNPH tube, gives an average value over several tens of minutes or several hours. Consequently, this reference method does not permit the monitoring of either the window opening effect, as illustrated in Figure 3b, or a very short break of ventilation during the morning break. On the contrary, the new formaldehyde microanalyzer was fully appropriated to detect any formaldehyde variation in the classroom and was more responsive than the first generation of formaldehyde analyzer. Indeed, for instance, the latter did not permit the observation of a formaldehyde concentration increase during the morning break of 3 March 2015 (see Figure 3a). In this case, the very low temporal resolution (two seconds) of our new formaldehyde microanalyzer permit the monitoring of very fast variations (sharp decrease in short ventilation period), while this is not possible with one measurement every ten minutes with the previous formaldehyde analyzer.

4.2. Comparison with Previous Aldehydes Measurements Performed in EUROPEAN Low-Energy Building

The previous measurements of aldehydes levels inside a recent or new European low-energy building available in the literature are summarized in Table 3. Among them, four were performed in the countries of Northern Europe (Finland, Denmark, Sweden, and Lithuania), the other three studies were conducted in France.
Most of the studies required passive sampling on the DNPH tubes [3,4,40,41,42] over a period of several days to a week, except Jarnstrom et al. (2006) [43], who used active sampling using a 0.005 M sulfuric solution at 2–4 L/min, followed by a derivatization with acetyl-acetone and quantification by a spectrometric method. Our study appears to be the first one to report continuous formaldehyde monitoring in a low-energy building.
In 2006, eight buildings, representing the present construction practice in Finland and which used low-emitting materials in the construction, were investigated to create reference data for IAQ in new residential buildings [43]. The airborne formaldehyde mean concentrations were determined in the newly finished buildings (19 µg m−3) after 6 months (21 µg m−3) and 12 months (26 µg m−3), highlighting an increasing trend once the building was occupied. In Denmark, Kolarik et al. (2012) [41] measured the formaldehyde concentrations in 20 new Danish residential buildings with a geometric mean value of 40 µg m−3. They reported that formaldehyde levels exceeded the WHO guideline value of 100 µg m−3 in two buildings. In Sweden, Langer et al. [42] assessed air quality in 20 new passive buildings and 21 new conventionally built buildings. The median concentrations in the passive and the conventional buildings were, respectively, 11 and 16 µg m−3 for formaldehyde, which tends to prove that these new buildings would not necessarily be more polluted in terms of formaldehyde than the old ones. In Lithuania, Kaunelienè et al. investigated the indoor environment of 11 newly built low-energy residential buildings and reported formaldehyde levels in the range 3.3–52.3 µg m−3 [40].
In France, two previous studies were focused on the investigation of low-energy buildings in terms of Indoor Air Quality. Derbez et al. [42] investigated indoor air pollution and comfort parameters in seven newly built energy-efficient buildings. If the formaldehyde average level of 22.8 µg m−3 was medium, the mean hexanal concentration was either 61.2 or 86.7 in unoccupied and occupied houses, respectively, which can be considered very high. These authors reported that compared to standard French buildings, the formaldehyde concentration was not significantly different, confirming the observation made by Langer et al. [42], although acetaldehyde and hexanal levels were significantly higher in these new homes, possibly due to the products and materials emissions. In the framework of the MERMAID project, Verriele et al. characterized indoor air quality in 10 recently built energy-efficient French schools during two periods of 4.5 days (occupied vs. unoccupied) [4]. The mean aldehydes concentrations were as follows: 15.9 µg m−3 (formaldehyde), 6.0 µg m−3 (acetaldehyde), and 9.6 µg m−3 (hexanal).
In contrast to all these previous studies, this work demonstrates that formaldehyde concentration can vary greatly from a few µg m−3 to several tens of µg m−3 in the same room, showing that air exchange rate is a key parameter to predict possible indoor air pollution, as already mentioned by Langer et al. [42].

4.3. Application to Green Buildings Monitoring

Green building standards have been put forward recently, such as those given by WELL v2 [44] where some relevant guidelines are recommended for Air Quality Monitoring and Awareness. This performance assessment guideline suggests that formaldehyde should be measured with an accuracy of 20 ppb at values between 0 and 100 ppb, at intervals of no longer than one hour. In addition, instruments need to be recalibrated or replaced annually.
Regarding the interval of one hour needed, offline monitoring, including the most used one, i.e., passive sampling coupled to HPLC-UV, is then excluded. On the contrary, the formaldehyde analyzer prototype tested in this work is perfectly in-line with all the green buildings specifications with an accuracy close to a few ppb in the range 0–100 ppb, a response time of 10 min and time-resolution down to 2 s. The autonomy of seven days with 172 mL low-cost reagent and the detection limit of 1 µg m−3 are also fully consistent with the continuous measurement for one full week. Such a diagnostic would allow a better understanding of the variations in concentrations between night and day, with or without windows opening, and to accurately assess people’s exposure to indoor air pollutants by correlating the pollution measurements with the presence of persons. Indeed, the usual passive sampling and measurement usually done over a period of 4.5–7 days in a school make it possible to estimate an average value over this period but are not necessarily representative of the real exposure value of pupils and teaching staff, since the latter are only present about 7 or 8 h per day.

5. Conclusions

This work reports the upgrading of a previous microfluidic device for the quantification of airborne formaldehyde concentrations [17,18] by coupling it with a compact fluorescence detection system and its use for near real-time monitoring of formaldehyde in a low-energy school building equipped with programmable mechanical ventilation according to the presence of pupils.
Formaldehyde was always detected and its concentration, varying from 2 to 25 µg m−3, was strongly influenced by the ventilation status, with marked variations between day and night. The classical method of formaldehyde quantification highlighted that formaldehyde was the major aldehyde encountered in this study. In the same classroom, Rizk et al. reported that formaldehyde was mainly emitted by the ceiling tiles, with an average emission rate of 22 ± 7.5 µg m−2 h−1 for five measurements performed at five different locations, while the other surfaces (vinyl flooring, painted gypsum board, painted wood shelf and door, etc.) emitted slightly, with emission rate values ranging between 1.5 and 2.5 µg m−2 h−1 [45].
Moreover, our microfluidic analytical method allows the quantification of formaldehyde in near-real time with a delay of ten minutes and a temporal resolution of 2–120 s. The corresponding detection limit of our new formaldehyde microanalyzer is around 1 µg m−3, which is adapted to monitoring formaldehyde in indoor air. In addition, the sensitivity can be improved when the time resolution is increased from 2 to 60 s. Indeed, a time-resolution of 60 s would be enough for most applications. Under laboratory-controlled experiments, the uptake of gaseous formaldehyde was estimated to be close to 100%.
This new formaldehyde microanalyzer was then tested during a two weeks field campaign inside a classroom. The resulting data are in excellent agreement with those obtained by the reference method ISO 16000-3 and the first generation of formaldehyde analyzer developed in our laboratory. The results obtained in this work show that the new analytic method based on microfluidic device is extremely sensitive, accurate, and precise for the quantification of formaldehyde in ambient air. The microfluidic instrument can convincingly measure very rapid changes in formaldehyde concentrations as during the window opening, whereas reference method ISO 16000-3 can only provide an average concentration over its chosen sampling time, i.e., few tens of minutes or several hours.
In addition to its aforementioned advantages, such as its low weight and its compact size, the microfluidic approach needs a very low amount of reagent, i.e., 17 µL min−1, so that 100 mL reagent can achieve analyses during more than 98 h, as opposed to only 91 min with the previous formaldehyde analyzer [30]. Therefore, the new compact and highly portable (4 kg) microfluidic device permits the accurate monitoring of the formaldehyde concentration over a long period of time. Finally, the full gaseous formaldehyde uptake will allow calibration from liquid standard solutions of formaldehyde. This point constitutes a significant advantage compared to the analytical methods requiring gaseous calibration, especially since gaseous formaldehyde cylinders are not stable over time. In addition, liquid calibrations are very easy and much more adapted for in-situ field measurements, the microdevice needing only a small amount of standard formaldehyde solution.

Supplementary Materials

The following are available online at https://www.mdpi.com/2073-4433/10/12/763/s1, Table S1: Ventilation conditions in the studied classroom during the field campaign, Figure S1: Balance chemical reaction for the reaction between formaldehyde and acetylacetone, producing dihydrolutidine (DDL), Figure S2: Schematic diagram of the formaldehyde uptake used for the first generation of formaldehyde analyzer, Figure S3: Scheme of the microfluidic cell, to obtain an annular flow, Figure S4: Picture of the formaldehyde microanalyzer prototype, during the field MERMAID campaign, Figure S5: Picture of the VHEP College Vauban in Maubeuge (North, France), Figure S6: Schematic diagram of the chosen room investigated in this work. Instruments were installed in an adjacent room. Sampling was carried out using ¼” Teflon tubes via door 3. All sampling lines were placed at the same point in the studied room at 1.20 m above the ground, Figure S7: Raw signal obtained with the formaldehyde microanalyzer, Figure S8: Calibration curves obtained with the formaldehyde microanalyzer, Figure S9: Variation of gaseous aldehydes concentrations measured at the ventilation inlet.

Author Contributions

Conceptualization, S.L.C., M.G., and P.B.; methodology, C.T., C.L., and S.L.C.; software, P.B.; validation, C.T., C.L., and S.L.C.; formal analysis, C.T., C.L., I.M., and S.L.C.; resources, S.L.C. and S.E.; writing—original draft preparation, S.L.C. and C.T.; writing—review and editing, C.T. and S.L.C.; visualization, C.T. and I.M.; supervision, S.L.C.; project administration, S.L.C. and S.E.; funding acquisition, S.L.C.

Funding

This research was funded by ANR (Agence Nationale de la Recherche), grant number ANR-11-ECOT-0013, and by ADEME (Agence De l'Environnement et de la Maîtrise de l'Energie), grant number 1262C0023.

Acknowledgments

The authors would like to thank all the people working at the junior high school and the school administration for their support. The authors also thank all the participants of the MERMAID field campaign coordinated by Coralie Schoemaecker.

Conflicts of Interest

The authors declare no conflict of interest.

References

  1. Omer, A.M. Energy and Environment: Applications and Sustainable Development. Int. J. Environ. Clim. Change 2011, 1, 118–158. [Google Scholar] [CrossRef] [PubMed]
  2. Billionnet, C.; Gay, E.; Kirchner, S.; Leynaert, B.; Annesi-Maesano, I. Quantitative assessments of indoor air pollution and respiratory health in a population-based sample of French dwellings. Environ. Res. 2011, 111, 425–434. [Google Scholar] [CrossRef] [PubMed]
  3. Derbez, M.; Berthineau, B.; Cochet, V.; Lethrosne, M.; Pignon, C.; Riberon, J.; Kirchner, S. Indoor air quality and comfort in seven newly built, energy-efficient houses in France. Build. Environ. 2014, 72, 173–187. [Google Scholar] [CrossRef]
  4. Verriele, M.; Schoemaecker, C.; Hanoune, B.; Leclerc, N.; Germain, S.; Gaudion, V.; Locoge, N. The MERMAID study: Indoor and outdoor average pollutant concentrations in 10 low-energy school buildings in France. Indoor Air 2016, 26, 702–713. [Google Scholar] [CrossRef] [PubMed]
  5. Salthammer, T. Formaldehyde in the Ambient Atmosphere: From an Indoor Pollutant to an Outdoor Pollutant? Angew. Chem. Int. Ed. 2013, 52, 3320–3327. [Google Scholar] [CrossRef]
  6. Kim, K.-W.; Kim, S.; Kim, H.-J.; Park, J.C. Formaldehyde and TVOC emission behaviors according to finishing treatment with surface materials using 20L chamber and FLEC. J. Hazard. Mater. 2010, 177, 90–94. [Google Scholar] [CrossRef]
  7. Paolacci, H.; Dagnelie, R.; Porterat, D.; Piuzzi, F.; Lepetit, F.; Tran-Thi, T.-H. A ppb Formaldehyde Gas Sensor for Fast Indoor Air Quality Measurements. Sens. Transducers J. 2007, 82, 1423–1430. [Google Scholar]
  8. Wang, B.; Lee, S.C.; Ho, K.F. Characteristics of carbonyls: Concentrations and source strengths for indoor and outdoor residential microenvironments in China. Atmos. Environ. 2007, 41, 2851–2861. [Google Scholar] [CrossRef]
  9. Wang, X.; Wang, H.; Wang, S. Ambient formaldehyde and its contributing factor to ozone and OH radical in a rural area. Atmos. Environ. 2010, 44, 2074–2078. [Google Scholar]
  10. Kim, J.; Kim, S.; Lee, K.; Yoon, D.; Lee, J.; Ju, D. Indoor aldehydes concentration and emission rate of formaldehyde in libraries and private reading rooms. Atmos. Environ. 2013, 71, 1–6. [Google Scholar] [CrossRef]
  11. Marchand, C.; Le Calvé, S.; Mirabel, Ph.; Glasser, N.; Casset, A.; Schneider, N.; de Blay, F. Concentrations and determinants of gaseous aldehydes in 162 homes in Strasbourg (France). Atmos. Environ. 2008, 42, 505–516. [Google Scholar] [CrossRef]
  12. Huang, J.; Feng, Y.; Li, J.; Xiong, B.; Feng, J.; Wen, S.; Sheng, G.; Fu, J.; Wu, M. Characteristics of carbonyl compounds in ambient air of Shanghai, China. J. Atmos. Chem. 2008, 61, 1–20. [Google Scholar] [CrossRef]
  13. Casset, A.; Marchand, C.; Purohit, A.; le Calve, S.; Uring-Lambert, B.; Donnay, C.; Meyer, P.; de Blay, F. Inhaled formaldehyde exposure: Effect on bronchial response to mite allergen in sensitized asthma patients. Allergy 2006, 61, 1344–1350. [Google Scholar] [CrossRef] [PubMed]
  14. IARC Monographs on the Evaluation Carcinogenic Risks on Humans; International Agency for Research on Cancer: Lyon, France, 2006.
  15. AFSSET Le Formaldéhyde. Valeurs Guides de Qualité d’air Intérieur; French Agency for Food, Environmental and Occupational Health & Safety: Maisons-Alfort, France, 2007.
  16. Décret n° 2011-1727 du 2 décembre 2011 relatif aux valeurs-guides pour l'air intérieur pour le formaldéhyde et le benzène, JORF n°0281 du 4 décembre 2011 page 20529, texte n° 4.
  17. Guglielmino, M.; Allouch, A.; Serra, C.A.; Calvé, S.L. Development of microfluidic analytical method for on-line gaseous Formaldehyde detection. Sens. Actuators B Chem. 2017, 243, 963–970. [Google Scholar] [CrossRef]
  18. Guglielmino, M.; Bernhardt, P.; Trocquet, C.; Serra, C.A.; Le Calvé, S. On-line gaseous formaldehyde detection by a microfluidic analytical method based on simultaneous uptake and derivatization in a temperature controlled annular flow. Talanta 2017, 172, 102–108. [Google Scholar] [CrossRef] [PubMed]
  19. Sakai, T.; Tanaka, S.; Teshima, N.; Yasuda, S.; Ura, N. Fluorimetric flow injection analysis of trace amount of formaldehyde in environmental atmosphere with 5,5-dimethylcyclohexane-1,3-dione. Talanta 2002, 58, 1271–1278. [Google Scholar] [CrossRef]
  20. Bertoni, G.; Ciuchini, C.; Palo, V.Di.; Possanzini, M. Development of a Passive Sampler for Long-Term Measurements of Formaldehyde and Total Oxidants in Air. Chromatographia 2005, 61, 385–389. [Google Scholar] [CrossRef]
  21. Hak, C.; Pundt, I.; Trick, S.; Kern, C.; Platt, U.; Dommen, J.; Ordóñez, C.; Prévôt, A.S.H.; Junkermann, W.; Astorga-Lloréns, C.; et al. Intercomparison of four different in-situ techniques for ambient formaldehyde measurements in urban air. Atmos. Chem. Phys. 2005, 5, 2881–2900. [Google Scholar] [CrossRef]
  22. Hanoune, B.; LeBris, T.; Allou, L.; Marchand, C.; Le Calvé, S. Formaldehyde measurements in libraries: Comparison between infrared diode laser spectroscopy and a DNPH-derivatization method. Atmos. Environ. 2006, 40, 5768–5775. [Google Scholar] [CrossRef]
  23. Wisthaler, A.; Apel, E.C.; Bossmeyer, J.; Hansel, A.; Junkermann, W.; Koppmann, R.; Meier, R.; Müller, K.; Solomon, S.J.; Steinbrecher, R.; et al. Technical Note: Intercomparison of formaldehyde measurements at the atmosphere simulation chamber SAPHIR. Atmos. Chem. Phys. 2008, 8, 2189–2200. [Google Scholar] [CrossRef]
  24. Bono, R.; Degan, R.; Pazzi, M.; Romanazzi, V.; Rovere, R. Benzene and formaldehyde in air of two winter Olympic venues of “Torino 2006. ” Environ. Int. 2010, 36, 269–275. [Google Scholar] [CrossRef] [PubMed]
  25. Pretto, A.; Milani, M.R.; Cardoso, A.A. Colorimetric determination of formaldehyde in air using a hanging drop of chromotropic acid. J. Environ. Monit. 2000, 2, 566–570. [Google Scholar] [CrossRef] [PubMed]
  26. Li, J.; Dasgupta, P.K.; Luke, W. Measurement of gaseous and aqueous trace formaldehyde: Revisiting the pentanedione reaction and field applications. Anal. Chim. Acta 2005, 531, 51–68. [Google Scholar] [CrossRef]
  27. Allouch, A.; Guglielmino, M.; Bernhardt, P.; Serra, C.A.; Le Calvé, S. Transportable, fast and high sensitive near real-time analyzers: Formaldehyde detection. Sens. Actuators B Chem. 2013, 181, 551–558. [Google Scholar] [CrossRef]
  28. Toda, K.; Yoshioka, K.-I.; Mori, K.; Hirata, S. Portable system for near-real time measurement of gaseous formaldehyde by means of parallel scrubber stopped-flow absorptiometry. Anal. Chim. Acta 2005, 531, 41–49. [Google Scholar] [CrossRef]
  29. Toda, K.; Tokunaga, W.; Gushiken, Y.; Hirota, K.; Nose, T.; Suda, D.; Nagai, J.; Ohira, S.-I. Mobile monitoring along a street canyon and stationary forest air monitoring of formaldehyde by means of a micro-gas analysis system. J. Environ. Monit. 2012, 14, 1462–1472. [Google Scholar] [CrossRef]
  30. Zheng, W. Développement d’un analyseur rapide et transportable du formaldéhyde dans l’air. Ph.D. Thesis, University of Strasbourg, Strasbourg, France, 2010. [Google Scholar]
  31. Schoemaecker, C.; Fèvre-Nollet, V.; Verriele, M.; Dusanter, S.; Le Calvé, S.; Trocquet, C.; Hanoune, B.; Locoge, N. Effect of occupancy controlled ventilation in schools on the exposure quantification. In Proceedings of the 14th International Conference of Indoor Air Quality and Climate-Indoor Air 2016, Ghent, Belgium, 3–7 July 2016. [Google Scholar]
  32. Bakó-Biró, Zs.; Clements-Croome, D.J.; Kochhar, N.; Awbi, H.B.; Williams, M.J. Ventilation rates in schools and pupils’ performance. Build. Environ. 2012, 48, 215–223. [Google Scholar] [CrossRef]
  33. Mendell, M.J.; Heath, G.A. Do indoor pollutants and thermal conditions in schools influence student performance? A critical review of the literature. Indoor Air 2005, 15, 27–52. [Google Scholar] [CrossRef]
  34. ASTM International Test Method for Determination of Formaldehyde and Other Carbonyl Compounds in Air (Active Sampler Methodology) 2009. Available online: https://www.astm.org/Standards/D5197.htm (accessed on 1 October 2019).
  35. Pinheiro, H.L.C.; de Andrade, M.V.; de Paula Pereira, P.A.; de Andrade, J.B. Spectrofluorimetric determination of formaldehyde in air after collection onto silica cartridges coated with Fluoral, P. Microchem. J. 2004, 78, 15–20. [Google Scholar] [CrossRef]
  36. Eisner, U.; Kuthan, J. Chemistry of dihydropyridines. Chem. Rev. 1972, 72, 1–42. [Google Scholar] [CrossRef]
  37. Triplett, K.A.; Ghiaasiaan, S.M.; Abdel-Khalik, S.I.; Sadowski, D.L. Gas–liquid two-phase flow in microchannels Part I: Two-phase flow patterns. Int. J. Multiph. Flow 1999, 25, 377–394. [Google Scholar] [CrossRef]
  38. Nasreddine, R.; Person, V.; Serra, C.A.; Schoemaecker, C.; Le Calvé, S. Portable novel micro-device for BTEX real-time monitoring: Assessment during a field campaign in a low consumption energy junior high school classroom. Atmos. Environ. 2016, 126, 211–217. [Google Scholar] [CrossRef]
  39. Barguil, S.; Le Moullec, Y.; Person, A.; Laurent, A.-M.; Festy, B. Chemical characterization of indoor air quality in Parisian homes. Aerobiologia 1990, 6, 28–31. [Google Scholar] [CrossRef]
  40. Kaunelienė, V.; Prasauskas, T.; Krugly, E.; Stasiulaitienė, I.; Čiužas, D.; Šeduikytė, L.; Martuzevičius, D. Indoor air quality in low energy residential buildings in Lithuania. Build. Environ. 2016, 108, 63–72. [Google Scholar] [CrossRef]
  41. Kolarik, B.; Gunnarsen, L.; Logadottir, A.; Funch, L.W. Concentrations of Formaldehyde in new Danish Residential Buildings in Relation to WHO Recommendations and CEN Requirements. Indoor Built Environ. 2011, 21, 552–561. [Google Scholar] [CrossRef]
  42. Langer, S.; Bekö, G.; Bloom, E.; Widheden, A.; Ekberg, L. Indoor air quality in passive and conventional new houses in Sweden. Build. Environ. 2015, 93, 92–100. [Google Scholar] [CrossRef]
  43. Järnström, H.; Saarela, K.; Kalliokoski, P.; Pasanen, A.-L. Reference values for indoor air pollutant concentrations in new, residential buildings in Finland. Atmos. Environ. 2006, 40, 7178–7191. [Google Scholar] [CrossRef]
  44. WELL v2 The Next Version of the WELL Building StandardTM, Concepts/Air/Feature A08, Air Quality Monitoring and Awareness. Available online: https://v2.wellcertified.com/v/en/air/feature/8 2019 (accessed on 1 October 2019).
  45. Rizk, M.; Guo, F.; Verriele, M.; Ward, M.; Dusanter, S.; Blond, N.; Locoge, N.; Schoemaecker, C. Impact of material emissions and sorption of volatile organic compounds on indoor air quality in a low energy building: Field measurements and modeling. Indoor Air 2018, 28, 924–935. [Google Scholar] [CrossRef]
Figure 1. Scheme of our formaldehyde microanalyzer showing the different parts, i.e., the sampling, the uptake, the reaction, and the detection.
Atmosphere 10 00763 g001
Figure 2. Variation of gaseous formaldehyde concentrations as a function of ventilation system status (O = OFF; 1 = ON) during 11 consecutive days. Comparison with the reference ISO 16000-3 method where two automatic sampling devices were used, namely, DNPH MP4V and DNPH MP8V.
Atmosphere 10 00763 g002
Figure 3. Variation of gaseous formaldehyde concentrations as a function of ventilation system status and window-opening between (a) 3 and 4 March 2015 and (b) 27 and 28 February 2015. Comparison with two other analytical methods for gaseous formaldehyde quantification: first generation of formaldehyde analyzer and the reference ISO 16000-3 method where two automatic sampling devices were used, namely DNPH MP4V and DNPH MP8V.
Atmosphere 10 00763 g003
Figure 4. Variation of other gaseous aldehydes concentrations as a function of the ventilation system for 11 days. The analytical method used was the reference ISO 16000-3 method whereby two automatic sampling devices were used, namely DNPH MP4V and DNPH MP8V.
Atmosphere 10 00763 g004
Figure 5. Inter-comparison of formaldehyde concentration provided by our formaldehyde microanalyzer with those obtained with (a) DNPH tubes, between 26 and 28 February 2015. The horizontal quoted errors correspond to the uncertainties of gaseous formaldehyde concentrations, which were determined using the uncertainties of DNPH gaseous sampling volumes and HPLC/UV analyses (tubes desorption, dilution, and error on the calibration curve); (b) the previous formaldehyde analyzer developed in the laboratory between 3 and 4 March 2015.
Atmosphere 10 00763 g005
Table 1. Non exhaustive list of analytical methods used for quantification of airborne formaldehyde concentrations and their main characteristics.
MethodLOD
(µg m−3)
Time ResolutionInterferencesReagent Consumption (µL min−1)Weight
(kg)
References
Chromatographic and spectroscopic methodsDNPH tube
+ HPLC/UV-Vis 1
0.13 (S/N = 3)
0.12 (S/N = 5)
30 days
1–2 h
O3, NOX, H2O-
-
>50 2[20,22]
GC-MS 30.02 (S/N = 3)-Overlapped peaks->100 2[24]
FTIR 40.55 minCarbonyl species->30 2[21]
PTR/MS 50.2 (S/N = 2)2 sH2O->100 2[23]
Chemical methodsChromotropic acid
+ Colorimetry
2.57 minphenol, alcohols, aromatic hydrocarbonsDroplet of 15 µLN/A[25]
Aerolaser AL40210.191.5 minH2O, H2O2,
O3, Glyoxal
500 + 500 620 2[21]
Dimedone + fluorescence1.1 (S/N = 3)-Other aldehydes700 6N/A[19]
Fluoral-P + fluorescence0.09 (S/N = 3)-H2O, O3110 + 30 + 30 717.4 2[26]
Acetyl acetone + fluorescence
(1st generation of formaldehyde analyser)
0.5 (S/N = 3)6–10 minNone identified1100 68 2[30]
Acetyl acetone +
Colorimetric microfluidic device
0.7 (S/N = 3)1–2 minNone identified359 8[17,18]
Acetyl acetone +
Fluorimetric microfluidic device
1.2 (S/N = 3)2 sNone identified204This work
N/A: Information not available; 1 DNPH: 2,4-dinitrophenylhydrazine and HPLC/UV-vis: High-Performance Liquid Chromatography coupled to UV-visible detection; 2 It corresponds only to the instrument weight and does not refer to the total weight of the operating system, i.e., it does not include any liquid reagents reservoir or gas cylinder; 3 GC-MS: Gas Chromatography coupled to Mass Spectrometer; 4 FTIR: Fourier-transform infrared spectroscopy; 5 PTR/MS: Proton-transfer-reaction mass spectrometry 6 Two reagents are needed; 7 Three reagents are involved; 8 The deuterium lamp DH-2000 (Ocean Optics) weighs 5.5 kg whereas the microfluidic device is around 3.5 kg including its electronic part.
Table 2. Comparison of the characteristics and performances of the three analytic methods used in this work for quantification of gaseous formaldehyde concentrations.
Characteristics/PerformancesReference Method ISO 16000-3 1Formaldehyde Analyzer 2Formaldehyde Microanalyzer 3
ReagentsACN/WaterAcetylacetone+ HNO3 0,1NAcetylacetone
Reagents consumption (µL min−1)-120017
Autonomy (min) 4-835880
Sampling flow (mL min−1)1000–200030020
InterferencesO3, NOX, H20--
LD (µg m−3)0.004 (S/N = 3) 51 (S/N = 3)1.2 (S/N = 3)
Response time (min)-1010
Temporal resolution30 min–7 days 610 min2–120 s
Near Real-timeNoYesYes
Weight≥50 kg8 kg4 kg
PortabilitySedentarytransportableportable
1 Reference method ISO 16000-3 using DNPH tube; 2 First generation of formaldehyde analyzer; 3 Formaldehyde microanalyzer based on a microfluidic device; 4 Estimated with 100 mL of liquid reagent; 5 Calculated using a sampling volume of 200 L; 6 The temporal resolution is related to the sampling time needed, ranging typically between 30 min (active sampling) and 7 days (passive sampling).
Table 3. Previous aldehydes measurements performed in European low-energy buildings.
PollutantsConcentrations Ranges
Mean (min-max)
Time Number of Buildings (Type of Buildings)TechniqueLocationReference
Formaldehyde19 (0.8–26) µg m−3 a
21 (0.9–28) µg m−3 b
26 (0.8–37) µg m−3 c
August 2000–July 2003
n = 8
0.005M H2SO4 sol. at 2–4 L/min + spectrometric acetyl-acetone methodFinland[43]
Formaldehyde40 µg m−32010
n = 20 (new buildings)
Passive DNPH tube
+ HPLC/UV
Denmark[41]
Formaldehyde
Acetaldehyde
Hexanal
22.8 (6–48) µg m−3
16.5 µg m−3
61.2 µg m−3
July 2009–July 2010
N = 6 (new occupied houses)
Passive DNPH tube
+ HPLC/UV
France[3]
Acetaldehyde
Hexanal
12.9 µg m−3
86.7 µg m−3
February–December 2009
n = 3 (new unoccupied houses)
Formaldehyde
Acetaldehyde
Hexanal
15.9 µg m−3
6.0 µg m−3
9.6 µg m−3
2014
n = 10 (Schools)
Passive DNPH tube
+ HPLC/UV
North and East of France[4]
Formaldehyde11.1 µg m−32012/2013 and 2013/2014 heating seasons
n = 20 (new buildings)
Passive DNPH tube
+ HPLC/UV
Sweden[42]
Formaldehyde30.8 (3.3–52.3) µg m−3April–August 2014
n = 11 (new buildings)
Passive DNPH tube
+ UPLC/UV
Lithuania[40]
Formaldehyde
Acetaldehyde
Hexanal
(2–25) µg m−3
(2–5) µg m−3
(≤1) µg m−3
February–March 2015
n = 1 (School)
Active DNPH tube
+ HPLC/UV
North of FranceThis work
Formaldehyde(2–25) µg m−3microanalyzer
a new buildings, b after 6 months, c after 12 months.

