Article

Reconciling the Discrepancy of Post-Volcanic Cooling Estimated from Tree-Ring Reconstructions and Model Simulations over the Tibetan Plateau

1
CAS Key Laboratory of Regional Climate-Environment for Temperate East Asia, Institute of Atmospheric Physics, Chinese Academy of Sciences, Beijing 100029, China
2
Met Office Hadley Centre, Exeter EX1 3PB, UK
3
University of Chinese Academy of Sciences, Beijing 100049, China
*
Author to whom correspondence should be addressed.
Atmosphere 2019, 10(12), 738; https://doi.org/10.3390/atmos10120738
Submission received: 15 October 2019 / Revised: 13 November 2019 / Accepted: 22 November 2019 / Published: 25 November 2019
(This article belongs to the Section Climatology)

Abstract

:
Volcanic eruptions are a major factor influencing global climate variability, usually with a cooling effect. The magnitudes of post-volcanic cooling from historical eruptions estimated by tree-ring reconstructions differ considerably with the current climate model simulations. It remains controversial on what is behind such a discrepancy. This study investigates the role of internal climate variability (i.e., El Niño/Southern Oscillation (ENSO) warm phase) with a regional focus on the Tibetan Plateau (TP), using tree-ring density records and long historical climate simulations from the fifth Coupled Model Intercomparsion Project (CMIP5). We found that El Niño plays an important role behind the inconsistencies between model simulations and reconstructions. Without associated El Niño events, model simulations agree well with tree-ring records. Divergence appears when large tropical eruptions are followed by an El Niño event. Model simulations, on average, tend to overestimate post-volcanic cooling during those periods as the occurrence of El Niño is random as part of internal climate variability.

1. Introduction

Volcanic eruptions are a major external forcing of the global climate [1,2]. The anomalous decrease in summer temperatures resulting from large volcanic eruptions do not only affect crop productivity [3], but could also be a main cause for dynasty collapses [4,5]. Therefore, quantitative estimations of the cooling magnitude driven by large volcanic eruptions have drawn great attention from climatologists in recent decades [1,2,6,7,8,9]. The magnitudes of post-volcanic cooling that occurred in the pre-instrumental period are usually estimated using either proxy-based temperature reconstructions or climate model simulations. However, the two approaches often produce inconsistent magnitudes of post-volcanic cooling, especially for large tropical eruptions (e.g., the cooling magnitude after the 1815 Tambora eruption) [6,7,8,9]. Mann et al. (2012) [6] suggested that the divergence is a result of underestimation by tree-ring-based reconstructions [6], but other studies argued that the divergence could originate from the overestimation of model simulations [7,9].
Apart from external factors such as a volcanic-induced cooling, internal climate variability also has a strong influence on summer climate. El Niño is known as the largest climatic forcing of interannual monsoon variability [10], and has an important influence on the summer monsoon precipitation [11]. The influence of El Niño/Southern Oscillation (ENSO) on the climate and environment over the Tibetan Plateau (TP) has been reported widely [12,13,14,15,16]. Although its direct effect is on summer precipitation, the significant anticorrelation between the summer precipitation and summer temperature may lead to an indirect linkage between El Niño and summer temperatures [17]. In this study, we focus on the Tibetan Plateau (TP), an area sensitive to climatic forcings [18,19] and is influenced strongly by the Indian summer monsoon. The purpose of this study is to disentangle the role of El Niño behind the discrepancy between post-volcanic cooling magnitudes estimated from tree-ring reconstructions and climate model simulations.

2. Data and Methods

2.1. Tree-Ring-Based Temperature Reconstructions

Two August-September mean temperature reconstructions (Duan2018 and Duan2019) [17,20] were used in this study to be compared with the climate model simulations. Both reconstructions were based on a regional tree-ring maximum latewood density (MXD) network comprising 739 MXD measurement series from 17 sites on the TP. The series, Duan2019 [20], was reconstructed using observed August-September mean temperature anomalies (with respect to 1986–2005) and thus the long-term trend remained. The series, Duan2018 [17], was reconstructed as the August-September mean temperature deviation for each year relative to the preceding 5-year mean and thus the long-term trend was removed to capture the abrupt change of the late summer temperature following a volcanic eruption. The common time period of 1620–2014 of the two reconstructions was used in this study. Linear regression was used for both reconstructions. The correlation coefficient between tree-ring indices and instrumental data is 0.75 for Duan2018 and 0.80 for Duan2019, respectively. Both the reduction of error (0.52 for Duan2018 and 0.62 for Duan2019) and the coefficient of efficiency (0.51 for Duan2018 and 0.62 for Duan2019) are positive for the two reconstructions, indicating a good reconstruction skill. Both reconstructions can represent the large-scale August-September temperature variability on the TP.

2.2. Information of Volcanic Eruption and El Niño Events

Twelve large tropical volcanic eruptions (global volcanic forcing (GVF) < −3 W m−2) since 1620 were used in this study (Table 1). These volcanic events were identified using the ice core records by Sigl et al (2015) [4]. The GVF was estimated from the reconstruction of volcanic aerosol deposition since early Roman times for both polar ice sheets. The events of tropical eruptions were confirmed based on the synchronous sulfate deposition on both polar ice sheets [4]. The information on El Niño events that occurred in the analysis period was obtained from the paper of Brönnimann et al. (2007) [21]. During the study period, eight out of the twelve large tropical eruptions were without El Niño association and the other four tropical eruptions were accompanied by a subsequent El Niño event.
The years marked in bold font indicate eruptions without El Niño associations, while the other years denote eruptions with a subsequent El Niño event. All the event years used here have a value of global volcanic forcing (GVF) < −3 W m−2. The simulated and reconstructed August-September temperatures were calculated as the average August-September temperature of the subsequent 3 years of the eruptions and the August-September temperature in each year was an anomaly with respect to the period of 1961–1990.

2.3. Climate Model Simulations

Simulated monthly surface temperature data covering the past millennium from nine CMIP5 models were used for the analysis (Table 2). Both simulations of surface monthly temperature from individual models and an ensemble of nine CMIP5 models were used. Monthly anomalies of surface temperature were calculated for each model based on the period of 1961–1990, and then masked to the TP range (28°–37° N, 78°–103° E). The ensemble mean of the nine models was obtained by averaging their anomalies across available models, in which only one member of the GISS-E2-R model (i.e., r1i1p125) was used. The member of the GISS-E2-R model that was chosen had little influence on the ensemble mean of the nine models (figures not shown). Finally, the ensemble mean of the August-September temperature from the nine models over the period 1620–2000 was used for further analysis.
The end year of six models (CCSM4, FGOALS-s2, GISS-E2-R, IPSL-CM5A-LR, MIROC-ESM, MPI-ESM-P, and MRI-CGCM3) was extended from 1849/1850 of the last millennium simulations to 2005 using their historical experiments of all historical forcings (ALL) forcing. Expansions of the model name acronyms are available at http://www.ametsoc.org/PubsAcronymList.

3. Results and Discussion

3.1. Simulated Magnitudes of Post-Volcanic Cooling on the TP and Its Comparison with the Reconstructions

The ensemble mean of the August-September temperature on the TP derived from the nine CMIP5 models (Table 2) shows that the coldest interval occurred in 1816–1818 (following the 1815 Tambora eruption) over the period of 1620–2005 (Figure 1a). However, great differences exist on the simulated cooling magnitude among the models (Figure 1b). Seven out of eight simulations from the same model of GISS-E2-R also show the greatest cooling magnitude after the 1815 Tambora eruption, but the magnitude varies largely among the eight simulations (Figure 1c). Actually, the great differences on the cooling magnitudes on the TP that resulted from the other eleven large eruptions also exist both among the models and among the eight simulations of the model GISS-E2-R (Figure 1b,c).
Comparisons between the magnitudes of post-volcanic cooling derived from the ensemble mean of nine CMIP5 models and the reconstruction (Duan2019, retain the long-term trend) [20] show that agreements/disagreements varies among the twelve events and the greatest divergence appears following the 1815 Tambora eruption (the difference between the reconstruction and the simulation is −0.96 °C) (Figure 1d). The reconstruction shows a moderate temperature decrease after the 1815 Tambora eruption, but the simulation shows it was the coldest. We point out that the reconstructed temperature was driven by a combination of forcing and internal variability (such as ENSO), while the simulations in Figure 1d only included the feature of forcing as the internal variability has been canceled out by making the ensemble mean.

3.2. Influence of El Niño Events on the Simulated Magnitudes of Post-Volcanic Cooling on the TP

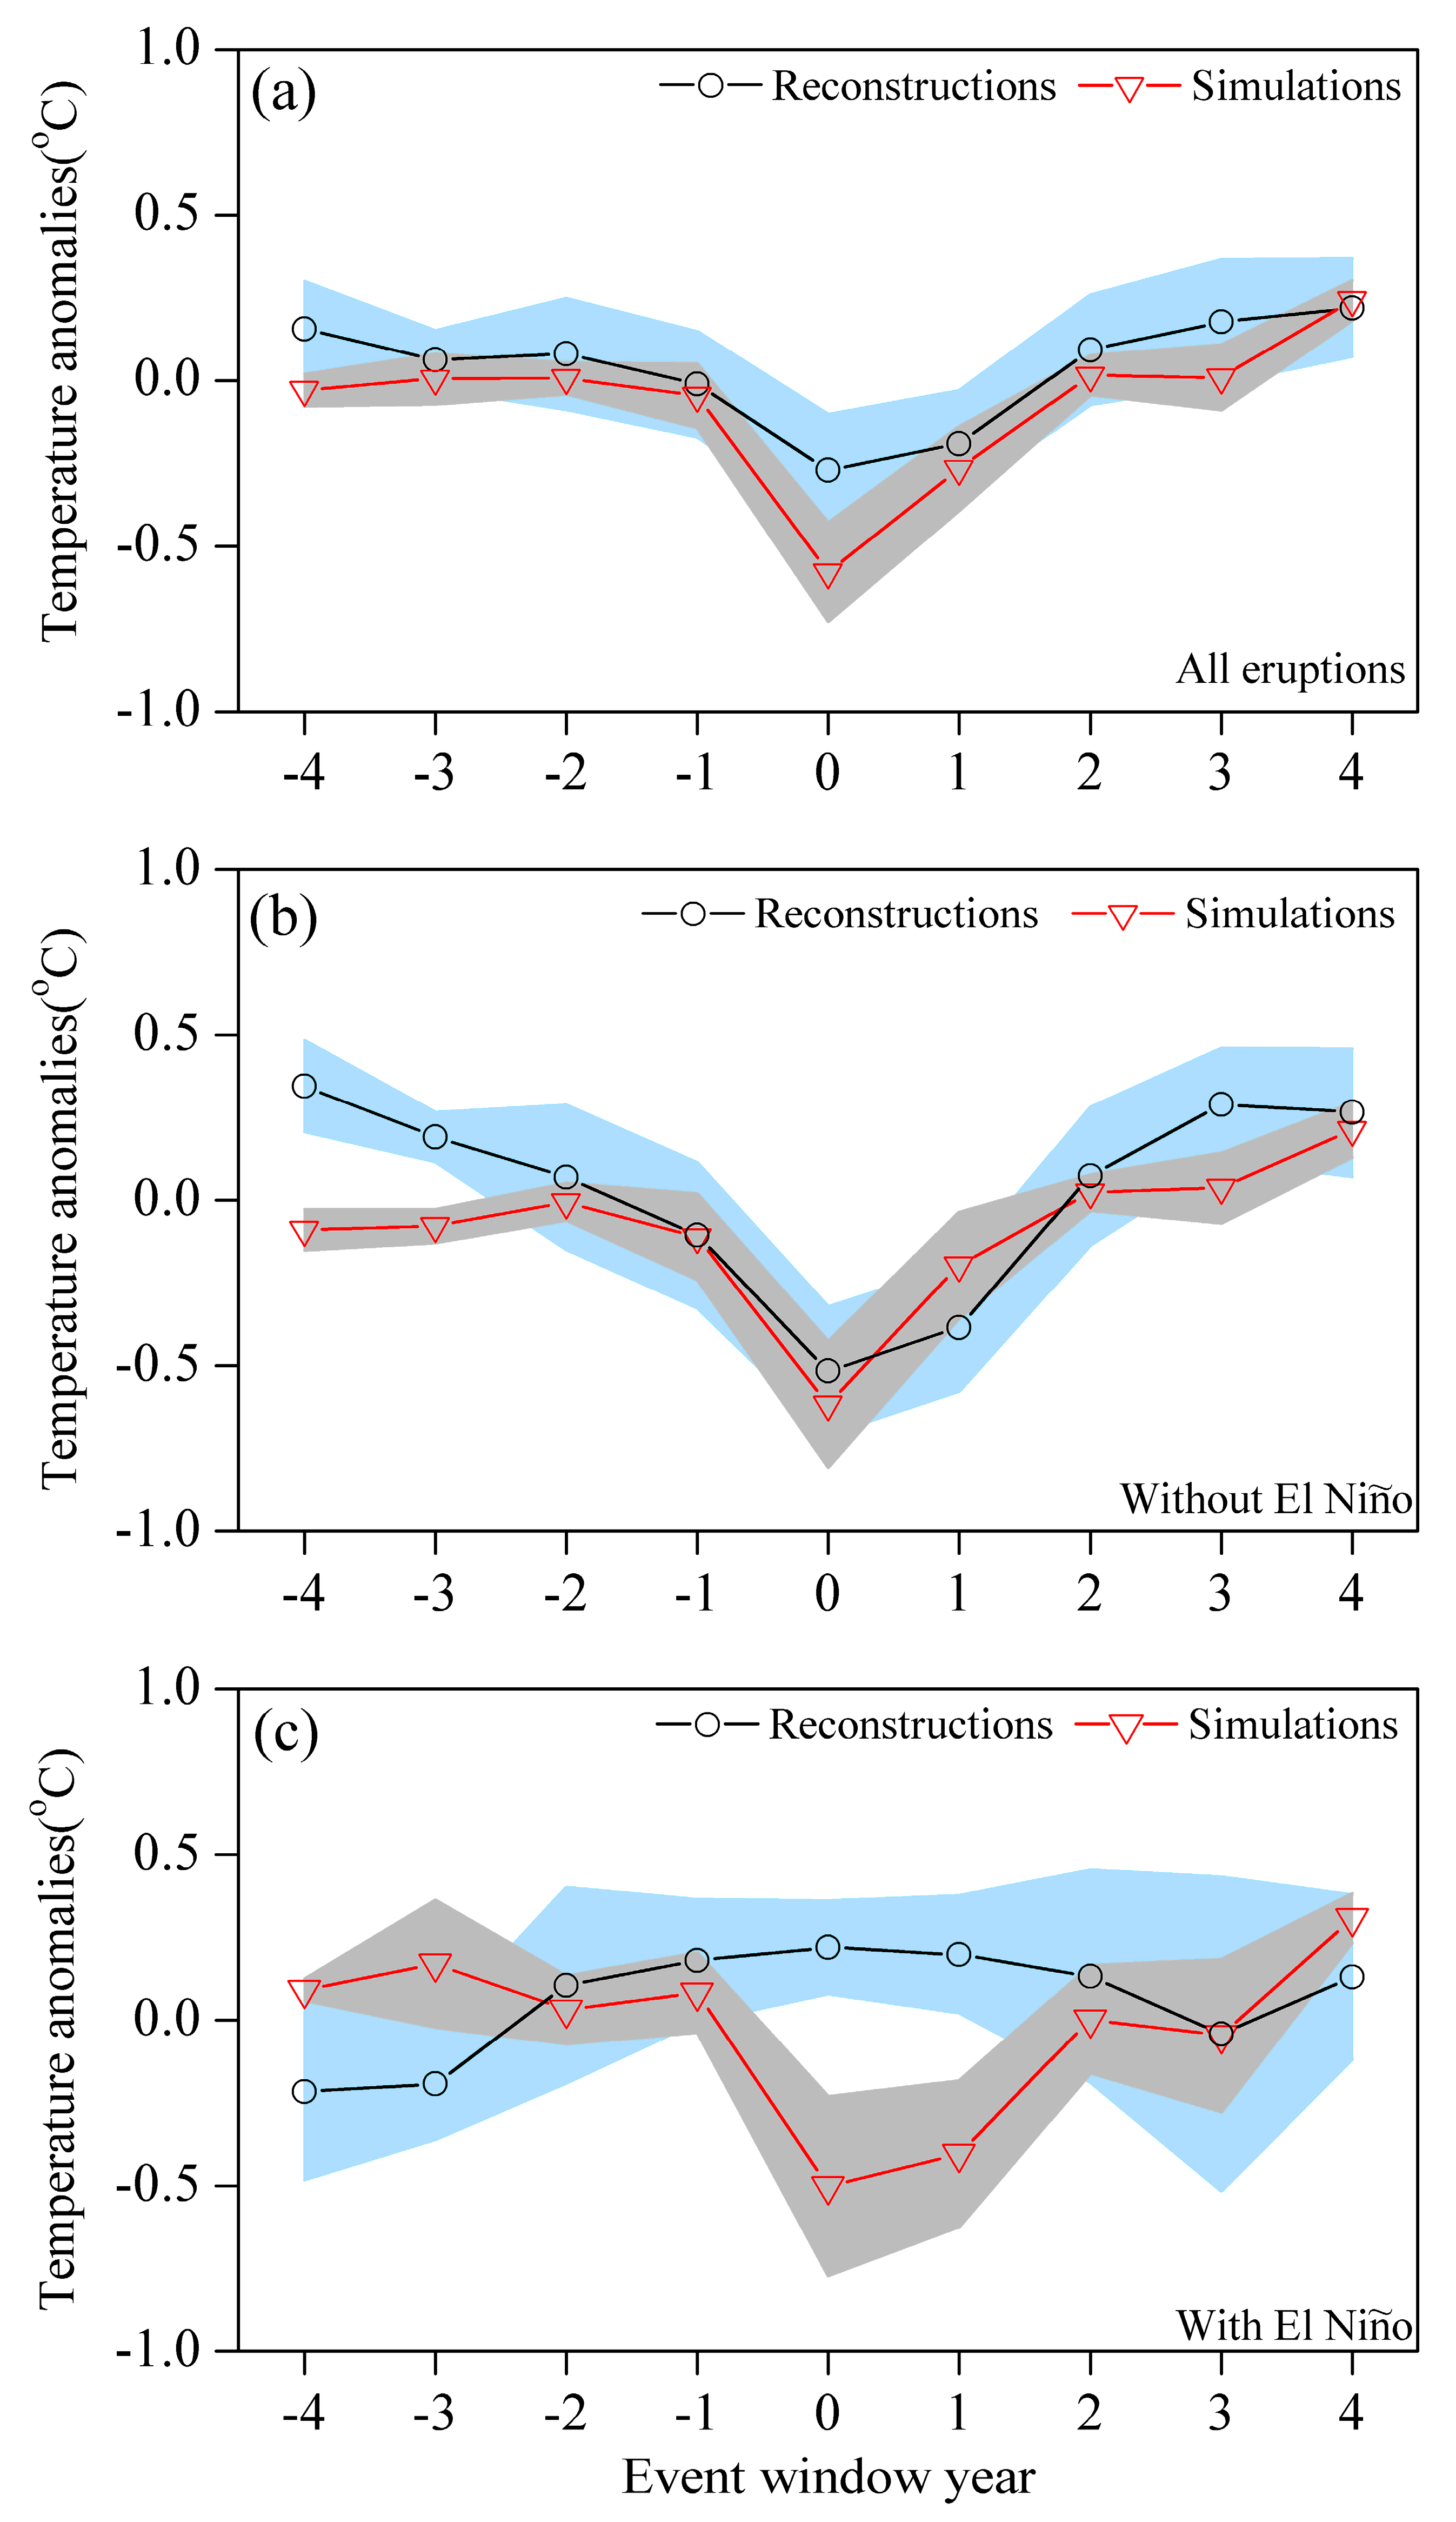
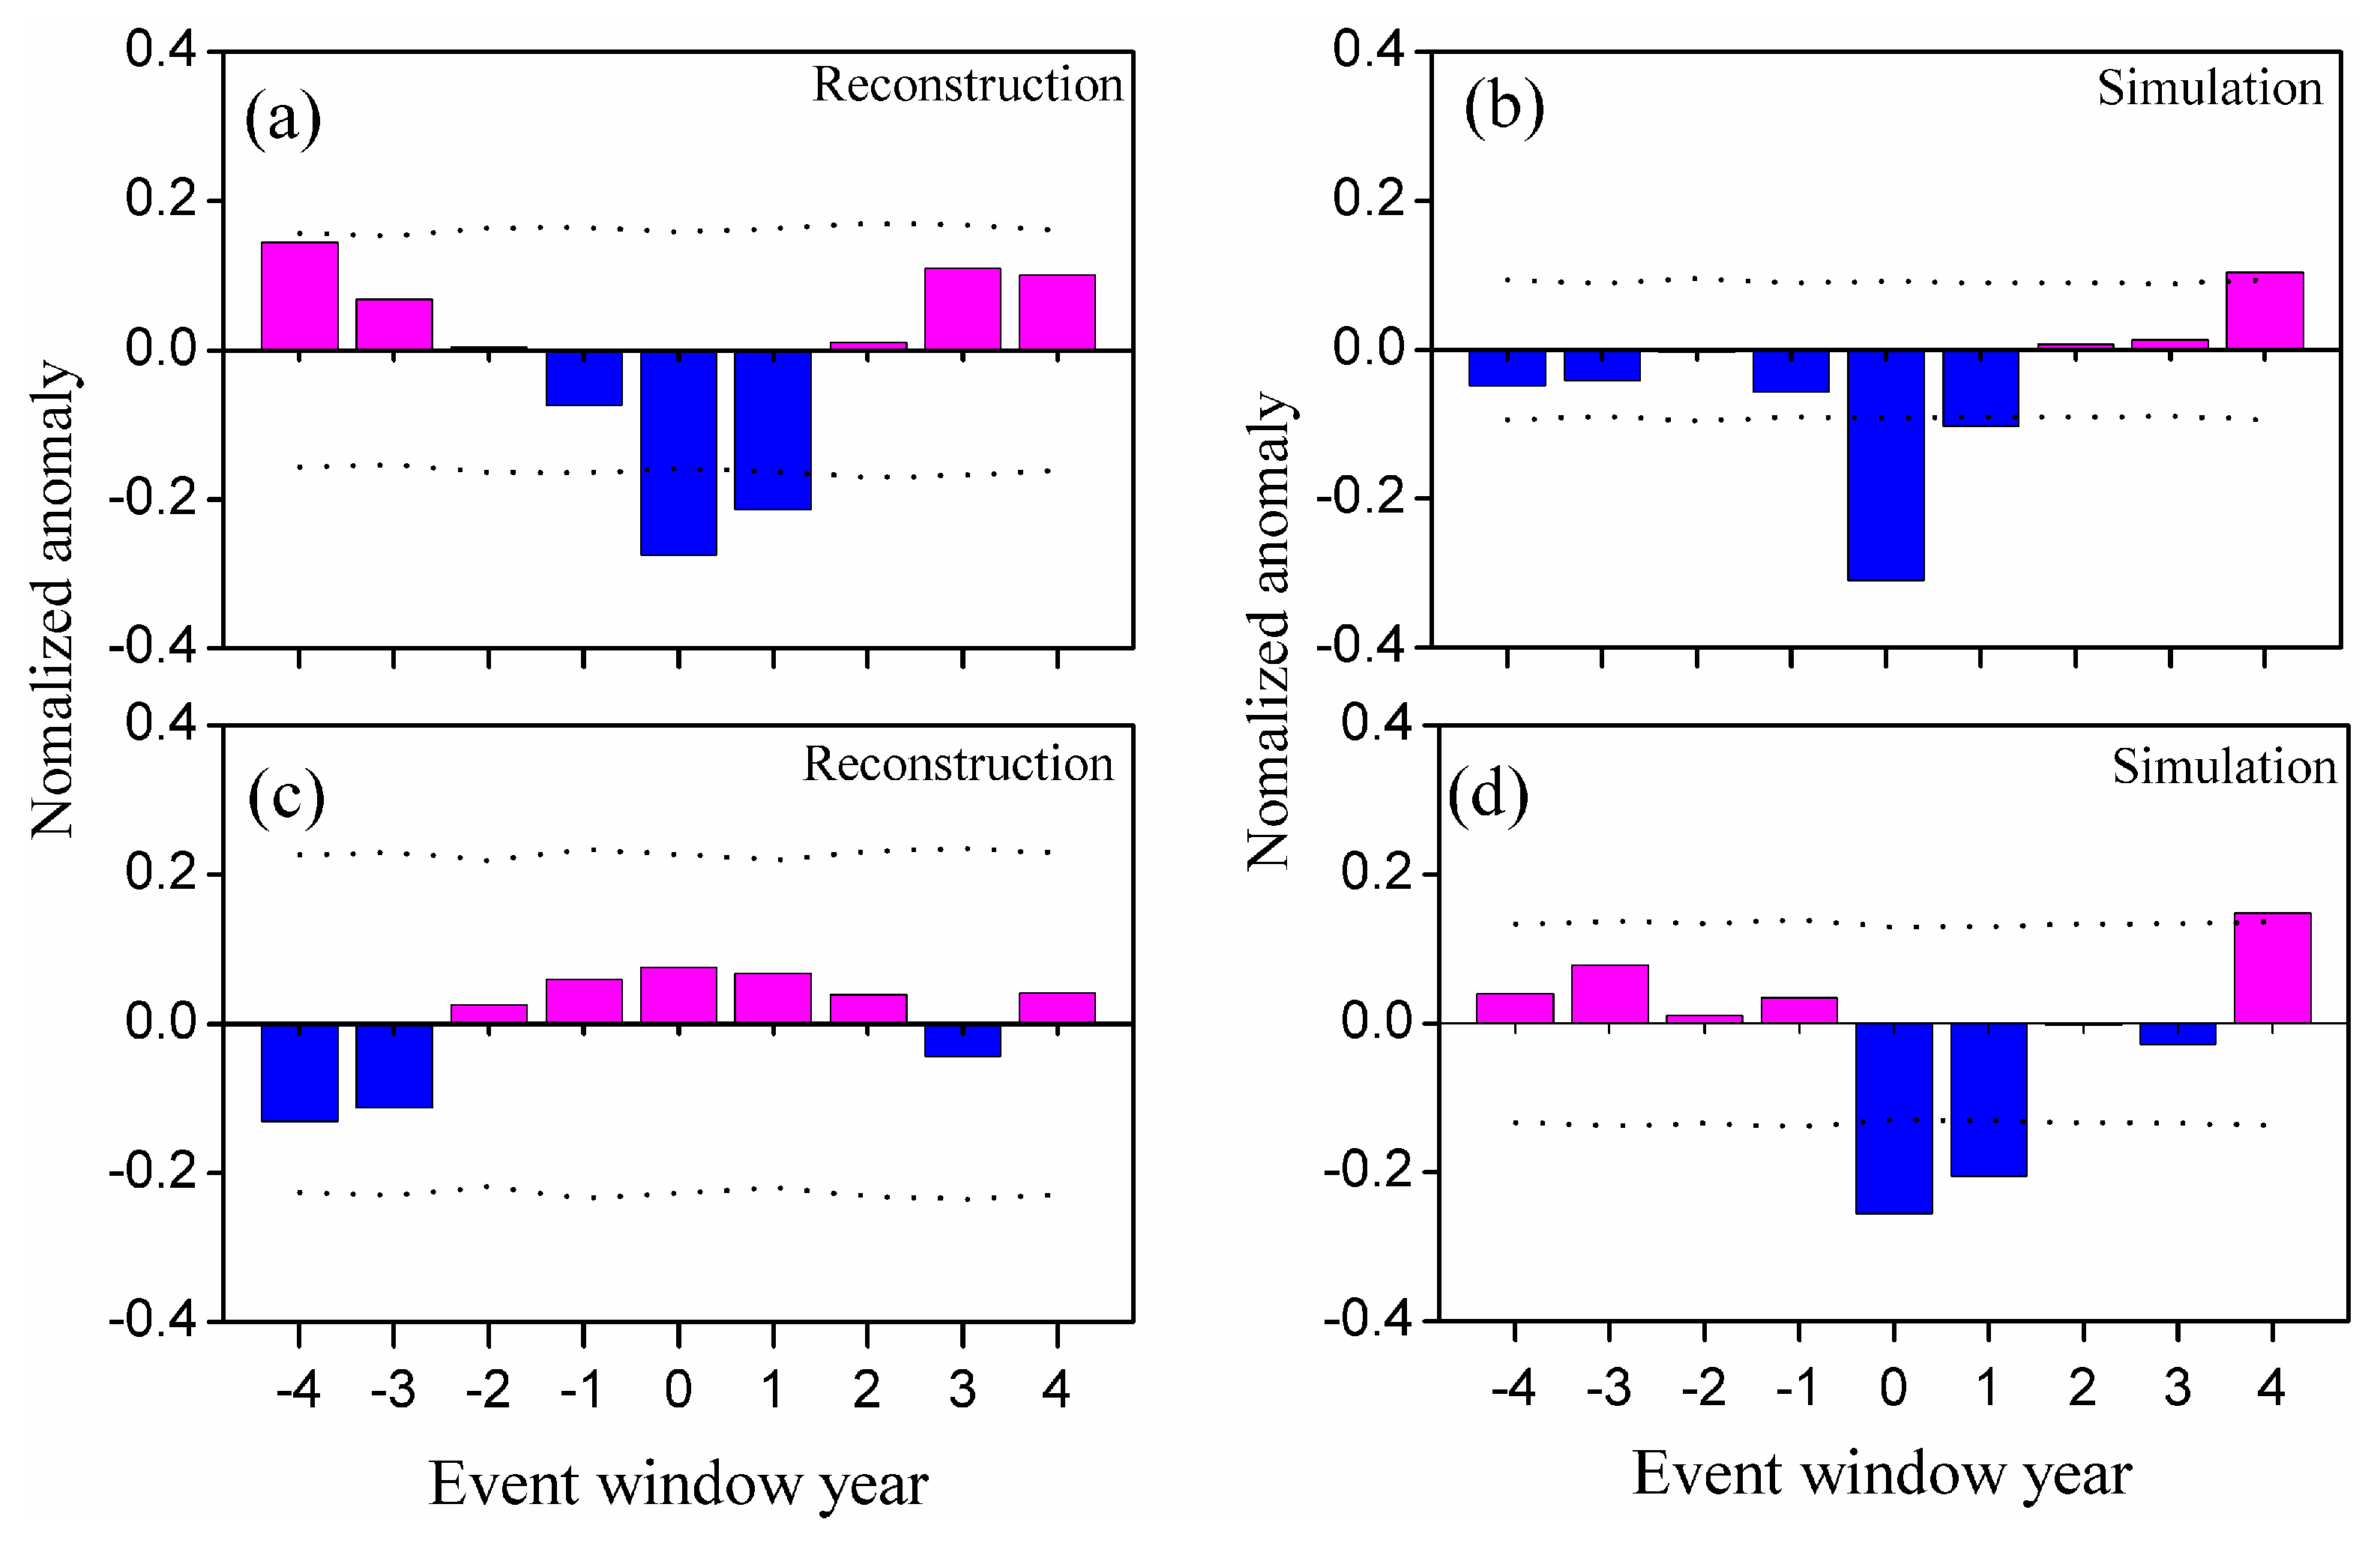
To further clarify the divergences and investigate the possible influence of the ENSO warm phase, comparisons between the magnitudes of the post-volcanic cooling derived from the reconstructions and model simulations were performed by dividing the 12 large tropical eruptions into without El Niño associations and accompanied with a subsequent El Niño event (Figure 2). In this comparison, both the reconstructed and the simulated August-September temperatures were calculated as a deviation relative to the preceding 5-year mean for each year to remove the long-term trend and thus capture the abrupt temperature drop following the large tropical eruptions [17]. The comparison shows that the simulations agree generally with the reconstructions for the situations that the composite magnitudes of August-September cooling were calculated based on all the 12 large tropical eruptions or the 8 tropical eruptions without El Niño associations (Figure 2a,b). Compared to the reconstructions, the simulations show a relatively greater cooling magnitude (especially for the eruption year) in the composite analysis based on the 12 eruptions (Figure 2a). However, the cooling magnitude derived from the simulation is relatively smaller than the reconstruction in the first year after the eruption for the estimations based on the 8 tropical eruptions without El Niño associations. The greatest discrepancy between the reconstruction and the simulation occurred in the situation that the composite cooling magnitude was calculated based on the large tropical eruptions accompanied by a subsequent El Niño event (Figure 2c). The simulation shows an anomalous post-volcanic cooling but the reconstruction does not. Superposed epoch analysis (SEA) indicates that the responses of the reconstructed August-September temperatures to the volcanic events with and without El Niño associations are significantly different, but the simulated August-September temperatures are not (Figure 3). Considering that the ensemble mean of multiple-model simulations has canceled out the feature of internal variability, we performed further comparisons between the reconstruction and simulations from each model. The results show that the consistency between the reconstruction and simulations from each model is generally consistent with the comparison between the reconstruction and the ensemble mean of the nine models. Model simulations have a better match with the reconstructions for the cooling magnitudes driven by all the twelve eruptions and the 8 eruptions no El Nino associations (Figure 2; Supplementary Figures S1–S9). Previous studies suggested that ENSO events can be triggered by volcanic eruptions [31,32,33,34] and ocean dynamical thermostat has a potential influence on the occurrence of ENSO events [35]. Our results demonstrate that the divergence between the reconstructed and simulated magnitudes of post-volcanic cooling on the TP is related to the contribution of El Niño events. This agrees with the fact that the global distribution of temperature anomalies provided by simulations is dependent on the initial state of the tropical Pacific [36,37,38].
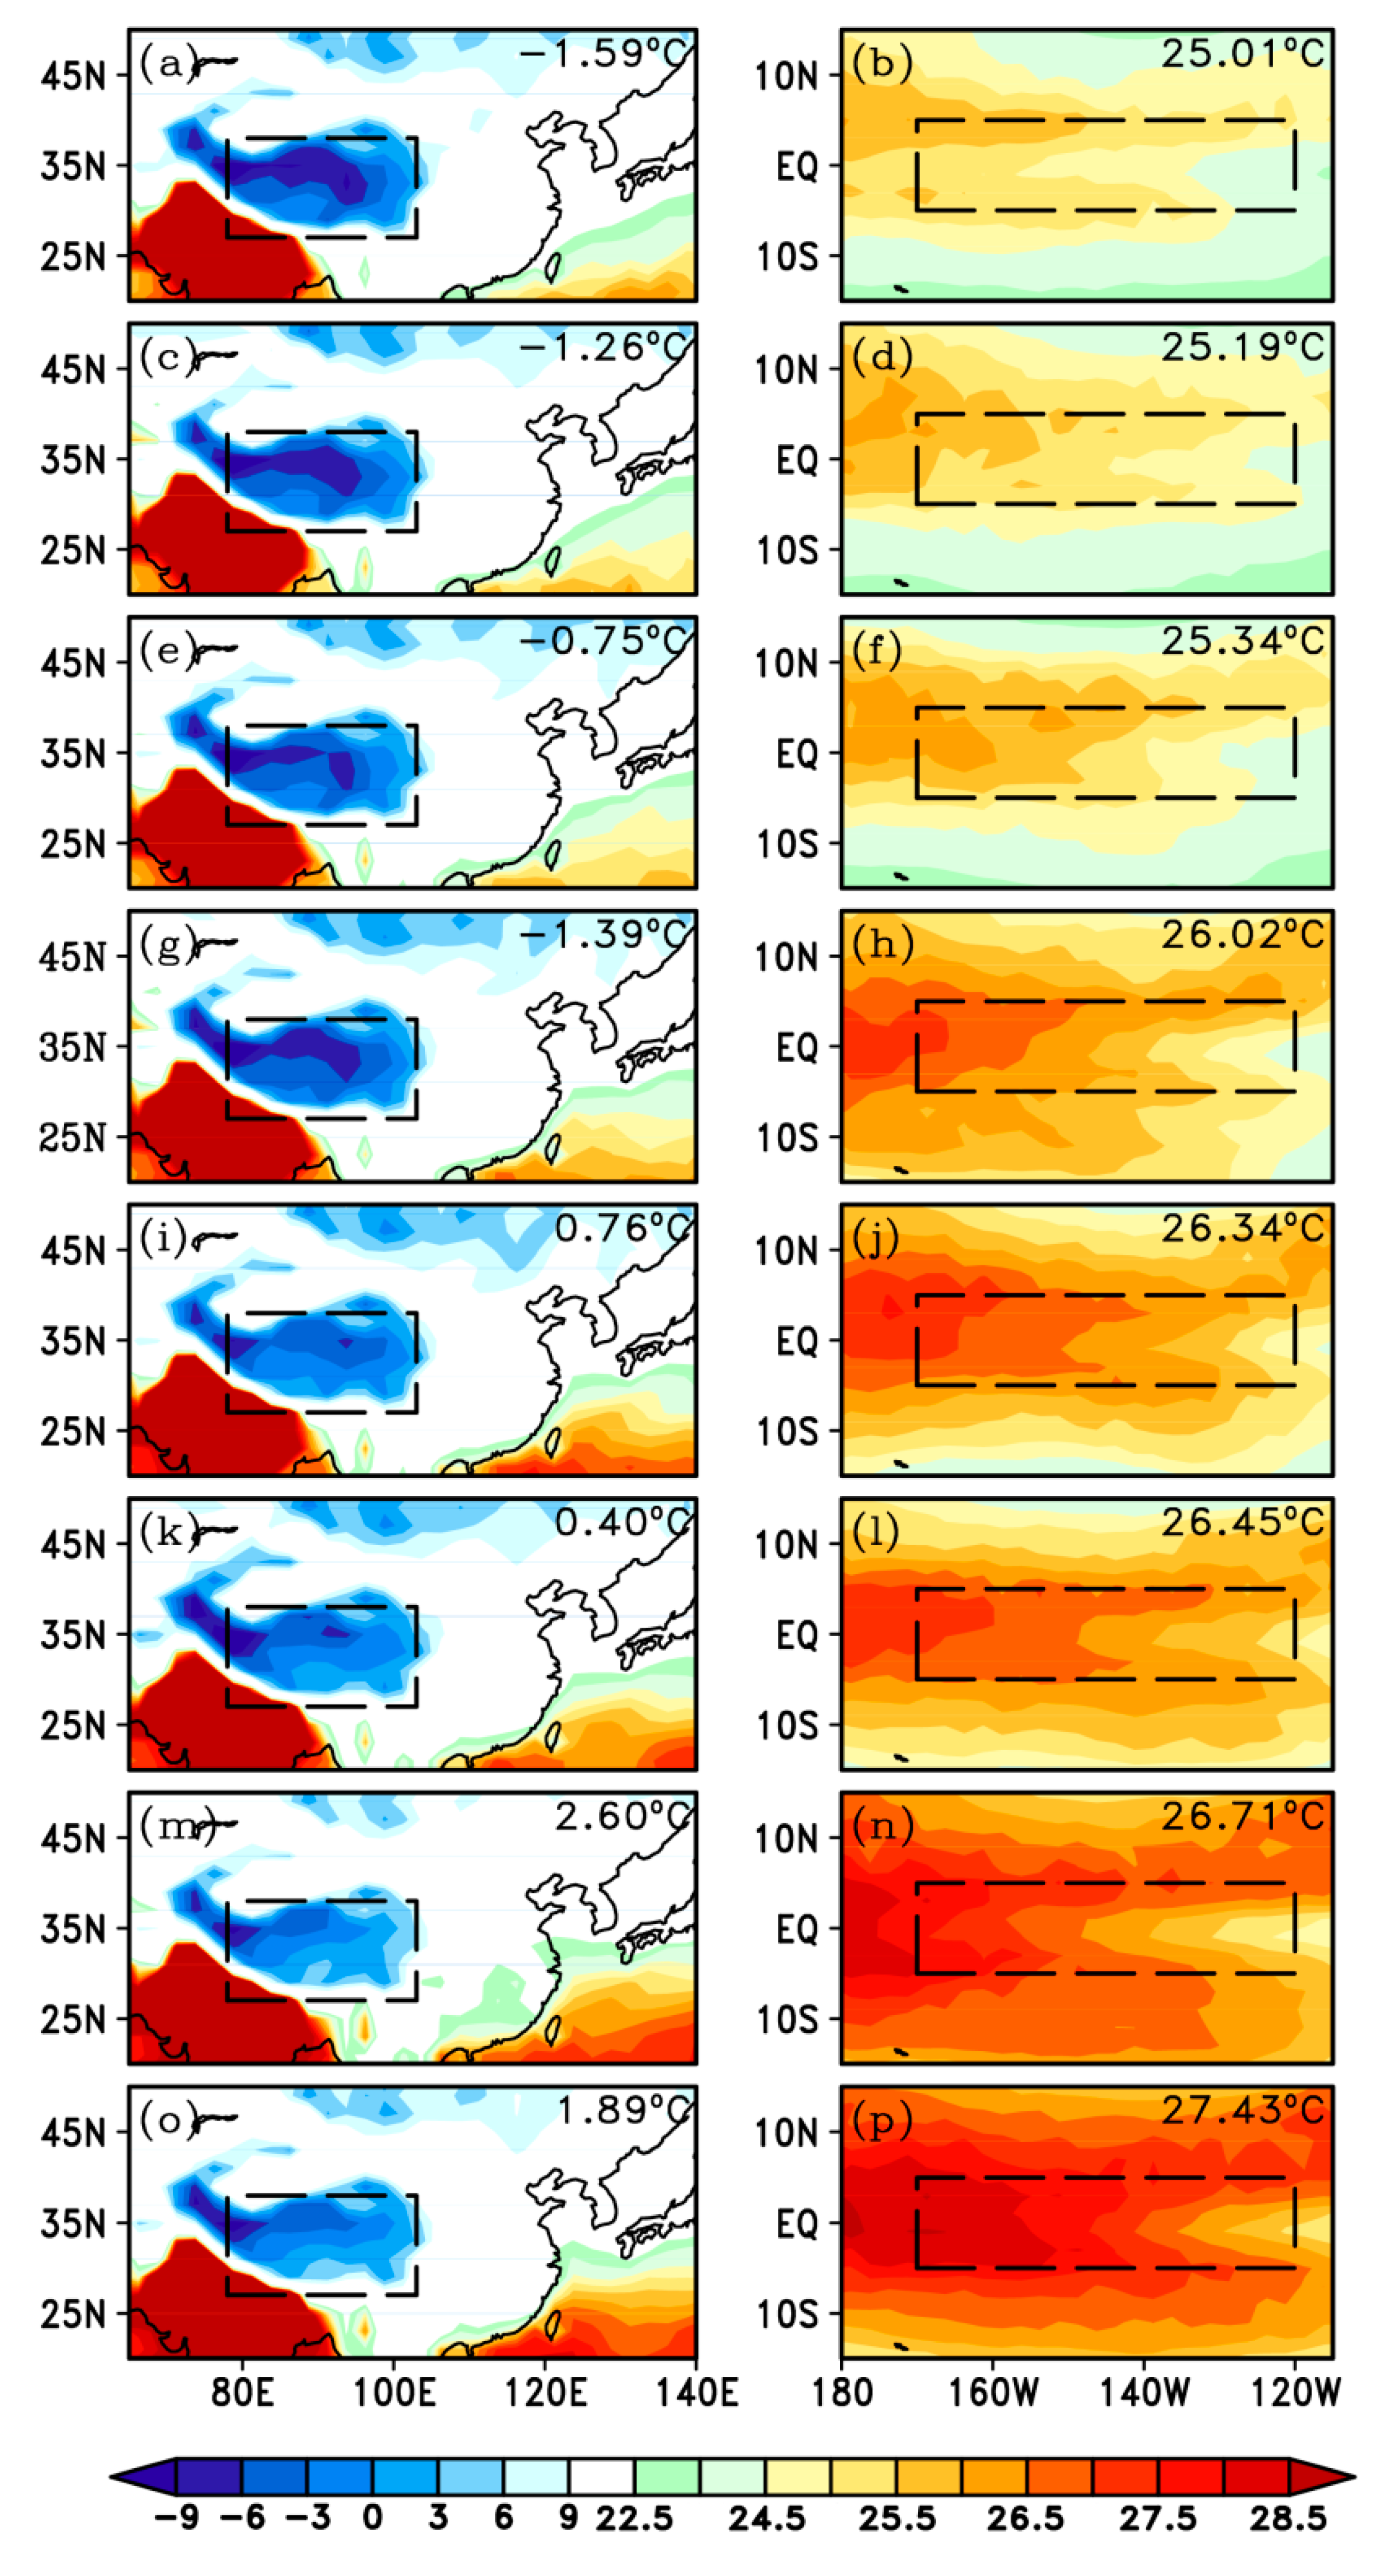
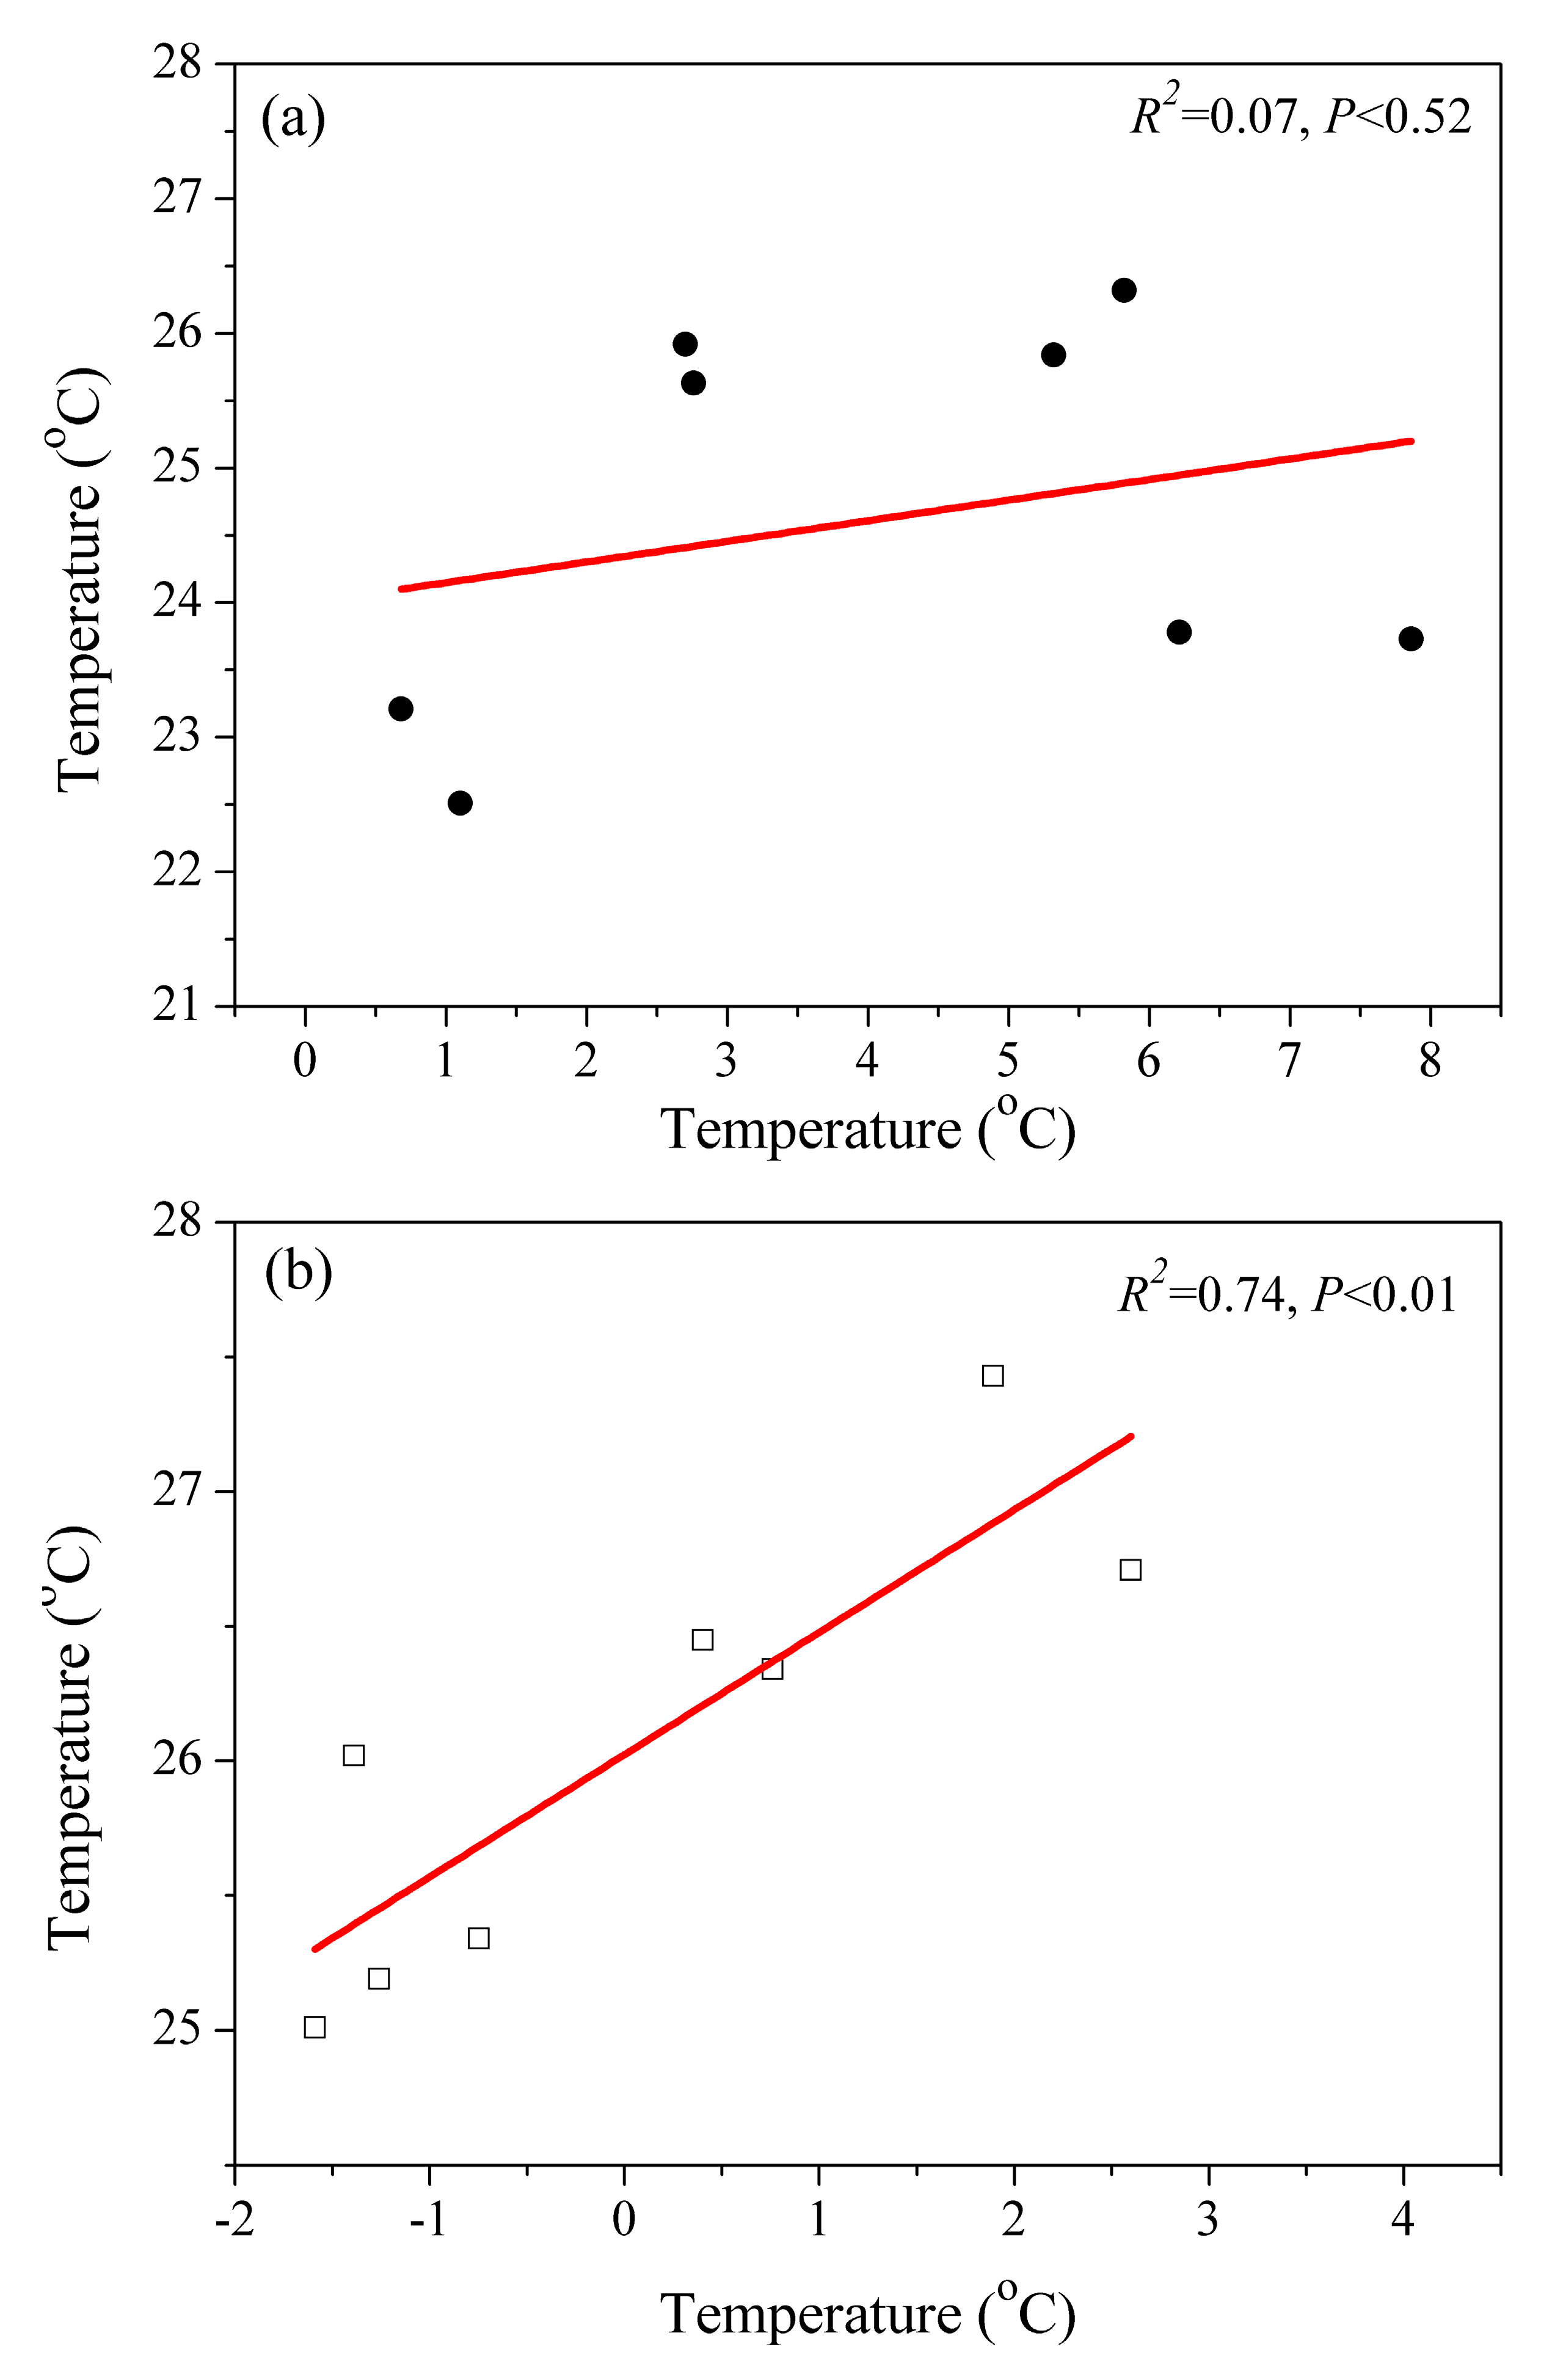
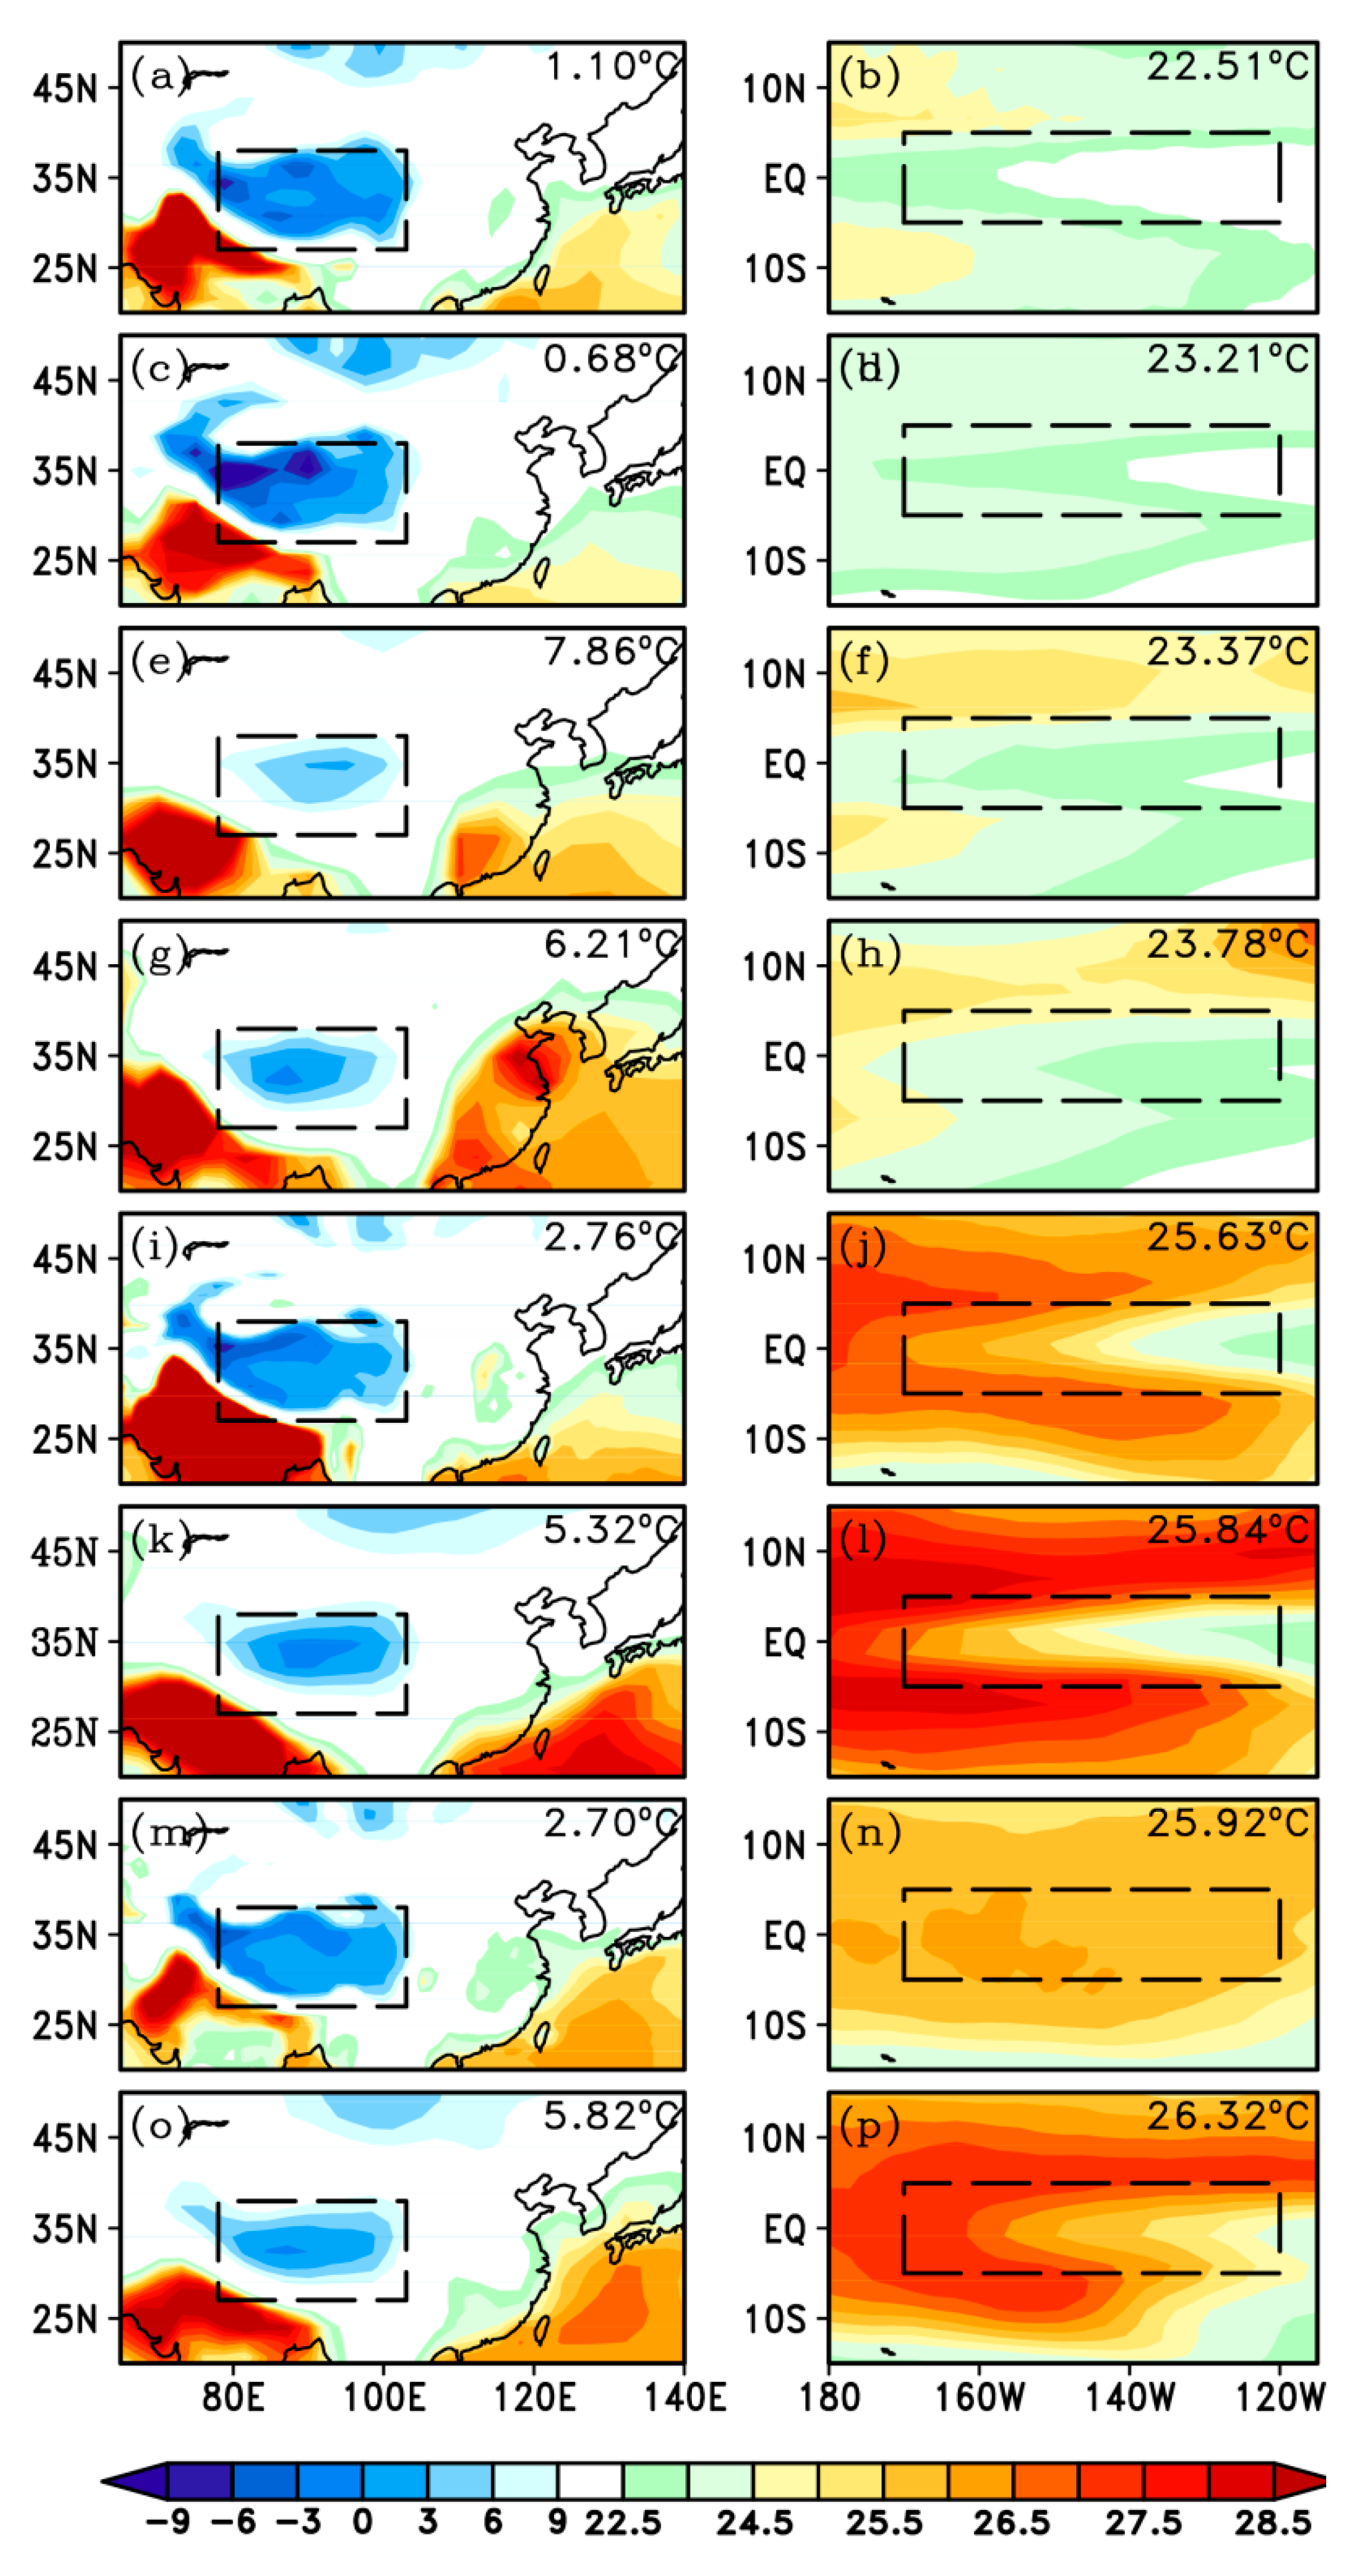
To investigate the influence of El Niño events on the simulated magnitudes of post-volcanic cooling on the TP, the relationship between the simulated August-September temperature of 1816 (the greatest discrepancy between the reconstruction and the simulation occurred in this year) on the TP and June-September mean temperature of the sea surface (SST) in the Niño 3.4 region was examined using simulations from both the different models and the different simulations of the GISS-E2-R model. June-September SST was chosen for analysis based on the consideration that the Indian summer monsoon precipitation mainly occurs during June-September and the ENSO warm phase has a simultaneous influence on the Indian summer monsoon [10]. Moreover, the August-September temperature on the TP could be influenced by the Indian summer monsoon [17,39]. Although the peak of positive temperature anomalies that result from El Niño events usually appears during winter, anomalously warm summer SST in the Niño 3.4 region has also been observed linking to the strong El Niño events (e.g., the strong El Niño events in 1982/83, 1997/98 and 2015/16; https://ggweather.com/enso/oni.htm). In the period of 1815–1817, an ENSO warm phase was documented in several studies [16,21,40], and a strong or very strong El Niño event was recorded in both the year 1816 (the 4th strongest during 900–2002) [17] and the year 1817 (strong El Niño event) [40]. Therefore, we examined the relationship between the June-September SST in the Niño 3.4 region and the TP late summer temperature. Eight simulations from the GISS-E2-R model indicate that the TP late summer temperature responded positively to the ENSO warm phase (Figure 4), and the linear relationship between them is significant (Figure 5). Although the linear relationship between the simulated August-September temperature on the TP and the El Niño conditions derived from the eight models is not significant (likely due to the different configurations among the models), a generally positive response of the TP August-September temperatures to the ENSO warm phase can be seen in most of the models (Figure 5 and Figure 6). These results suggest a positive response of the TP late summer temperature to the ENSO warm phase, which can mitigate the post-volcanic late summer cooling over the TP.
The mitigation effect of El Niño events on the post-volcanic cooling over the TP is via its indirect influence on the Indian summer monsoon. The ENSO warm phase can weaken the Indian summer monsoon through the east-west displacement of large-scale heat sources in the tropics [10]. The weakening of the Indian summer monsoon may induce a decrease in summer precipitation on the TP. Because most of the annual precipitation on the TP occurs in summer and the significantly negative correlation between the summer precipitation and the summer temperature [17,39], deficient summer precipitation on the TP may lead to high temperatures, and abundant precipitation are usually linked to a cool summer. Thus, the discrepancy between the magnitudes of the post-volcanic cooling estimated from climate model simulations and the tree-ring reconstructions can be related to the contributions of ENSO warm phase. The model simulations tend to overestimate post-volcanic cooling as missing the El Niño events which are random as part of internal climate variability.

4. Conclusions

In this study, we analyzed the simulated magnitudes of August-September cooling after 12 large tropical eruptions on the TP using nine CMIP5 models, and performed a comparison with the reconstructed temperatures. Comparisons of reconstruction with simulation both from the ensemble mean of nine models and individual model indicate that the simulated and reconstructed magnitudes of post-volcanic cooling over the TP have a relatively good agreement for those driven by the large tropical eruptions without El Niño associations, but a great discrepancy exists for those driven by the large tropical eruptions accompanied by a subsequent El Niño event. In comparison with the tree-ring density-based reconstructions, CMIP5 simulations generally tend to overestimate the post-volcanic cooling as missing the El Niños which are random as part of internal climate variability.

Supplementary Materials

The following are available online at https://www.mdpi.com/2073-4433/10/12/738/s1, Figures S1–S9: Comparisons between the composite magnitudes of post-volcanic August-September cooling over the TP derived from the tree-ring density-based reconstruction and simulation from MPI/ MRI/ IPSL/ MIROC/ FGOALS-gl/ FGOALS-s2/ GISS-E2-R-r1i1p125/ BCC-CSM1.1/ CCSM4 (Figures S1–S9 respectively) model. The composite magnitude was based on (a) all the twelve large tropical eruptions, (b) the eight large tropical eruptions without El Niño associations and (c) the four large tropical eruptions accompanied by a subsequent El Niño event. Temperature anomalies in (a–c) are with respect to the preceding 5-year mean. The shaded areas denote the error bar (SE). tree-ring density-based August-September temperature reconstructions over the Tibetan Plateau, dataset: tree-ring density-based August-September temperature reconstructions over the Tibetan Plateau.

Author Contributions

Conceptualization, J.D.; Formal analysis, J.D.; Validation, J.D.; Writing–original draft, J.D.; Project administration, J.D.; Writing–review & editing, P.W. and Z.M.

Funding

This research was supported by the National Key R&D Program of China (2018YFC1508701), the National Natural Science Foundation of China (Grants 41875113 and 41471035). Peili Wu was supported by the UK-China Research & Innovation Partnership Fund through the Met Office Climate Science for Service Partnership (CSSP) China as part of the Newton Fund.

Acknowledgments

Climate model data used in this study are available via the website https://esgf-node.llnl.gov/projects/cmip5/.

Conflicts of Interest

The authors declare no conflict of interest. The funders had no role in the design of the study; in the collection, analyses, or interpretation of data; in the writing of the manuscript, or in the decision to publish the results.

References

  1. Robock, A. Volcanic eruptions and climate. Rev. Geophys. 2000, 38, 191–219. [Google Scholar] [CrossRef]
  2. Hansen, J.; Sato, M.; Ruedy, R.; Kharecha, P.; Lacis, A.; Miller, R.; Nazarenko, L.; Lo, K.; Schmidt, G.A.; Russell, G.; et al. Climate simulations for 1880-2003 with GISS modelE. Clim. Dyn. 2007, 29, 661–696. [Google Scholar] [CrossRef]
  3. Luterbacher, J.; Pfister, C. The year without a summer. Nat. Geosci. 2015, 8, 246–248. [Google Scholar] [CrossRef]
  4. Sigl, M.; Winstrup, M.; McConnell, J.R.; Welten, K.C.; Plunkett, G.; Ludlow, F.; Buntgen, U.; Caffee, M.; Chellman, N.; Dahl-Jensen, D.; et al. Timing and climate forcing of volcanic eruptions for the past 2,500 years. Nature 2015, 523, 543–549. [Google Scholar] [CrossRef] [PubMed]
  5. Büntgen, U.; Myglan, V.S.; Ljungqvist, F.C.; McCormick, M.; Di Cosmo, N.; Sigl, M.; Jungclaus, J.; Wagner, S.; Krusic, P.J.; Esper, J.; et al. Cooling and societal change during the Late Antique Little Ice Age from 536 to around 660 AD. Nat. Geosci. 2016, 9, 231–236. [Google Scholar] [CrossRef]
  6. Mann, M.E.; Fuentes, J.D.; Rutherford, S. Underestimation of volcanic cooling in tree-ring-based reconstructions of hemispheric temperatures. Nat. Geosci. 2012, 5, 202–205. [Google Scholar] [CrossRef]
  7. Anchukaitis, K.J.; Breitenmoser, P.; Briffa, K.R.; Buchwal, A.; Buntgen, U.; Cook, E.R.; D’Arrigo, R.D.; Esper, J.; Evans, M.N.; Frank, D.; et al. Tree rings and volcanic cooling. Nat. Geosci. 2012, 5, 836–837. [Google Scholar] [CrossRef]
  8. Stoffel, M.; Khodri, M.; Corona, C.; Guillet, S.; Poulain, V.; Bekki, S.; Guiot, J.; Luckman, B.H.; Oppenheimer, C.; Lebas, N.; et al. Estimates of volcanic-induced cooling in the Northern Hemisphere over the past 1,500 years. Nat. Geosci. 2015, 8, 784–788. [Google Scholar] [CrossRef]
  9. Hartl-Meier, C.T.M.; Buntgen, U.; Smerdon, J.E.; Zorita, E.; Krusic, P.J.; Ljungqvist, F.C.; Schneider, L.; Esper, J. Temperature Covariance in Tree Ring Reconstructions and Model Simulations Over the Past Millennium. Geophys. Res. Lett. 2017, 44, 9458–9469. [Google Scholar] [CrossRef]
  10. Kumar, K.K.; Rajagopalan, B.; Cane, M.A. On the weakening relationship between the Indian monsoon and ENSO. Science 1999, 284, 2156–2159. [Google Scholar] [CrossRef]
  11. Li, J.B.; Xie, S.P.; Cook, E.R.; Huang, G.; D’Arrigo, R.; Liu, F.; Ma, J.; Zheng, X.T. Interdecadal modulation of El Nino amplitude during the past millennium. Nat. Clim. Chang. 2011, 1, 114–118. [Google Scholar] [CrossRef]
  12. Shaman, J.; Tziperman, E. The effect of ENSO on Tibetan plateau snow depth: A stationary wave teleconnection mechanism and implications for the south Asian monsoons. J. Clim. 2005, 18, 2067–2079. [Google Scholar] [CrossRef]
  13. Miyakoda, K.; Kinter, J.L.; Yang, S. The role of ENSO in the south Asian monsoon and pre-monsoon signals over the Tibetan plateau. J. Meteorol. Soc. Jpn. 2003, 81, 1015–1039. [Google Scholar] [CrossRef]
  14. Xu, H.; Hong, Y.T.; Hong, B.; Zhu, Y.X.; Wang, Y. Influence of ENSO on multi-annual temperature variations at Hongyuan, NE Qinghai-Tibet plateau: Evidence from delta(13) C of spruce tree rings. Int. J. Climatol. 2010, 30, 120–126. [Google Scholar] [CrossRef]
  15. Yang, M.X.; Yao, T.D.; He, Y.Q.; Thompson, L.G. ENSO events recorded in the Guliya ice core. Clim. Chang. 2000, 47, 401–409. [Google Scholar] [CrossRef]
  16. Gao, J.; He, Y.; Masson-Delmotte, V.; Yao, T.D. ENSO Effects on Annual Variations of Summer Precipitation Stable Isotopes in Lhasa, Southern Tibetan Plateau. J. Clim. 2018, 31, 1173–1182. [Google Scholar] [CrossRef]
  17. Duan, J.P.; Li, L.; Ma, Z.G.; Esper, J.; Buntgen, U.; Xoplaki, E.; Zhang, D.J.; Wang, L.; Yin, H.; Luterbacher, J. Summer Cooling Driven by Large Volcanic Eruptions over the Tibetan Plateau. J. Clim. 2018, 31, 9869–9879. [Google Scholar] [CrossRef]
  18. Liu, X.D.; Chen, B.D. Climatic warming in the Tibetan Plateau during recent decades. Int. J. Climatol. 2000, 20, 1729–1742. [Google Scholar] [CrossRef]
  19. You, Q.L.; Kang, S.C.; Pepin, N.; Yan, Y.P. Relationship between trends in temperature extremes and elevation in the eastern and central Tibetan Plateau, 1961–2005. Geophys. Res. Lett. 2008, 35. [Google Scholar] [CrossRef]
  20. Duan, J.P.; Ma, Z.G.; Li, L.; Zheng, Z.Y. August-September Temperature Variability on the Tibetan Plateau: Past, Present, and Future. J. Geophys. Res. Atmos. 2019, 124, 6057–6068. [Google Scholar] [CrossRef]
  21. Brönnimann, S.; Xoplaki, E.; Casty, C.; Pauling, A.; Luterbacher, J. ENSO influence on Europe during the last centuries. Clim. Dyn. 2007, 28, 181–197. [Google Scholar] [CrossRef]
  22. Wu, T.W.; Yu, R.C.; Zhang, F.; Wang, Z.Z.; Dong, M.; Wang, L.N.; Jin, X.; Chen, D.L.; Li, L. The Beijing Climate Center atmospheric general circulation model: Description and its performance for the present-day climate. Clim. Dyn. 2010, 34, 123–147. [Google Scholar] [CrossRef]
  23. Landrum, L.; Otto-Bliesner, B.L.; Wahl, E.R.; Conley, A.; Lawrence, P.J.; Rosenbloom, N.; Teng, H.Y. Last Millennium Climate and Its Variability in CCSM4. J. Clim. 2013, 26, 1085–1111. [Google Scholar] [CrossRef]
  24. Zhou, T.J.; Wu, B.; Wen, X.Y.; Li, L.J.; Wang, B. A fast version of LASG/IAP climate system model and its 1000-year control integration. Adv. Atmos. Sci. 2008, 25, 655–672. [Google Scholar] [CrossRef]
  25. Man, W.M.; Zhou, T.J. Regional-scale surface air temperature and East Asian summer monsoon changes during the last millennium simulated by the FGOALS-gl climate system model. Adv. Atmos. Sci. 2014, 31, 765–778. [Google Scholar] [CrossRef]
  26. Schmidt, G.A.; Kelley, M.; Nazarenko, L.; Ruedy, R.; Russell, G.L.; Aleinov, I.; Bauer, M.; Bauer, S.E.; Bhat, M.K.; Bleck, R.; et al. Configuration and assessment of the GISS ModelE2 contributions to the CMIP5 archive. J. Adv. Model. Earth Syst. 2014, 6, 141–184. [Google Scholar] [CrossRef]
  27. Dufresne, J.L.; Foujols, M.A.; Denvil, S.; Caubel, A.; Marti, O.; Aumont, O.; Balkanski, Y.; Bekki, S.; Bellenger, H.; Benshila, R.; et al. Climate change projections using the IPSL-CM5 Earth System Model: From CMIP3 to CMIP5. Clim. Dyn. 2013, 40, 2123–2165. [Google Scholar] [CrossRef]
  28. Watanabe, S.; Hajima, T.; Sudo, K.; Nagashima, T.; Takemura, T.; Okajima, H.; Nozawa, T.; Kawase, H.; Abe, M.; Yokohata, T.; et al. MIROC-ESM 2010: Model description and basic results of CMIP5-20c3m experiments. Geosci. Model Dev. 2011, 4, 845–872. [Google Scholar] [CrossRef]
  29. Jungclaus, J.H.; Lohmann, K.; Zanchettin, D. Enhanced 20th-century heat transfer to the Arctic simulated in the context of climate variations over the last millennium. Clim. Past 2014, 10, 2201–2213. [Google Scholar] [CrossRef]
  30. Yukimoto, S.; Adachi, Y.; Hosaka, M.; Sakami, T.; Yoshimura, H.; Hirabara, M.; Tanaka, T.Y.; Shindo, E.; Tsujino, H.; Deushi, M.; et al. A New Global Climate Model of the Meteorological Research Institute: MRI-CGCM3-Model Description and Basic Performance. J. Meteorol. Soc. Jpn. 2012, 90, 23–64. [Google Scholar] [CrossRef]
  31. Swingedouw, D.; Mignot, J.; Ortega, P.; Khodri, M.; Menegoz, M.; Cassou, C.; Hanquiez, V. Impact of explosive volcanic eruptions on the main climate variability modes. Glob. Planet. Chang. 2017, 150, 24–45. [Google Scholar] [CrossRef]
  32. Khodri, M.; Izumo, T.; Vialard, J.; Janicot, S.; Cassou, C.; Lengaigne, M.; Mignot, J.; Gastineau, G.; Guilyardi, E.; Lebas, N.; et al. Tropical explosive volcanic eruptions can trigger El Nino by cooling tropical Africa. Nat. Commun. 2017, 8, 778. [Google Scholar] [CrossRef] [PubMed]
  33. Zanchettin, D. Aerosol and Solar Irradiance Effects on Decadal Climate Variability and Predictability. Curr. Clim. Chang. Rep. 2017, 3, 150–162. [Google Scholar] [CrossRef]
  34. Pausata, F.S.R.; Karamperidou, C.; Caballero, R.; Battisti, D.S. ENSO response to high-latitude volcanic eruptions in the Northern Hemisphere: The role of the initial conditions. Geophys. Res. Lett. 2016, 43, 8694–8702. [Google Scholar] [CrossRef]
  35. Clement, A.C.; Seager, R.; Cane, M.A.; Zebiak, S.E. An ocean dynamical thermostat. J. Clim. 1996, 9, 2190–2196. [Google Scholar] [CrossRef] [Green Version]
  36. Timmreck, C. Modeling the climatic effects of large explosive volcanic eruptions. Wiley Interdiscip. Rev. Clim. Chang. 2012, 3, 545–564. [Google Scholar] [CrossRef]
  37. Timmreck, C.; Graf, H.F.; Lorenz, S.J.; Niemeier, U.; Zanchettin, D.; Matei, D.; Jungclaus, J.H.; Crowley, T.J. Aerosol size confines climate response to volcanic super-eruptions. Geophys. Res. Lett. 2010, 37. [Google Scholar] [CrossRef] [Green Version]
  38. Zanchettin, D.; Khodri, M.; Timmreck, C.; Toohey, M.; Schmidt, A.; Gerber, E.P.; Hegerl, G.; Robock, A.; Pausata, F.S.R.; Ball, W.T.; et al. The Model Intercomparison Project on the climatic response to Volcanic forcing (VolMIP): Experimental design and forcing input data for CMIP6. Geosci. Model Dev. 2016, 9, 2701–2719. [Google Scholar] [CrossRef] [Green Version]
  39. Wang, L.; Duan, J.P.; Chen, J.; Huang, L.; Shao, X.M. Temperature reconstruction from tree-ring maximum density of Balfour spruce in eastern Tibet, China. Int. J. Climatol. 2010, 30, 972–979. [Google Scholar] [CrossRef]
  40. Gergis, J.L.; Fowler, A.M. A history of ENSO events since AD 1525: Implications for future climate change. Clim. Chang. 2009, 92, 343–387. [Google Scholar] [CrossRef]
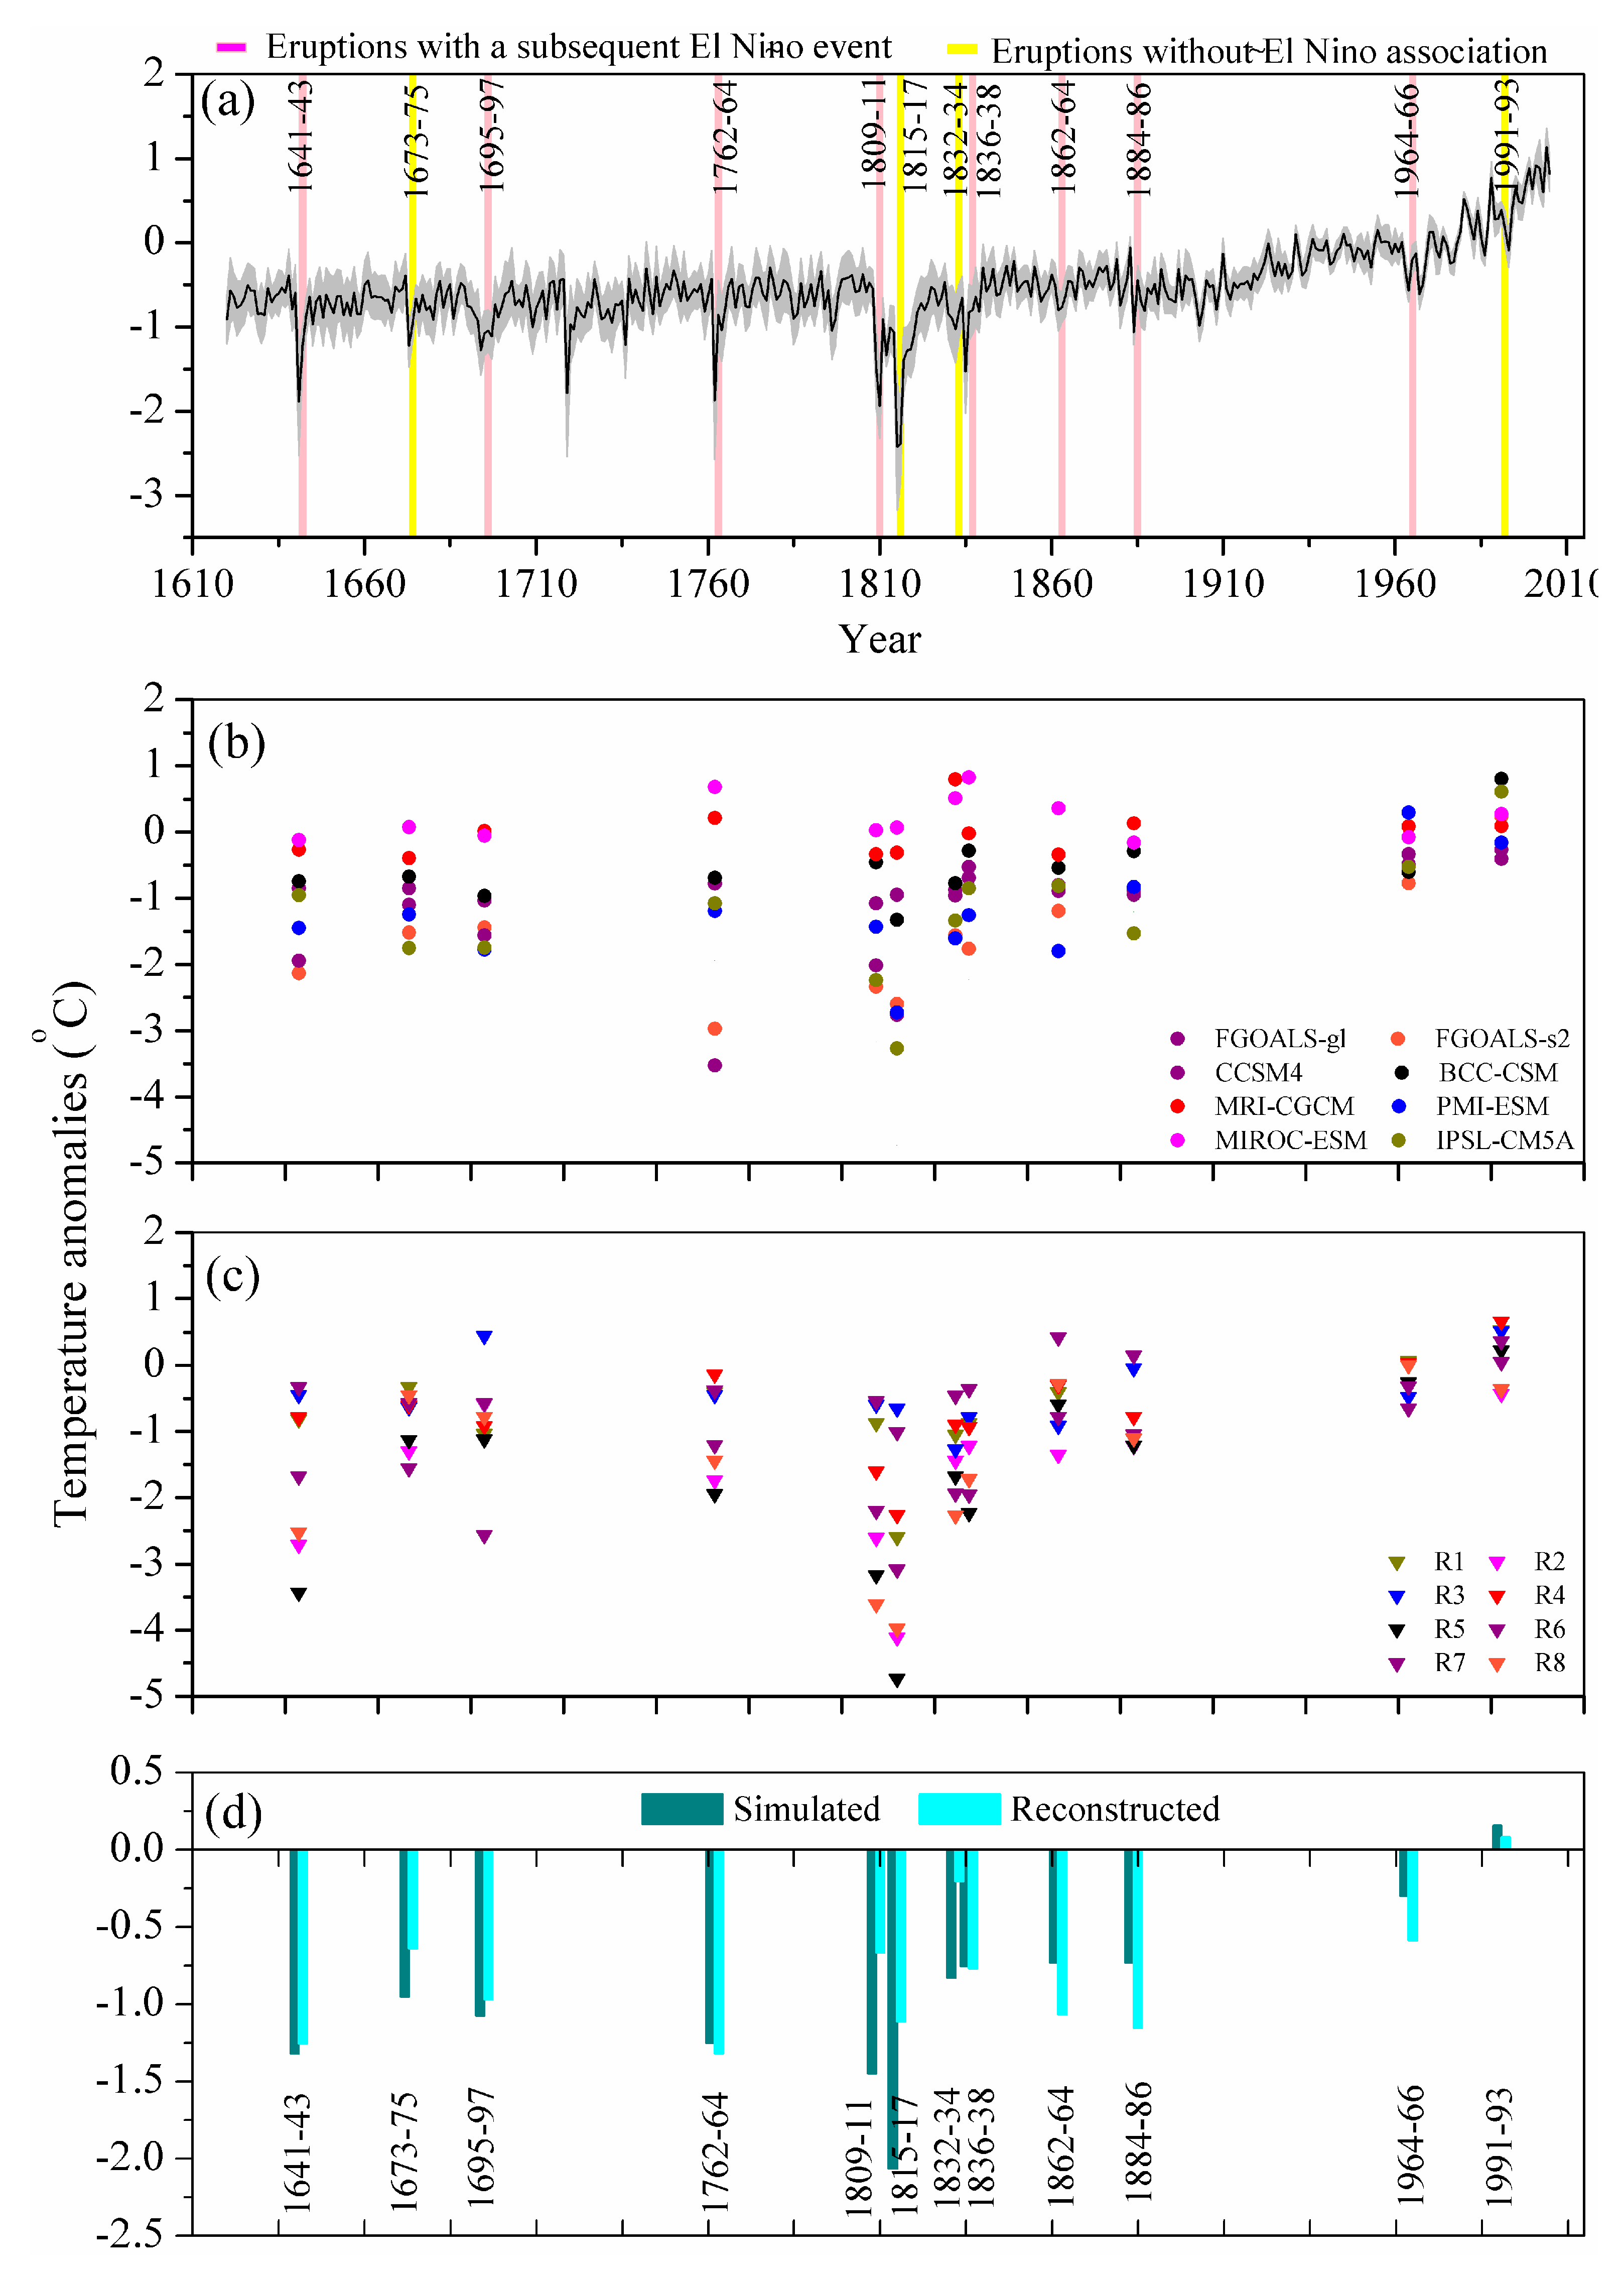
Figure 1. Estimated magnitudes of August-September cooling driven by 12 large tropical eruptions since 1620 based on climate model simulations and tree-ring density-based reconstructions on the Tibetan Plateau (TP). (a) Simulated August-September mean temperature derived from an ensemble mean of nine CMIP5 climate models since 1620 (Table 2; for GISS-E2-R, only r1i1p125 was used). The black line is the annual value and the grey shaded area is the error bar (SE). August-September mean temperatures in the subsequent 3 years of the 12 large tropical eruptions were highlighted. (b) Simulated magnitudes of August-September cooling (were calculated as a 3-year mean following the eruption) after the 12 large tropical eruptions derived from eight CMIP5 models. (c) Simulated magnitudes of August-September cooling (were calculated as a 3-year mean following the eruption) after the 12 large tropical eruptions derived from eight simulations of the GISS-E2-R model. (d) Comparisons between the magnitudes of August-September cooling after 12 tropical eruptions (were calculated as a 3-year mean following the eruption) derived from the tree-ring density-based reconstruction [20] and the ensemble mean of nine CMIP5 models (for GISS-E2-R, only r1i1p125 was used). Temperature anomalies in (ad) are with respect to the period of 1961–1990.
Atmosphere 10 00738 g001
Figure 2. Comparisons between the composite magnitudes of post-volcanic August-September cooling over the TP derived from the tree-ring density-based reconstruction and the ensemble mean of nine CMIP5 models (Table 2; For GISS-E2-R, only r1i1p125 was used,). The composite magnitude was based on (a) all the twelve large tropical eruptions, (b) the eight large tropical eruptions without El Niño associations and (c) the four large tropical eruptions accompanied by a subsequent El Niño event. Temperature anomalies in (ac) are with respect to the preceding 5-year mean. The shaded areas denote the error bar (SE).
Atmosphere 10 00738 g002
Figure 3. Superposed epoch analysis (SEA) testing the significance of the response of the estimated magnitudes of August-September cooling over the TP to the large tropical eruptions. The composite response of the reconstructed (a) and simulated (b) magnitudes of August-September cooling over the TP to the eight large tropical eruptions without El Niño associations (Table 1). The composite response of the reconstructed (a) and simulated (b) August-September cooling magnitudes over the TP to the four large tropical eruptions accompanied by a subsequent El Niño event (Table 1). Dashed lines represent the 95% confidence limits.
Atmosphere 10 00738 g003
Figure 4. Simulated August-September mean temperature in 1816 over the TP (28°–37° N, 78°–103° E) (a,c,e,g,i,k,m,o) and the June-September SST in 1816 in the El Niño 3.4 region (5° S-5° N, 120° W-170° W) (b,d,f,h,j,l,n,p) derived from eight simulations of the GISS-E-R2 model. The ranges of the TP and the El Niño 3.4 region were denoted using the dashed boxes. The regional average temperatures are shown in the upper right corner in each plot, which are ordered according to the value from the top to the bottom of the Figure. The simulations in (a,b), (c,d), (e,f), (g,h), (i,j), (k,l), (m,n), and (o,p) were derived from r1i1p125, r1i1p128, r1i1p122, r1i1p121, r1i1p124, r1i1p127, r1i1p123, and r1i1p126, respectively (Table 2).
Atmosphere 10 00738 g004
Figure 5. The linear relationship between the simulated August-September mean temperature over the TP in 1816and the June-September SST in the El Niño 3.4 region in 1816. Values in (a) are from simulations of eight CMIP5 models and (b) are from eight simulations of the GISS-E2-R model.
Atmosphere 10 00738 g005
Figure 6. Simulated August-September mean temperature over the TP (28°-37° N, 78°-103° E) in 1816 (a,c,e,g,i,k,m,o) and the June-September SST in the El Niño 3.4 region in 1816 (5° S-5° N, 120° W-170° W) (b,d,f,h,j,l,n,p) derived from eight CMIP5 models. The ranges of the TP and the El Niño 3.4 region were denoted using the dashed boxes. The regionally averaged temperatures are shown in the upper right corner in each plot, which are ordered according to the values from the top to the bottom of the Figure. The simulations in (a,b), (c,d), (e,f), (g,h), (i,j), (k,l), (m,n), and (o,p) were derived from IPSL-CM5A-LR, MPI-ESM-P, CCSM4, FGOALS-gl, MIROC-ESM, MRI-CGCM, FGOALS-s2, and BCC-CSM1.1, respectively (Table 1).
Atmosphere 10 00738 g006
Table 1. Information of volcanic events used in this study and the simulated (ensemble mean) and reconstructed August-September mean temperature by averaging the August-September temperatures in the subsequent 3 years of the eruptions.
Event YearGVF (W m−2)Simulated TAug–SepReconstructed TAug–Sep
1641−11.84−1.32 °C−1.26 °C
1673−3.11−0.95 °C−0.64 °C
1695−10.24−1.07 °C−0.97 °C
1762−3.52−1.25 °C−1.32 °C
1809−12.01−1.45 °C−0.67 °C
1815−17.20−2.07 °C−1.11 °C
1832−6.46−0.83 °C−0.21 °C
1836−6.57−0.75 °C−0.77 °C
1862−4.03−0.73 °C−1.07 °C
1884−5.84−0.74 °C−1.15 °C
1964−3.75−0.30 °C−0.59 °C
1991−6.490.16 °C0.08 °C
Table 2. Climate model information of CMIP5 simulations used in this study.
Model NameEnsembleTime PeriodMain References
BCC-CSM1.1r1i1p1850–2000[22]
CCSM4 r1i1p1850–2005[23]
FGOALS-glr1i1p11000–1999[24]
FGOALS-s2r1i1p1850–2005[25]
GISS-E2-Rr1i1p121–128850–2005[26]
IPSL-CM5A-LRr1i1p1850–2005[27]
MIROC-ESMr1i1p1850–2005[28]
MPI-ESM-Pr1i1p1850–2005[29]
MRI-CGCM3r1i1p1850–2005[30]