Article

Seasonal Variations and Chemical Predictors of Oxidative Potential (OP) of Particulate Matter (PM), for Seven Urban French Sites

1
Université Grenoble Alpes, CNRS, IRD, INP, IGE, 38 000 Grenoble, France
2
Univ Savoie Mont-Blanc, LCME, F-73 000 Chambéry, France
3
ANSES, 14 rue Pierre et Marie Curie, 94701 Maisons-Alfort CEDEX, France
4
IFSTTAR, 69675 Bron, France
5
INERIS, Parc Technologique ALATA BP2, 60 550 Verneuil en Halatte, France
6
Laboratoire Central de Surveillance de la Qualité de l’Air (LCSQA), F-60550 Verneuil-en-Halatte, France
7
Atmo Nouvelle-Aquitaine, ZA Chemin Long, 13 allée James Watt, 33692 Mérignac, France
8
Atmo Auvergne Rhône-Alpes, 19 rue lac Saint André, Savoie Technolac, 73377 Le Bourget du Lac CEDEX, France
9
Atmo Sud, route de la Vierge, 13500 Martigues, France
*
Author to whom correspondence should be addressed.
Atmosphere 2019, 10(11), 698; https://doi.org/10.3390/atmos10110698
Submission received: 20 September 2019 / Revised: 16 October 2019 / Accepted: 25 October 2019 / Published: 12 November 2019
(This article belongs to the Special Issue Oxidative Potential of Atmospheric Aerosols)

Abstract

:
Epidemiological studies suggest that the main part of chronic effects from air pollution is likely to be linked with particulate matter (PM). Oxidative potential (OP) of PM is gaining strong interest as a promising health exposure metric. This study combined atmospheric detailed composition results obtained for seven different urban background environments over France to examine any possible common feature in OP seasonal variations obtained using two assays (acid ascorbic (AA) and dithiothreitol (DTT)) along a large set of samples ( N > 700 ). A remarkable homogeneity in annual cycles was observed with a higher OP activity in wintertime at all investigated sites. Univariate correlations were used to link the concentrations of some major chemical components of PM and their OP. Four PM components were identified as OP predictors: OC, EC, monosaccharides and Cu. These species are notably emitted by road transport and biomass burning, targeting main sources probably responsible for the measured OP activity. The results obtained confirm that the relationship between OP and atmospheric pollutants is assay- and location-dependent and, thus, the strong need for a standardized test, or set of tests, for further regulation purposes.

1. Introduction

Atmospheric pollution has been ranked as the fourth risk factor for premature mortality worldwide [1]. Epidemiological studies suggest that the largest part of chronic effects from air pollution can be linked to Particulate Matter (PM) [2,3,4] and its capacity to induce oxidative stress in vivo through the generation of excessive reactive oxygen species (ROS) and/or the inadequate antioxidant defences [5]. Cellular and acellular assays co-exist to assess endogenous and exogenous ROS from PM, and acellular assays are gaining a strong interest for their quick and non-invasive character. In this context, Oxidative Potential (OP) of PM, an acellular metric based on the ability of particles to elicit oxidative reactions, is considered as a promising health exposure evaluation, as OP integrates particle size, surface properties and chemical composition of the PM [5,6,7]. OP most probably is a more representative metric of health impacts than PM mass concentrations, better reflecting the processes leading to impacts in the human body [8]. Regarding acellular assays, some cross-over studies between health and OP have led to positive correlations with toxicological markers of airway inflammation [9,10,11,12] or with health outcomes [7,13,14,15,16,17,18]. Nevertheless, further studies are still needed to establish proper links between OP and predictive health outcomes. Better understanding the correlations between oxidative effects and chemical composition of PM—and, further, their emission sources—is essential to possibly develop future regulations using OP.
The OP links with health outcomes and with specific chemical species and their emission sources may be the limiting steps to use OP acellular assays as a well-established metric, efficient in epidemiological studies and included in air quality measurements. Further, different OP methodologies co-exist, each of them displaying specific and assay-dependent associations with atmospheric pollutants. Thus far, no consensus has emerged towards a standard test or set of tests [7,19,20,21].
The widely used acellular DTT (dithiothreitol) assay is reported to be associated with some oxygenated Polycyclic Aromatic Hydrocarbons (PAHs) and notably quinones (1,4 naphtoquinone, 9,10 anthraquinone), transition metals (mainly Cu and Mn), Humic-LIke Substances (HuLiS), and/or secondary organic aerosols (SOA) [22,23,24,25,26,27]. The acellular AA (Ascorbic Acid) assay is known to be correlated with elemental carbon (EC), organic carbon (OC), and many transition metals (Fe, Cu, Cr, Mn, Co, and Ni) [11,20,28,29,30]. The acellular DCFH (dichlorofluorescein) assay is known to be sensitive to organic compounds such as OC, PAHs [31], and also some metals or their oxides [6,31]. However, we must be aware that these correlations and linear analyses are not necessary exhibiting the proper causality between Reactive Oxygen Species (ROS) generation and active species from PM. In fact, some species display non-linear ROS generation [24,32] and many PM chemical species are co-emitted by different emissions sources inducing covariations and dependent variables. As an example, strong correlation is observed between PAHs and DTT depletion. However, PAHs are not redox-active and cannot oxidize the DTT, a reducing agent, but they are precursors of and/or co-emitted with redox active quinones [33,34,35].
OP determining factors have been settled by measuring the OP from reference compounds [24] or from ambient air samples from single sites or during time-limited field campaigns [17,36,37]. Larger time series and regional scale studies are needed to further connect oxidative potential to atmospheric pollutants.
The literature is still scarce about the comparison of different acellular OP measurements across cities [37,38]. Few studies have investigated several assays in the same cities over long time periods (>6 months) to better understand the OP seasonality and the links with PM chemical composition and emission sources [16,28,29]. Finally, there are also few studies relating the oxidative capacity of particulate pollution with a very detailed PM chemical characterization (>100 contaminants) [39].
This paper reports the seasonal OP variations, over a one-year period, obtained from two acellular assays (DTT and AA), and their correlations with PM chemical composition, for seven French urban background sites. Acellular OP measurements were performed using identical protocols on the large set of samples ( N = 727 for DTT and N = 712 for AA assay). From 39 to 131 chemical species were analyzed for each PM sample. The objectives of this study were first to compare the seasonal evolutions of OP measurements for the different sampling sites and to identify the main PM chemical species—or predictors—that influence OP levels for the seven sites affected by different emission sources.

2. Experiments

2.1. Samplings

Filter samplings were achieved within different research programs, all conducted for the understanding of the diversity of the PM10 chemistry in several areas of France, and gathered within the SOURCES [40] or DECOMBIO research projects [41]. For each site, about 100 samples, covering a one-year period, were chosen for OP assays along with chemical analyses. Locations of the sites are shown in Figure 1 and sampling details are reported in Table 1. All seven investigated sites are representative of urban background air quality. Among them, four sites are located in the Alps: Marnaz, Passy, Chamonix and Grenoble. The first three correspond to small cities (about 10,000 inhabitants) located in the Arve valley at elevated altitude (>500 m above sea level, m.a.s.l.) while Grenoble is more populated (150,000 inhabitants within a total of 680,000 inhabitants for the whole urban area) at about 200 m.a.s.l, standing as the gateway of the Alps. Note that these four sites are known to be strongly impacted by biomass burning emissions from residential heating in winter. In addition, adverse meteorological situations with low inversion layers in these mountainous areas are usually observed during winter [41,42,43,44,45]. Specific emission sources may influence each sampling sites; Chamonix and Passy are notably impacted by road traffic emissions, and industrial activities (transformation of carbonaceous materials and a waste incinerator) are located in the Passy area. Two other sites—Talence, included in the Bordeaux area and close to the Atlantic Ocean, and Nice, close to the Mediterranean Sea—are located in relatively large urban areas (1,200,000 inhabitants for the Bordeaux area, and 350,000 inhabitants in Nice). Finally, the site at Port-de-Bouc (PdB) is also located near the Mediterranean Sea and corresponds to a suburban site surrounded by industrial activities such as petrochemical activities (in Martigues, 6 distance), steel, refinery and cement industries (in Fos-sur-Mer, 5 distance) [46].
PM10 filter samples were collected every third day (24 h sampling) using high-volume samplers (Digitel DA-80; 30 m 3 h 1 ) loaded with quartz fibre filters (Pallflex Tissuquartz 150 mm).
Filters were pre-treated at 500 C for 8 h to remove any organic contamination. Then, they were packed 5 by 5 into aluminium foil and then placed into Ziplock bags for transportation to the sampling site. After collection, they were downloaded from the filter holder, folded in half with the exposed surface inward inside a new aluminium foil, and individually put into a new Ziplock with their identification tags. About 10% of field blanks were collected in parallel to ambient air samples. All were kept at low temperature ( 4 C or below) from the sampling site until analysis. This procedure has been applied in our lab for the past 15 years and about 10,000 samples. PM10 mass measurements were achieved at the sampling site using automated systems TEOM-FDMS (tapered element oscillating microbalance equipped with filter dynamics measurement system, Thermo) or beta gauges (MP101-RST or BAM 1020, manufactured by Environnement SA and MetOne, respectively) as part of the regulatory measurements maintained by the French air quality networks. The mass concentration of PM10 on the filters was further reconstructed following chemical speciation analysis and compared to TEOM-FDMS measurements.

2.2. Chemical Composition of PM10

The PM chemical characterization was performed in the same way for all samples with few exceptions listed in Table 2.
Organic and elemental carbon (OC and EC) were analyzed using a Sunset Lab. Instrument (Model 150C) following the EUSAAR2 protocol with a punch of 1.5 cm 2 [47]. Soluble anions and cations (NO3, SO42−, Cl and NH4+, Mg2+, Na+, Ca2+, K+) were quantified by ionic chromatography [48]. Briefly, samples were soaked for 1 h in 10 m of Milli-Q water with orbital shaking, and then filtered using 0.22 μ m -porosity Acrodisc filters before analysis. AS/AG 17 and CS/CG 12A columns were used for anions and cations analyses, respectively. All inorganic elements, including trace metals (Al, Fe, Ti, As, Ba Cd, Ce, Cr, Cu, La, Li, Mn, Mo, Ni, Pb, Rb, Sb, Sn, Sr, V, Zn, and Zr), were obtained by ICP-MS analysis [48]. Prior to ICP-MS analyses, each sub-sample was acid digested (HNO3; HF; H2O2) with a microwave oven (Milestone ETHOS). Repeated measurements were performed on acid blanks, quality control standard solutions and standard reference material (SRM 1648a, urban particles). Sugar alcohols (arabitol, sorbitol, and mannitol, also called polyols) and anhydrous monosaccharides (levoglucosan, mannosan and galactosan) were quantified with an HPLC-PAD method [49]. For this analysis, extraction of filter samples was performed using ultra pure water under mechanical agitation for a period of 30 , the extract being filtrated with 0.22 μ m Nuclepore filters before injection [50]. Finally, polar and nonpolar organic species were extracted using an accelerated solvent extractor (ASE 200, Dionex), with two solvent mixtures (Acetone/dichloromethane 50:50 v/v and dichloromethane/methanol 90:10 v/v). After reducing the extract to a volume of 1 m under a gentle N2 stream, 30 alkanes, 10 hopanes, 15 substituted (methyl-PAHs) and 7 sulfur PAHs (PASHs) were analyzed by GC-MS, while 16 PAHs were quantified by HPLC-fluorescence. Fourteen methoxyphenols were analyzed by GC-MS after derivatization step with BSTFA-TMCS (99:1). The extraction and analytical methods were validated by quantifying the concentrations of several organic compounds (PAHs, PASHs and hopanes) in certified standard material (SRM 1649b) [51].
In total, 8–10 field blank samples by location were also analyzed with the same techniques to determine the detection limits (DL) of the methods. The average blank values were subtracted from the values from the real samples to get atmospheric concentrations.

2.3. OP Measurements of PM10

All PM samples were submitted to the DTT and AA assays to assess their oxidative potential (Table 1). Prior to OP measurements, PM samples were extracted (vortexed) using a simulated lining fluid (Gamble solution with a surfactant) at 37 C in order to mimic lung bio-accessibility [24]. The extraction was performed at iso-concentration of 10 μ g m L 1 for all samples, in order to minimize the potential non-linear response of the DTT assay [52] and to get comparable conditions for every sites.
The methodology used for the DTT assay has been described into details previously [24]. Briefly, DTT depletion, when in contact with PM extracts, was determined by titrating the remaining amount of DTT with DTNB (dithionitrobenzoic acid) at different reaction times at 412 and with a 96-well plate spectrophotometer (Tecan, M200 and M1000). The AA assay is a simplified version of the synthetic respiratory tract lining fluid (RTFL) assay described by Kelly and Mudway [53] where only AA is used. AA depletion was read every 5 min for 30 min at 265 using UV-transparent 96-well plates. For both assays, the 96-well plate is auto shaken for 3 s before each measurement and kept at 37 C for the period of reaction. The results were normalized per cubic meter of air sampled since this metric is representative of human exposure. OP v DTT corresponds to the consumption of DTT ( nmol min 1 m 3 of air) and OP v AA corresponds to the consumption of AA ( nmol min 1 m 3 of air). Considering the large amount of data, unlikely to be presented in a limited number of illustrations, we made them accessible at https://pmall.univ-grenoble-alpes.fr/OP/.

2.4. Quality of the Data

Repeated measurements were performed on acid blanks (trace metal elements), water blanks (ions, sugars, and polyols), simulated lining fluid blanks (OP), solvents blanks (PAHs, PASHs, methoxyphenols, alkanes, and hopanes), quality control standard solutions and standard reference material (NIST SRM 1648b, urban dust). In total, 16 field blank samples and 16 laboratory blanks were also analyzed with the same techniques in order to determine the detection limits (DL) of the methods (OP measurements or chemical analysis). The average blank values were subtracted from the samples before calculation of atmospheric concentrations or OP levels (blank values and standard deviation of OP AA 0.06 ± 0.01 nmol min 1 and OP DTT 0.037 ± 0.005 nmol min 1 ).

2.5. Data Treatment Procedures

Two seasonal periods were considered in this study: a warm period from April to September, and a cold period from October to March. Statistical analyses were performed using the software of Statistics R 3.4.0. Since the distribution of the data was non-normal, the non-parametric Mann–Whitney test was used to test the significance of the differences observed between sites or between seasonal periods in the OP, PM10, and chemical species concentrations. The non-parametric Spearman correlation (rs), based on the rank and not dependent on data distribution, was chosen for the regression analyses. Finally, the threshold of the p-value was set at 5% (p-value 0.05) for the statistical tests.

3. Results

3.1. OP and PM10 Annual Average Concentrations

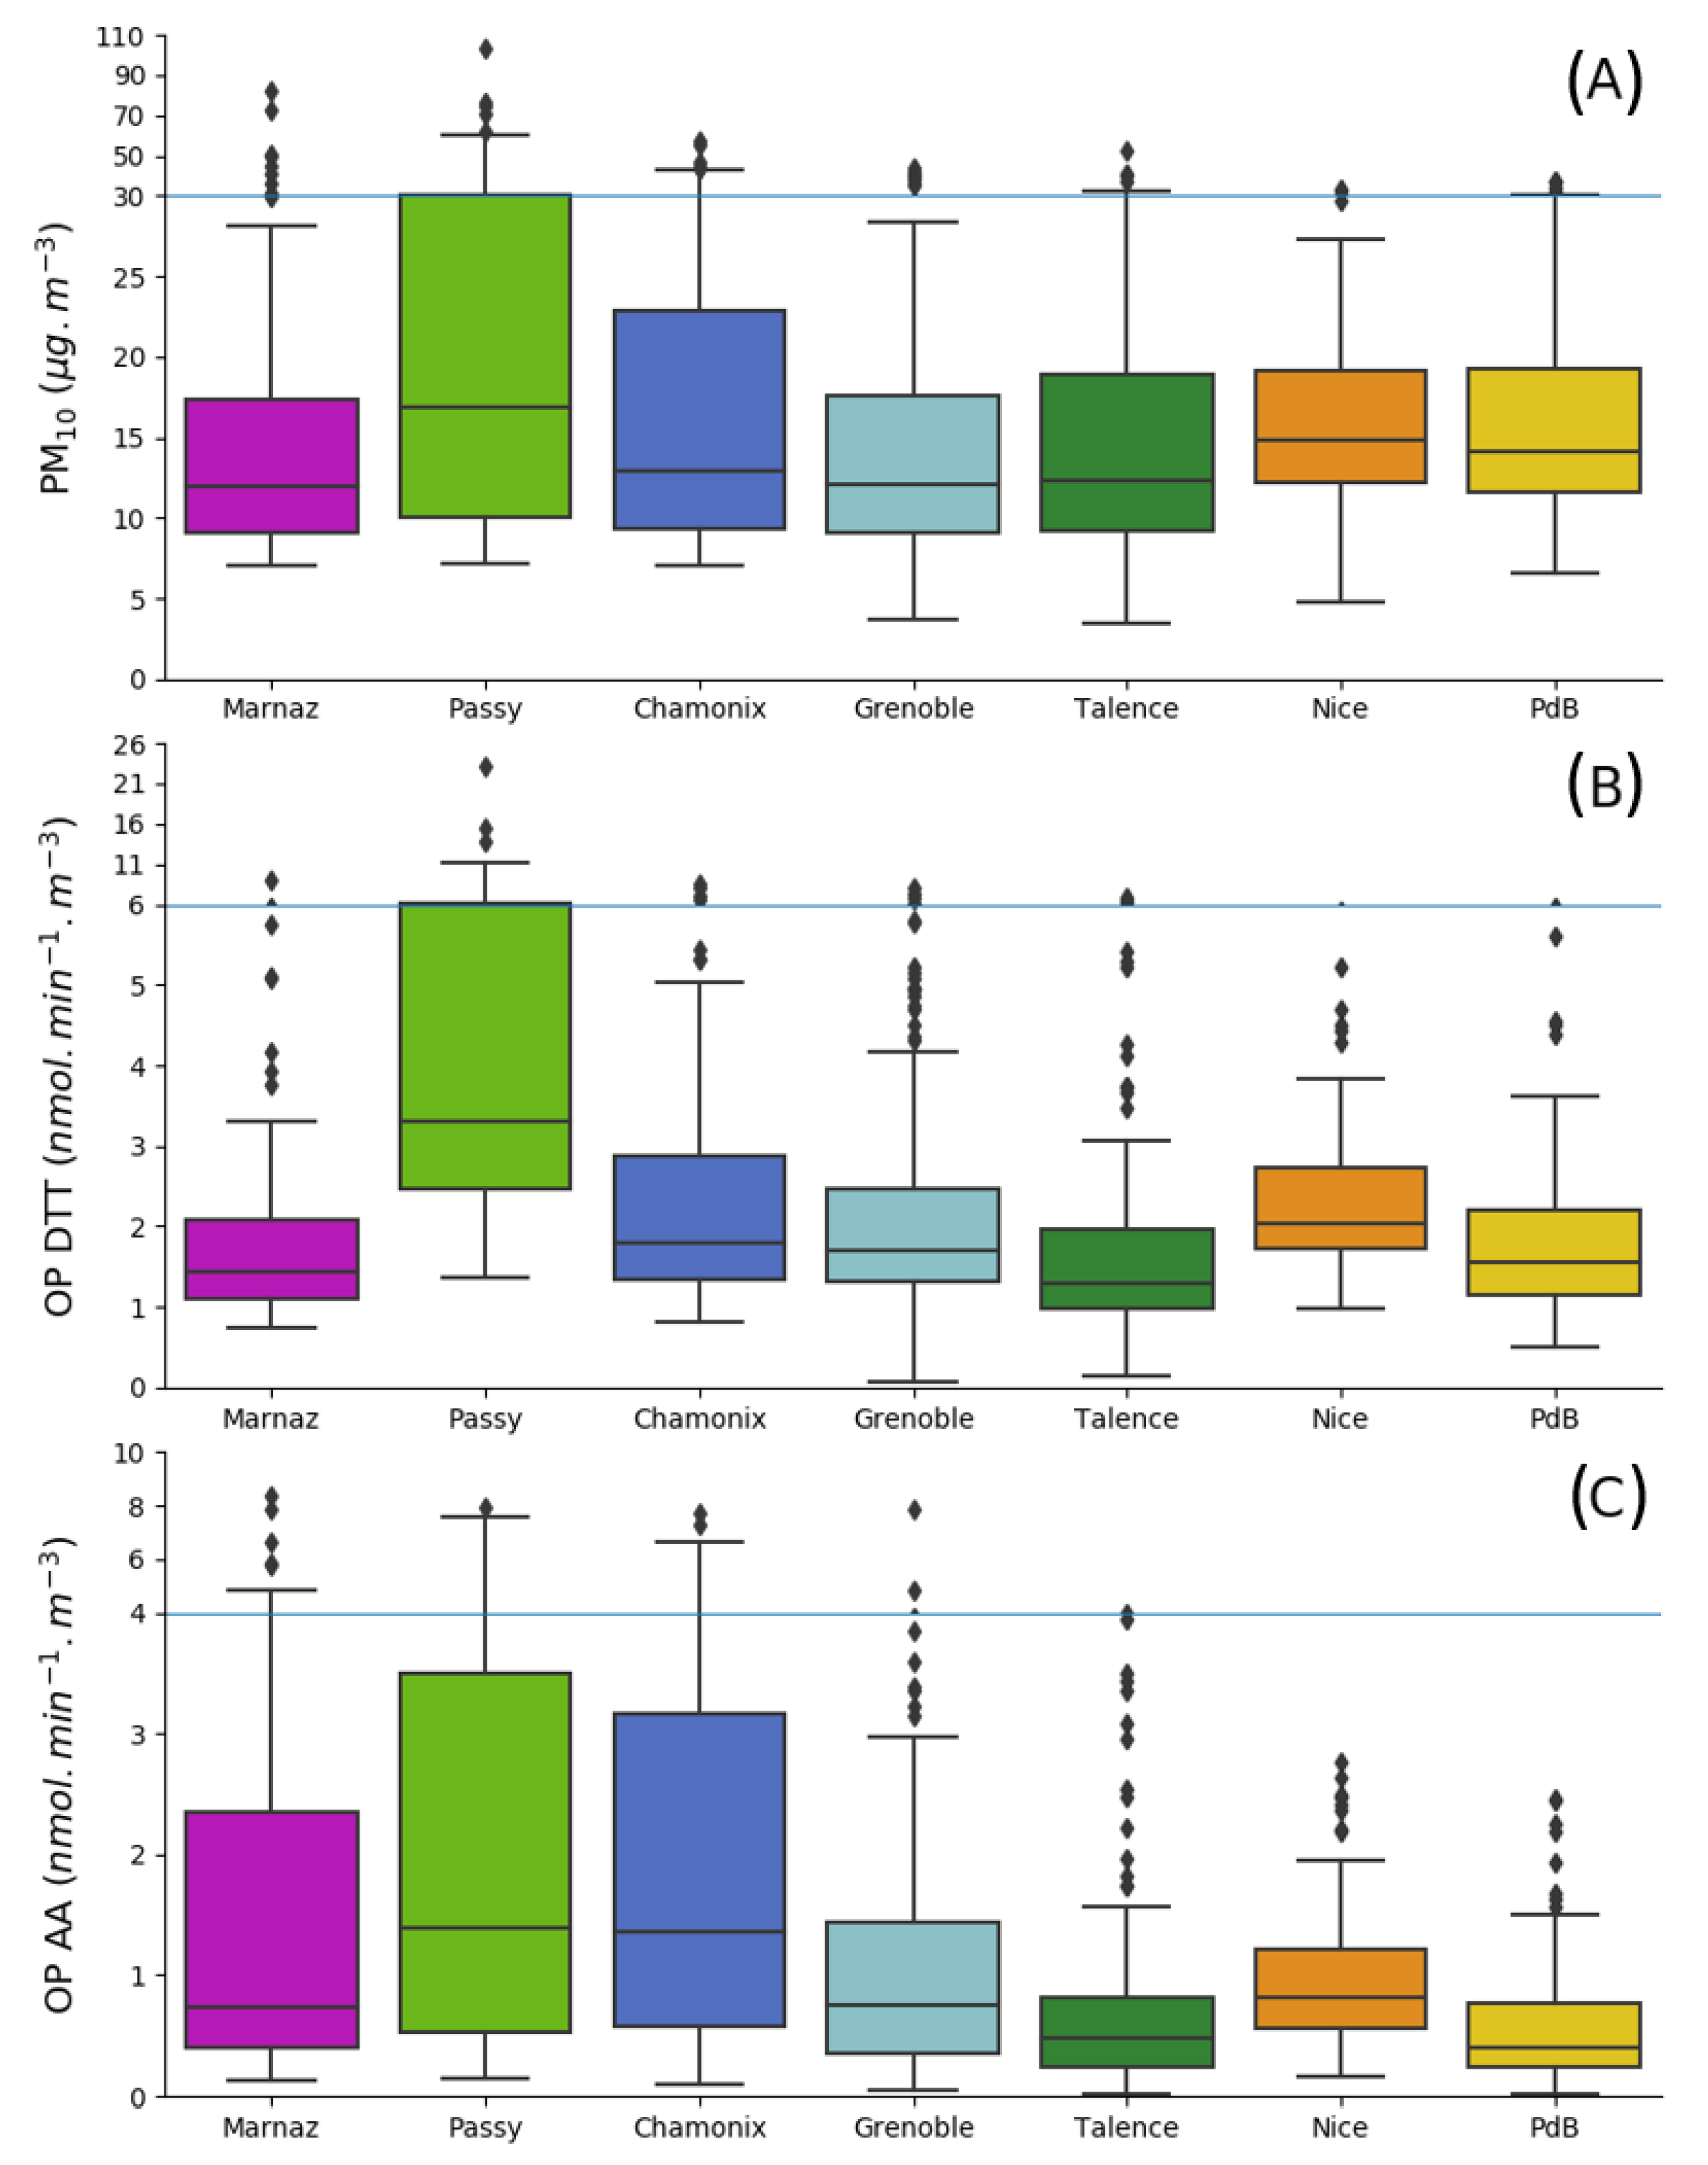
Overall, nearly all urban background French sites investigated present similar annual PM10 mean concentrations despite different climate and meteorological conditions (about 17 ± 3 μ g m 3 , see Figure 2). The annual OP v DTT mean of Passy and Nice present values significantly higher than that the ones observed for other sites. Among the three metrics (PM10 mass, OP v DTT , and OP v AA , Figure 2), OP v AA gives the largest discrimination between the sites, providing the highest amplitude of values (ratio cold/warm season ranges between 1.5 (Nice) and 6.6 in (Marnaz), in Table 3). In addition, annual OP v AA is significantly higher for Passy, Chamonix and Nice than for any other sites. Finally, we can assume that PM mass and OPv may be rather consistent across the French territory (at least for the southern part) on annual average, except for the Alpine sites.

3.2. OP and PM Seasonality

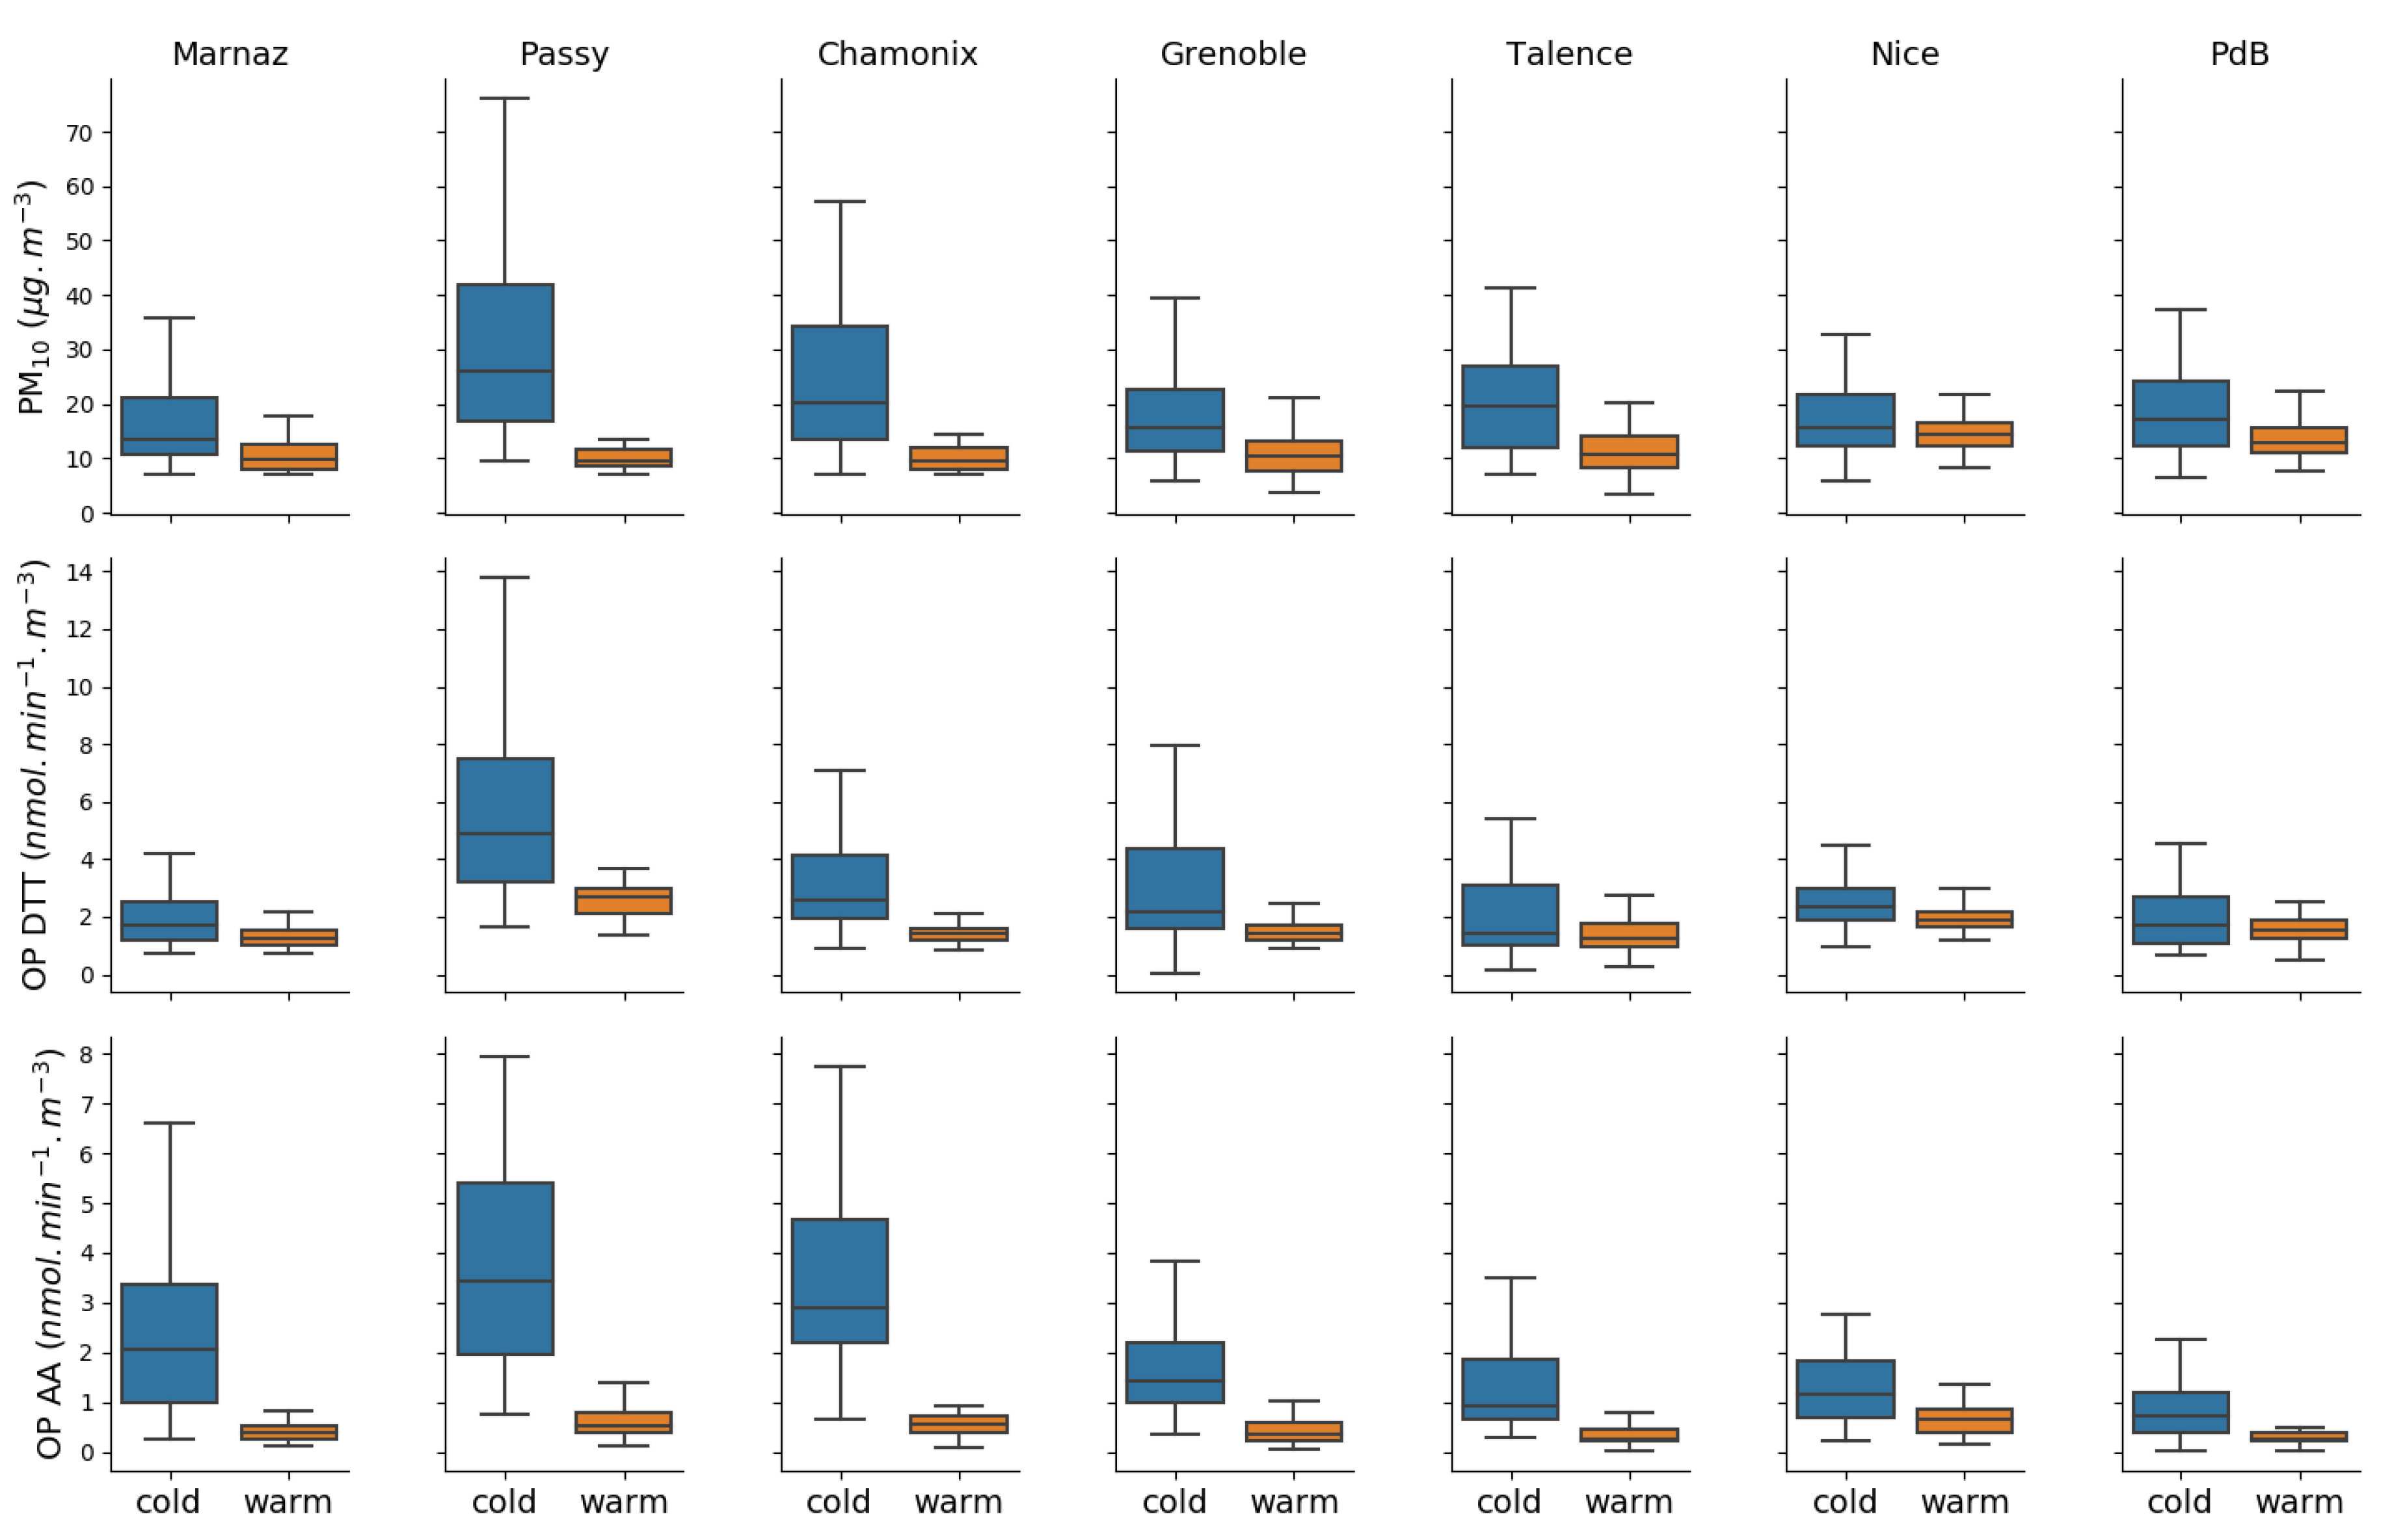
Temporal trends (daily and monthly means) for OPv are available at https://pmall.univ-grenoble-alpes.fr/OP/. Overall, higher PM10 concentrations and OPv levels are observed during the cold period for all sites and this amplitude varies across the sites (Figure 3, PMall database). PM10 and OPv levels are more variable during cold than warm periods, probably influenced by the atmospheric PM concentrations remaining relatively low and stable during warmer period (Figure 3, Supplementary Materials Figure S1 and S2). The ratios of the average values between cold and warm periods (Table 3) allow classifying such metrics: the OP v DTT ratio values are slightly lower than the PM10 concentration ratios (except for Grenoble, Nice and Talence) and are lower than OP v AA ratio values. OP AA assay results present the highest amplitude between cold and warm periods (up to 6). Such seasonal variations highlight the importance of the different information brought by PM10 and OP metrics.
Alpine sites (Grenoble, Passy, Marnaz and Chamonix) display the strongest seasonality for both PM10 and OPv. They exhibit the same range of ratios whatever the metric considered, which are significantly different from ratio values obtained for sites located closer to the sea coast (Nice and Port-de-Bouc). Similar climate or PM emission sources may account for OP annual means. For Talence, Nice and Port-de-Bouc ratios remain equal or under 3 for both PM10 and OPv. One hypothesis could be that the latter sites (Nice and Port-de-Bouc) have mild winters and do not experience strong impact of wood heating source during winter.
OPv seasonality has been highlighted by other studies but contrasted results had been observed among locations. Based on one-year sampling period, Abrams et al. [18] also found a significant increase of OP v DTT activity during the cold season (November to January) in Atlanta. Similar trends have been reported in Thessaloniki (Greece) [54,55]. However, few studies displayed opposite trends with OP v DTT higher activity in summer such as in Fresno (California, USA, urban site) [23] or Milan (Italy, traffic site) [31]. Here, OP v AA exhibits seasonal variations that contrast with the available literature. Fang et al. [14] displayed an average ratio of summer to winter of 2.2 ± 0.9 for two urban sites in the south-eastern USA. Moreover, no significant seasonal variability in the activity for OP v AA was found in PM2.5 in Budapest (Hungary) [29]—whereas OP AA normalized by μ g presented a strong increase in summertime. However, OP v AA seasonal variations studies are still very scarce ( OP v DTT temporal trends are more documented) and more studies are needed to compare and conclude about the seasonal trends for this OP assay. Nevertheless, OP v AA and OP v DTT do not stand alone among OP assays and some studies using other OP methodologies are also looking for seasonal trends. As an example, electron spin resonance can be used to quantify the radical hydroxyl OH, while OPGSH is another assay relying on the physiological glutathione anti-oxidant. In a previous study performed with samples from 20 European cities, coefficients of temporal variance for OH formation (0.26) showed less temporal variability within the six bimonthly measurements than did PM2.5 mass (0.33), and GSH was more variable (0.71) [56,57]. Such trends were also observed in our study for the same relative assays (PM10 instead of PM2.5) for the urban background environment of the city of Chamonix where OH formation (OPESR) did not display any seasonal pattern [28]. A one-year study in Tartu (Estonia) also led to different seasonal pattern between OH formation and PM2.5 mass concentrations [58]. Conversely to our study, oxidative potential represented by OH formation exhibited relatively higher values in summer than winter in an urban background environment.
Overall, high OPv levels during cold period in European cities can be attributed to the common increase in PM concentrations due to additional emission sources and lower mixing rate in the cold period. Biomass burning contributes up to 70% of the PM mass in winter in alpine valleys [42,43,59] and is also likely to induce higher OP level through the chemical composition of the primary emissions and the biomass emissions ageing processes. Indeed, primary biomass emissions emit large quantity of PAHs that will lead to the formation of oxy-PAHs (and notably quinones) and nitro-PAHs, through homogeneous and heterogeneous oxidation reactions in the atmosphere [44,60,61,62], which are redox active species and of importance in oxidative potential contribution [22,24,63]. The cold period in Europe currently displays an increase for EC contents from traffic and biomass burning sources [64,65] both also direct emitters of PAH and PAH derivatives [35,65,66,67]. On the other hand, lower OP values during warmer period could be assigned to lower PM concentrations and the potential loss of volatile and semi-volatile organic compounds due to their evaporation with warmer temperatures and/or degradation by heterogeneous photochemical processes and/or different emission sources (no residential heating in summer). Alternatively, Fang et al. [14] explained their higher results for OP v AA in summer by higher traffic emission at their site, traffic being a significant source for OP v AA . Finally, these discrepancies towards seasonal OP trends may also be assigned to differences in site typologies or experimental design. For example, Fang et al. [14] analyzed an extract from PM containing only water-soluble species whereas we considered total PM containing both insoluble and soluble species. All these assumptions could lead to the very different seasonal variations observed in OPv. However, in this study, over the seven studied sites, whatever the climate or geography and the OP assay, a remarkable homogeneity in OP seasonal trends is observed for urban background sites.

3.3. OP and PM10 Associations

Spearman correlations (rs) for all sites, among OP v DTT , OP v AA and PM10 for the full year, cold and warm periods are reported in Table S1 and Table 4, respectively.
Whatever the OPv methodology (AA or DTT assays), OPv and PM10 are always significantly correlated. However, the strength of the rs coefficient varies strongly according to the season and the city showing moderate relationships during the warm season and lower relationship for Mediterranean and Atlantic cities than for Alpine cities, preventing from any generalization. Over the sampling year, higher correlations are obtained between OP v DTT and PM10 with spearman values ranging 0.69 < rs < 0.87. Both OP assays are also significantly correlated for all sites, confirming similar seasonal trends. When comparing cold and warm periods, higher rs between OPv and PM10 and inter-OP relations are found for the cold period. This observation is valid for all sites, and for both assays except for Talence, which presents better correlation between PM10 and OP v DTT (0.77 vs. 0.60) during the warm period. Results observed for Talence might be due to a lack of observations for January and February period (cf. Figure S3 and Figure 4). Finally, with regards to rs values, OP v DTT is more associated to PM10 concentrations than OP v AA . Such observation was also reported in the city of Atlanta [14] and in the Netherlands [20]. The state of the art assigns PM concentration as a significant predictor of OP v DTT in univariate models whereas OP v AA is known to be more sensitive to some PM chemicals species [14]. However, correlations with chemical species is to be considered with caution (since correlation does not mean causation) given the significant covariations of many chemical species (including chemical species not analyzed) induced by emission sources. Nevertheless, it is still very useful to point out through emission tracers the main sources contributing to overall oxidative potential of PM. Interestingly, a seasonal evolution of the correlations between OPv values and PM10 concentrations is observed, highlighting the importance of considering the whole sampling year to exhibit robust correlations for one site, since they are season-dependent.

3.4. Correlations between OP and PM Chemistry

3.4.1. Contrasts between Sites

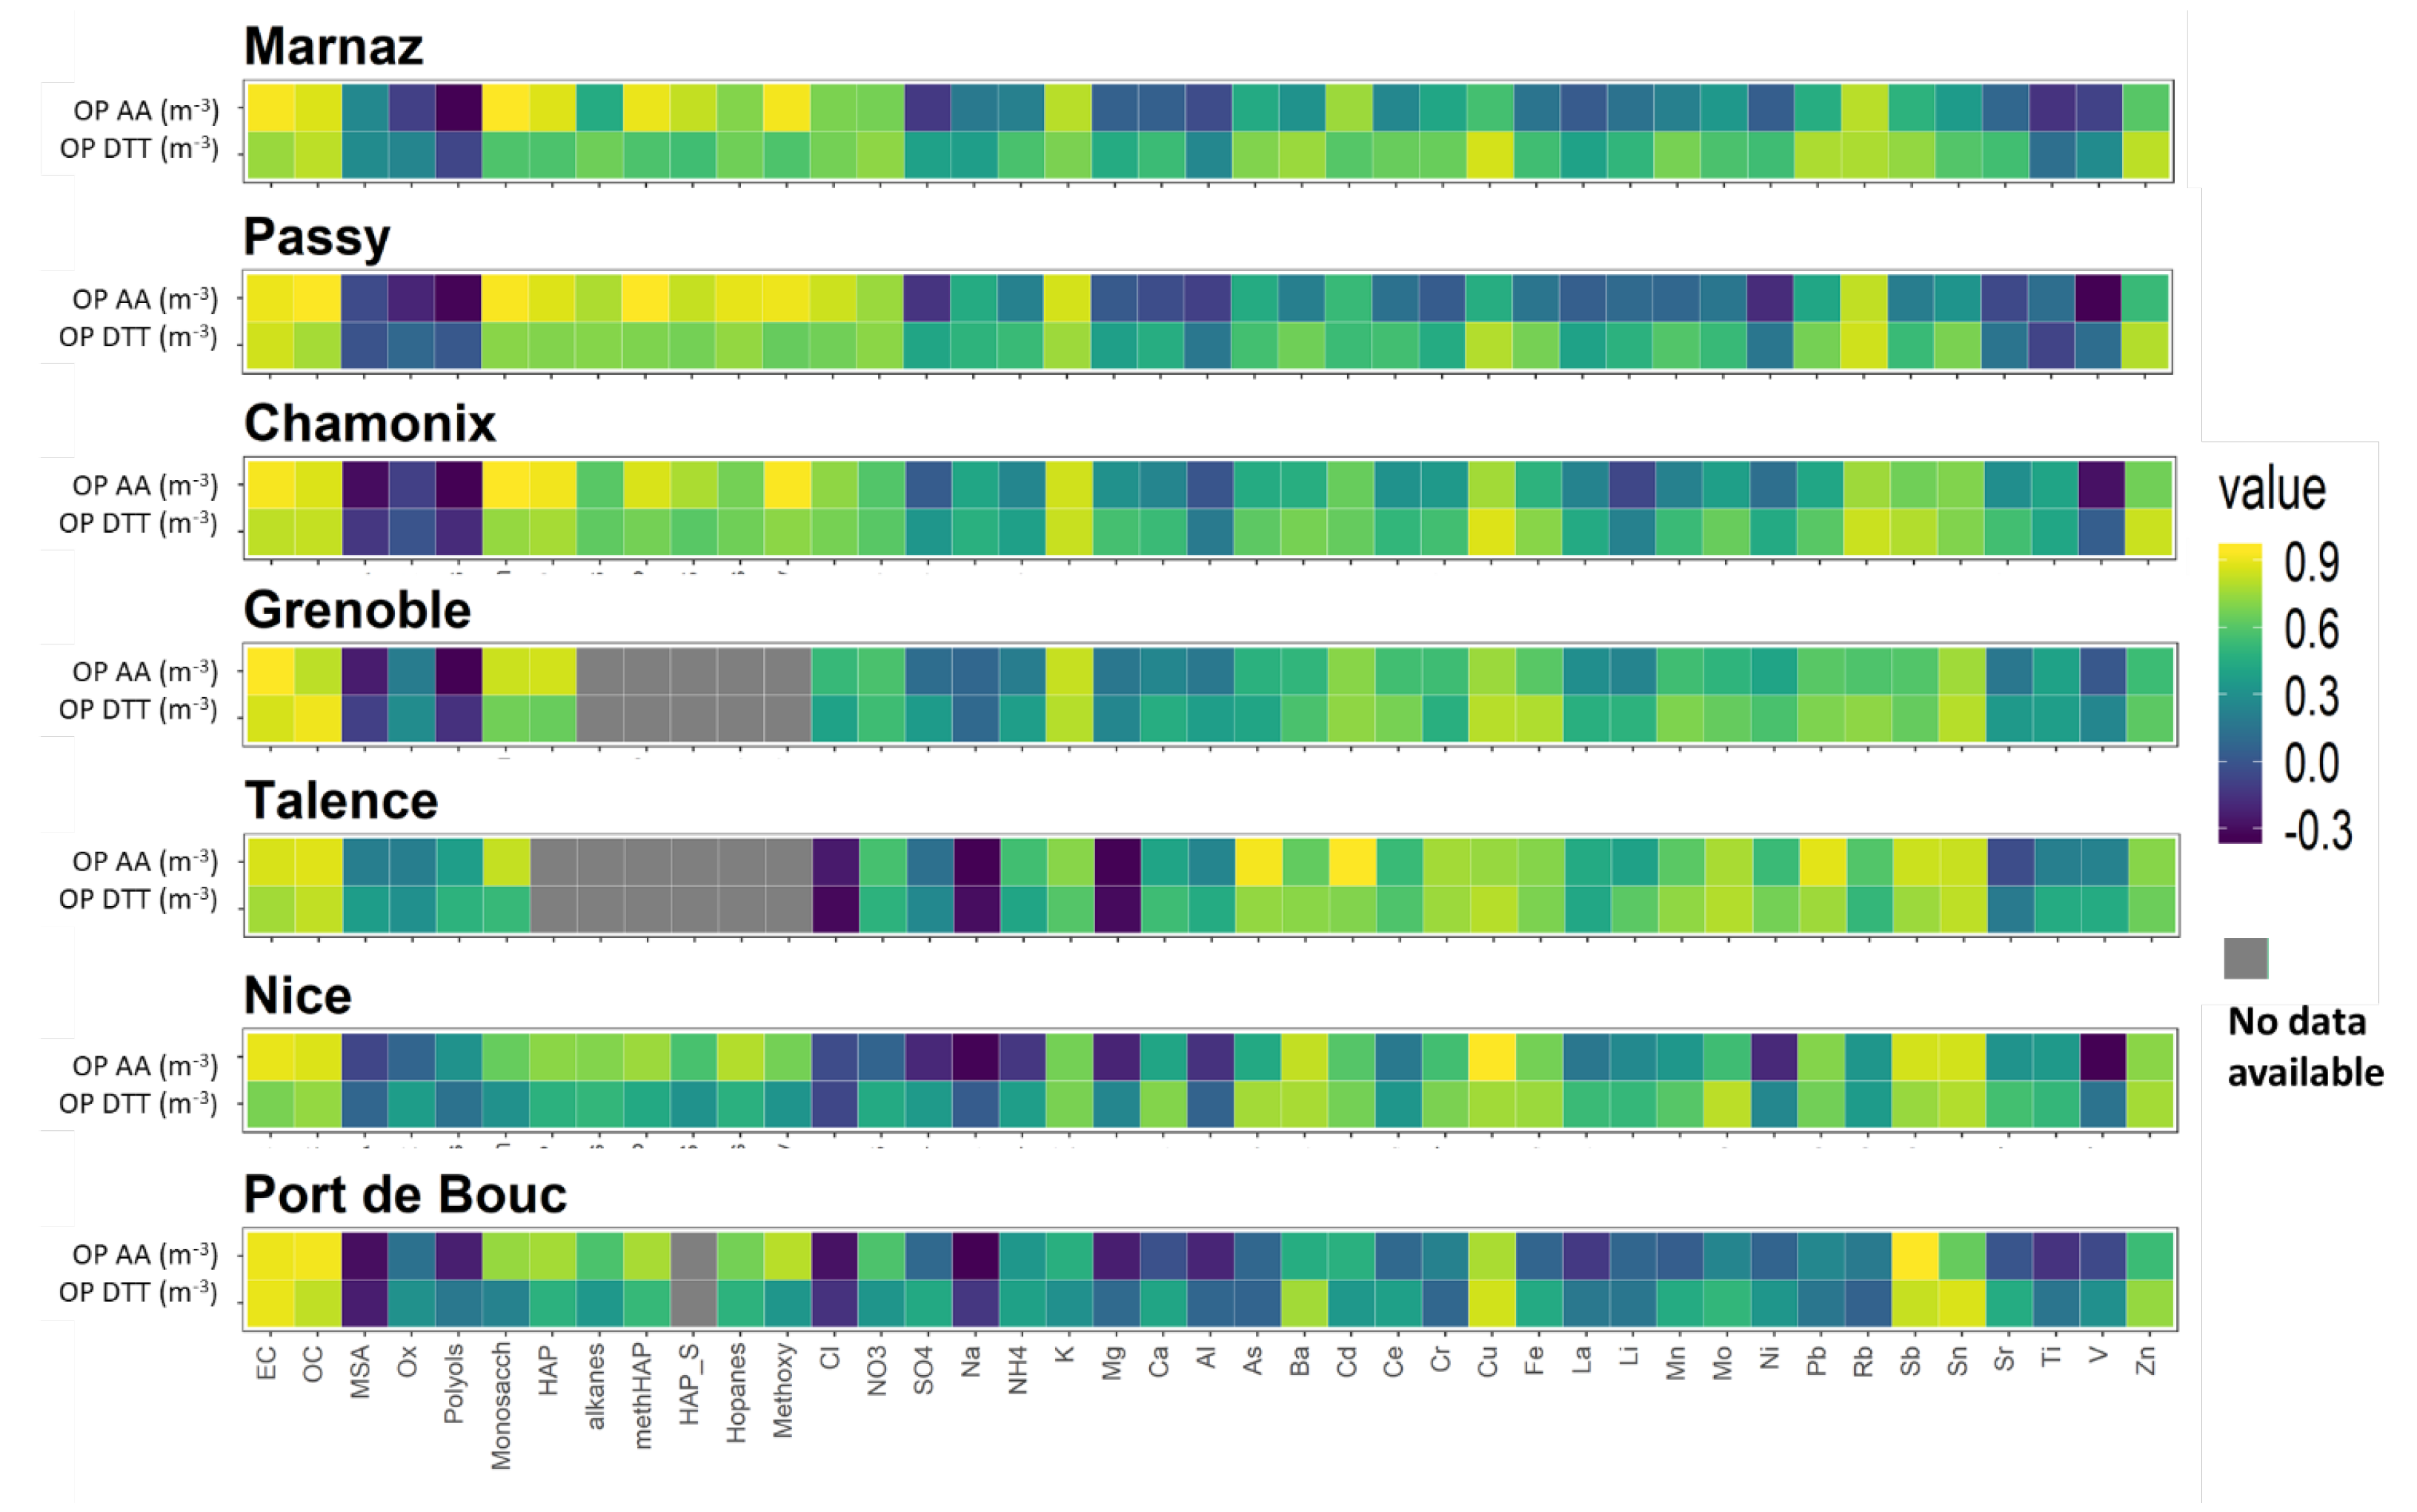
Figure 4 shows the rs values obtained between the chemical species and OPv and PM10 merging all sites datasets (detailed rs coefficients are shown in Table S1, as well as for warm and cold periods in Tables S2 and S3, respectively).
OPv and PM10 display some similar strong associations towards chemical compounds. However, they are not systematic and this underlies the difference between both metrics.
Ionic species are poorly correlated with OPv, whereas organics and metals show stronger correlations, with a few exceptions. In addition, OC and EC are highly correlated with both OPv measurements for all sites (rs > 0.70). Interestingly, stronger correlations are observed during the cold period. Finally, for both periods (cold and warm), the significant correlations with the chemical species are more pronounced for OP v DTT than for OP v AA , with a few exceptions as Talence (Table S3 and Figure 4). These observations are in good agreement with previous studies [14,39].
Correlation coefficients between chemical species and OPv may be specific according to the environment (Alpine, Oceanic, and Mediterranean) (Table S1). Some biomass burning key species, such as potassium or rubidium, show higher rs with both OP assays for Alpine sites (Marnaz, Passy, Chamonix, and Grenoble) than for temperate climate sites (Talence and Nice where rs values are usually low or not-significant). In Passy, several organic species strongly correlate with both OP assays namely, anhydrous monosaccharides, alkanes, hopanes, PAHs, PASHs and methyl-HAPs, which are typically emitted by biomass burning, vehicular and/or industrial emission [68,69].
Sb, Sn and Zn show site-dependent correlations concerning the OP v DTT . These correlations are strong and significant for all sites and range from 0.50 (Marnaz) to 0.77 (Grenoble) for Sn, 0.53 (Passy) to 0.79 (Chamonix) for Sb and 0.54 (Talence) to 0.84 (Chamonix) for Zn. Nice, PdB, Talence, Grenoble and Chamonix display strong correlations along the whole year between both OP assays and Ba, Sb, and Sn. Previous trace elements are good proxy for non-exhaust emissions from traffic [70], and Zn can be used as a traffic marker [71] as well as a marker for industrial activities—waste incineration and coal combustion [72]. Overall, OP v DTT could be more specific to traffic source than OP v AA .
Interestingly, Cl and NO3, which are not redox-active, are associated to OPv along the year and during the cold period in the Arve Valley (Marnaz, Passy, Chamonix, with rs > 0.59). In mountainous areas, the correlation with Cl could originate from road salting during wintertime [73]. Salt resuspension may highly contribute to the PM mass, and it may only reflect the overall strong association between OPv and PM10 in Arve Valley (Table 4). The association with NO3, is much more surprising. Given that ammonium nitrate and ammonium sulphate do not exhibit any sensitivity towards both AA and DTT assays [28,74], this relation could be due to the redox organic pollutants (nitro-PAHs for instance) which can probably secondary be formed at the same time as NO3 [44].
The number of strong correlations for OPv and PM10 chemical species is lower during the warm (Table S3) than during the cold period (Table S2) for all sites. The remaining associations in the warmer period, rely more to the DTT than the AA assay. The site of Port-de-Bouc (PdB) displays the lowest number of associations between OPv and chemical species. For Talence, associations between PM10 composition and OPv are greater with the DTT assay during the warm period and the AA assay during the cold period. These differences show that the modulations of OPv levels are not only due to the variability of a few chemical species. OPv predictors are very likely variable depending on the emission sources—varying from sites and considered seasons.

3.4.2. OP Predictors

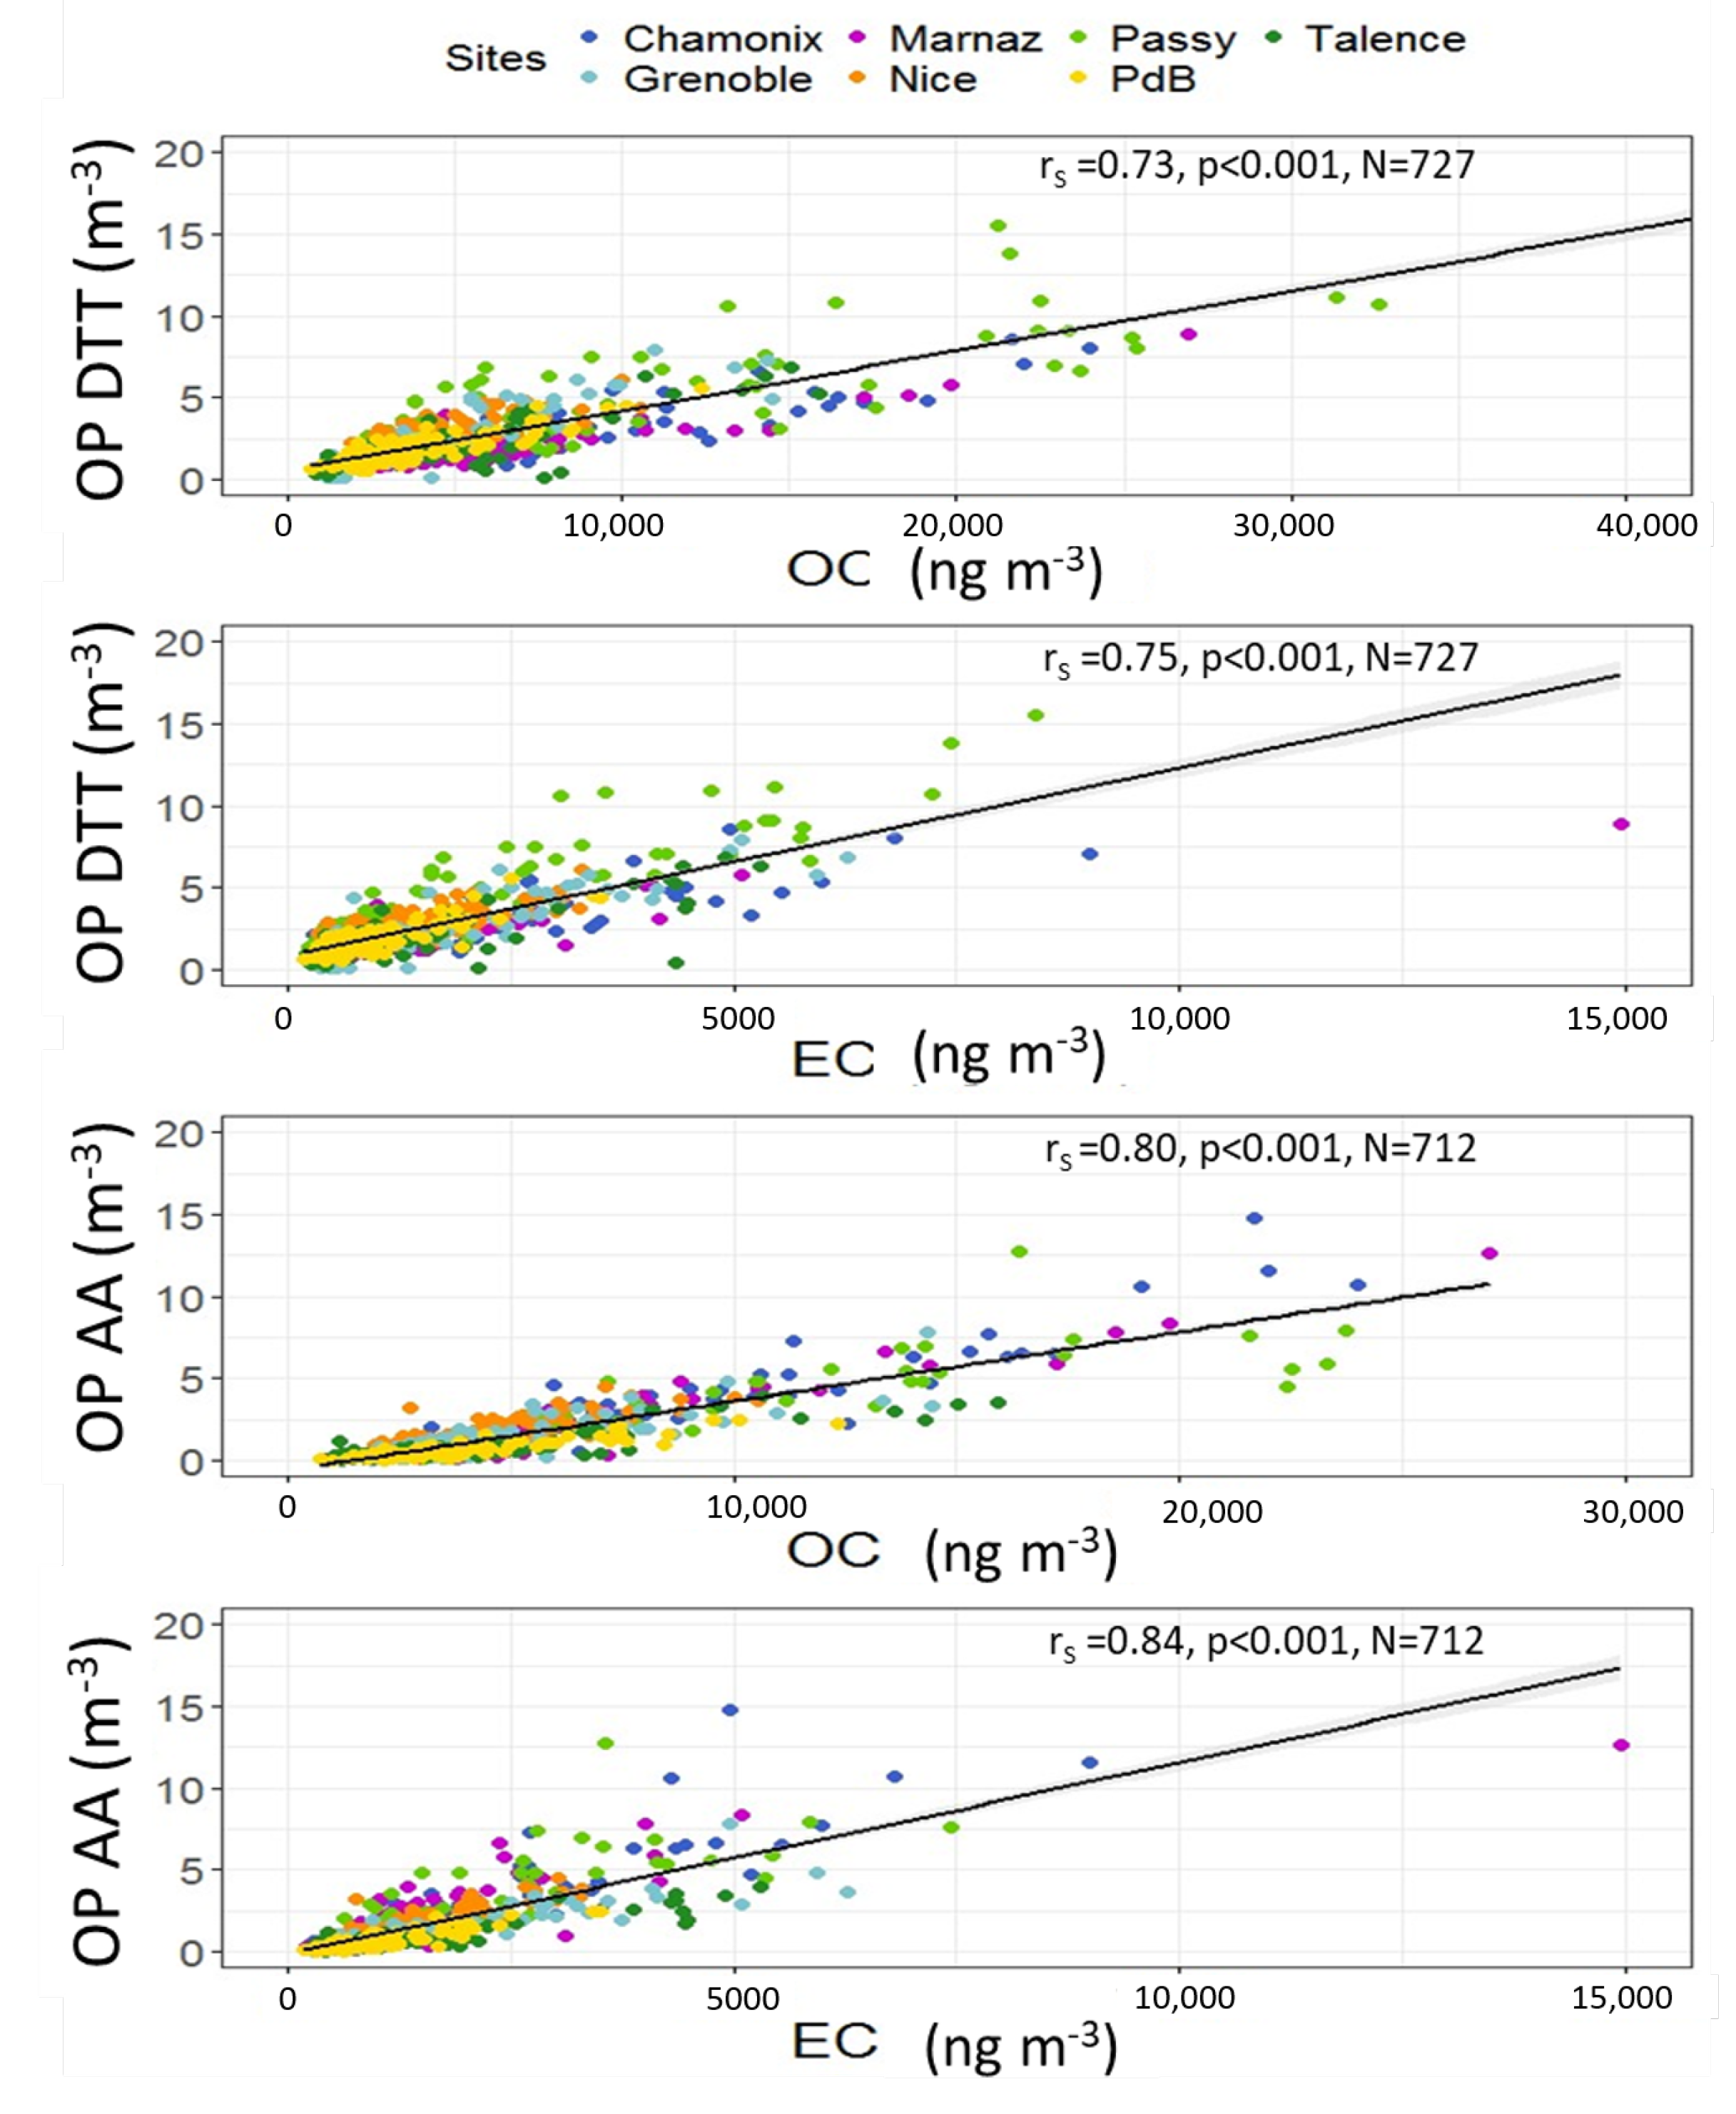
As EC and OC are strongly correlated with both OP assays and for all the sites; these chemical species seem good predictors to explain OPv values among the urban background sites investigated here (Figure 5). These results are also in agreement with the literature reported about the relation between the carbonaceous species and oxidative potential [7,34,75]. However, OP v AA usually shows lower correlations with OC than EC [20,29,30,76,77]. EC and OC show pro-inflammatory effects in toxicological studies [21,78,79], highlighting the importance of such OP predictors even if several toxicological studies suggest that these effects are probably rather due to reactive compounds (metals, quinones, etc.) associated to carbonaceous particulate matter than from an intrinsic toxicity [8,79,80,81].
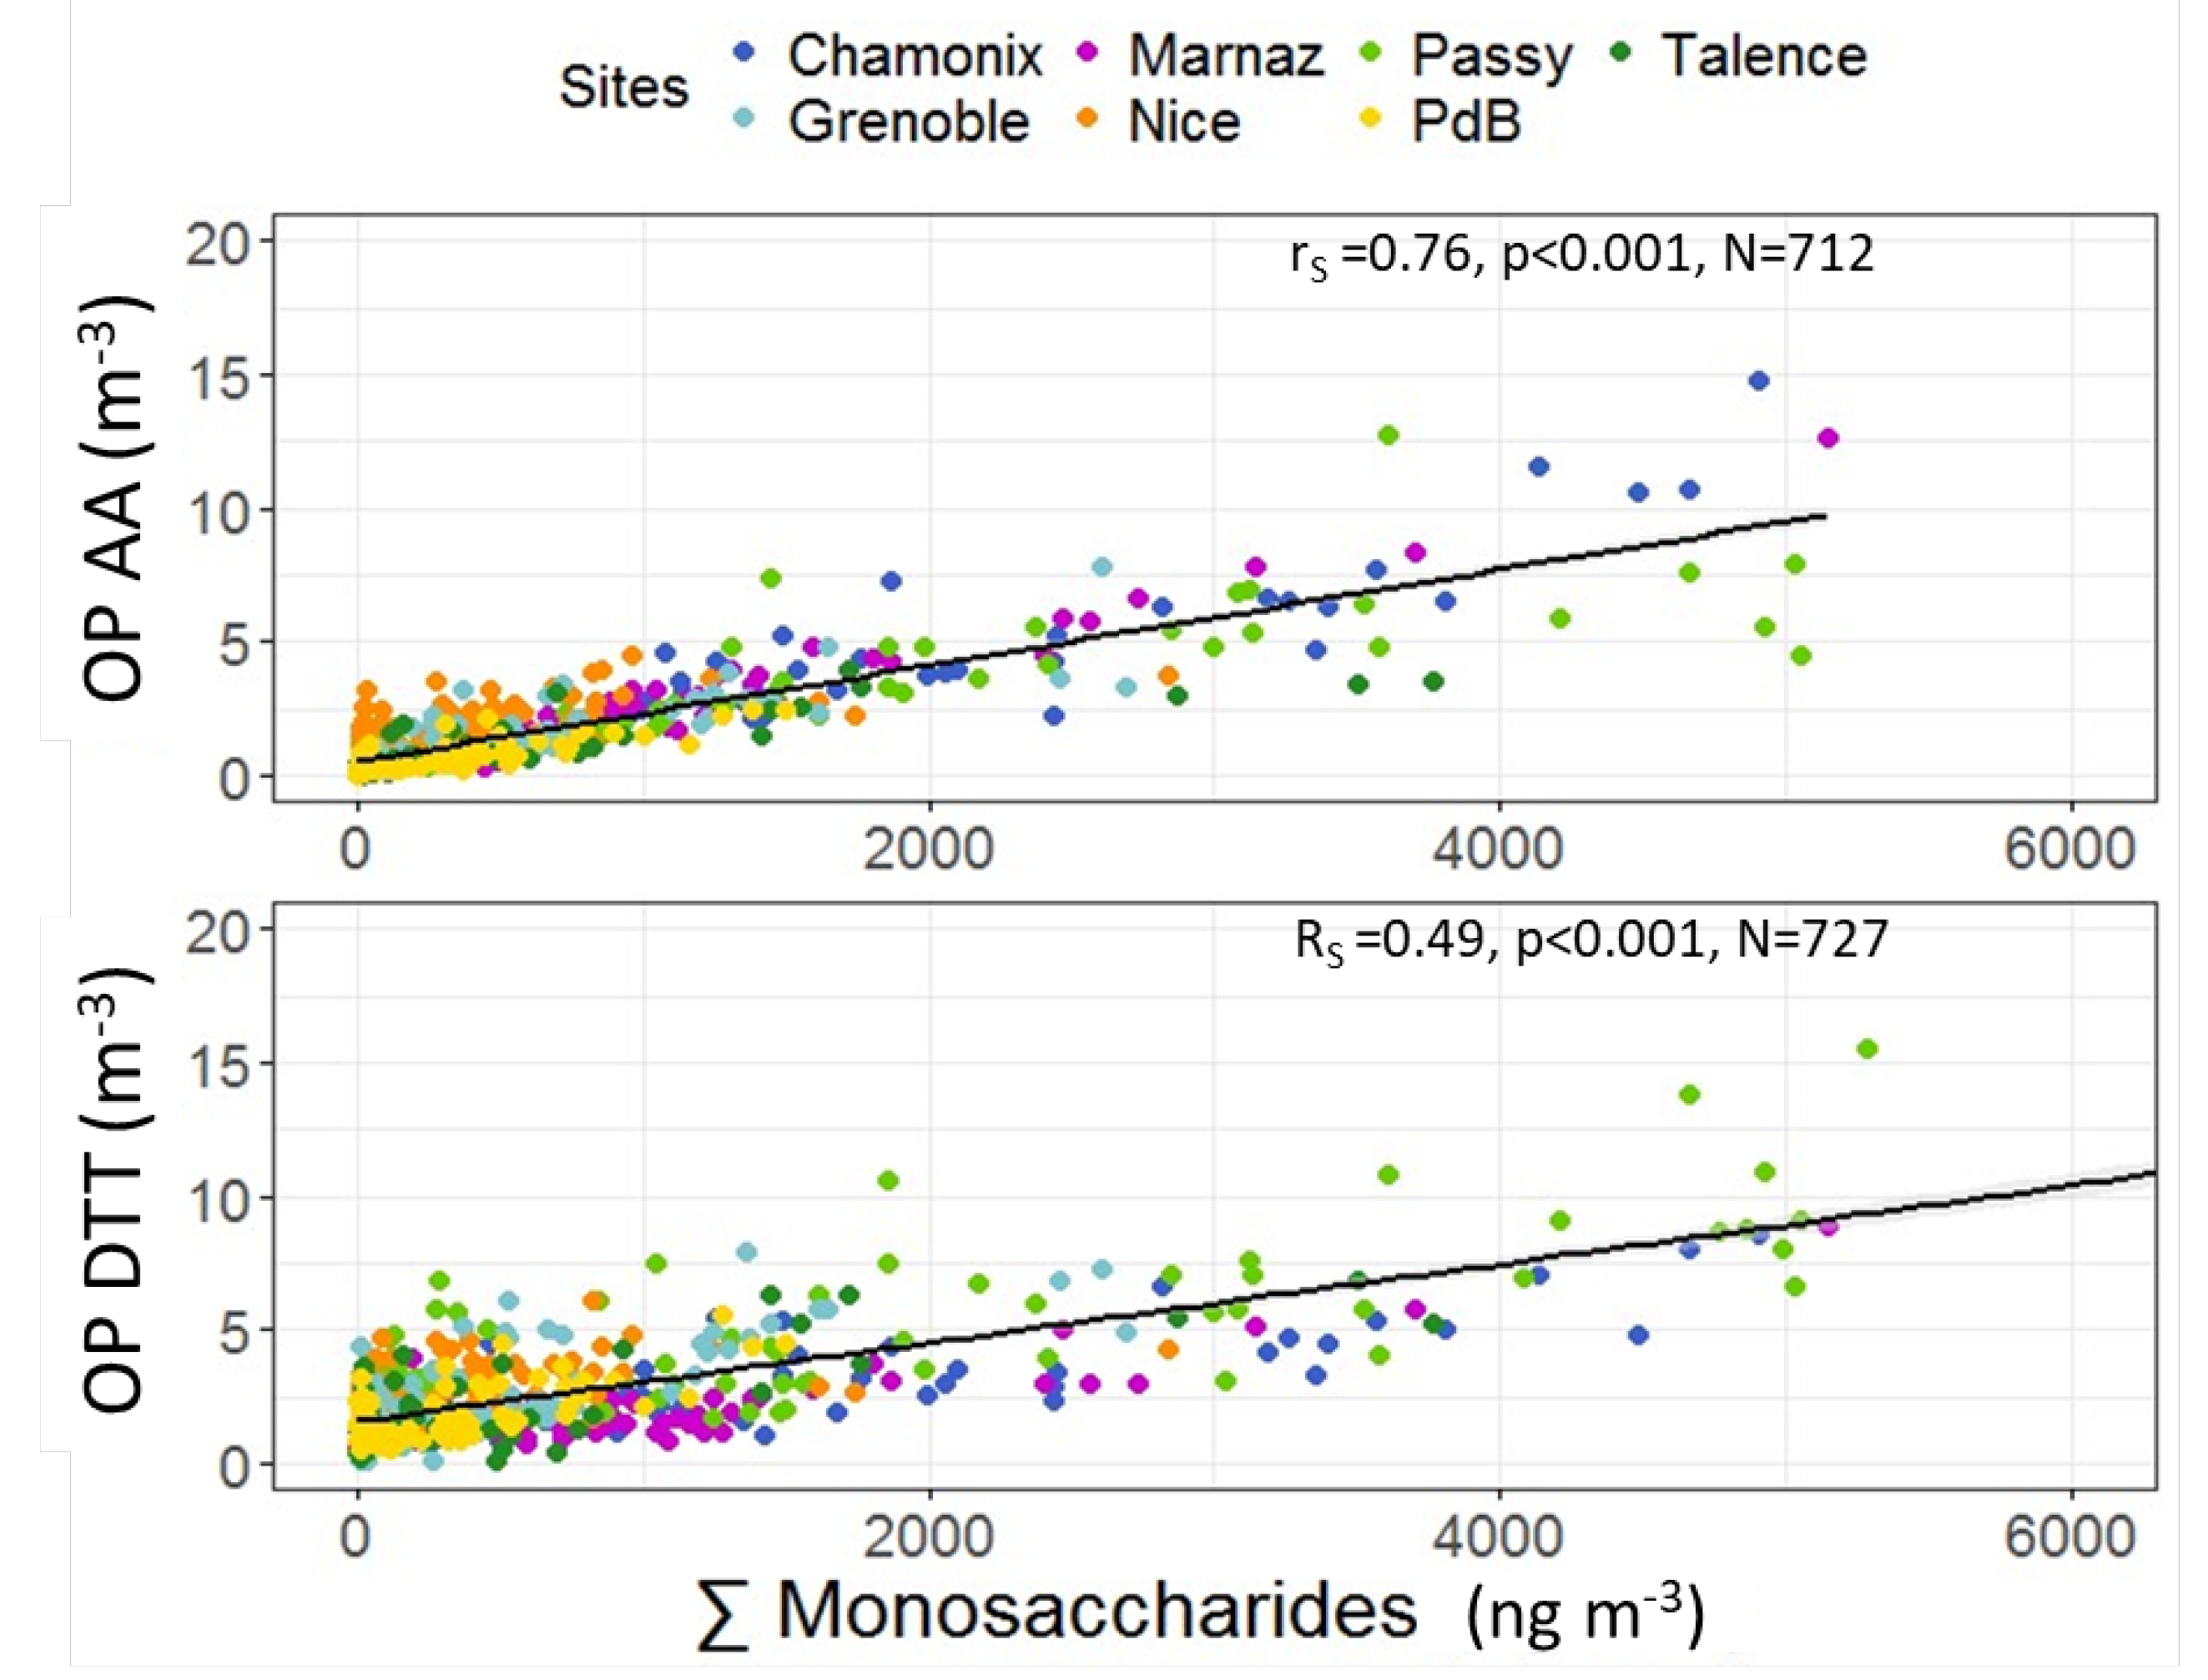
Univariate correlations over the seven sites also highlight the sum of anhydrous monosaccharides—named also monosaccharides—and methoxyphenols (when measured) (Figure 6 and Table S1). These molecular tracers of biomass burning (sum of anhydrous monosaccharides include levoglucosan) seem good OPv predictor candidates. Correlations between OP v AA and monosaccharides range from 0.62 (Nice) to 0.94 (Chamonix) and 0.63 (Nice) to 0.93 (Chamonix) for methoxyphenols. Correlations are higher during cold period in agreement with the seasonality of wood combustion used for residential heating purposes (Table S2). Note that significant highest correlations are observed for Alpine sites for all biomass burning tracer species (monosaccharides, rubidium, potassium and methoxyphenols). This may be explained by larger primary emissions from residential heating as well as by the Alpine meteorological conditions and the influence of the geomorphology with the frequent formation of thermal inversion layers leading to the stagnation of pollutants. Figure 6 also shows that OP v AA is strongly correlated with biomass burning tracers than OP v DTT . These findings are in contradiction with those of Fang et al. [14] where their sampling site in Atlanta (USA) displayed higher correlations between biomass burning tracers and OP v DTT . The different site typologies (urban, coastal and mountainous sites) as well as the differences in the experimental design (simulated lining fluid used for extraction prior to OP measurements) may explain such differences.
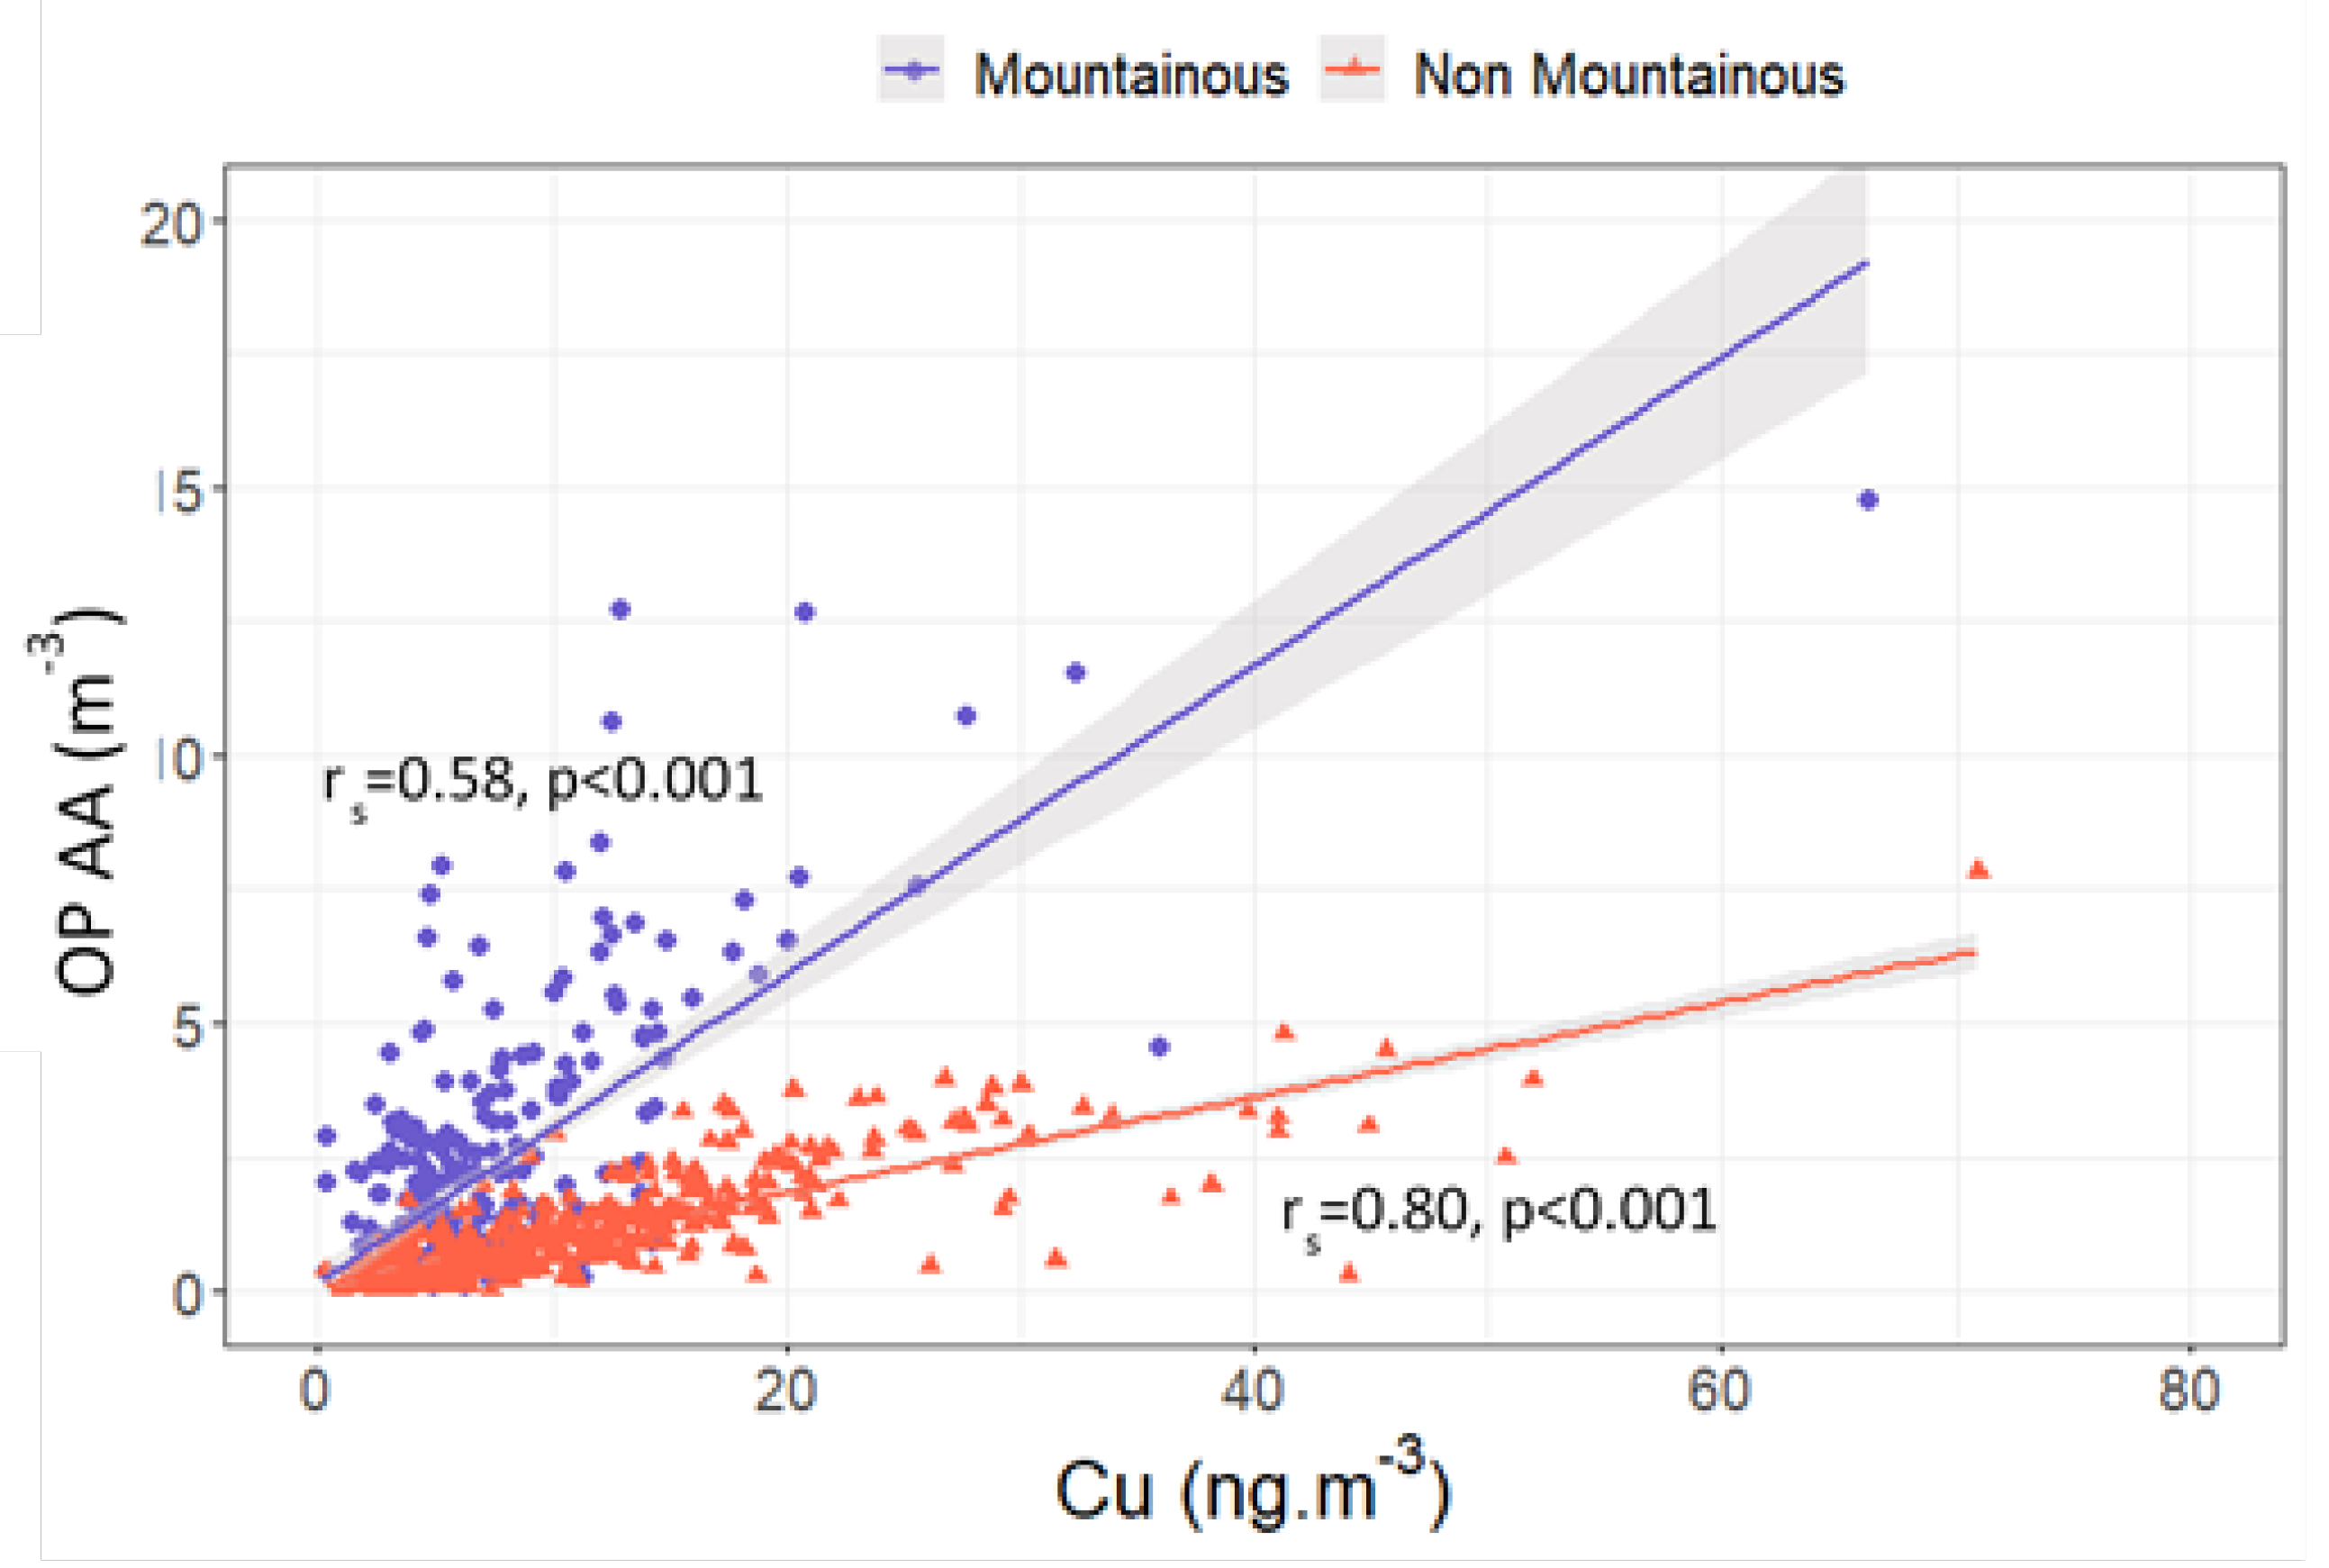
Among the chemical components, Copper (Cu) was the only one showing very high correlation with both OP assays for all the sites. Correlation coefficients between Cu and OP v DTT range from 0.68 (Talence) to 0.87 (Chamonix). For OP v AA , these correlations show significant differences among sites (0.45 (Marnaz) < rs < 0.89 (Nice)). For both assays, these correlations are strong and significant, whatever the season considered (Tables S2 and S3). These results are in agreement with several previous studies [7,20,30,34,82] highlighting Cu as a key predictor in the ROS budget. In the atmosphere, Cu largely originates from brake wear particles and is commonly used to identify traffic emission source [70]. Other metal(loid)s analyzed (Ba, Sb, and Sn), and used as tracer for non-exhaust traffic emissions [83,84], are not necessarily correlated with both OP assays for all the sites. The homogeneous Cu correlation with both OP assays is probably due to its high redox active properties (Sn, Sb, and Ba are not redox active), and/or should be due to its widespread use in European car brakes. In addition, the content of Cu in the disc brake pads is largely higher than other metal(loid)s [83]. Interestingly, when splitting sites according to their altitude (mountainous vs. non-mountainous (>500 m.a.s.l Marnaz, Passy and Chamonix vs. Talence, Grenoble, Nice and Port-de-Bouc)) correlations and slopes between Cu and OP v AA are significantly different (see Figure 7). This result is also observed for Sn and Sb (Figure S3 and Figure 4), as well as other trace elements associated with non-exhaust emissions (Ba, Cd, Pb, Zn, Ni, Cr and Mn). This surprising result highlights a different impact of non-exhaust vehicular emissions for OP v AA in the Arve valley. One hypothesis should be a difference in the balance between heavy duty trucks and light vehicles running and thus affecting the PM chemical composition. A higher influence of heavy-duty truck is notably expected in the Arve Valley, ending by the “Mont Blanc tunnel”, and carrying a large part of the European freight transport. Moreover, mountainous locations, with steeper slopes, may require a higher use of brakes than in other regions.

3.5. Limitations of the Study

In this study, we performed measurements with two widely used acellular OP assays on PM samples from seven French sites to evaluate the main drivers of the oxidative potential of PM. While numerous compounds and PM source markers have been quantified here, the number of species analyzed cannot be exhaustive, covering all the relevant chemical species for the OP metric. As an example, some secondary organic aerosol (SOA) markers (MSA and oxalate) have been analyzed but several others are missing (biogenic or anthropogenic SOA markers, PAH derivatives such as oxygenated and nitrated ones). This has been done only for selected sites and not necessarily covering all the sampling periods presented here [43].
In addition, polyols have been quantified and used to trace primary biogenic emissions (PBOA), but additional and complementary markers such as cellulose were not included in this study, while their mass contribution to the PM [85,86] and their role on OP [87] can be significant. Thus, in summer and winter, with SOA from biomass burning emissions, the implication of SOA and PBOA on the measured OP levels cannot be ruled out. This is probably one of the main limitations of this study but the analysis of all these chemical species, and especially SOA markers and PAH derivatives, would be very time consuming and expensive and cannot be achieved on a such number of samples. Alternatively, the deconvolution of OP according to PM sources is probably more promising than simply connecting OP and ambient air concentrations of few chemical species [14,17,59,88]. Finally, note that, as all OP assays were obtained from PM10 samples, results cannot be extrapolated to other PM size fractions.
Another major limitation of such studies relies on acellular assays. The biological system has many pathways that work together in living tissue to mitigate the toxicological response from PM exposure, and acellular OP assays only capture exogenous ROS from PM. Acellular assays cannot assess endogenous ROS released from the contact of PM with living tissues. Some studies have addressed the link between OP and markers of toxicological impacts [8,21,89,90] allowing the understanding of the involved cellular processes. In these studies, correlations were not systematic according to the assay or the atmospheric compound tested and toxicological markers [9,10,91]. Finally, and probably the most important when it comes to the ability of OP to represent a good “PM health impact metric”, the ability of OP to predict human endpoints is still necessary to test if OP is associated with increased mortality or morbidity independently from already known metrics such as PM2.5 mass. Thus far, this is poorly documented in the literature [13,14,18] and no unifying OP assays have been identified to predict the induction of toxic response from PM. Thus, this study contributes to evaluate if ambient air OP measurements show significance, coherence, stability and repeatability, and could be used in the future to improve air quality policies.

4. Conclusions

This study reported the seasonal variations of acellular oxidative potential along a large set of samples ( N > 700 ) corresponding to seven different urban background environments. A remarkable homogeneity in the OPv seasonal trends was observed with higher levels in wintertime for all the studied sites. Univariate correlations were used to understand the influence of the chemical composition of PM10 on OPv variations. Among the many quantified particulate species, four of them were identified as OP predictors: OC, EC, anhydrous monosaccharides (in association with methoxyphenols when measured) and Cu. The specific targeting of these species could allow decreasing OP levels and by them the harmfulness of the PM. These species are mainly emitted by traffic and biomass burning sources. However, the formal assignment between emission sources and OPv, as measured here, is difficult to achieve due to some species co-emissions and will be further resolved through inversion methodologies. For other species, associations with OP were strongly influenced by the season. In summer, OPv values were mainly associated with tracers of vehicular and industrial sources. For the OPv seasonality, it is recommended to be careful when assessing oxidative potential within punctual campaign (seasonal dependence) and, overall, consider yearly sampling as a more robust method in assessing oxidative potential. In addition, this study focused only on urban background locations. Investigations in other environments (e.g., rural background and roadside) would be required to generalize the observations made here and to determine OPv predictors over France and Europe. Finally, the results obtained confirm that the relationship between oxidative potential and PM composition is assay, season and location dependent and, thus, there is a strong need for a standardized test, or set of tests, for further regulation purposes.

Supplementary Materials

The following are available online at https://www.mdpi.com/2073-4433/10/11/698/s1, together with online visualization at https://pmall.univ-grenoble-alpes.fr/OP/.

Author Contributions

G.U. and J.-L.J. conceived, designed, acquired funding and supervised the study. A.C. (Aurelie Charron) performed OP assays and data curation. J.-L.B. and A.C. (Aude Calas) performed chemistry analysis. G.U. and A.C. (Aude Calas) analyzed the data and wrote the manuscript. J.M.F.M., J.-L.J. and G.U. are supervising the PhDs of A.C. (Aude Calas) and/or S.W.; S.W. settled OP web application and some plots (visualization + software). F.C., G.B. and B.M. are coordinating the filter sample collection for Atmo Nouvelle-Aquitaine, Atmo Auvergne-Rhône-Alpes and Atmo Sud, respectively. O.F. and A.A. are in charge of the CARA program coordination and aerosol health effect topics, respectively, for the French reference laboratory for air quality monitoring (LCSQA). All authors reviewed and commented on the manuscript.

Funding

This work was partially funded by ANSES for OP measurements (ExPOSURE program, grant 2016-CRD-31), IDEX UGA grant for innovation 2017 ROS-ONLINE, Atmo Sud for the chemical analyses of the samples from Nice and Port-de-Bouc, and the French Ministry of Environment, as part of the National reference laboratory for air quality (LCSQA), for the samples from Grenoble, Talence and Nice. The study in Chamonix was funded by ADEME. The University of Grenoble Alpes funded the PhD grant of A. Calas with a “President Award”. The PhD of Samuël Weber was funded by a grant from ENS Paris. The PhD of Florie Chevrier was funded by Région Rhône-Alpes Auvergne. This study was also supported by direct funding by IGE (technician salary), the LEFE CHAT (program 863353: “Le PO comme proxy de l’impact sanitaire”), and LABEX OSUG@2020 (ANR-10-LABX-56) (both for funding analytical instruments).

Acknowledgments

The authors would like to thank Thomas Lacroix, Lisa-Iona Fluchaire, and Anthony Vella for their dedicated work for chemical and OP analyses at IGE, together with many people from AASQA (French regional air quality monitoring networks) for collection of samples in the field. JL Besombes would like to thank JC Francony for the chemical analyses performed at LCME (PAH, Alkanes, Methyl-PAHs, PASHs, hopanes, methoxyphenols) for the alpine site in the framework of the DECOMBIO program.

Conflicts of Interest

The authors declare no conflict of interest.

Abbreviations

The following abbreviations are used in this manuscript:
PM10Particulate matter with aerodynamic diameter lower than 10 μ m .
OP v DTT Oxidative potential of PM measured by the dithiothreitol, normalized by cubic meter of air.
OP v AA Oxidative potential of PM measured by the ascordbic acid, normalized by cubic meter of air.
AASQAAgence Agréée de Surveillance de la Qualité de l’Air.

References

  1. World Health Organization. Ambient Air Pollution: A Global Assessment of Exposure and Burden of Disease; Technical Report; World Health Organization: Geneva, Switzerland, 2016. [Google Scholar]
  2. Cohen, A.J.; Brauer, M.; Burnett, R.; Anderson, H.R.; Frostad, J.; Estep, K.; Balakrishnan, K.; Brunekreef, B.; Dandona, L.; Dandona, R. Estimates and 25-year trends of the global burden of disease attributable to ambient air pollution: An analysis of data from the Global Burden of Diseases Study 2015. Lancet 2017, 389, 1907–1918. [Google Scholar] [CrossRef]
  3. Mannucci, P.M.; Harari, S.; Martinelli, I.; Franchini, M. Effects on health of air pollution: A narrative review. Intern. Emerg. Med. 2015, 10, 657–662. [Google Scholar] [CrossRef] [PubMed]
  4. Lelieveld, J.; Evans, J.S.; Fnais, M.; Giannadaki, D.; Pozzer, A. The contribution of outdoor air pollution sources to premature mortality on a global scale. Nature 2015, 525, 367–371. [Google Scholar] [CrossRef] [PubMed]
  5. Borm, P.J.A.; Kelly, F.; Künzli, N.; Schins, R.P.F.; Donaldson, K. Oxidant generation by particulate matter: From biologically effective dose to a promising, novel metric. Occup. Environ. Med. 2007, 64, 73–74. [Google Scholar] [CrossRef] [PubMed]
  6. Sauvain, J.J.; Rossi, M.J.; Riediker, M. Comparison of three acellular tests for assessing the oxidation potential of nanomaterials. Aerosol Sci. Technol. 2013, 47, 218–227. [Google Scholar] [CrossRef]
  7. Bates, J.T.; Fang, T.; Verma, V.; Zeng, L.; Weber, R.J.; Tolbert, P.E.; Abrams, J.Y.; Sarnat, S.E.; Klein, M.; Mulholland, J.A.; et al. Review of Acellular Assays of Ambient Particulate Matter Oxidative Potential: Methods and Relationships with Composition, Sources, and Health Effects. Environ. Sci. Technol. 2019, 53, 4003–4019. [Google Scholar] [CrossRef] [PubMed]
  8. Steenhof, M.; Gosens, I.; Strak, M.; Godri, K.J.; Hoek, G.; Cassee, F.R.; Mudway, I.S.; Kelly, F.J.; Harrison, R.M.; Lebret, E.; et al. In vitro toxicity of particulate matter (PM) collected at different sites in the Netherlands is associated with PM composition, size fraction and oxidative potential - the RAPTES project. Part. Fibre Toxicol. 2011, 8, 26. [Google Scholar] [CrossRef] [PubMed]
  9. Li, N.; Hao, M.; Phalen, R.F.; Hinds, W.C.; Nel, A.E. Particulate air pollutants and asthma: A paradigm for the role of oxidative stress in PM-induced adverse health effects. Clin. Immunol. 2003, 109, 250–265. [Google Scholar] [CrossRef] [PubMed]
  10. Uzu, G.; Sauvain, J.J.; Baeza-Squiban, A.; Riediker, M.; Sánchez Sandoval Hohl, M.; Val, S.; Tack, K.; Denys, S.; Pradère, P.; Dumat, C. In vitro assessment of the pulmonary toxicity and gastric availability of lead-rich particles from a lead recycling plant. Environ. Sci. Technol. 2011, 45, 7888–7895. [Google Scholar] [CrossRef] [PubMed]
  11. Janssen, N.A.H.; Strak, M.; Yang, A.; Hellack, B.; Kelly, F.J.; Kuhlbusch, T.A.J.; Harrison, R.M.; Brunekreef, B.; Cassee, F.R.; Steenhof, M.; et al. Associations between three specific a-cellular measures of the oxidative potential of particulate matter and markers of acute airway and nasal inflammation in healthy volunteers. Occup. Environ. Med. 2015, 72, 49–56. [Google Scholar] [CrossRef] [PubMed]
  12. Zhang, X.; Staimer, N.; Gillen, D.L.; Tjoa, T.; Schauer, J.J.; Shafer, M.M.; Hasheminassab, S.; Pakbin, P.; Vaziri, N.D.; Sioutas, C.; et al. Associations of oxidative stress and inflammatory biomarkers with chemically-characterized air pollutant exposures in an elderly cohort. Environ. Res. 2016, 150, 306–319. [Google Scholar] [CrossRef] [PubMed]
  13. Weichenthal, S.A.; Lavigne, E.; Evans, G.J.; Godri Pollitt, K.J.; Burnett, R.T. Fine Particulate Matter and Emergency Room Visits for Respiratory Illness. Effect Modification by Oxidative Potential. Am. J. Respir. Crit. Care Med. 2016, 194, 577–586. [Google Scholar] [CrossRef] [PubMed]
  14. Fang, T.; Verma, V.; Bates, J.T.; Abrams, J.; Klein, M.; Strickland, M.J.; Sarnat, S.E.; Chang, H.H.; Mulholland, J.A.; Tolbert, P.E.; et al. Oxidative potential of ambient water-soluble PM 2.5 in the southeastern United States: Contrasts in sources and health associations between ascorbic acid (AA) and dithiothreitol (DTT) assays. Atmos. Chem. Phys. 2016, 16, 3865–3879. [Google Scholar] [CrossRef]
  15. Yang, A.; Janssen, N.A.H.; Brunekreef, B.; Cassee, F.R.; Hoek, G.; Gehring, U. Children’s respiratory health and oxidative potential of PM2.5: The PIAMA birth cohort study. Occup. Environ. Med. 2016, 73, 154–160. [Google Scholar] [CrossRef] [PubMed]
  16. Strak, M.; Janssen, N.; Beelen, R.; Schmitz, O.; Vaartjes, I.; Karssenberg, D.; van den Brink, C.; Bots, M.L.; Dijst, M.; Brunekreef, B.; et al. Long-term exposure to particulate matter, NO2 and the oxidative potential of particulates and diabetes prevalence in a large national health survey. Environ. Intern. 2017, 108, 228–236. [Google Scholar] [CrossRef] [PubMed]
  17. Bates, J.T.; Weber, R.J.; Abrams, J.; Verma, V.; Fang, T.; Klein, M.; Strickland, M.J.; Sarnat, S.E.; Chang, H.H.; Mulholland, J.A.; et al. Reactive oxygen species generation linked to sources of atmospheric particulate matter and cardiorespiratory effects. Environ. Sci. Technol. 2015, 49, 13605–13612. [Google Scholar] [CrossRef] [PubMed]
  18. Abrams, J.Y.; Weber, R.J.; Klein, M.; Samat, S.E.; Chang, H.H.; Strickland, M.J.; Verma, V.; Fang, T.; Bates, J.T.; Mulholland, J.A.; et al. Associations between Ambient Fine Particulate Oxidative Potential and Cardiorespiratory Emergency Department Visits. Environ. Health Perspect. 2017, 125. [Google Scholar] [CrossRef]
  19. Ayres, J.G.; Borm, P.; Cassee, F.R.; Castranova, V.; Donaldson, K.; Ghio, A.; Harrison, R.M.; Hider, R.; Kelly, F.; Kooter, I.M.; et al. Evaluating the Toxicity of Airborne Particulate Matter and Nanoparticles by Measuring Oxidative Stress Potential—A Workshop Report and Consensus Statement. Inhal. Toxicol. 2008, 20, 75–99. [Google Scholar] [CrossRef] [PubMed]
  20. Janssen, N.A.; Yang, A.; Strak, M.; Steenhof, M.; Hellack, B.; Gerlofs-Nijland, M.E.; Kuhlbusch, T.; Kelly, F.; Harrison, R.; Brunekreef, B.; et al. Oxidative potential of particulate matter collected at sites with different source characteristics. Sci. Total Environ. 2014, 472, 572–581. [Google Scholar] [CrossRef] [PubMed]
  21. Crobeddu, B.; Aragao-Santiago, L.; Bui, L.C.; Boland, S.; Baeza Squiban, A. Oxidative potential of particulate matter 2.5 as predictive indicator of cellular stress. Environ. Pollut. 2017, 230, 125–133. [Google Scholar] [CrossRef] [PubMed]
  22. Charrier, J.G.; Anastasio, C. On dithiothreitol (DTT) as a measure of oxidative potential for ambient particles: Evidence for the importance of soluble transition metals. Atmos. Chem. Phys. Discuss. 2012, 12, 11317–11350. [Google Scholar] [CrossRef] [PubMed] [Green Version]
  23. Charrier, J.G.; Richards-Henderson, N.K.; Bein, K.J.; McFall, A.S.; Wexler, A.S.; Anastasio, C. Oxidant production from source-oriented particulate matter &ndash; Part 1: Oxidative potential using the dithiothreitol (DTT) assay. Atmos. Chem. Phys. 2015, 15, 2327–2340. [Google Scholar] [CrossRef] [Green Version]
  24. Calas, A.; Uzu, G.; Martins, J.M.F.; Voisin, D.; Spadini, L.; Lacroix, T.; Jaffrezo, J.L. The importance of simulated lung fluid (SLF) extractions for a more relevant evaluation of the oxidative potential of particulate matter. Sci. Rep. 2017, 7, 11617. [Google Scholar] [CrossRef] [PubMed]
  25. Verma, V.; Fang, T.; Xu, L.; Peltier, R.E.; Russell, A.G.; Ng, N.L.; Weber, R.J. Organic Aerosols Associated with the Generation of Reactive Oxygen Species (ROS) by Water-Soluble PM 2.5. Environ. Sci. Technol. 2015, 49, 4646–4656. [Google Scholar] [CrossRef] [PubMed]
  26. Lin, P.; Yu, J.Z. Generation of Reactive Oxygen Species Mediated by Humic-like Substances in Atmospheric Aerosols. Environ. Sci. Technol. 2011, 45, 10362–10368. [Google Scholar] [CrossRef] [PubMed]
  27. Kramer, A.J.; Rattanavaraha, W.; Zhang, Z.; Gold, A.; Surratt, J.D.; Lin, Y.H. Assessing the oxidative potential of isoprene-derived epoxides and secondary organic aerosol. Atmos. Environ. 2016, 130, 211–218. [Google Scholar] [CrossRef]
  28. Calas, A.; Uzu, G.; Kelly, F.J.; Houdier, S.; Martins, J.M.F.; Thomas, F.; Molton, F.; Charron, A.; Dunster, C.; Oliete, A.; et al. Comparison between five acellular oxidative potential measurement assays performed with detailed chemistry on PM10 samples from the city of Chamonix (France). Atmos. Chem. Phys. 2018, 18, 7863–7875. [Google Scholar] [CrossRef] [Green Version]
  29. Szigeti, T.; Óvári, M.; Dunster, C.; Kelly, F.J.; Lucarelli, F.; Záray, G. Changes in chemical composition and oxidative potential of urban PM2.5 between 2010 and 2013 in Hungary. Sci. Total Environ. 2015, 518-519, 534–544. [Google Scholar] [CrossRef] [PubMed]
  30. Yang, A.; Jedynska, A.; Hellack, B.; Kooter, I.; Hoek, G.; Brunekreef, B.; Kuhlbusch, T.A.; Cassee, F.R.; Janssen, N.A. Measurement of the oxidative potential of PM2.5 and its constituents: The effect of extraction solvent and filter type. Atmos. Environ. 2014, 83, 35–42. [Google Scholar] [CrossRef] [Green Version]
  31. Perrone, M.G.; Zhou, J.; Malandrino, M.; Sangiorgi, G.; Rizzi, C.; Ferrero, L.; Dommen, J.; Bolzacchini, E. PM chemical composition and oxidative potential of the soluble fraction of particles at two sites in the urban area of Milan, Northern Italy. Atmos. Environ. 2016, 128, 104–113. [Google Scholar] [CrossRef] [Green Version]
  32. Charrier, J.G.; McFall, A.S.; Richards-Henderson, N.K.; Anastasio, C. Hydrogen Peroxide Formation in a Surrogate Lung Fluid by Transition Metals and Quinones Present in Particulate Matter. Environ. Sci. Technol. 2014, 48, 7010–7017. [Google Scholar] [CrossRef] [PubMed] [Green Version]
  33. Shirmohammadi, F.; Hasheminassab, S.; Saffari, A.; Schauer, J.J.; Delfino, R.J.; Sioutas, C. Fine and ultrafine particulate organic carbon in the Los Angeles basin: Trends in sources and composition. Sci. Total Environ. 2016, 541, 1083–1096. [Google Scholar] [CrossRef] [PubMed] [Green Version]
  34. Ntziachristos, L.; Froines, J.R.; Cho, A.K.; Sioutas, C. Relationship between redox activity and chemical speciation of size-fractionated particulate matter. Part. Fibre Toxicol. 2007, 4, 5. [Google Scholar] [CrossRef] [PubMed] [Green Version]
  35. Nalin, F.; Golly, B.; Besombes, J.L.; Pelletier, C.; Aujay-Plouzeau, R.; Verlhac, S.; Dermigny, A.; Fievet, A.; Karoski, N.; Dubois, P.; et al. Fast oxidation processes from emission to ambient air introduction of aerosol emitted by residential log wood stoves. Atmos. Environ. 2016, 143, 15–26. [Google Scholar] [CrossRef]
  36. Verma, V.; Fang, T.; Guo, H.; King, L.; Bates, J.T.; Peltier, R.E.; Edgerton, E.; Russell, A.G.; Weber, R.J. Reactive oxygen species associated with water-soluble PM2 in the southeastern United States: Spatiotemporal trends and source apportionment. Atmos. Chem. Phys. 2014, 14, 12915–12930. [Google Scholar] [CrossRef] [Green Version]
  37. Shafer, M.M.; Hemming, J.D.C.; Antkiewicz, D.S.; Schauer, J.J. Oxidative potential of size-fractionated atmospheric aerosol in urban and rural sites across Europe. Faraday Discuss. 2016, 189, 381–405. [Google Scholar] [CrossRef] [PubMed]
  38. Hedayat, F.; Stevanovic, S.; Miljevic, B.; Bottle, S.; Ristovski, Z. Review-evaluating the molecular assays for measuring the oxidative potential of particulate matter. Chem. Ind. Chem. Eng. Q. 2015, 21, 201–210. [Google Scholar] [CrossRef] [Green Version]
  39. Saffari, A.; Daher, N.; Shafer, M.M.; Schauer, J.J.; Sioutas, C. Seasonal and spatial variation in dithiothreitol (DTT) activity of quasi-ultrafine particles in the Los Angeles Basin and its association with chemical species. J. Environ. Sci. Health Part A 2014, 49, 441–451. [Google Scholar] [CrossRef] [PubMed]
  40. Favez, O.; Salameh, D.; Jaffrezo, J.L. Traitement Harmonisé de Jeux de Données Multi-sites Pour l’étude de Sources de PM par Positive Matrix Factorization (PMF); Technical Report; LCSQA: Verneuil-en-Halatte, France, 2017. [Google Scholar]
  41. Chevrier, F. Chauffage au Bois et Qualité de l’air en Vallée de l’Arve : Définition d’un Système de Surveillance et Impact d’une Politique de RéNovation du parc des Appareils Anciens. Ph.D. Thesis, Université Grenoble Alpes, Grenoble, France, 2016. [Google Scholar]
  42. Favez, O.; El Haddad, I.; Piot, C.; Boréave, A.; Abidi, E.; Marchand, N.; Jaffrezo, J.L.; Besombes, J.L.; Personnaz, M.B.; Sciare, J.; et al. Inter-comparison of source apportionment models for the estimation of wood burning aerosols during wintertime in an Alpine city (Grenoble, France). Atmos. Chem. Phys. 2010, 10, 5295–5314. [Google Scholar] [CrossRef] [Green Version]
  43. Srivastava, D.; Tomaz, S.; Favez, O.; Lanzafame, G.M.; Golly, B.; Besombes, J.L.; Alleman, L.Y.; Jaffrezo, J.L.; Jacob, V.; Perraudin, E.; et al. Speciation of organic fraction does matter for source apportionment. Part 1: A one-year campaign in Grenoble (France). Sci. Total Environ. 2018, 624, 1598–1611. [Google Scholar] [CrossRef] [PubMed]
  44. Tomaz, S.; Jaffrezo, J.L.; Favez, O.; Perraudin, E.; Villenave, E.; Albinet, A. Sources and atmospheric chemistry of oxy- and nitro-PAHs in the ambient air of Grenoble (France). Atmos. Environ. 2017, 161, 144–154. [Google Scholar] [CrossRef] [Green Version]
  45. Tomaz, S.; Shahpoury, P.; Jaffrezo, J.L.; Lammel, G.; Perraudin, E.; Villenave, E.; Albinet, A. One-year study of polycyclic aromatic compounds at an urban site in Grenoble (France): Seasonal variations, gas/particle partitioning and cancer risk estimation. Sci. Total Environ. 2016, 565, 1071–1083. [Google Scholar] [CrossRef] [PubMed]
  46. Sylvestre, A.; Mizzi, A.; Mathiot, S.; Masson, F.; Jaffrezo, J.L.; Dron, J.; Mesbah, B.; Wortham, H.; Marchand, N. Comprehensive chemical characterization of industrial PM 2.5 from steel industry activities. Atmos. Environ. 2017, 152, 180–190. [Google Scholar] [CrossRef]
  47. Cavalli, F.; Alastuey, A.; Areskoug, H.; Ceburnis, D.; Čech, J.; Genberg, J.; Harrison, R.; Jaffrezo, J.L.; Kiss, G.; Laj, P.; et al. A European aerosol phenomenology—4: Harmonized concentrations of carbonaceous aerosol at 10 regional background sites across Europe. Atmos. Environ. 2016, 144, 133–145. [Google Scholar] [CrossRef]
  48. Waked, A.; Favez, O.; Alleman, L.Y.; Piot, C.; Petit, J.E.; Delaunay, T.; Verlinden, E.; Golly, B.; Besombes, J.L.; Jaffrezo, J.L.; et al. Source apportionment of PM10 in a north-western Europe regional urban background site (Lens, France) using positive matrix factorization and including primary biogenic emissions. Atmos. Chem. Phys. 2014, 14, 3325–3346. [Google Scholar] [CrossRef] [Green Version]
  49. Golly, B.; Waked, A.; Weber, S.; Samake, A.; Jacob, V.; Conil, S.; Rangognio, J.; Chrétien, E.; Vagnot, M.P.; Robic, P.Y.; et al. Organic markers and OC source apportionment for seasonal variations of PM2.5 at 5 rural sites in France. Atmos. Environ. 2019, 198, 142–157. [Google Scholar] [CrossRef]
  50. Piot, C.; Jaffrezo, J.L.; Cozic, J.; Pissot, N.; Haddad, I.E.; Marchand, N.; Besombes, J.L. Quantification of levoglucosan and its isomers by High Performance Liquid Chromatography &ndash; Electrospray Ionization tandem Mass Spectrometry and its applications to atmospheric and soil samples. Atmos. Meas. Tech. 2012, 5, 141–148. [Google Scholar] [CrossRef] [Green Version]
  51. Golly, B.; Brulfert, G.; Berlioux, G.; Jaffrezo, J.L.; Besombes, J.L. Large chemical characterisation of PM10 emitted from graphite material production: Application in source apportionment. Sci. Total Environ. 2015, 538, 634–643. [Google Scholar] [CrossRef] [PubMed]
  52. Charrier, J.G.; McFall, A.S.; Vu, K.K.T.; Baroi, J.; Olea, C.; Hasson, A.; Anastasio, C. A bias in the “mass-normalized” DTT response – An effect of non-linear concentration-response curves for copper and manganese. Atmos. Environ. 2016, 144, 325–334. [Google Scholar] [CrossRef] [PubMed] [Green Version]
  53. Kelly, F.J.; Mudway, I.S. Protein oxidation at the air-lung interface. Amino Acids 2003, 25, 375–396. [Google Scholar] [CrossRef] [PubMed]
  54. Velali, E.; Papachristou, E.; Pantazaki, A.; Choli-Papadopoulou, T.; Planou, S.; Kouras, A.; Manoli, E.; Besis, A.; Voutsa, D.; Samara, C. Redox activity and in vitro bioactivity of the water-soluble fraction of urban particulate matter in relation to particle size and chemical composition. Environ. Pollut. 2016, 208, 774–786. [Google Scholar] [CrossRef] [PubMed]
  55. Constantini, S.; Loukia, C. Mutagenicity and redox activity of size segregated airborne particulate matter in Thessaloniki, Northern Greece, in relation to aerosol chemical composition. Front. Pharmacol. 2010, 1. [Google Scholar] [CrossRef]
  56. Künzli, N.; Mudway, I.S.; Götschi, T.; Shi, T.; Kelly, F.J.; Cook, S.; Burney, P.; Forsberg, B.; Gauderman, J.W.; Hazenkamp, M.E.; et al. Comparison of Oxidative Properties, Light Absorbance, and Total and Elemental Mass Concentration of Ambient PM2.5 Collected at 20 European Sites. Environ. Health Perspect. 2006, 114, 684–690. [Google Scholar] [CrossRef] [PubMed]
  57. Nawrot, T.S.; Kuenzli, N.; Sunyer, J.; Shi, T.; Moreno, T.; Viana, M.; Heinrich, J.; Forsberg, B.; Kelly, F.J.; Sughis, M.; et al. Oxidative properties of ambient PM2.5 and elemental composition: Heterogeneous associations in 19 European cities. Atmos. Environ. 2009, 43, 4595–4602. [Google Scholar] [CrossRef]
  58. Orru, H.; Kimmel, V.; Kikas, Ü.; Soon, A.; Künzli, N.; Schins, R.P.F.; Borm, P.J.A.; Forsberg, B. Elemental composition and oxidative properties of PM2.5 in Estonia in relation to origin of air masses—Results from the ECRHS II in Tartu. Sci. Total Environ. 2010, 408, 1515–1522. [Google Scholar] [CrossRef] [PubMed]
  59. Weber, S.; Uzu, G.; Calas, A.; Chevrier, F.; Besombes, J.L.; Charron, A.; Salameh, D.; Ježek, I.; Močnik, G.; Jaffrezo, J.L. An apportionment method for the oxidative potential of atmospheric particulate matter sources: Application to a one-year study in Chamonix, France. Atmos. Chem. Phys. 2018, 18, 9617–9629. [Google Scholar] [CrossRef] [Green Version]
  60. Albinet, A.; Leoz-Garziandia, E.; Budzinski, H.; Villenave, E.; Jaffrezo, J.L. Nitrated and oxygenated derivatives of polycyclic aromatic hydrocarbons in the ambient air of two French alpine valleys Part 2: Particle size distribution. Atmos. Environ. 2008, 42, 55–64. [Google Scholar] [CrossRef] [Green Version]
  61. Albinet, A.; Leoz-Garziandia, E.; Budzinski, H.; Villenave, E.; Jaffrezo, J.L. Nitrated and oxygenated derivatives of polycyclic aromatic hydrocarbons in the ambient air of two French alpine valleysPart 1: Concentrations, sources and gas/particle partitioning. Atmos. Environ. 2008, 42, 43–54. [Google Scholar] [CrossRef] [Green Version]
  62. Keyte, I.J.; Harrison, R.M.; Lammel, G. Chemical reactivity and long-range transport potential of polycyclic aromatic hydrocarbons—A review. Chem. Soc. Rev. 2013, 42, 9333. [Google Scholar] [CrossRef] [PubMed]
  63. Tuet, W.Y.; Liu, F.; de Oliveira Alves, N.; Fok, S.; Artaxo, P.; Vasconcellos, P.; Champion, J.A.; Ng, N.L. Chemical Oxidative Potential and Cellular Oxidative Stress from Open Biomass Burning Aerosol. Environ. Sci. Technol. Lett. 2019, 6, 126–132. [Google Scholar] [CrossRef]
  64. Singh, V.; Ravindra, K.; Sahu, L.; Sokhi, R. Trends of atmospheric black carbon concentration over the United Kingdom. Atmos. Environ. 2018, 178, 148–157. [Google Scholar] [CrossRef]
  65. Keyte, I.J.; Albinet, A.; Harrison, R.M. On-road traffic emissions of polycyclic aromatic hydrocarbons and their oxy- and nitro- derivative compounds measured in road tunnel environments. Sci. Total Environ. 2016, 566-567, 1131–1142. [Google Scholar] [CrossRef] [PubMed] [Green Version]
  66. Zielinska, B.; Sagebiel, J.; McDonald, J.D.; Whitney, K.; Lawson, D.R. Emission Rates and Comparative Chemical Composition from Selected In-Use Diesel and Gasoline-Fueled Vehicles. J. Air Waste Manag. Assoc. 2004, 54, 1138–1150. [Google Scholar] [CrossRef] [PubMed]
  67. Bruns, E.A.; Krapf, M.; Orasche, J.; Huang, Y.; Zimmermann, R.; Drinovec, L.; Močnik, G.; El-Haddad, I.; Slowik, J.G.; Dommen, J.; et al. Characterization of primary and secondary wood combustion products generated under different burner loads. Atmos. Chem. Phys. 2015, 15, 2825–2841. [Google Scholar] [CrossRef] [Green Version]
  68. Marchand, N.; Besombes, J.L.; Masclet, P.; Jaffrezo, J.L. Atmospheric Polycyclic Aromatic Hydrocarbons (PAHs) in Two French Alpine Valleys. In Environmental Chemistry; Lichtfouse, E., Schwarzbauer, J., Robert, D., Eds.; Springer: Berlin/Heidelberg, Germany, 2005; pp. 409–417. [Google Scholar] [CrossRef]
  69. Salameh, D.; Pey, J.; Bozzetti, C.; El Haddad, I.; Detournay, A.; Sylvestre, A.; Canonaco, F.; Armengaud, A.; Piga, D.; Robin, D.; et al. Sources of PM2.5 at an urban-industrial Mediterranean city, Marseille (France): Application of the ME-2 solver to inorganic and organic markers. Atmos. Res. 2018, 214, 263–274. [Google Scholar] [CrossRef] [Green Version]
  70. Pant, P.; Harrison, R.M. Estimation of the contribution of road traffic emissions to particulate matter concentrations from field measurements: A review. Atmos. Environ. 2013, 77, 78–97. [Google Scholar] [CrossRef]
  71. Police, S.; Sahu, S.K.; Pandit, G.G. Chemical characterization of atmospheric Particulate Matter in Delhi, India, Part II: Source apportionment studies using PMF3. Sustain. Environ. Res. 2013, 23, 295–306. [Google Scholar]
  72. Moreno, T.; Karanasiou, A.; Amato, F.; Lucarelli, F.; Nava, S.; Calzolai, G.; Chiari, M.; Coz, E.; Artíñano, B.; Lumbreras, J.; et al. Daily and hourly sourcing of metallic and mineral dust in urban air contaminated by traffic and coal-burning emissions. Atmos. Environ. 2013, 68, 33–44. [Google Scholar] [CrossRef]
  73. Aymoz, G.; Godefroy, F. Caractérisation Chimique des Particules; Technical Report DRC-08-94285-15186A; LCSQA: Verneuil-en-Halatte, France, 2008. [Google Scholar]
  74. Zhou, J.; Bruns, E.A.; Zotter, P.; Stefenelli, G.; Prévôt, A.S.H.; Baltensperger, U.; El-Haddad, I.; Dommen, J. Development, characterization and first deployment of an improved online reactive oxygen species analyzer. Atmos. Meas. Tech. 2018, 11, 65–80. [Google Scholar] [CrossRef] [Green Version]
  75. Constantini, S. On the Redox Activity of Urban Aerosol Particles: Implications for Size Distribution and Relationships with Organic Aerosol Components. Atmosphere 2017, 8, 205. [Google Scholar] [CrossRef] [Green Version]
  76. Szigeti, T.; Dunster, C.; Cattaneo, A.; Cavallo, D.; Spinazzè, A.; Saraga, D.E.; Sakellaris, I.A.; de Kluizenaar, Y.; Cornelissen, E.J.; Hänninen, O.; et al. Oxidative potential and chemical composition of PM2.5 in office buildings across Europe—The OFFICAIR study. Environ. Intern. 2016, 92–93, 324–333. [Google Scholar] [CrossRef] [PubMed] [Green Version]
  77. Szigeti, T.; Dunster, C.; Cattaneo, A.; Spinazzè, A.; Mandin, C.; Le Ponner, E.; de Oliveira Fernandes, E.; Ventura, G.; Saraga, D.E.; Sakellaris, I.A.; et al. Spatial and temporal variation of particulate matter characteristics within office buildings—The OFFICAIR study. Sci. Total Environ. 2017, 587–588, 59–67. [Google Scholar] [CrossRef] [PubMed]
  78. Beck-Speier, I.; Karg, E.; Behrendt, H.; Stoeger, T.; Alessandrini, F. Ultrafine particles affect the balance of endogenous pro- and anti-inflammatory lipid mediators in the lung: In-vitro and in-vivo studies. Part. Fibre Toxicol. 2012, 9, 27. [Google Scholar] [CrossRef] [PubMed] [Green Version]
  79. Pozzi, R.; De Berardis, B.; Paoletti, L.; Guastadisegni, C. Inflammatory mediators induced by coarse (PM2.5–10) and fine (PM2.5) urban air particles in RAW 264.7 cells. Toxicology 2003, 183, 243–254. [Google Scholar] [CrossRef]
  80. Hetland, R.B.; Cassee, F.R.; Låg, M.; Refsnes, M.; Dybing, E.; Schwarze, P.E. Cytokine release from alveolar macrophages exposed to ambient particulate matter: Heterogeneity in relation to size, city and season. Part. Fibre Toxicol. 2005, 2, 4. [Google Scholar] [CrossRef] [PubMed] [Green Version]
  81. Janssen, N.A.H.; Gerlofs-Nijland, M.E.; Lanki, T.; Salonen, R.O.; Cassee, F.R.; Hoek, G.; Fischer, P.; Brunekreef, B.; Krzyzanowski, M. Health Effects of Black Carbon; OCLC: 930804705; World Health Organization, Regional Office for Europe: Copenhagen, Denmark, 2012. [Google Scholar]
  82. Visentin, M.; Pagnoni, A.; Sarti, E.; Pietrogrande, M.C. Urban PM2.5 oxidative potential: Importance of chemical species and comparison of two spectrophotometric cell-free assays. Environ. Pollut. 2016, 219, 72–79. [Google Scholar] [CrossRef] [PubMed]
  83. Gietl, J.K.; Lawrence, R.; Thorpe, A.J.; Harrison, R.M. Identification of brake wear particles and derivation of a quantitative tracer for brake dust at a major road. Atmos. Environ. 2010, 44, 141–146. [Google Scholar] [CrossRef]
  84. Amato, F. (Ed.) Non-Exhaust Emissions: An Urban Air Quality Problem for Public Health: Impact and Mitigation Measures; OCLC: on1023047184; Academic Press: London, UK; San Diego, CA, USA, 2018. [Google Scholar]
  85. Samaké, A.; Jaffrezo, J.L.; Favez, O.; Weber, S.; Jacob, V.; Canete, T.; Albinet, A.; Charron, A.; Riffault, V.; Perdrix, E.; et al. Arabitol, mannitol and glucose as tracers of primary biogenic organic aerosol: Influence of environmental factors on ambient air concentrations and spatial distribution over France. Atmos. Chem. Phys. Discuss. 2019, 1–24. [Google Scholar] [CrossRef] [Green Version]
  86. Samaké, A.; Jaffrezo, J.L.; Favez, O.; Weber, S.; Jacob, V.; Albinet, A.; Riffault, V.; Perdrix, E.; Waked, A.; Golly, B.; et al. Polyols and glucose particulate species as tracers of primary biogenic organic aerosols at 28 French sites. Atmos. Chem. Phys. 2019, 19, 3357–3374. [Google Scholar] [CrossRef] [Green Version]
  87. Samaké, A.; Uzu, G.; Martins, J.M.F.; Calas, A.; Vince, E.; Parat, S.; Jaffrezo, J.L. The unexpected role of bioaerosols in the Oxidative Potential of PM. Sci. Rep. 2017, 7, 10978. [Google Scholar] [CrossRef] [PubMed]
  88. Bates, J.T.; Weber, R.J.; Verma, V.; Fang, T.; Ivey, C.; Liu, C.; Sarnat, S.E.; Chang, H.H.; Mulholland, J.A.; Russell, A. Source impact modeling of spatiotemporal trends in PM2.5 oxidative potential across the eastern United States. Atmos. Environ. 2018, 193, 158–167. [Google Scholar] [CrossRef] [Green Version]
  89. Hussain, S.; Boland, S.; Baeza-Squiban, A.; Hamel, R.; Thomassen, L.C.J.; Martens, J.A.; Billon-Galland, M.A.; Fleury-Feith, J.; Moisan, F.; Pairon, J.C.; et al. Oxidative stress and proinflammatory effects of carbon black and titanium dioxide nanoparticles: Role of particle surface area and internalized amount. Toxicology 2009, 260, 142–149. [Google Scholar] [CrossRef] [PubMed]
  90. Kermanizadeh, A.; Vranic, S.; Boland, S.; Moreau, K.; Baeza-Squiban, A.; Gaiser, B.K.; Andrzejczuk, L.A.; Stone, V. An in vitro assessment of panel of engineered nanomaterials using a human renal cell line: Cytotoxicity, pro-inflammatory response, oxidative stress and genotoxicity. BMC Nephrol. 2013, 14, 96. [Google Scholar] [CrossRef] [PubMed] [Green Version]
  91. Surratt, J.D.; Lin, Y.H.; Arashiro, M.; Vizuete, W.G.; Zhang, Z.; Gold, A.; Jaspers, I.; Fry, R.C. Understanding the Early Biological Effects of Isoprene-Derived Particulate Matter Enhanced by Anthropogenic Pollutants; Technical Report 198; Health Effects Institute: Bostan, MA, USA, 2019. [Google Scholar]
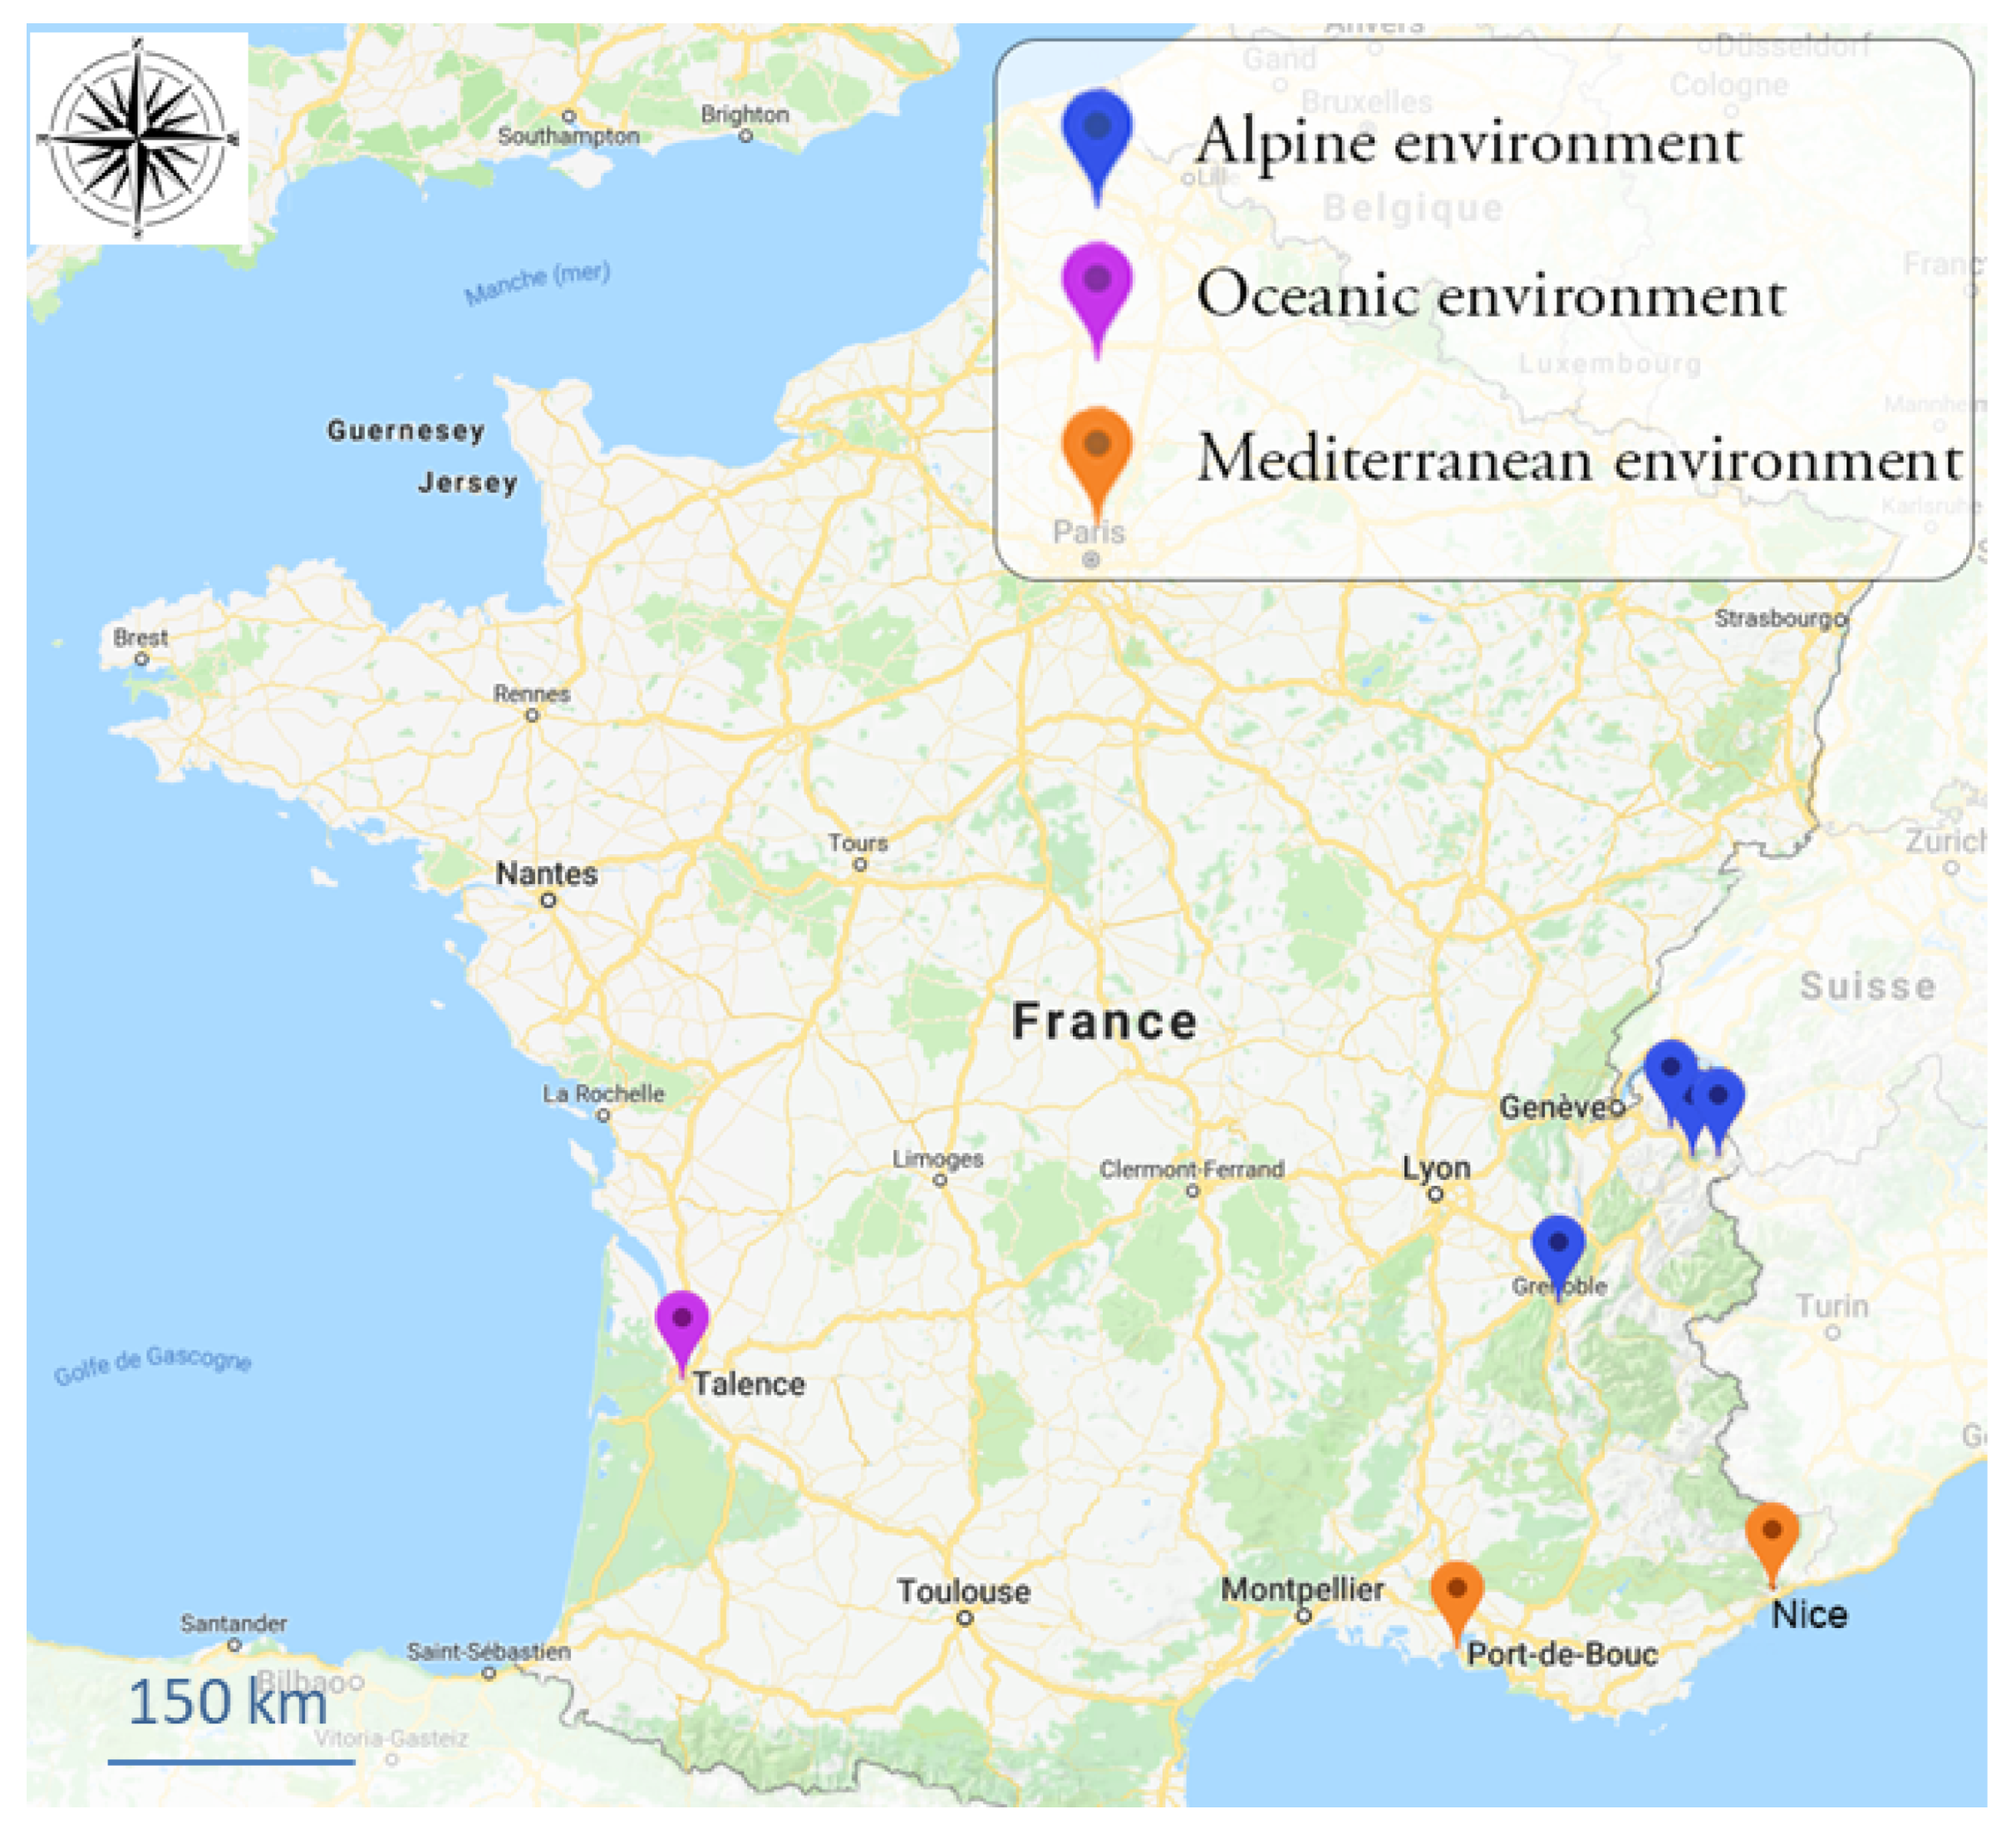
Figure 1. Location of the seven sampling sites.
Atmosphere 10 00698 g001
Figure 2. Representations in boxes and whiskers with two linear scales (blue line) to facilitate the reading for: (A) PM10 concentrations ( μ g   m 3 ); (B) OP v DTT ; and (C) OP v AA for the seven sites. Solid lines in the boxes show the median value. PdB refers to Port-de-Bouc.
Atmosphere 10 00698 g002
Figure 3. Box plot representation of annual means of PM10, OP v DTT , and OP v AA for both the cold and warm periods at the different sampling sites.
Atmosphere 10 00698 g003
Figure 4. Spearman correlations between PM species and OPv (DTT and AA) for each site considering the whole year datasets.
Atmosphere 10 00698 g004
Figure 5. Observed correlations between particulate OC (organic carbon), EC (elemental carbon) and OP v AA or OP v DTT . All sites are combined. From top to bottom: OC and OP v DTT ; EC and OP v DTT ; OC and OP v AA ; and EC and OP v AA .
Atmosphere 10 00698 g005
Figure 6. Observed correlations between particulate monosaccharides concentrations and OP v AA or OP v DTT . All sites are combined.
Atmosphere 10 00698 g006
Figure 7. Observed correlations between particulate Cu concentrations and OP v AA according the site typology (mountainous vs. non-mountainous).
Atmosphere 10 00698 g007
Table 1. Sampling sites characteristics and sample details.
SitesSampling PeriodCoordinatesAltitude (m)TypologyClimateN a
MarnazNovember 2013 October 201446°3′27.78″ N, 6°32′0.29″ E505Urban backgroundAlpine94
PassyNovember 2013 October 201446°55′24.58″ N, 6°42′49.15″ E583Urban backgroundAlpine95
ChamonixNovember 2013 October 201445°55′21.53″ N, 6°52′11.68″ E1035Urban backgroundAlpine98
GrenobleJanuary 2014 December 201445°9′42.84″ N, 5°44′8.16″ E214Urban backgroundAlpine121
TalenceMarch 2012 December 201244°48′2.016″ N, 0°35′17.016″ W20Urban backgroundOceanic92
NiceJune 2014 May 201543°42′7.48 N, 7°17′10.49″ E11Urban backgroundMediterranean115
Port-de-BoucJune 2014 May 201543°24′7.03″ N, 4°58′54.91″ E3Urban backgroundMediterranean113
[a] Total number of samples analyzed.
Table 2. Analysis of the PM chemical composition for each site.
MarnazPassyChamonixGrenobleTalenceNicePdB
10 Anions/Cations
33 Metals and trace elements
EC/OC
3 Polyols
3 Anhydrous monosacch.
16 PAHsAna
30 AlkanesAnaAna
15 Methyl-PAHsAnaAna
7 PASHsAnaAna
10 HopanesAnaAna
14 MethoxyphenolsAnaAna
Ana: Analysis not available (not performed in the project that funded chemistry analysis).
Table 3. Cold/warm ratios for PM10, OP v DTT and OP v AA . Values are given with first and third quartile in bracket ([first quartile, third quartile]).
StationPM10 OP v DTT OP v AA
Marnaz1.7 *** [1.3, 1.8]1.5 ** [1.2, 1.6]5.6 *** [4.1, 6.6]
Passy2.8 *** [1.9, 3.2]2.1 *** [1.5, 2.4]4.6 *** [4.8, 5.4]
Chamonix2.2 *** [1.7, 2.9]2.1 *** [1.5, 2.5]6.1 *** [5.4, 6.5]
Grenoble1.6 *** [1.5, 1.7]2.1 *** [1.5, 2.6]3.9 *** [4.3, 2.6]
Talence1.8 *** [1.3, 2.1]1.8 [1.1, 2.1]3.0 *** [2.3, 3.3]
Nice1.1 [1.0, 1.2]1.2 ** [1.1, 1.4]1.8 *** [1.5, 1.9]
Port-de-Bouc1.3 ** [1.2, 1.6]1.2 [0.9, 1.4]2.6 *** [2.1, 3.1]
*** p-value < 0.001, ** p-value < 0.01, * p-value < 0.05 (non-parametric Mann–Whitney test).
Table 4. Spearman correlations (rs) between the OP v DTT , OP v AA and the PM10 during the cold and warm period.
Cold PeriodWarm Period
OP v DTT – PM10 OP v AA – PM10 OP v DTT OP v AA OP v DTT – PM10 OP v AA – PM10 OP v DTT OP v AA
Marnaz0.86 ***0.77 ***0.65 ***0.77 ***0.41 **0.47 **
Passy0.84 ***0.85 ***0.70 ***0.54 ***0.53 ***0.55 ***
Chamonix0.90 ***0.89 ***0.87 ***0.67 ***0.37 *0.46 **
Grenoble0.88 ***0.78 ***0.84 ***0.78 ***0.54 ***0.65 ***
Talence0.60 ***0.84 ***0.66 ***0.77 ***0.44 ***0.51 ***
Nice0.91 ***0.75 ***0.82 ***0.75 ***0.35 **0.55 ***
PdB0.75 ***0.69 ***0.89 ***0.74 ***0.36 **0.54 ***
*** p-value < 0.001, ** p-value < 0.01, * p-value < 0.05.