Abstract
This paper is devoted to the quantification of changes in ventilation of a real neighborhood located in Pamplona, Spain, due to the presence of street trees Pollutant dispersion in this urban zone was previously studied by means of computational fluid dynamic (CFD) simulations. In the present work, that research is extended to analyze the ventilation in the whole neighborhood and in a tree-free street. Several scenarios are investigated including new trees in the tree-free street, and different leaf area density (LAD) in the whole neighborhood. Changes between the scenarios are evaluated through changes in average concentration, wind speed, flow rates and total pollutant fluxes. Additionally, wind flow patterns and the vertical profiles of flow properties (e.g., wind velocity, turbulent kinetic energy) and concentration, horizontally-averaged over one particular street, are analyzed. The approach-flow direction is almost perpendicular to the street under study (prevailing wind direction is only deviated 4º from the perpendicular direction). For these conditions, as LAD increases, average concentration in the whole neighborhood increases due to the decrease of wind speed. On the other hand, the inclusion of trees in the street produces an increase of averaged pollutant concentration only within this street, in particular for the scenario with the highest LAD value. In fact, the new trees in the street analyzed with the highest LAD value notably change the ventilation producing an increase of total pollutant fluxes inward the street. Additionally, pollutant dispersion within the street is also influenced by the reduction of the wind velocity along the street axis and the decrease of turbulent kinetic energy within the vegetation canopy caused by the new trees. Therefore, the inclusion of new trees in a tree-free street should be done by considering ventilation changes and traffic emissions should be consequently controlled in order to keep pollutant concentration within healthy levels.
1. Introduction
Besides ecosystem services such as micro-climate regulation, carbon sequestration, rainwater drainage, noise reduction, psychological and recreational values [1,2,3,4,5,6], trees and green infrastructures, in general, are often used in the urban environment as a pollution mitigation strategy [2,7]. In urban areas, the wind environment, and thus, the final levels of pollutant concentration is determined by the atmospheric processes inside the urban canopy layer (UCL). Within the UCL, the interaction between the atmospheric flow and urban obstacles (e.g., buildings, trees, etc.) induces complex wind flow patterns which, in general, reduce the city ventilation and increase the pollutant concentration. In recent years, urban ventilation indices have received more and more attention to evaluate the ventilation efficiency [8,9]. With the help of computational fluid dynamics (CFD), field and wind-tunnel experiments, ventilation indices have been extensively developed and applied to assess the ventilation, and thus, the distribution of pollutants around buildings (see the recent special issue on urban ventilation by Buccolieri and Hang [9]). Street ventilation and pollutant dispersion are influenced by urban obstacles, and in particular, by urban vegetation. Two main effects are induced by vegetation:
- -
- Aerodynamic effects, i.e., trees modify the wind flow around them changing the distribution of pollutants.
- -
- Deposition effects, i.e., a fraction of pollutant is removed from the air by means of pollutant deposition on tree leaves and absorption through stomata.
These effects depend on the type of vegetation (leaf area density (LAD), height, shape, etc.) and their location within the city [10,11]. Vegetation barriers composed by hedges and/or trees located close to a main road were found effective to reduce pollutant concentration behind them [10,12,13]. Reductions in concentration between 15% and 60% were reported by the majority of studies [10]. However, the impact of street trees on pollutant dispersion is more complex and the reduction or increase of pollutant concentration depend on the urban configuration and meteorological conditions. Vos et al. [14] and Gromke and Blocken [15] modeled idealized buildings configurations and found an increase of concentration at pedestrian levels caused by trees. Santiago et al. [16] reported concentration variations at pedestrian level depending on LAD and height of trees within idealized streets. An increase or decrease of concentration in respect to the tree free street case for taller or smaller trees was found, respectively. In general, many modeling studies reported that the increase of concentration due to the aerodynamic effects is more important than the concentration mitigation due to deposition [17,18,19,20]. However, very localized changes in concentration (a decrease or increase higher than 50%) can be induced by trees [15,20]. These concentration variations are mainly caused by changes in the wind flow patterns and thus in the street ventilation. Therefore, it is important to investigate and quantify the impact of street trees on street ventilation and pollutant dispersion. This is particularly important in real neighborhoods where the literature is scarce [19]. The main objective of the present study is to contribute to filling this gap.
The starting point of the present paper is the CFD modeling study carried out in a Pamplona neighborhood indicating that the aerodynamic effects of street trees on pollutant concentration are stronger than deposition [20]. In the present work, we extend the analysis by quantifying the variation of street ventilation in several scenarios, without trees and considering trees with different leaf area density (LAD). The impact of tree foliage on urban air quality is thus analyzed, which could provide useful information to urban planners for the selection of suitable vegetation. Wind speed, flow rate and total pollutant fluxes across lateral sides and tops of the street are computed to evaluate changes between the different scenarios. Some of these variables were previously published in the literature to evaluate city ventilation [19,21,22]. These are relevant in order to establish simple relationships between the presence of vegetation, ventilation variation and pollutant concentration change.
2. Methodology
2.1. The Study Area
The study area is a portion of 1.3 km × 1.3 km of the II Ensanche neighborhood in Pamplona, Spain (Figure 1a). Building heights range from 11 m to 50 m, even if most of the buildings have the same height with a mean value of 20 m. The plan area density of the whole neighborhood is 0.42, however in the center of the neighborhood (around the tree-free street) it reaches up to 0.67. In this zone, the aspect ratio between building height and width of street ranges from 1.3 and 1. The value corresponding to the street analyzed is 1. An air quality monitoring station (AQMS) managed by the Regional Government of Navarra is located in a square in the center of the neighborhood (Figure 1a). This station, called Plaza de la Cruz (PC), is the only monitor station in the city and it is classified as traffic station. Small parks and trees within most of streets are present in this zone covering 13.8% of the plan area (i.e., the extent of vegetation projected in a horizontal plane respect to the total plan area of the streets and squares). The mean height of trees ranges from 5 m to 12 m as estimated with satellite images from Google Earth®. In this neighborhood, there is a tree-free street (Tafalla Street) where the possible impact of trees on ventilation is simulated and evaluated by including new trees (Figure 1), see Section 2.3.
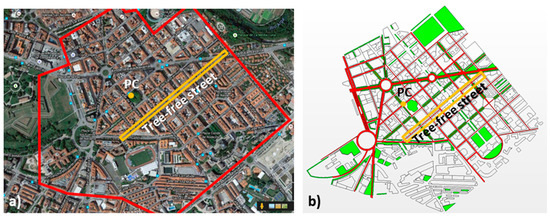
Figure 1.
(a) Modeled area of the Pamplona neighborhood, with indication of the traffic air quality monitoring station called Plaza de la Cruz (PC) and the study tree-free street (Tafalla Street) where the ventilation is evaluated. (b) A sketch of the area of interest including emissions (red) and trees (green).
2.2. Summary of the Previous Analysis
The role of trees on airborne pollutant dispersion in the study area of the present work was previously investigated by Santiago et al. [20]. The previous study was focused on determining the influence of aerodynamic and deposition effects of vegetation on NOx concentration in a real neighborhood. Vegetation scenarios with two LAD values (0.1 and 0.5 m2 m−3) were simulated by means of CFD modeling. The increase of tree-foliage induces not only a greater deposition, but also a greater change in street ventilation. For LAD = 0.1 m2 m−3, the reduction of the spatial-averaged concentration at 3 m height due to deposition was small, less than 2% for a very high deposition velocity (0.03 m s−1). For LAD = 0.5 m2 m−3, this reduction was slightly higher (6.9% for the same deposition velocity). However, the increase of concentration due to aerodynamic effects was greater than the decreasing of concentration due to deposition. Comparing scenarios with both LAD values, spatial-averaged concentration was always higher for the highest LAD values regardless deposition velocity. In addition, the tree-free street (Tafalla Street in Figure 1) was modeled with and without trees. The inclusion of the trees in the middle of that street modified the wind flow and the distribution of pollutant, not only in that street, but also changed significantly the pollutant concentration in nearby locations. In some zones, the concentration increased with the new trees but decreased in others. This finding suggested that planting trees with this configuration in a street with traffic as an air pollution reduction strategy was not appropriate in general, highlighting the necessity of ad hoc studies for each particular case to select the suitable location of new vegetation.
2.3. Extension of the Analysis to Flow, Turbulence and Ventilation
In this paper, the work was extended by assessing the effects of trees within the study street on average concentration, mean flow, turbulence and street ventilation. Four scenarios, two locations of vegetation and two LAD values for each location, were investigated by means of CFD modeling (Table 1). The current location of vegetation did not include trees in the Tafalla Street, while trees were present in other streets of the neighborhood. On the other hand, the scenarios with new trees consisted in the current location of vegetation where new trees were located in the center of the Tafalla Street. The crowns of these trees were placed at the same height as those in the parallel street (from 4 m to 10 m tall). For each location of vegetation, two LAD values for all trees in the study area (0.1 m2 m−3 for deciduous trees and 0.5 m2 m−3 for evergreen trees, respectively) were considered. The deposition was neglected since the goal was to investigate the aerodynamic effects of the new trees.

Table 1.
Scenarios investigated by computational fluid dynamic (CFD) simulations.
The study was focused on the worst case in terms of air quality, i.e., meteorological and emission conditions corresponding to 8 a.m. of an average winter day. Data from PC AQMS indicated that concentration during winter at this hour, which corresponded to the highest traffic emissions, were higher than in other seasons. For an average day of winter, the concentration at this hour was around 100 µg m−3, while in summer it was around 40 µg m−3 [23]. March 2016 was also selected because LAD was found to be low (0.1 m2 m−3), and nitrogen oxides (NOx) levels were still high. Typical meteorological conditions (i.e., in terms of prevailing wind direction, from Northwest, and average wind speed) at this hour were computed from meteorological data recorded at the closest station to the study area. The meteorological station (Pamplona-GN) from the Regional Government of Navarra network was located within less than 1 km of distance.
To analyze the ventilation in the Tafalla street, a prism composed by 4 lateral planes was selected (Planes 1–2 were parallel to the street and 3–4 were perpendicular to the street) and a plane in the top (Plane 5) (Figure 2). Specifically, Plane 1 was the upwind plane of the study street, Plane 2 was the downwind one, Planes 3 and 4 were the lateral planes and Plane 5 was the street-roof plane. Note that the buildings had different heights and Plane 5 was located 1 m above the tallest building (z = 28 m). Northwest was the prevalent wind direction, which was almost perpendicular to the street axis (Figure 2), and then it was expected that most part of the air flow entered into the street through Plane 1.
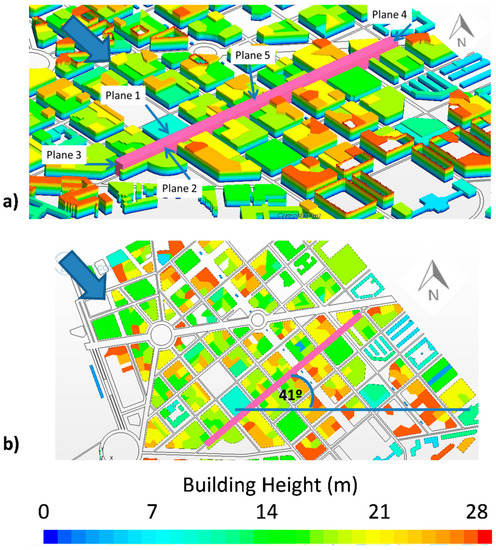
Figure 2.
(a) Planes used for street ventilation assessment of the study street. (b) Indication of the study street orientation (right), where the blue arrow indicates the prevailing wind direction.
At each plane of the street, the average of the velocity perpendicular to each plane () and the average flow rate (q) were computed as follows [21]:
where S is the area of the plane, is the wind velocity and is the unit vector perpendicular to each plane. In this paper, q is discussed in percentage, i.e., q at each plane divided by the total q entering the street.
In addition, at these planes pollutant mass fluxes due to mean flow (Fm) and to turbulent fluctuations (Ft) were calculated as follows [19,22]:
where C(x,y,z) is the pollutant concentration at coordinates (x,y,z) corresponding to the grid cell at the planes previously defined, Kc is the turbulent diffusivity of pollutant and n is the normal to each plane. The total pollutant mass flow rates at each plane due to mean flow (TFm) and to turbulent fluctuations (TFt) were computed as:
Negative values indicate air flow leaving the street and positive values air entering the street. The same criteria were adopted for pollutant mass flow rates.
Finally, to analyze the tree effects within the street canyon, vertical profiles of spatially-averaged concentration, wind velocity components and turbulent kinetic energy (TKE) inside the street canyon were computed for all the studied scenarios.
3. CFD Simulation Setup
The CFD model used was based on Reynolds-averaged Navier–Stokes (RANS) equations with realizable k-ε turbulence model. The aerodynamic effects of vegetation were modeled by means of a sink of momentum () and sinks/sources of turbulent kinetic energy () and turbulent dissipation rate () equations as follows [16]:
where is the air density, is the appropriate wind velocity component, U is the wind speed and is the sectional drag for vegetation (dimensionless). βp is the fraction of mean kinetic energy converted into turbulent kinetic energy by means of drag and takes the value of 1. βd is the dimensionless coefficient for the short-circuiting of the turbulence cascade and and are model constants. Their values were computed based on analytical formulation of [24] as follows:
where α, , , , and values are 0.09, 1, 1.3, 1.44, and 1.92, respectively.
In this study the thermal effects of trees were neglected.
Dispersion of NOx was performed by means of a transport equation. Traffic emissions were distributed along each street considering road widths (number of lanes) and an emission height of 1 m in order to take the initial dispersion into account. Emissions were considered proportional to annual average daily traffic throughout each street.
The computational domain was built following the COST (European Cooperation in Science & Technology) Action 732 best practice guidelines [25,26]. The distance between buildings and outlet and inlet boundaries was larger than 8 times the building heights and the top of domain was located 7 times the height of the tallest building (50 m). Based on grid sensitivity tests, the domain was discretized using 7.4 × 10⁶ cells. In the study area, the grid resolution was 2.7 m approximately, with ad hoc refinements in the narrowest streets and close to the walls (cell sizes of about 1 m). A sketch of numerical domain and mesh is shown in Figure 3. Buildings and ground were modeled as walls and symmetry conditions (zero normal velocity and zero normal gradients of all variables) were imposed at the top of domain. Neutral inlet profiles of velocity, turbulent kinetic energy and its dissipation were used:
where is the friction velocity and κ is von Karman’s constant (=0.4). These profiles were widely used as inlet profiles in CFD simulations over real urban environments [27,28,29,30]. Further details can be found in Santiago et al. [20].
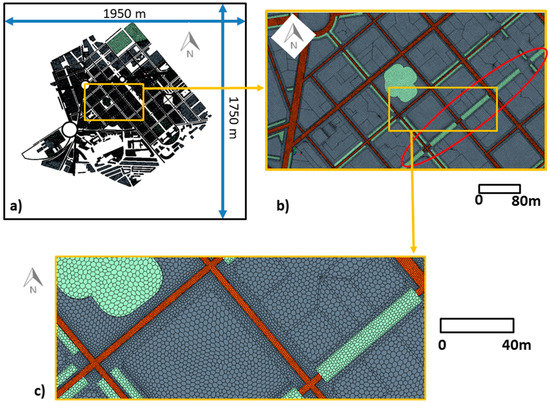
Figure 3.
(a) Sketch of the CFD computational domain. (b) Details of geometry and new tress scenario (red line). (c) Details of mesh. Orange squares indicate the zone where zoom is done.
Evaluation of the Modeling Approach Used in the Present Study
The objective of this section was to demonstrate that the modeling approach used in the present study was appropriate. The model performance to reproduce wind flow and pollutant dispersion was previously evaluated by Krayenhoff et al. [31], Santiago et al. [16] and Santiago et al. [20].
To evaluate the vegetation parameterization implemented in the CFD model, the wind flow at continuous “forest” (measurements taken far downstream of the forest to avoid edge effects) and forest-clearing configurations were simulated and compared with wind-tunnel data [32,33]. In particular, vertical profiles of mean wind speed and TKE at different locations were used in the comparison. The model reproduced qualitatively the observed trends in all locations with better agreement for wind speed than for TKE. In addition, these results of our model were also compared with results from another RANS model [34] and a large eddy simulation (LES) [35]. Similar performance was obtained by all models and it was found that the results, especially TKE, were sensitive to the value of and its optimal value depended on the case. Therefore, it was concluded that our expressions to represent vegetation in the CFD model (Equations (7)–(11)) were appropriate. For further details the readers are referred to [31].
In addition, the performance of the current model was evaluated in urban environments with vegetation by using the CODASC wind-tunnel dataset (Concentration Data of Street Canyons, http://www.windforschung.de/CODASC.htm) [36,37]. Pollutant dispersion within an isolated street canyon with and without vegetation was studied for airflow perpendicular to the axis of the street. The street canyon was composed of two buildings with the same height (H). The ratio between building height and width of the street (W) was 1 and between length of the street (L) and width of the street was 10. Pollutant was emitted by a line source at ground that protruded from the street canyon 10% approximately on each side. Two different vegetation porosities were simulated with pressure loss coefficient (λ) values of 80 and 200 m−1 at wind-tunnel scale (0.53 and 1.33 m−1 at full scale). These λ values corresponded to LAD values of 2.6 and 6.6 m2 m−3 assuming 0.2 as the drag coefficient value. Vegetation was located along the street with the tree top at the roof level and with a dimension of 0.5 H × 0.66 H × 10 H (streamwise × vertical × lateral). Observed and modeled pollutant concentration were compared at different locations close to both walls of the street canyon. Model evaluation was quantified by computing the following statistical metrics: fraction of predictions within a factor of two of observations (FAC2), the fractional bias (FB), the root-normalized mean-square error (RNMSE) and the correlation coefficient (R). For the three scenarios (one without vegetation and two with vegetation with different porosities), the statistical metric values (0 > FB > −0.06, RNMSE < 0.41, R > 0.89 and FAC2 > 0.91) indicated a good agreement with experimental data with a slight overestimation of concentration. Similar model performance was obtained for other RANS [38,39,40] and LES [41] studies. These results showed our model was able to reproduce concentration patterns within a street canyon with and without vegetation. Therefore, Equations 7–11 were appropriate for modeling aerodynamic effects of vegetation within urban environments. For further details the readers are referred to [16].
Finally, NOx concentration within the Pamplona neighborhood studied in the current work was evaluated by using data from PC AQMS. The limitation of that evaluation was that measurements was only available at only one point (PC). Hourly NOx concentration during two weeks in March 2015 (from 1st to 14th) was modeled and compared with concentration recorded at PC AQMS. The LAD value of 0.1m2 m−3 was considered for all trees. Unsteady CFD simulations of two weeks was not affordable due to large computational cost. For this reason, the methodology WA CFD-RANS (weighted average CFD-RANS simulations) [20,30,42] was employed. It used CFD simulations for several meteorological conditions and assumed the concentration was inversely proportional to wind speed. Depending on the wind speed and direction measured by the meteorological station close to the neighborhood, at each hour the corresponding CFD simulation was selected and the concentration was computed. A good correlation (R = 0.71) between observed and modeled concentration time series was found. In addition, the statistical metric values (NMSE = 0.27; FAC2 = 0.73) indicated a good agreement between monitored and modeled concentration. Therefore, the modeling approach used was able to reproduce pollutant dispersion within the investigated area. For further details the readers are referred to [20].
4. Results
4.1. Spatially-Averaged Concentration over the Whole Neighborhood
To better explain the concentration changes due to the presence of trees, the scenarios described in Table 1 (without deposition) were analyzed. Table 2 shows the spatially-averaged concentration at 3 m height calculated over the whole neighborhood and over the study street. Considering the whole neighborhood, the inclusion of new trees produced changes in the spatially-averaged concentration less than 0.09% and 0.18% for LAD = 0.1 m2 m−3 and 0.5 m2 m−3, respectively. However, the average concentration depended on LAD and, in particular, it increased from 105 µg m−3 to 113 µg m−3 (an increase of about 7.6%) as LAD rose from 0.1 m2 m−3 to 0.5 m2 m−3. Therefore, the inclusion of new trees in the study street had a slight impact on the average concentration over the whole neighborhood, suggesting that the effect of new trees was local and related to the street ventilation as discussed in the next subsection. Additionally, it should be also taken into account that new trees were only 7% of the total plan area covered by vegetation in the whole neighborhood. However, the increase of LAD from 0.1 m2 m−3 to 0.5 m2 m−3 implied five times more tree leaves throughout the neighborhood. Consequently, it gave rise to a greater impact on the average concentration because drag forces and sinks/sources of turbulence, which were responsible for the changes of the wind flow and pollutant dispersion, were five times stronger since they were proportional to LAD (Equations (7)–(9)).

Table 2.
Spatially-averaged concentration at 3 m.
4.2. Spatially-Averaged Concentration in the Tafalla Street
To investigate the concentration within Tafalla Street and its relation with the ventilation, it should be taken into account that the concentration within this street was not only due to local emissions, but also to pollutants released in other streets and transported to this street. Further, the vegetation had an impact on both contributions. Focusing on the current scenarios (tree-free street), the spatially-averaged concentration within this street at 3 m height (pedestrian level) increased up to 1.3% as LAD increased (Table 2). New trees in the study street induced local changes in this street and its surroundings, however Table 2 shows that only planting new trees with LAD = 0.5 m2 m−3 significantly modified the average concentration over this street. Specifically, for LAD = 0.1 m2 m−3 the spatially-averaged concentration within this street at 3 m height increased up to 1.8% when new trees were considered, while for LAD = 0.5 m2 m−3 this concentration variation reached up to 12%. Therefore, only the new trees with LAD = 0.5 m2 m−3 modified the street ventilation significantly. For the lowest LAD values, the change of street ventilation due to new trees was smaller. In addition, the change of tree foliage of vegetation outside of Tafalla Street induced slight changes on the pollutants transported to that street.
In order to extend this analysis to the whole vegetation canopy depth, the street morphology (Figure 4) and the vertical profiles of spatially-averaged concentration over this street (Figure 5) were investigated. Regarding the street morphology, the width of the street was 16 m and most of buildings were 18 m height approximately. However, the street height (Figure 2a) was considered up to the tallest building height (27 m). In addition, Figure 5b shows the vertical profiles of normalized concentration. Normalized concentration was computed as , where C is the concentration, is the reference wind speed, taken as inlet wind speed at 10 m height (Equation (12)), is the area of emissions and Q is the constant emission rate. From 1.5 m height up to about 18 m, notably higher concentration was found for LAD05_NewTrees scenario. Then, the concentration vertical profiles were divided into three zones: (a) bottom part (up to 12 m approximately) located below trees (vegetation canopy); (b) from 12 m up to mean building height (18 m approximately), where pollutant dispersion is notably affected by buildings (building canopy); and (c) from mean building height up to the maximum building height (27 m), where the influence of buildings on pollutant dispersion was smaller and it was considered to be almost outside of the urban canopy. Comparing the LAD05 and LAD05_NewTrees scenarios, the differences of spatially-averaged concentration at each height decreased as height increases. Below the vegetation canopy (below 10 m), these differences in average concentration were almost vertically constant, between 17.3 and 14.9 µg m−3 (between 12–13.4%). Above the top of the trees up to the mean building height, these differences decreased and ranged from 12.7 µg m−3 at 12 m to 6.3 µg m−3 at 18 m (from 12.7% to 9.2%). However, the zone where these differences decreased sharply was above the mean building height. Above 24 m, the spatially-averaged concentration profiles were similar (concentration differences below 1µg m−3). Therefore, the decrease of pollutant dispersion induced by the new trees with LAD = 0.5 m2 m−3 was mainly located below the tree top. It is noteworthy to remember, that in these cases, pollutant deposition was neglected.

Figure 4.
Vertical layout of buildings of the study street, with indication of the building height.
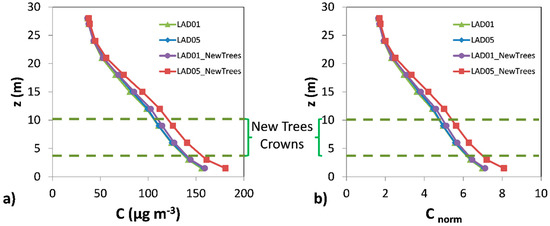
Figure 5.
(a) Vertical profiles of spatially-averaged concentration within the study street. (b) Same as (a) but for normalized concentration (). Green dashed lines indicate the crown location of the new trees located in the study street.
4.3. Wind Flow Patterns and Ventilation in Tafalla Street
The impact of trees on pollutant dispersion and final concentration in the study street (Tafalla Street) is here explained by analyzing the wind flow patterns and the ventilation. Figure 6, Figure 7, Figure 8, Figure 9, Figure 10, Figure 11, Figure 12 and Figure 13 show the wind flow for the four scenarios at 3 m and 9 m height, respectively. In these figures, the vector color indicates the normalized wind speed (), which is computed as , where is the wind speed and is the inlet wind speed at 10 m height. Wind flow patterns were similar for all cases, however for LAD = 0.5 m2 m−3 wind speed of the fifth street perpendicular to the study street slightly decreased at both heights (Figure 6, Figure 7, Figure 8, Figure 9, Figure 10, Figure 11, Figure 12 and Figure 13). The channeling throughout this street was higher than that through the other perpendicular streets, then for LAD05 and LAD05_NewTrees the flow rate through Plane 1 (Figure 6, Figure 7, Figure 8, Figure 9, Figure 10, Figure 11, Figure 12 and Figure 13) tended to decrease. Additionally, in these cases, the part of the flow which entered the street through Plane 4 (Figure 6, Figure 7, Figure 8, Figure 9, Figure 10, Figure 11, Figure 12 and Figure 13) increased. The main wind flow changed due to the new trees found in the fourth street perpendicular to the study street. In all cases, flow departed the street through Plane 1 (Figure 6 and Figure 7), however wind speed decreased within this street in the new-trees scenarios, in particular when LAD = 0.5 m2 m−3. In addition, for this scenario (LAD05_NewTrees), it was also observed that the wind speed along the study street was slightly lower in comparison with other scenarios.
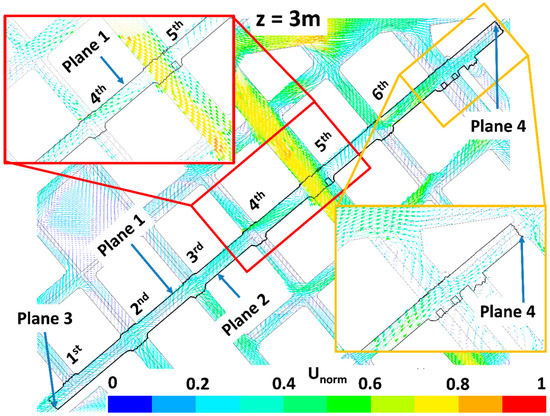
Figure 6.
Wind flow at 3 m height for LAD01 scenario. Zooms focused on the fourth and fifth streets perpendicular to the study street and on the Plane 4 are done.
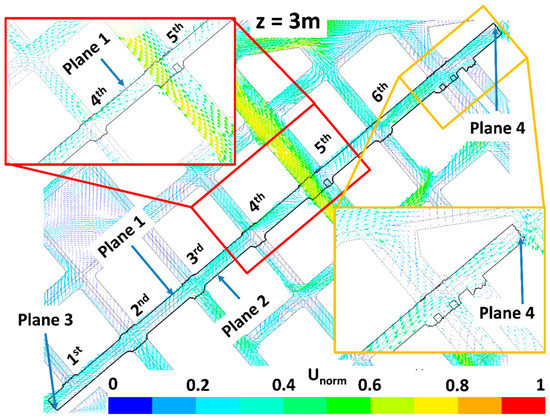
Figure 7.
Same as Figure 6 but for the LAD05 scenario.
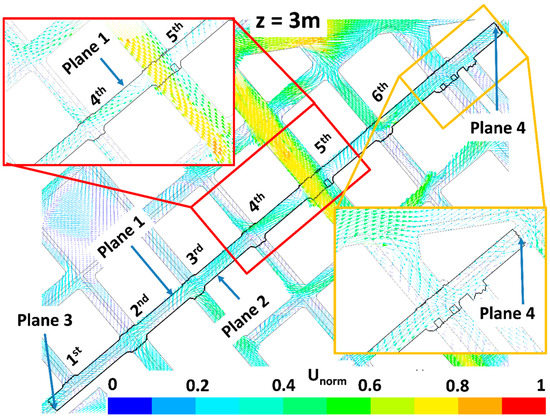
Figure 8.
Same as Figure 6 but for the LAD01_NewTrees scenario.
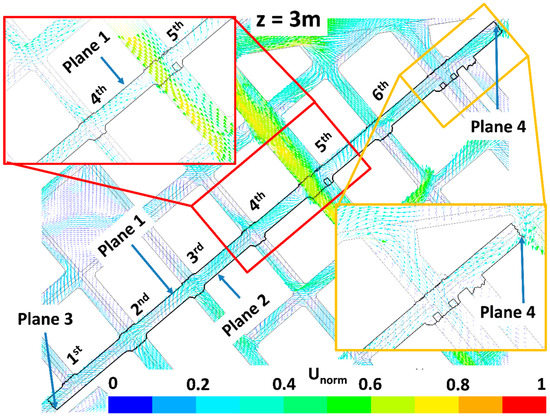
Figure 9.
Same as Figure 6 but for the LAD05_NewTrees scenario.
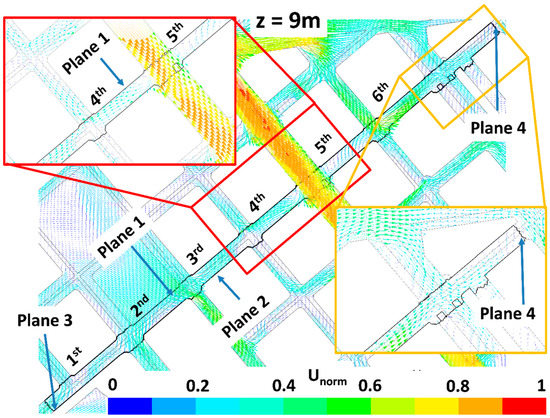
Figure 10.
Wind flow at 9 m height for LAD01 scenario. Zooms focused on the fourth and fifth streets perpendicular to the study street and on the Plane 4 are done.
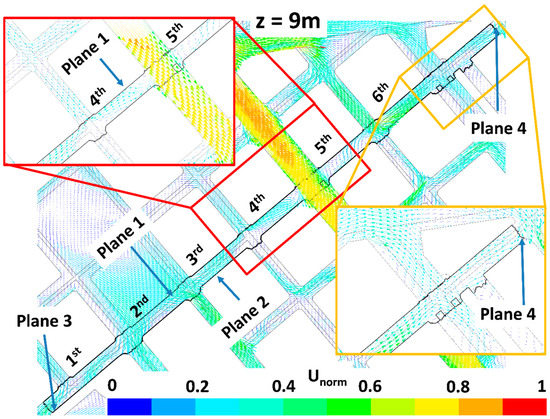
Figure 11.
Same as Figure 10 but for the LAD05 scenario.
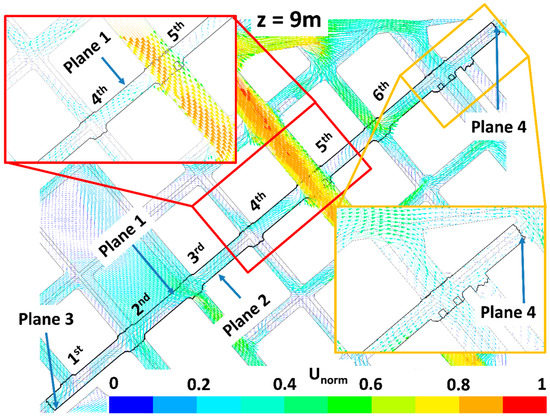
Figure 12.
Same as Figure 10 but for the LAD01_NewTrees scenario.
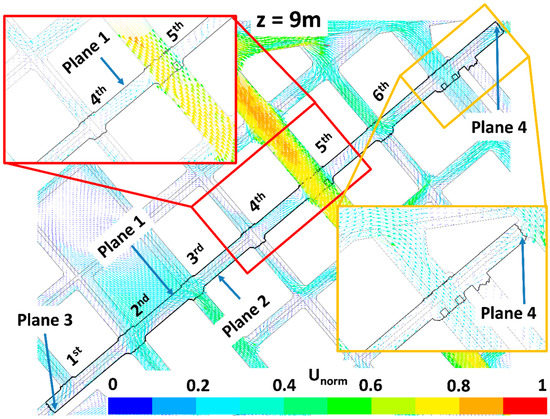
Figure 13.
Same as Figure 10 but for the LAD05 scenario.
The street ventilation was thus assessed in order to relate the changes in concentration with changes of the street ventilation. Table 3 shows the average of the velocity perpendicular to each plane and the average flow rates q. The average flow rates are presented in percentage in respect to the total average flow rate that enters the street in each case. In general, with the prevailing wind direction (Northwest) being almost perpendicular to the street, most of the flow entered through Plane 1, as shown from the positive values of the flow rates which were equal or close to 100%. As LAD increased, the average perpendicular velocity at the upwind plane decreased (from 1.49 to 1.47 m s−1 for the current scenarios and from 1.50 to 1.48 m s−1 for the new trees scenarios). Then, the flow rate through Plane 1 was lower for LAD = 0.5 m2 m−3 scenarios, as expected from the wind flow patterns previously discussed. Additionally, the inclusion of new trees slightly increased (<0.7%) the perpendicular velocity through Plane 1. This was related with the reduction of wind speed of the flow leaving the study street through the fourth perpendicular street by Plane 1, previously discussed for new trees scenarios, and thus less air flow leaving the street by Plane 1 and in general, it was higher. In addition, the flow through the lateral planes (Planes 3 and 4) of the street was influenced by changes in vegetation. Through Plane 4, the flow entered the street only for both LAD = 0.5 m2 m−3 scenarios and for the new-trees scenario with LAD = 0.1 m2 m−3. However, the flow rate was four times higher for the highest LAD scenarios. Through Plane 3, the flow leaving the street decreased when new trees were in the street. In particular, it decreased up to 40% and 20% approximately for LAD = 0.5 m2 m−3 and 0.1 m2 m−3, respectively. At Plane 5 (roof), the flow departed the street with similar wind speed in all cases.

Table 3.
Average perpendicular velocity Vn and percentages of the total flow rates at each plane.
In general, it can be noted that the wind flow variations due to vegetation induced changes in pollutant fluxes entering and leaving the street. However, the changes of pollutant fluxes were not proportional to the changes of flow rate in some zones. For example, the flow rate through Plane 1 was higher for the current scenario with LAD = 0.1 m2 m−3 than for the new-trees scenario with LAD = 0.5 m2 m−3, however, this behavior was opposite for the total pollutant fluxes through this plane. This was due to the traffic emission heterogeneities in the real cases, as assumed in the present work. For example, the fifth perpendicular street perpendicular to the study street was a pedestrian street and without traffic emissions. Table 4 shows that pollutant mass flow rates due to mean flows were higher than those due to turbulent fluctuations. The addition of both contributions was used to analyze the transport of pollutants entering or leaving the study street. Through Plane 1, similar to the flow rates, the total pollutant mass flow rates (TF) were higher with LAD = 0.1 m2 m−3 and they increased in the new trees scenarios. However, this increase was notably higher for LAD = 0.5 m2 m−3 (3.4%) than for LAD = 0.1 m2 m−3 (2%). Additionally, it should be taken into account that the pollutants transported inward to the street through Plane 4 where this contribution was higher for LAD = 0.5 m2 m−3. Table 5 shows the total pollutant mass flow rate entering the street for each scenario. The total pollutant flux entering the street was higher for the new trees scenario and for LAD = 0.5 m2 m−3. This fact was important because it implied that the new trees in a street induced changes in the total pollutant fluxes entering the street.

Table 4.
Total pollutant fluxes at each plane due to mean flow (TFm), turbulent fluctuations (TFt) and both contributions (TF).

Table 5.
Total pollutant fluxes inward on the study street.
Finally, the pollutant dispersion within the street was analyzed through the spatially-averaged wind flow properties within the street at different heights. Figure 14 shows the vertical profiles of the spatially-averaged wind speed normal to the street (Vn), wind speed parallel to the street (Vp), vertical wind speed (W) and turbulent kinetic energy (TKE). Vn, Vp and W were normalized by and TKE was normalized by . The new trees modified vertical and parallel wind speeds and turbulent kinetic energy. Spatially-averaged parallel wind speed decreased for new trees scenarios, especially within the vegetation canopy which gave rise to an impact on wind flow and on the mass exchange between the street and outside. This fact increased the residence time of pollutants within the street and consequently increased the concentration. Vertical wind speed was negative within and below the vegetation canopy and its magnitude was lower for New Trees scenarios. However, above the new trees, the vertical wind speed (upward motion) was higher than those obtained for scenarios with the free-tree street. The new trees scenarios caused also a decrease of turbulent kinetic energy within the vegetation canopy, and consequently reduced pollutant dispersion. The decrease was more pronounced for the LAD05_NewTrees scenario.
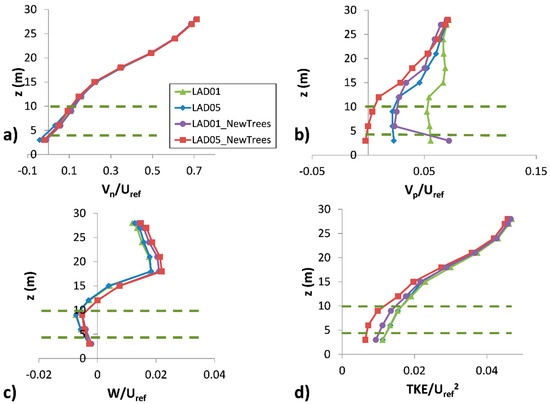
Figure 14.
Vertical profiles of spatially-averaged flow properties within the study street. (a) Normalized wind speed normal to the street (Vn/); (b) normalized wind speed parallel to the street (Vp/); (c) normalized vertical wind speed (W/); (d) normalized turbulent kinetic energy (TKE/). Dashed lines indicate the crown location of new trees.
5. Conclusions
The main objective of this study was to quantify the impact of street trees on street ventilation and pollutant dispersion. For this goal, the ventilation and the spatially-averaged concentration at pedestrian level computed over a neighborhood of Pamplona and in a specific street were analyzed for different vegetation scenarios. Four scenarios, two different vegetation deployments and two LAD values for each deployment were studied. Vegetation scenarios with and without trees in the study street were considered. For these scenarios, the influence of the average flow properties on spatially-averaged concentration was investigated. Only aerodynamic effects were considered in the present work. Results showed that the influence of planting new trees was negligible on the average pollutant concentration of the whole neighborhood. However, it induced a local increase of the average concentration through the street analyzed, which rose up to 12% for dense trees (LAD = 0.5 m2 m−3). This was due to:
- The increase of total pollutant mass flow rates entering the street;
- The change of the ventilation. In fact, the average wind speed parallel to the street (parallel ventilation) and the downward vertical wind speed within the new vegetation canopy were reduced with respect to tree-free street scenarios. This fact implied a weaker ventilation within and below the vegetation canopy. Further, the turbulent kinetic energy decreased within and below the new vegetation canopy, and consequently reduced the pollutant dispersion.
The changes of wind flow depended on building layout and vegetation configuration. This study was performed over a real neighborhood with a regular distribution of buildings and characterized by a plan area density of 0.42. Focusing on the zone around the study street, the plan area increased up to 0.67 and the aspect ratio between building height and street width ranged from 1.3 and 1. Results could thus be extrapolated to similar urban settings in other cities with similar morphological characteristics, such as several European cities.
In conclusion, the paper has shown that planting new trees in a tree-free street should be done by considering ventilation changes, and traffic emissions should be consequently controlled in order to keep pollutant concentration within healthy levels. These results and methodology could be useful for urban planners to build sustainable design of vegetation within streets.
Author Contributions
Conceptualization, J.-L.S., E.R. and F.M.; simulations, E.R., J.-L.S.; methodology, J.-L.S., E.R., F.M., A.M., B.S. and R.B.; formal analysis, J.-L.S. and R.B.; writing—original draft, J.-L.S. and R.B.; writing—review and editing, E.R., B.S., A.M., E.G. and F.M.
Funding
The authors thank to the support of the projects: LIFE + RESPIRA (LIFE13 ENV/ES/000417) funded by EU, RETOS-AIRE (RTI2018-099138-B-I00) and EXCLUR (CGL2016-80154-R) funded by Spanish Ministry of Science, Innovation and Universities and AIRTEC-CM (S2018/EMT-4329) funded by Regional Government of Madrid.
Acknowledgments
The authors thank Rocio Alonso for her assistance with the revision of the paper.
Conflicts of Interest
The authors declare no conflict of interest.
References
- Weissert, L.F.; Salmond, J.A.; Schwendenmann, L. A review of the current progress in quantifying the potential of urban forests to mitigate urban CO2 emissions. Urban Clim. 2014, 8, 100–125. [Google Scholar] [CrossRef]
- Salmond, J.A.; Tadaki, M.; Vardoulakis, S.; Arbuthnott, K.; Coutts, A.; Demuzere, M.; Dirks, K.N.; Heaviside, C.; Lim, S.; Macintyre, H.; et al. Health and climate related ecosystem services provided by street trees in the urban environment. Environ. Health 2016, 15, 95–111. [Google Scholar] [CrossRef] [PubMed]
- Santamouris, M.; Ban-Weiss, G.; Osmond, P.; Paolini, R.; Synnefa, A.; Cartalis, C.; Muscio, A.; Zinzi, M.; Morakinyo, T.; Ng, E.; et al. Progress in urban greenery mitigation science—Assessment methodologies advanced technologies and impact on cities. J. Civ. Eng. Manag. 2018, 24, 638–671. [Google Scholar] [CrossRef]
- Escobedo, F.J.; Giannico, V.; Jim, C.Y.; Sanesi, G.; Lafortezza, R. Urban forests, ecosystem services, green infrastructure and nature-based solutions: Nexus or evolving metaphors? Urban For. Urban Green. 2019, 37, 3–12. [Google Scholar] [CrossRef]
- Renterghem, T.V. Towards explaining the positive effect of vegetation on the perception of environmental noise. Urban For. Urban Green. 2019, 40, 133–144. [Google Scholar] [CrossRef]
- Pearlmutter, D.; Calfapietra, C.; Samson, R.; O’Brien, L.; Krajter Ostoic, S.; Sanesi, G.; Alonso del Amo, R. The Urban Forest: Cultivating Green Infrastructure for People and the Environment; Future City 7; Springer: Berlin, Germany, 2017; ISBN 978-3-319-50279-3. [Google Scholar]
- Janhäll, S. Review on urban vegetation and particle air pollution—Deposition and dispersion. Atmos. Environ. 2015, 105, 130–137. [Google Scholar] [CrossRef]
- Ramponi, R.; Blocken, B.; de Coo, L.B.; Janssen, W.D. CFD simulation of outdoor ventilation of generic urban configurations with different urban densities and equal and unequal street widths. Build. Environ. 2015, 92, 152–166. [Google Scholar] [CrossRef]
- Buccolieri, R.; Hang, J. Recent advances in urban ventilation assessment and flow modelling. Atmosphere 2019, 10, 144. [Google Scholar] [CrossRef]
- Abhijith, K.V.; Kumar, P.; Gallagher, J.; McNabola, A.; Baldauf, R.; Pilla, F.; Broderick, B.; Di Sabatino, S.; Pulvirenti, B. Air pollution abatement performances of green infrastructure in open road and built-up street canyon environments—A review. Atmos. Environ. 2017, 162, 71–86. [Google Scholar] [CrossRef]
- Buccolieri, R.; Santiago, J.L.; Rivas, E.; Sanchez, B. Review on urban tree modelling in CFD simulations: Aerodynamic, deposition and thermal effects. Urban For. Urban Green. 2018, 31, 212–220. [Google Scholar] [CrossRef]
- Gallagher, J.; Baldauf, R.; Fuller, C.H.; Kumar, P.; Gill, L.W.; McNabola, A. Passive methods for improving air quality in the built environment: A review of porous and solid barriers. Atmos. Environ. 2015, 120, 61–70. [Google Scholar] [CrossRef]
- Santiago, J.-L.; Buccolieri, R.; Rivas, E.; Calvete-Sogo, H.; Sanchez, B.; Martilli, A.; Alonso, R.; Elustondo, D.; Santamaría, J.M.; Martin, F. CFD modelling of vegetation barrier effects on the reduction of traffic-related pollutant concentration in an avenue of Pamplona, Spain. Sustain. Cities Soc. 2019, 48, 101559. [Google Scholar] [CrossRef]
- Vos, P.E.; Maiheu, B.; Vankerkom, J.; Janssen, S. Improving local air quality in cities: To tree or not to tree? Environ. Pollut. 2013, 183, 113–122. [Google Scholar] [CrossRef] [PubMed]
- Gromke, C.; Blocken, B. Influence of avenue-trees on air quality at the urban neighborhood scale. Part II: Traffic pollutant concentrations at pedestrian level. Environ. Pollut. 2015, 196, 176–184. [Google Scholar] [CrossRef] [PubMed]
- Santiago, J.-L.; Martilli, A.; Martin, F. On Dry Deposition Modelling of Atmospheric Pollutants on Vegetation at the Microscale: Application to the Impact of Street Vegetation on Air Quality. Bound.-Layer Meteorol. 2017, 162, 451–474. [Google Scholar] [CrossRef]
- Jeanjean, A.P.; Monks, P.S.; Leigh, R.J. Modelling the effectiveness of urban trees and grass on PM2.5 reduction via dispersion and deposition at a city scale. Atmos. Environ. 2016, 147, 1–10. [Google Scholar] [CrossRef]
- Jeanjean, A.P.; Buccolieri, R.; Eddy, J.; Monks, P.S.; Leigh, R.J. Air quality affected by trees in real street canyons: The case of Marylebone neighbourhood in central London. Urban For. Urban Green. 2017, 22, 41–53. [Google Scholar] [CrossRef]
- Buccolieri, R.; Jeanjean, A.P.R.; Gatto, E.; Leigh, R.J. The impact of trees on street ventilation, NOx and PM2.5 concentrations across heights in Marylebone Rd street canyon, central London. Sustain. Cities Soc. 2018, 41, 227–241. [Google Scholar] [CrossRef]
- Santiago, J.L.; Rivas, E.; Sanchez, B.; Buccolieri, R.; Martin, F. The impact of planting trees on NOx concentrations: The case of the Plaza de la Cruz neighborhood in Pamplona (Spain). Atmosphere 2017, 8, 131. [Google Scholar] [CrossRef]
- Buccolieri, R.; Sandberg, M.; Di Sabatino, S. City breathability and its link to pollutant concentration distribution within urban-like geometries. Atmos Environ. 2010, 44, 1894–1903. [Google Scholar]
- Hang, J.; Li, Y.; Buccolieri, R.; Sandberg, M.; Di Sabatino, S. On the contribution of mean flow and turbulence to city breathability: The case of long streets with tall buildings. Sci. Total Environ. 2012, 416, 362–373. [Google Scholar] [CrossRef] [PubMed]
- Rivas, E.; Santiago, J.L.; Lechón, Y.; Martín, F.; Ariño, A.; Pons, J.J.; Santamaría, J.M. CFD modelling of air quality in Pamplona City (Spain): Assessment, stations spatial representativeness and health impacts valuation. Sci. Total Environ. 2019, 649, 1362–1380. [Google Scholar] [CrossRef] [PubMed]
- Sanz, C. A note on k − ε modeling of vegetation canopy air-flows. Bound.-Layer Meteorol. 2003, 108, 191–197. [Google Scholar] [CrossRef]
- Franke, J.; Schlünzen, H.; Carissimo, B. Best Practice Guideline for the CFD Simulation of Flows in the Urban Environment. In COST Action 732—Quality Assurance and Improvement of Microscale Meteorological Models; University of Hamburg (Germany), Meteorological Institute: Hamburg, Germany, 2007; ISBN 3-00-018312-4. [Google Scholar]
- Di Sabatino, S.; Buccolieri, R.; Olesen, H.R.; Ketzel, M.; Berkowicz, R.; Franke, J.; Schatzmann, M.; Schlunzen, K.; Leitl, B.; Britter, R.; et al. COST 732 in practice: The MUST model evaluation exercise. International. J. Environ. Pollut. 2011, 44, 403–418. [Google Scholar] [CrossRef]
- Richards, P.J.; Hoxey, R.P. Appropriate boundary conditions for computational wind engineering models using the k-ϵ turbulence model. J. Wind Eng. Ind. Aerodyn. 1993, 46, 145–153. [Google Scholar] [CrossRef]
- Buccolieri, R.; Salim, S.M.; Leo, L.S.; Di Sabatino, S.; Chan, A.; Ielpo, P.; Gromke, C. Analysis of local scale tree–atmosphere interaction on pollutant concentration in idealized street canyons and application to a real urban junction. Atmos. Environ. 2011, 45, 1702–1713. [Google Scholar] [CrossRef]
- Santiago, J.L.; Martín, F.; Martilli, A. A computational fluid dynamic modelling approach to assess the representativeness of urban monitoring stations. Sci. Total Environ. 2013, 454–455, 61–72. [Google Scholar] [CrossRef] [PubMed]
- Santiago, J.L.; Borge, R.; Martin, F.; de la Paz, D.; Martilli, A.; Lumbreras, J.; Sanchez, B. Evaluation of a CFD-based approach to estimate pollutant distribution within a real urban canopy by means of passive samplers. Sci. Total Environ. 2017, 576, 46–58. [Google Scholar] [CrossRef] [PubMed]
- Krayenhoff, E.S.; Santiago, J.L.; Martilli, A.; Christen, A.; Oke, T.R. Parametrization of drag and turbulence for urban neighbourhoods with trees. Bound.-Layer Meteorol. 2015, 156, 157–189. [Google Scholar] [CrossRef]
- Brunet, Y.; Finnigan, J.J.; Raupach, M.R. A wind tunnel study of air flow in waving wheat: Single-point velocity statistics. Bound.-Layer Meteorol. 1994, 70, 95–132. [Google Scholar] [CrossRef]
- Raupach, M.R.; Bradley, E.F.; Ghadiri, H. Wind Tunnel Investigation into the Aerodynamic Effect of Forest Clearing on the Nesting of Abbott’s Booby on Christmas Island; Internal Report; CSIRO Centre for Environmental Mechanics: Canberra, Australia, 1987. [Google Scholar]
- Foudhil, H.; Brunet, Y.; Caltagirone, J.P. A Fine-Scale k−ε Model for Atmospheric Flow over Heterogeneous Landscapes. Environ. Fluid Mech. 2005, 5, 247–265. [Google Scholar] [CrossRef]
- Dupont, S.; Brunet, Y. Edge flow and canopy structure: A large-eddy simulation study. Bound.-Layer Meteorol. 2008, 126, 51–71. [Google Scholar] [CrossRef]
- Gromke, C.; Ruck, B. Influence of trees on the dispersion of pollutants in an urban street canyon-experimental investigation of the flow and concentration field. Atmos. Environ. 2007, 41, 3287–3302. [Google Scholar] [CrossRef]
- Gromke, C.; Ruck, B. On the impact of trees on dispersion processes of traffic emissions in street canyons. Bound.-Layer Meteorol. 2009, 131, 19–34. [Google Scholar] [CrossRef]
- Gromke, C.; Buccolieri, R.; Di Sabatino, S.; Ruck, B. Dispersion study in a street canyon with tree planting by means of wind tunnel and numerical investigations—Evaluation of CFD data with experimental data. Atmos. Environ. 2008, 42, 8640–8650. [Google Scholar] [CrossRef]
- Balczó, M.; Gromke, C.; Ruck, B. Numerical modeling of flow and pollutant dispersion in street canyons with tree planting. Meteorol. Z. 2009, 18, 197–206. [Google Scholar] [CrossRef]
- Vranckx, S.; Vos, P.; Maiheu, B.; Janssen, S. Impact of trees on pollutant dispersion in street canyons: A numerical study of the annual average effects in Antwerp, Belgium. Sci. Total Environ. 2015, 532, 474–483. [Google Scholar] [CrossRef] [PubMed]
- Moonen, P.; Gromke, C.; Dorer, V. Performance assessment of large eddy simulation (LES) for modelling dispersion in an urban street canyon with tree planting. Atmos. Environ. 2013, 75, 66–76. [Google Scholar] [CrossRef]
- Sanchez, B.; Santiago, J.L.; Martilli, A.; Martin, F.; Borge, R.; Quaassdorff, C.; de la Paz, D. Modelling NOx concentrations through CFD-RANS in an urban hot-spot using high resolution traffic emissions and meteorology from a mesoscale model. Atmos. Environ. 2017, 163, 155–165. [Google Scholar] [CrossRef]
© 2019 by the authors. Licensee MDPI, Basel, Switzerland. This article is an open access article distributed under the terms and conditions of the Creative Commons Attribution (CC BY) license (http://creativecommons.org/licenses/by/4.0/).