Abstract
In this study, we have developed a numerical model based on an open source Computational Fluid Dynamics (CFD) package OpenFOAM, in order to investigate the flow pattern and pollutant dispersion in urban street canyons with different geometry configurations. In the new model, the pollutant transport driven by airflow is modeled by the scalar transport equation coupling with the momentum equations for airflow, which are deduced from the Reynolds Averaged Navier-Stokes (RANS) equations. The turbulent flow calculation has been calibrated by various two-equation turbulence closure models to select a practical and efficient turbulence model to reasonably capture the flow pattern. Particularly, an appropriate value of the turbulent Schmidt number has been selected for the pollutant dispersion in urban street canyons, based upon previous studies and careful calibrations against experimental measurements. Eventually, the numerical model has been validated against different well-known laboratory experiments in regard to various aspect ratios (a relationship between the building height and the width of the street canyon), and different building roof shapes (flat, shed, gable and round). The comparisons between the numerical simulations and experimental measurements show a good agreement on the flow pattern and pollutant distribution. This indicates the ability of the new numerical model, which can be applied to investigate the wind flow and pollutant dispersion in urban street canyons.
1. Introduction
Pollution from industrial activities, vehicle exhaust, heating and cooling systems, etc. can cause fatal harms to humans in urban street canyons; therefore the investigation of flow characteristics and pollution transports in urban street canyons is a vital task in the urban environment. The most important characteristics of the flow in street canyons are the wind-induced flow patterns characterized by internal flow, flow separation and reattachment, which effect on the local air quality and consequently human health in urban areas. The study on wind flow and pollutant transport inside and over urban street canyons has attracted great concern during the last three decades due to speedy urbanization and city enlargement. Field measurements and laboratory-scale physical modeling are not only very expensive, but also difficult, and somehow impossible due to the temporal and spatial scales and the complex geometry configurations of urban street canyons. Advantaged from an increase in computer technology (HPC facility), Computational Fluid Dynamics (CFD) becomes the most efficient tool for the simulation of wind flows and pollutant transports in urban street canyons.
In general, the three approaches applied in CFD are: Direct Numerical Simulation (DNS), Large Eddy Simulation (LES) and Reynolds Averaged Navier-Stokes (RANS), which are all used to calculate turbulent flows. The DNS is employed to numerically solve directly the Navier–Stokes equation in order to calculate more accurately the mean flow and all turbulent velocity fluctuations for entire ranges of spatial and temporal scales. Hence, the spatial grid sizes have to be sufficiently fine to capture the smallest scales within the Kolmogorov microscales (). Correspondingly, the temporal steps have to be sufficiently small to resolve the period of the fastest fluctuations. Consequently, these calculations require a very strong capability of computer resources, and may exceed the available capacity of most powerful high performance computers in solving the three dimensional problems of wind flow and pollutant transport in urban street canyons with large Reynolds numbers. On the other hand, LES uses a spatial filter to screen out the eddy scales, whereby the large scales are resolved by the DNS method, and the small scales are resolved by a sub-grid-scale (SGS) model. Proper solving by LES also requires very fine grids (near-wall grid sizes ), and this requirement is again tackled with a high computing cost. Particularly in wind engineering, we usually need to simulate the flows in very large domains in kilometers and complex geometry configurations, including a number of building shapes, streets, trees, etc. Even, the results obtained from LES implemented by Liu et al. [1] for some reasons did not show a good agreement with the experiments in comparison with the standard k-ε model (see Figures 3 and 4 in Li et al. [2]). Moreover, it would not be an easy task to calibrate and validate the turbulence characteristics obtained from the DNS or LES models with the data observed from real urban street canyons, since such data are not usually available.
Therefore, the numerical simulation based on the Reynold Averaged Navier-Stokes (RANS) equations is still applied to calculate the turbulent flow and pollutant dispersion in urban street canyons, due to its practical and efficient applications. Many authors have applied RANS equations with the standard k-ε turbulence closure model and its variants (Extended, Re-Normalization Group (RNG), realizable) because of their robustness and efficiency. Sini et al. [3], Johnson and Hunter [4], Baik and Kim [5,6], Chan et al. [7,8], Jeong and Andrews [9], Takano and Moonen [10], Yassin [11], etc., have applied the standard k-ε turbulence. In addition, in order to calculate turbulent flow and pollutant transport in urban street canyons, most of authors used a commercial CFD software, such as Fluent (Leitl and Moroney [12]; Chan et al. [8]; Sagrado et al. [13]; Li et al. [14], Yassin [11]; etc.), CFX (Raw et al. [15]; Walton et al. [16]; etc.), PHONENICS (Hassan and Crowther [17]; Koutsourakis et al. [18]), etc. Recently, Takano and Moonen [10] used the OpenFOAM package to study the influence of roof shapes on flow and pollutant dispersion in an urban street canyon; however, they still applied the convection-diffusion equation for passive scalar transport for the flow over regular arrangements of buildings with slanted roofs.
In this study, based on an open source CFD package OpenFOAM (http://www.openfoam.com/) we modified the source code to develop a new solver in order to investigate the flow patterns and pollutant dispersions in urban street canyons. The OpenFOAM package is a general CFD tool box written in C++ and designed as a numerical library of solvers for Partial Differential Equations, which can provide professional users an opportunity to build their own specific solvers, then immerse them into the package. Based on this advantage, we developed a new solver combing the wind flow calculation with a transport process together to facilitate the pollution transport simulation driven by the turbulent flows. In the standard library of OpenFOAM, the numerical solution is designated only for a passive scalar transport; i.e., the concentration field is solved for a given stationary velocity field, and it can deal with only the constant diffusion coefficient, so that it cannot take into account the turbulent diffusion caused by turbulent flows. In the new solver, the scalar transport equation is solved together with the RANS equations with two-equation turbulence closure models, such as the standard k-ε turbulence closure model and its variants (RNG k-ε, realizable k-ε), and the k- turbulence closure model and its variant (k- SST). At each time step, after updating the wind flow field and turbulent parameters, the advection-diffusion equation can be solved. A difference between the original and customized solvers is shown in Figure 1 below.

Figure 1.
A comparison between the original and customized solvers.
2. Governing Equations
2.1. Flow Equations
For wind flow calculation, the RANS equations are modeled by various two-equation turbulence closure models, such as various k-ε models (standard, RNG, realizable), and k- models (k-, k- SST). However, the simulation of turbulent flow and pollutant dispersion in an urban street canyon has to deal with a wide range of spatial and temporal scales and complex geometry configurations, and so a robust and efficient turbulence model needs to be selected. Therefore, we tried to validate the results obtained from different turbulence models against the different experimental measurements of Li et al. [2] and Brown et al. [19]. Figure 2 shows a validation of dimensionless vertical velocity profiles obtained from different turbulence closure models against the measurements of Li et al. [2]. Figure 3 shows the comparisons of velocity profiles and turbulence kinetic energy between numerical results obtained from different turbulence models (standard, realizable, RNG, k- and k- SST) and the measurements of Brown et al. [19] for flat roofs. From Figure 2 and Figure 3, it shows that the results obtained from various k-ε and k- models do not have noticeable differences in comparison with the experimental data. However, the standard and RNG k-ε models are in favor of practical applications for large scale simulations due to their robustness and efficiency. Furthermore, it is well-known that the standard k-ε model under-predicts reattachment length (Demirdzic [20]; Thangam and Speziale [21]), and the velocity close to wall boundaries within the cavity (Sahm et al. [22]). It also has some deficiencies when the standard k-ε model is applied to simulate flow impingement and separation (Apsley and Castro [23]). The flow in urban street canyons, by its nature, is inherent the characteristics of the flow over the backward-facing step, and the flows including the reattachment, separation and recirculation zone. A modification of the strain-dependent correction term in the ε-equation of RNG k-ε model has overcome the limitation of the standard k-ε turbulence. Yakhot et al. [24] report that the RNG k-ε model shows very good predictions of the flow over the backward-facing step. Particularly, Rotach [25], Chan et al. [7], Li et al. [14], Memon and Leung [26], and Koutsourakis et al. [18] recommend that the RNG k-ε turbulence closure model has the best overall performance among k-ε model variants for the simulation of turbulent flow and pollutant dispersion in urban street canyons.
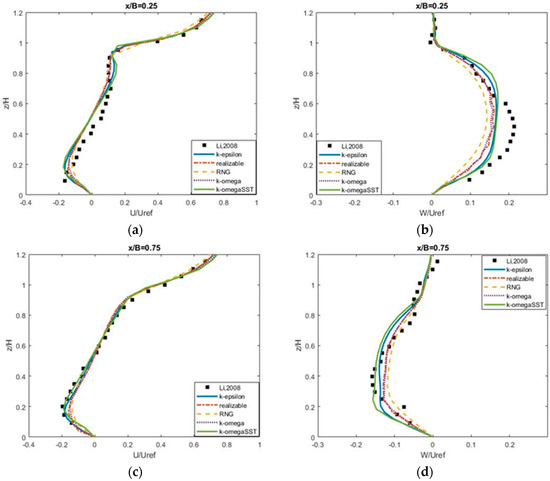
Figure 2.
A comparison of dimensionless vertical velocity profiles (U/Uref (a,c) and W/Uref (b,d)) between numerical results obtained from different turbulence models and experimental data (Li et al. [2]). (U and W are mean stream-wise and vertical velocity components, respectively; Uref is free stream velocity at the inlet)

Figure 3.
A comparison of vertical velocity profiles (U/Uref) (a,c,e) and turbulence kinetic energy () (b,d,f) between numerical results obtained from different turbulence models and experimental data (Brown et al., [19]).
Therefore, the RNG k-ε model (Yakhot et al. [24]) was selected for this numerical model, and its equations read as follows:
where: ; ; ; ; ; and the constants are in the following table (Table 1).

Table 1.
Constants used in the Re-Normalization Group (RNG) k-ε model.
2.2. Scalar Transport Equation
As with the same manner to obtain RANS equations, the time-averaged transport equation for a scalar C is obtained:
where the prime denotes a fluctuating value, D is molecular diffusion coefficient and S is a pollutant source. The simplest model for turbulent scalar fluxes follows from the standard gradient-diffusion hypothesis (SGHD), where the turbulent scalar flux is assumed proportional to mean scalar gradient as follows:
So we can rewrite the Equation (5) as
where Dt is turbulent diffusion coefficient which is assumed to be isotropic and homogeneous.
The turbulent diffusion coefficient Dt in Equation (6) is modeled by the relationship eddy-viscosity () and the turbulent Schmidt number , , or in other words the Schmidt number is dependent upon the ratio of turbulent eddy viscosity and the turbulent mass diffusivity (; thus, it is driven by the turbulent flow and has no universal value. Therefore, it needs to be calibrated to select an appropriate value for the pollutant transport in urban street canyons as mentioned by Tominaga and Stathopoulos [27]. Spalding [28] confirmed that Sct = 0.7 gave close agreement with the experimental data, while Launder [29] found that Sct = 0.9 is a better value. So that, the value Sct of 0.7 or 0.9 is more common in applying to the calculation of pollutant dispersion in urban street canyons.
However, as shown in Table 2, the Schmidt number of 0.9 is more in favor of use by various authors than its value of 0.7. To make sure the selection of an appropriate value for the Schmidt number, we also recalibrated this value against Kastner-Klein’s experiment [30]. As shown in Figure 4, the value of 0.9 delivers the best fit of the measurements.

Table 2.
Values of Sct used in previous studies on building and urban diffusion simulation
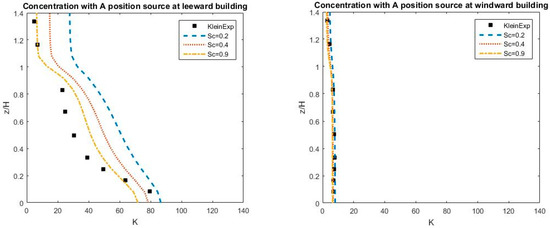
Figure 4.
A validation of the Schmidt number against Kastner-Klein’s experiment [30].
3. Initial and Boundary Conditions
In order to initialize an analogous condition to the actual initial conditions of pollutant dispersion in urban street canyons, we first ran the simulation for airflow only to obtain the flow field, including its parameters. Thereafter, we restarted the new run initialized by the previous run with a turned-on-pollutant source released from a location close to the road surface.
At the inlet, a specific velocity profile is given at the inlet boundary, which is dependent on the characteristics of incoming boundary layers of airflow.
In general, the turbulence parameters of the RNG k-ε turbulence model are set at the inlet boundary, as follows:
where U is mean velocity at the inlet; I is the turbulent intensity; l is the turbulent characteristic length.
At the building walls and road surfaces, a no-slip condition was set for velocity. The other turbulence parameters such as turbulence kinetic energy and the specific dissipation rate were set to wall functions:
where is the friction velocity at the nearest wall.
The dimensionless velocity profile () is followed by the wall function, as follows (Kundu and Cohen [41]):
where is the dimensionless wall distance, y is the distance to the nearest wall and E is an empirical constant related to the wall roughness; for a smooth wall E = 9.54.
The dimensionless concentration at the road surface is represented as follows:
where: C [ppm] is the actual trace-gas concentration; U [m/s] is free stream velocity; H [m] is building height; L [m] is length of line source; and Q [m3/s] is volume rate of trace-gas.
K = CUHL/Q
The top of the computational domain is considered as a symmetry plane, whereby the velocity, pressure and turbulence parameters were set to the zero gradient boundary condition.
The outlet boundary has been set to the cyclic condition.
4. Validations
First step, the new model is validated against the data from Li et al.’s experiment to study the effects of different aspect ratios (ARs) on flow pattern and dispersion process in urban street canyons. Thereafter, the model is validated against the data from Rafailidis and Schatzmann’s [42], Kastner-Klein and Plate’s [30] and Llaguno-Munitxa et al.’s [43] experiments to study the effects of various roof shape configurations.
4.1. Validation against the Measurement Data from Li et al.’s Experiment
Li et al. [2] carried out their experiment in a water-flume with the water depth of 40 cm for the water flow over six to ten identical flat roof model buildings, whose length, width and height are 29.8 cm, 10 cm and 10 cm, respectively. Freestream velocity U is taken at z = 30 cm from the flume bottom. Our Reynolds number is 12,000, based on the freestream velocity and the building height. Experiments were implemented for three aspect ratios: AR = 2.0, 1.0 and 0.5, which all correspond to the canyon widths of 5, 10 and 20 cm. The pollutant transport was not observed in this experiment. The following sections are to present the hydrodynamic validations of the numerical model against Li et al.’s experiments [2] for different aspect ratios (AR), which is a relationship between the building height H and the width of street canyon B (AR = H/B).
4.1.1. Street Canyon of Aspect Ratio AR = 2.0
According to Oke’s classification [44], the flow in this configuration belongs to a skimming regime whose flow pattern is more complex than the flow of the aspect ratio AR = 1.0. Similar to the results obtained from Liu et al. [1], the flow generates two main vortices in the street canyon, which are in opposite directions; an anticlockwise vortex below the half building height, and another clockwise vortex above the half building height, as shown in Figure 5. This is a phenomenon to explain why the streamwise velocities change direction twice from bottom to the roof level as shown in Figure 6a,c,e. Figure 6 shows a comparison between the numerical results and measurements of the normalized stream-wise (U/Uref—left column) and vertical (W/Uref—right column) velocity profiles along the leeward (x/B = 0.25), center (x/B = 0.5) and windward (x/B = 0.75) lines in the street canyon. It shows a very good agreement between our numerical results and Li et al.’s measurements. Within the street canyon, our results are similar to the results of Li et al. [14] using k-ε turbulent closure model, and the results of Liu et al. [1] using an LES model, whereas our results show a bit better agreement with the experimental data than Li et al.’s and Liu et al.’s results [1,2] beyond the roof level. Figure 7 shows well-matched comparisons between our results and the experimental data (Li et al. [2]) of the horizontal velocity profiles at the roof level (z/H = 1.0) and at half building height (z/H = 0.5). In general, our results are closer to the experimental data than the results obtained from Li et al. [14] and Liu et al. [1]. Figure 8 shows the comparisons of the turbulence kinetic energy (TKE) between our numerical and experimental results.
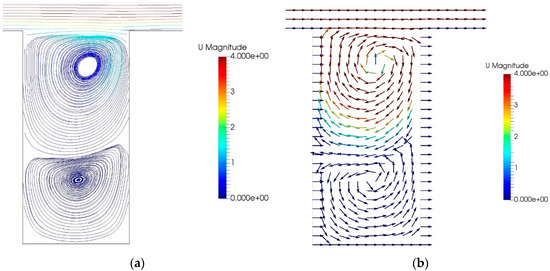
Figure 5.
Streamlines (a) and velocity vector (b) (1) of wind flow inside the street canyons with aspect ratio (AR) = 2. ((1) Due to the velocity inside the canyons being too small in comparison with the ambient velocity, the magnitude of the velocity vector presented in the graphs (from now on in the manuscript) is scaled by the color bar rather than by the length of the vector).
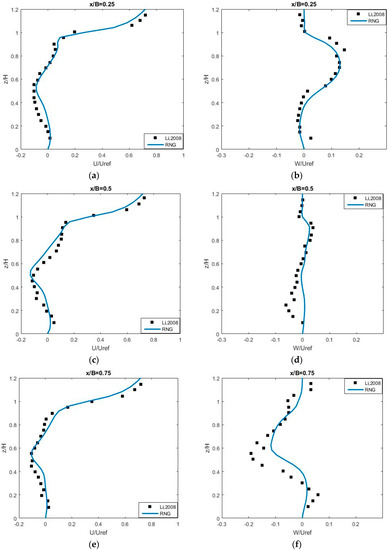
Figure 6.
The vertical profile of normalized streamwise (a,c,e) and vertical (b,d,f) velocities with AR = 2.0.
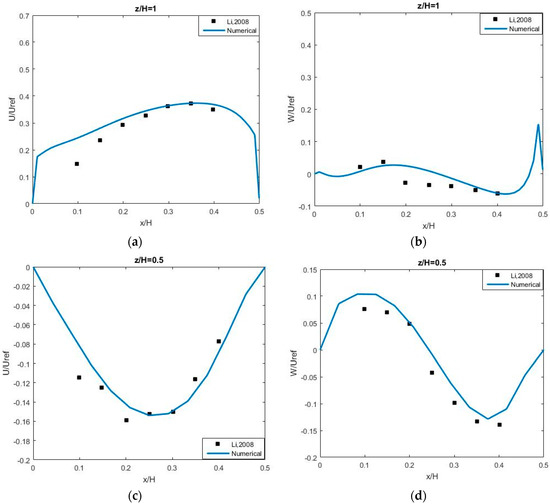
Figure 7.
The horizontal profile of the normalized velocities U/Uref (a,c) and W/Uref (b,d) with AR = 2.

Figure 8.
Turbulence kinetic energy at x/H = 0.25 (a), x/H = 0.5 (b) and x/H = 0.75 (c) with AR = 2.
4.1.2. Street Canyon of Aspect Ratio AR = 1
This case is similar to the flat roof shape experiments of Rafailidis and Schatzmann [42]. As classified by Oke [44], the flow regime in this configuration (AR = 1) is skimming, whereby the bulk flow does not enter the canyon, and this is characterized by a stable and isolated vortex at the street canyon center due to an ambient flow outside on top of the street canyon, as shown in Figure 18a in Section 4.2.1 below.
Figure 9 shows the normalized, vertical profiles of the streamwise (left column) and vertical (right column) velocities along leeward (x/B = 0.25), center (x/B = 0.5) and windward (x/B = 0.75) locations in the street canyon with an aspect ratio AR = 1. The numerical results of streamwise velocity (U/Uref) show a very good agreement with the experimental data as shown on the left column, while the numerical results of vertical velocity (W/Uref) capture the observation data at x/B = 0.25 and 0.75 very well. Similar to the numerical results obtained from the simulation of Rafailidis and Schatzmann’s experiment, the result in this case does not capture well the vertical velocity profile (W/Uref) at x/B = 0.5. However, our results are overall very similar to the results obtained from Li et al. [14] using a k-ε model, and better than the results obtained from Liu et al. [1] using the LES model. Actually, they also failed to reproduce the vertical velocity at the center of the street canyon (x/B = 0.5).
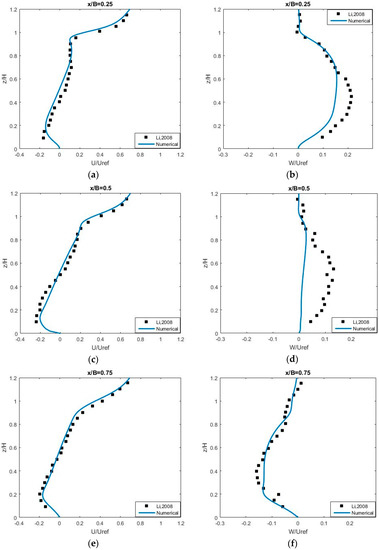
Figure 9.
The vertical profile of normalized stream-wise U/Uref (a,c,e) and vertical W/Uref (b,d,f) velocities with AR = 1.
The vertical velocity profiles clearly show the flow moves up at upstream (near leeward) and moves down at downstream (near windward), producing a stable clockwise vortex at the center of the street canyon. Due to the clockwise vortex at the street canyon center, the stream-wise velocity is negative below half-height roof level, and positive over the half-height level. The vertical velocity approaches to zero at the roof-top level (z/H = 1) because the ambient wind above the roof-top level plays a role as a driven-lid for the street canyon. Figure 10 shows the horizontal profiles of the normalized stream-wise and vertical velocities along a roof level and half-height line. The vertical velocity at roof level (Figure 10d) is very small due to the suppression of the upper motion by the ambient wind, which makes the flow in the street canyon similar to the flow in a lid-driven cavity. The vertical velocity at the half-height level (Figure 10b) changes direction at about the center of canyon width; i.e., it takes a positive value on the upstream half-width of the canyon, and a negative value on downstream half-width of the canyon. The stream-wise velocity at the half-height level (Figure 10a) is almost negative. All of these features demonstrate the characteristics of an isolated circulation at the center of the street canyon as a cavity center.

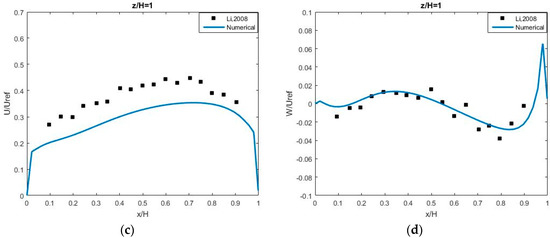
Figure 10.
The vertical profile of stream-wise velocity (a,c) at center height (z/H = 0.5), and vertical velocity (b,d) roof height (z/H = 1) with AR = 1.
Figure 11 shows the normalized turbulence kinetic energy () at three vertical lines; the leeward (x/B = 0.25), center (x/B = 0.5) and windward (x/B = 0.75) locations, in the street canyon. Similar to the case of AR = 2, it shows our model can pick up the turbulent kinetic energy inside the street canyon (below the roof height); particularly the numerical results are matching well with experimental data at the upstream and center of the street canyon, but it is not well in agreement beyond the roof level, where occurs the interaction of the ambient flow and the flow from inside the canyon.

Figure 11.
Turbulence kinetic energy at x/B = 0.25 (a), x/B = 0.5 (b) and x/B = 0.75 (c) with AR = 1.
However, our numerical results of turbulence kinetic energy are still closed to the experimental data than the numerical results obtained from Li et al. [14] and Liu et al. [1].
4.1.3. Street Canyon of Aspect Ratio 0.5
Due to the aspect ratio of 0.5, the flow in this geometry configuration belongs to the wake interference flow regime in which there are two horizontal interacting vortices; the downwind building disturbs the recirculation vortex before readjustment can occur. Similar to the results obtained from Liu et al. [1], the flow forms three vortices inside the street canyon; the largest one occupies about two thirds of the area of the street canyon, and is located on windward side; the second large one is located on upstream near to the lower corner on leeward; the little third vortex is located at the right lower corner of the canyon, as shown in Figure 12.
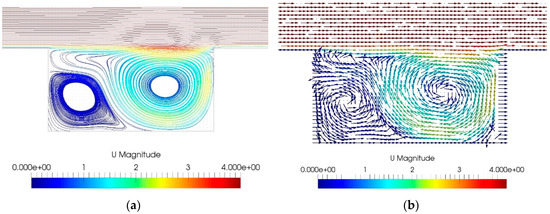
Figure 12.
Streamline (a) and velocity vector (b) of wind flow inside the street canyons with AR = 0.5.
Figure 13 and Figure 14 show the comparisons between the numerical results and the experimental measurements of the vertical profiles of the normalized streamwise and vertical velocities along the vertical lines at x/B = 0.25, 0.5 and 0.75, and the horizontal lines at the roof level (z/H = 1) in the street canyon. Although there are some discrepancies from the experiment data, the figures show that the numerical model can capture the form of the velocity profiles.

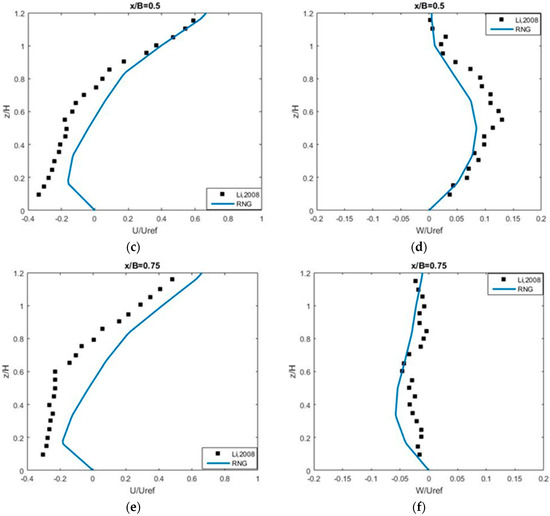
Figure 13.
The vertical profile of normalized streamwise (a,b,c) and vertical (d,e,f) velocities with AR = 0.5.
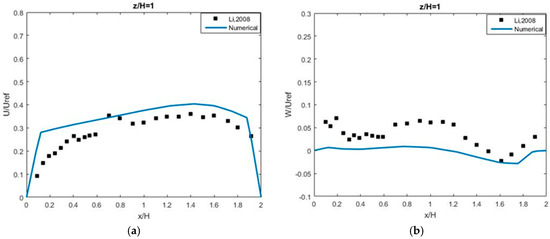
Figure 14.
The horizontal profile of the normalized velocities U/Uref (a) and W/Uref (b) along a roof level line with AR = 0.5. Squares (Li et al. [9]), dash line (RNG).
Figure 15 shows the normalized turbulence kinetic energy () at three vertical lines; the leeward (x/B = 0.25), center (x/B = 0.5) and windward (x/B = 0.75) locations inside the street canyon. It shows that the numerical results are reasonably agreed with the experimental data at the leeward and center locations, but not at the windward location. This trend is similar to the cases of AR = 1 and 2.

Figure 15.
Turbulence Intensity at x/b = 0.25 (a), x/b = 0.5 (b) and x/b = 0.75 (c) with AR = 0.5.
Table 3 shows the evaluation between the numerical results and experimental data of velocity and turbulence kinetic energy based on the efficiency criteria RMSE (root mean square error) and R2 (the coefficient of determination) for all cases, AR = 0.5, 1.0 and 2.0. It shows an overall good agreement between the numerical results and the measurements. However, it should state that there are still some specific locations where the numerical model still cannot well capture the observation values. For instance, in the case where AR = 1, the vertical velocity (W/Uref) at x/B = 0.5 and the turbulence kinetic energy () at z/H = 1 are not well captured by the numerical model, which fact is indicated by a low value of R2 in combination with a high value of RMSE; in the case of AR = 2, the turbulence kinetic energy () at z/H = 1 and z/H = 0.5 is poorly captured, which is also indicated by a low value of R2 in combination with a high value of RMSE. Particularly, in the case of AR = 0.5, at x/B = 0.75, the index R2 is below 0.5, however the value of RMSE is still smaller than those in the same case (AR = 0.5). This different tendency of two indices comes from the different trends of the numerical results and observation data as shown in Figure 13b,d,f, and even the deviation between numerical results and observations is not large (shown by the value of RMSE).

Table 3.
Evaluation of flow parameters between the numerical results and experimental data.
4.2. Validation against the Measurement Data from Rafailidis and Schatzmann’s Experiment
In these experiments, two-dimensional wind-tunnel models simulated from an urban boundary layer corresponding to the street-canyon configurations with eight flat (Figure 16a) or slanted roof-shape buildings (Figure 16b) are studied.
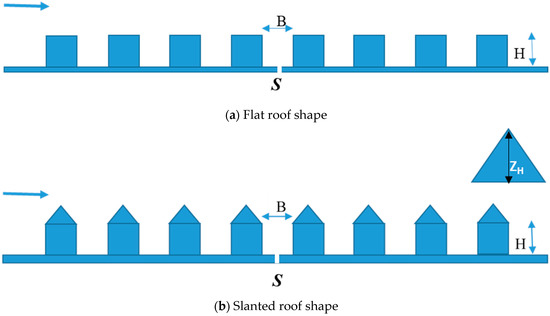
Figure 16.
Experimental set-up by Rafailidis and Schatzmann [42]. (a) Flat roof shape, (b) Slanted roof shape.
The modeled street canyons have the building height of H, the street width of B, and the slanted roof height of ZH. Velocity and turbulence intensity profiles were measured along vertical lines from the road surface over the roofs at several locations. A tracer gas S placed at the bottom center of the fourth street canyon was a mixture of air and ethane with the flowrate Qair = 100 L/h and Qethane = 4 L/h, respectively.
At the inlet of this experiment, an inlet velocity profile was prescribed by the power law, as in Rafailidis [45]:
The parameters are obtained from the measurement, where: α = 0.28, D = 0.002 m is the displacement height above the ground, U(δ) = 5 m/s is free-stream velocity and δ = 0.5 m is the thickness of the boundary layer.
4.2.1. Flat Roof Shape
In this experiment, the modeled street canyon consists of eight idealized flat roof buildings with the aspect ratio AR = H/B = 1.0 (H = B = 60 mm). A steady source S = 150 ppm is released at the bottom center of the fourth street canyon, as shown in Figure 5a above. Figure 17 shows a comparison of the normalized vertical velocity profiles (w/U) at three positions inside the street canyon, being the leeward (x/B = 0.25), center (x/B = 0.5) and windward (x/B = 0.75) positions, between the numerical results and the measurements. The positive value of vertical velocity at the leeward side has shown that the airflow moves upward from bottom to the roof height level, reaching the zero-value at the roof top level due to the suppression of ambient wind, whereas it shows opposite direction at windward side. Consequently, a stable clockwise vortex is formed at the center of the street canyon. Figure 18a shows the distribution of the velocity vector inside the street canyon. This result is the same as those obtained from Yassin [11] using Fluent with the k-ε turbulence model, and Chan et al. [8], also using Fluent with the RNG k-ε turbulence model for flat roofs.

Figure 17.
A comparison between the measurements and numerical results of the normalized vertical velocity profile (w/U) at the leeward x/B = 0.25, center x/B = 0.5 and windward x/B = 0.75.
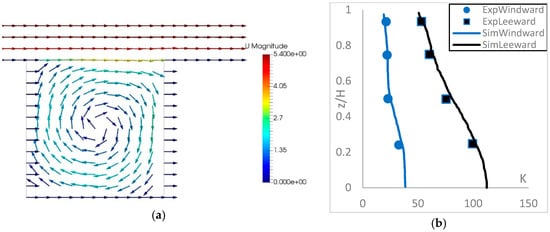
Figure 18.
The flow velocity field (a), and a comparison of the dimensionless concentration K in the street canyon between simulation and experiments (b).
Figure 18b shows a very good agreement between the simulation results and measurements of the vertical profile of pollutant concentration at the leeward (x/B = 0.25) and windward (x/B = 0.75) locations in the street canyon, whereby the pollutant magnitude at the leeward side is significantly reduced (about 50%) upward from the road surface to the building roof level, and almost double larger than that along the windward side. In comparison with the results obtained from the Yassin simulation [11], our numerical results of pollutant distribution are matching better with the observations of Rafailidis and Schatzman [42].
4.2.2. Slanted-Roof Shape
Similar to the flat roof buildings, there are eight different slanted roof buildings where the ratios between the vertical slant height and the building height (ZH/H) are of 0.5, 0.33 and 0.17, respectively. The source magnitude and released location are the same as in the flat roof case. The geometry of the slanted roof shape is shown in Figure 16b.
Figure 19 shows the velocity vector in the street canyons with slanted roofs obtained from the numerical results. It shows that the center vortices of wind flow in the street canyon are lifted upward once the slope of the slanted roof is increased, and this similar tendency is also obtained from the simulation of Yassin [11]. The locations of the vortex center obtained from our simulations are also very similar to the numerical results of Yassin [11], particularly when the slope of the slanted is still small (, and the vortex center location is kept the same as in flat roof situation. The same rotation in the clockwise direction of the vortices is obtained for both cases; the flat and slanted roof shapes.

Figure 19.
Velocity vector of wind flow inside the street canyons with slanted roofs.
Figure 20 shows a comparison between the numerical results and experimental observations of the normalized vertical concentration K at the leeward side (x/B = 0.25) and windward side (x/B = 0.75) with the slanted roof slope . It shows our model can capture very well the pollutant concentration in the street canyon with this slanted roof shape. In particular, the pollutant concentration obtained from our numerical result at the windward side matches better with the experiment data than that result at the leeward side.
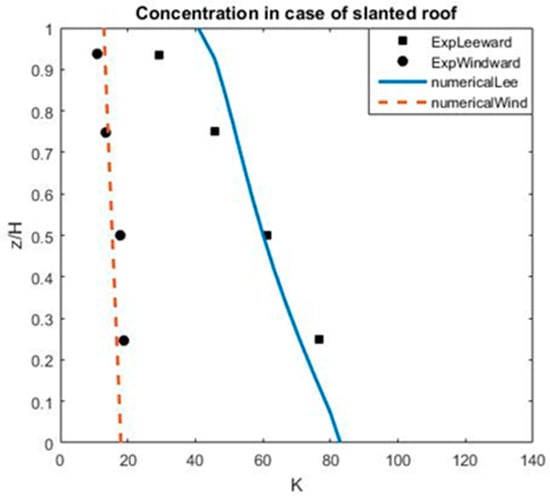
Figure 20.
A comparison of the dimensionless concentration K between experiment and computation (with ZH/H = 0.5) at the leeward side (x/B = 0.25) and at the windward side (x/B = 0.75).
In addition, the same tendency as in the flat roof case, the vertical pollutant distribution along the leeward side is much larger than those distributed along the windward side. The vertical pollutant concentration drops significantly upward along the leeward side (more than 50%), while it is almost very little changed along the windward side.
Figure 21 shows the distribution of pollutant inside the street canyons of slanted roof buildings with different roof slopes; ZH/H = 0.50, 0.33 and 0.17, respectively. This again shows that the pollutant concentration at the leeward side is always larger than at the windward side for the slopes (ZH/H) of 0.33 and 0.17, while the concentration is quite symmetrical in the street canyon with the roof slope of 0.5. In general, the pollutant concentration is upwardly decreased when the slope of the roof is increased. These results are similar to the results obtained from Yassin [11].
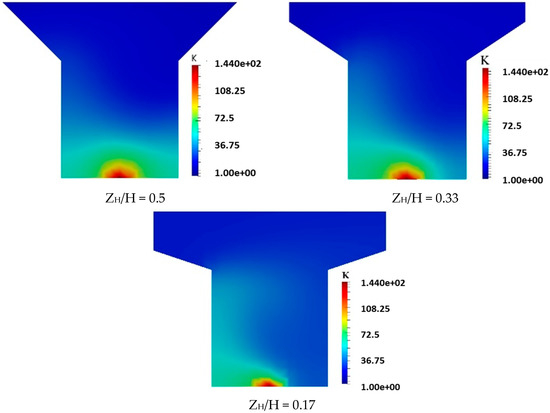
Figure 21.
Distribution of concentration K in the street canyons with slanted roofs.
4.3. Validation against the Measurement Data from Kastner-Klein’s Experiment
Kastner-Klein [30] carried out the experiments in a boundary layer wind tunnel. The modeled building height is of H = 12 cm, which is a typical average building height Hn = 20 m in urban areas. Line sources are designed following Meroney et al. [46], and located at position A, distancing 35 mm from building I, and at position B, distancing 85 mm from building I, as shown in Figure 22. The pollutant source was mixture of air and a tracer gas (SF6), which mixture was released at location A or B.

Figure 22.
Schematic diagrams of the street canyon arrangement.
The approaching vertical velocity profile of the wind is given by the power law as follows:
where zr = 100 m (similar to nature), ur = u100 = 7.7 m/s, and α = 0.23. A normalized concentration value is shown in Equation (7).
The geometry configuration of building roof shapes and the source locations are shown in Figure 22.
Reference case: Flat roof shapes; Situation 1: One-side pitched roof shapes (step-up); Situation 2: Step-up and step down roof shapes; Situation 3: Slanted roof shapes; Situation 4: Street canyon between slanted and flat roof shapes; Situation 5: Street canyon between flat and slanted roof shapes. A and B are source positions.
As shown in Figure 23, in comparison to the reference case (flat roof), the flow patterns inside the urban street canyons of the situations described in Figure 22 are very distinguished from each other. Only the flow in situation 3 (stepdown-stepup) is quite similar to the flow in the reference case. Moreover, the flow in the reference case, the situations 3, 4 and 5 form only one main vortex, whose direction is clockwise, except the flow in situation 1 (stepup-stepup). The flow in the situations 4 and 5 is quite similar, the location of the vortex center is quite the same and located close to building roof level and depressed by outer ambient air flows. In situations 1 and 2, the flow forms two vortices in the street canyon, one main larger vortex and one small. However, the order of the two vortices is different in these situations. Whereas the larger vortex is a bit downward to the street surface, and the smaller vortex is located at the building roof level near the windward side in situation 1; the larger vortex is a bit upward to the building height level and the smaller vortex is located near the leeward close to street surface in situation 2.
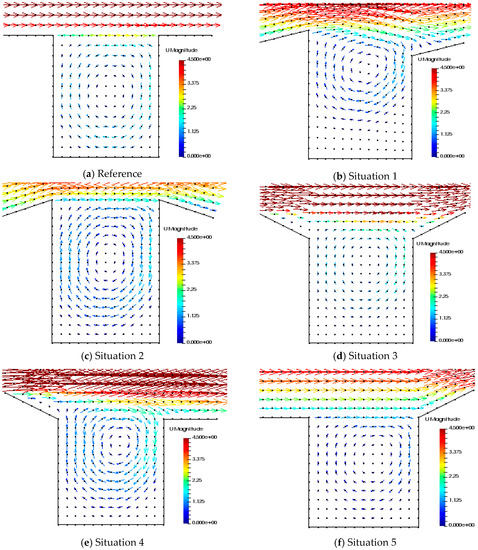
Figure 23.
Velocity vector of wind flow inside the street canyons with different roof shape configurations. (a): Reference case, (b–f): Situation 1–5.
Figure 24 and Figure 25 show a good agreement between the numerical results and experimental measurements of the dimensionless concentration K along the leeward and windward lines. In the case of a flat roof (reference case), similar to the results obtained from Rafailidis’ experiments [45], it again shows that the concentration at the windward is smaller than at the leeward side.
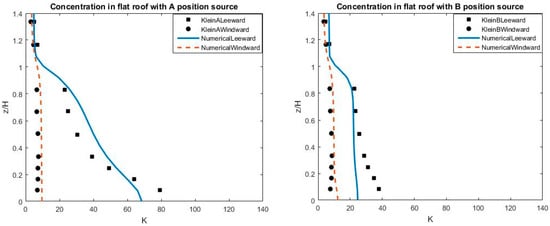
Figure 24.
The dimensionless concentration K along the leeward and windward sites in the reference case (flat roof) corresponding to position sources located at A (left) and B (right).
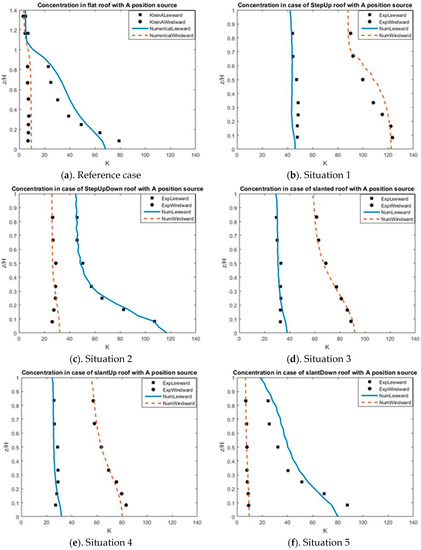
Figure 25.
The dimensionless concentration K along the leeward and windward sites in the case of flat roof corresponding to position sources located at A. (a): Reference case, (b–f): Situation 1–5.
At the leeward, the largest concentration is found near to street surface, and it drops off significantly upward. In addition, below the half building height (z/H < 0.5) the pollutant concentration at the leeward site is almost twice as large when the source location changes from location A to position B. Whereas, the pollutant concentration was not changed, and was kept almost steady from the road surface to the roof level at the leeward and windward sites when the source location changed from A to B, as shown in Figure 24.
Figure 25 shows the comparisons of pollutant concentrations released from position source A with different building roof configurations. In the reference case, situations 2 and 5, as shown in Figure 25a,c,f, the concentration at the leeward side is much larger than the concentration at the windward side; moreover the concentration is significantly upward dropped at the leeward site, while it keeps steady at the windward site. Whereas, in the situations 1, 3 and 4, as shown in Figure 25b,d,e, it shows an opposite trend to the results obtained from the reference case, situations 2 and 4; i.e., the concentration at the windward side is much larger than the concentration at the leeward side, and the concentration is significantly upward dropped at the windward site, while it keeps steady at the leeward site.
Figure 26 shows the distribution of the turbulence kinetic energy (TKE) in the street canyons with different building roof shape configurations. It shows that the low value of TKE usually takes place at the center of the vortex, the corners and near road surface, where the fluctuating velocity is small. In addition, the high value of TKE can be found at the windward side near roof level due to the interaction of the downwind from the ambient flow with the stagnant air inside the canyon, which is similar as lid-driven flow in a square cavity.
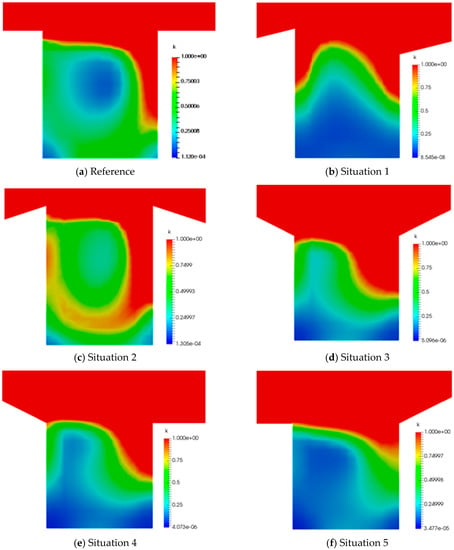
Figure 26.
Turbulence kinetic energy of wind flow inside the street canyons with different roof shape configurations. (a): Reference case, (b–f): Situation 1–5.
Table 4 shows the evaluation between the numerical results and experimental data of the dimensionless concentration K along the leeward and windward sites for all cases following Kastner-Klein’s experiments [30]. It shows a very good agreement between the numerical results and the measurements. Particularly, in the cases of Reference and Situation 5, it shows a higher value of RMSE in comparison with other cases; however, the index R2 is located in a very good range (>0.9). These situations are referred to in Figure 25 (left top and right bottom), which are similar to the case AR = 0.5, at x/B = 0.75 shown in Table 3 for flow parameters, when the different trends between the simulation results and observation data occurs.

Table 4.
Evaluation of the dimensionless concentration K between the numerical results and experimental data.
4.4. Validation against the Measurement Data from Llaguno-Munitxa et al.’s Experiment
In this section, we apply the numerical model to study the flow over buildings with round roof shapes. The numerical results have been validated against the data obtained from the experiment of Llaguno-Munitxa et al. [43]. The experiments were carried in the wind tunnel to observe the flow over seven building models by the box size (0.07 m × 0.07 m) and the canyon width B = 0.07 m, as shown in Figure 27. Llaguno-Munitxa et al. [43] carried out their experiments with three different inlet boundary conditions; however, we validate only for the case with uniform inlet velocity U = 10 m/s in this study. Figure 28 shows the comparison of the velocity profile of normalized streamwise (Figure 28a) and the turbulence kinetic energy (Figure 28b) at the center of canyon (x/B = 0.5), between numerical results obtained from our model and the results obtained from the experiment and simulation (using LES by Fluent software) of Llaguno-Munitxa et al. [43]. It shows that the simulation by the LES method captures the streamwise velocity profile better than our model, whereas our model can capture the turbulence kinetic energy better than the LES method by Llaguno-Munitxa et al. [43]. In addition, in comparison to the reference case (flat roof and AR = 1) in the experiment of Li et al. [2], the tendency of turbulence kinetic energy at the street canyon center (x/B = 0.5) is similar to that in this case; i.e., the value of turbulence kinetic energy is small below 4/5 height roof-level, while it jumps significantly near to the roof level. Figure 29 shows a comparison of the pressure distribution and velocity vector field (background) inside the street canyon and ambient flow over tops of round roofs, which are obtained from our model (Figure 29a) and the LES simulation of Llaguno-Munitxa et al. [43] (Figure 29b). It shows that a similar trend is obtained from both models.

Figure 27.
Geometry configuration of Llaguno-Munitxa et al.’s experiment [43].
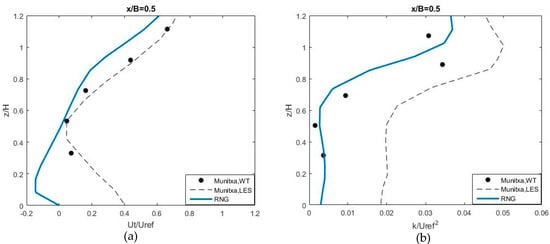
Figure 28.
The velocity profile of normalized streamwise (a) and turbulence kinetic energy (b) at the center of canyon.

Figure 29.
A comparison of the pressure distribution between numerical results obtained from our model (a) and Llaguno-Munitxa et al. [43] (b).
5. Discussion
From the validation of the numerical model against various experimental data obtained from various experiments, such as Li et al.’s experiment [2] for different aspect ratios (H/B = 2.0, 1.0, and 0.5); and Rafailidis and Schatzmann’s [42], Kastner-Klein’s [30] and Llaguno-Munitxa et al.’s [43] experiments for various roof shape combinations, it shows that the flow pattern and pollutant distribution are strongly dependent upon the roof geometries and their configurations of the urban street canyons.
5.1. Effect of Aspect Ratios on Flow Patterns and Pollutant Transport
The numerical simulations for different aspect ratios (AR) following Li et al.’s experiment [2] are shown at Section 4.2. The flows over the street canyons with the aspect ratios of 2.0 and 1.0 belong to the skimming regime following the classification by Oke [44]; whereby the flow inside the canyons is characterized by the lid-driven cavity flow because the ambient wind above the roof-top level plays as a driven-lid for the street canyon. In the case of AR = 2, the flow generates two vortices in the street canyon, which are in opposite directions; an anticlockwise vortex below the half building height, and a clockwise vortex above the half building height.
Whereas, the flow forms a stable clockwise vortex at the center of street canyon in the case of AR = 1, and the vortex circulation is strongest in this case as mentioned by Oke [44] as well. The number of the vortices generated inside the canyon correspond to the number of times when the direction of the vertical profile of streamwise velocity is changed from negative to positive and vice versa.; e.g., the stream-wise velocity is negative below the half-height roof level, and positive over this same half-height level in the reference case AR = 1, and the streamwise velocities change direction twice from bottom to the roof level in the case of AR = 2. In the case of AR = 0.5, the flow belongs to the wake interference flow regime, in which two main interacting vortices and a small vortex form inside the canyon; the downwind building disturbs the recirculation vortex before readjustment can occur; the largest vortex takes place on the windward side, and occupies about two thirds of the area of the street canyon; the second large vortex takes place on the leeward ward side near to the lower corner; and the little third vortex is located at the right lower corner of the canyon (Figure 18a).
Moreover, the value of turbulence kinetic energy is generally small below about 4/5 roof-level height, while it significantly increases upward from there to near the roof level. This trend is also found the same in the round roofs in Llaguno-Munitxa et al.’s experiment [43], whereby the AR (H/B) is also of 1.
5.2. Effect of Roof Shapes on the Flow Patterns and Pollutant Distribution
In this study, the flat roof with the aspect ratio AR = 1.0 was used as a reference case to compare the results. From the simulations following Rafailidis and Schatzmann’s [42], Kastner-Klein’s [30] and Llaguno-Munitxa et al.’s [43] experiments, it shows that the flow patterns inside the urban street canyons under the effects of roof geometries are very distinguished from each other. Only the flow over a street canyon formed by the slanted roof with the slanted slope ZH/H = 0.17 (of Rafailidis and Schatzmann’s experiment [42]) or stepdown-stepup in the situation 3 (of Kastner-Klein’s experiment [30]) or round roofs (of Llaguno-Munitxa et al.’s experiments [43]) is quite similar to the flow in the reference case, i.e., the flow forms a stable clockwise vortex at the center of the street canyon. However, when the slope of a slanted roof (ZH/H) is increased over 0.33 (as shown in the Rafailidis and Schatzmann experiment [42]) or the roof shapes change from flat roofs (reference case) to stepdown-flat (situation 4) or to flat-stepup (situation 5) configurations (in Kastner-Klein’s experiment [30]), the center of the vortex is lifted upward to the roof level.
In the stepup-stepup configuration (situations 1), the flow inside the canyon interfered with by the outside ambient flow forms two vortices, a main larger one below and a smaller one located at the building roof level. In the stepup-stepdown configuration (situation 2), this geometry increases the aspect ratio, and consequently the flow forms two vortices in the street canyon, where the larger vortex is a bit upward above mid-roof level, and the smaller vortex is located close to the street surface.
In comparison to the reference case, the vertical distributions of pollutant concentration at the leeward side in the situations 2 (stepup-stepdown) and 5 (flat-stepup) are the same as in the reference case; i.e., the pollutant concentrations at leeward is much larger than those at the windward side, particularly below the mid-height roof level. In addition, the vertical pollutant concentration significantly decreases upward at the leeward site, while it keeps quite steady at the windward site. Whereas, in the situations 1 (stepup-stepup), 3 (stepdown-stepup) and 4 (stepdown-flat), it shows an opposite trend to the results obtained from the reference case, that is situations 2 and 5. This is to say that the vertical concentrations at the windward side are much larger than those at the leeward site, and the concentration significantly drops upward at windward site, while it keeps steady at leeward site. Moreover, the vertical pollutant concentration gradually decreases upward at windward site, and is kept steady at the leeward site in those cases (situations 1, 3 and 4).
From the results obtained from the reference case, it shows that the pollutant sources regardless are released at the location A or B, the vertical distribution of pollutant concentrations at windward site has similar features in magnitude and tendency; i.e., it has the same small magnitude, and is kept steadily upward (Figure 24). Since the location B is located at the windward site distancing from the leeward site, the vertical concentrations consequently at the leeward are smaller when the source is released from location B in comparison with those released at location A.
6. Conclusions
As shown above, we developed a numerical model based upon an open source CFD package OpenFOAM in order to investigate the flow pattern and pollutant dispersion in urban street canyons. Before we can apply the model to investigate the effects of various geometry configurations, such as different roof shapes and aspect ratios, the model was carefully validated for different two-equation turbulence closure models and various Schmidt numbers. Finally, the RNG k-ε turbulence model and the Schmidt numbers Sct = 0.9 are selected.
The numerical model was validated against the experimental data obtained from a number of well-known experiments, such as Li et al.’s experiment [2] for different aspect ratios (H/B = 2.0, 1.0, and 0.5), as well as Rafailidis and Schatzmann’s [42], Kastner-Klein’s [30] and Llaguno-Munitxa et al.’s [43] experiments for various roof shapes and their combinations. Overall, the numerical results show very good agreements with the measurements. It shows the ability of the numerical model, which can be used to investigate the flows and pollutant dispersions in urban street canyons. However, it should be noted that there still exist some differences between the numerical results and the observations at certain locations, as mentioned in Table 3 and Table 4 above. Therefore, the numerical model will be continued to implement more intensively the quantitative validations against the observation data in various street canyon configurations. The numerical model is actually capable of simulating three-dimensional geometries; nevertheless, due to the limitation of available observation data in three-dimensional regions, our validations are still limited with 2D available data sets. We are currently collecting the data from typical real urban street canyons in order to further validate against a real case study. We also plan to take into account the effect of temperature and planted trees in urban street canyons.
Author Contributions
Conceptualization, V.T.N. and J.N.; Methodology, V.T.N. and T.C.N.; Software, T.C.N. and V.T.N.; Validation, T.C.N. and J.N.; Formal Analysis, V.T.N. and T.C.N.; Investigation, T.C.N. and J.N.; Data Curation, V.T.N. and T.C.N.; Writing—Original Draft Preparation, V.T.N.; Writing—Review & Editing, V.T.N.; Visualization, T.C.N. and J.N.; Supervision, V.T.N.; Project Administration, V.T.N.
Funding
This research was funded by the National Research Foundation of Korea under the grant (NRF-2018R1D1A1A09083747).
Acknowledgments
The authors would like to thank the support from the National Research Foundation of Korea under the grant (NRF-2018R1D1A1A09083747). The authors also would like to thank the anonymous reviewers for their valuable and constructive comments to improve our manuscript.
Conflicts of Interest
The authors declare no conflict of interest.
Appendix A

Table A1.
List of evaluation parameters used in the manuscript.
Table A1.
List of evaluation parameters used in the manuscript.
| Evaluation Parameter | Equation | Author | |
|---|---|---|---|
| 1 | Root Mean Square Error, (RMSE) | Moriasi et al. [47] | |
| 3 | Coefficient of determination, R2 | Moriasi et al. [47] |
Where: Oi: Observe, Pi: Predict, : average of the observe value, : average of the predicted value.
References
- Liu, C.-H.; Barth, M.C.; Leung, D.Y.C. Large-Eddy Simulation of flow and pollutant transport in street canyons of different building-height-to-street-width ratios. J. Appl. Meteorol. 2004, 43, 1410–1424. [Google Scholar] [CrossRef]
- Li, X.X.; Leung, D.Y.C.; Liu, C.H.; Lam, K.M. Physical Modeling of flow field inside urban street canyons. J. Appl. Meteorol. Climatol. 2008, 47, 2058–2067. [Google Scholar] [CrossRef]
- Sini, J.F.; Anquetin, S.; Mestayer, P.G. Pollutant dispersion and thermal effects in urban street canyons. Atmos. Environ. 1996, 30, 2659–2677. [Google Scholar] [CrossRef]
- Johnson, G.T.; Hunter, L.J. Urban wind flows: Wind tunnel and numerical simulations—A preliminary comparison. Environ. Model. Softw. 1998, 13, 279–286. [Google Scholar] [CrossRef]
- Baik, J.J.; Kim, J.J. A numerical study of flow and pollutant dispersion characteristics in urban street canyons. J. Appl. Meteorol. 1999, 38, 1576–1589. [Google Scholar] [CrossRef]
- Baik, J.J.; Kim, J.J. On the escape of pollutants from urban street canyons. Atmos. Environ. 2002, 36, 527–536. [Google Scholar] [CrossRef]
- Chan, A.T.; Au, W.T.W.; So, E.S.P. Strategic guidelines for street canyon geometry to achieve sustainable street air quality—Part II: Multiple canopies and canyons. Atmos. Environ. 2003, 37, 2761–2772. [Google Scholar] [CrossRef]
- Chan, T.L.; Dong, G.; Leung, C.W.; Cheung, C.S.; Hung, W.T. Validation of a two-dimensional pollutant dispersion model in an isolated street canyon. Atmos. Environ. 2002, 36, 861–872. [Google Scholar] [CrossRef]
- Jeong, S.J.; Andrews, M.J. Application of the k-epsilon turbulence model to the high Reynolds number skimming flow field of an urban street canyon. Atmos. Environ. 2002, 36, 1137–1145. [Google Scholar] [CrossRef]
- Takano, Y.; Moonen, P. On the influence of roof shape on flow and dispersion in urban street canyon. J. Wind Eng. Ind. Aerodyn. 2013, 123, 107–120. [Google Scholar] [CrossRef]
- Yassin, M.F. Impact of height and shape of building roof on air quality in urban street canyons. Atmos. Environ. 2011, 45, 5220–5229. [Google Scholar] [CrossRef]
- Leitl, B.M.; Meroney, R.N. Car exhaust dispersion in a street canyon. Numerical critique of a wind tunnel experiment. J. Wind Eng. Ind. Aerodyn. 1997, 67–68, 293–304. [Google Scholar] [CrossRef]
- Sagrado, A.P.G.; van Beeck, J.; Rambaud, P.; Olivari, D. Numerical and experimental modelling of pollutant dispersion in a street canyon. J. Wind Eng. Ind. Aerodyn. 2002, 90, 321–339. [Google Scholar] [CrossRef]
- Li, X.-X.; Liu, C.-H.; Leung, D.Y.C. Development of a k-ε model for the determination of air exchange rates for street canyons. Atmos. Environ. 2005, 398, 7285–7296. [Google Scholar] [CrossRef]
- Raw, M.J.; Galpin, P.F.; Hutchinson, B.R. A collocated finite-volume method for solving the Navier-Stokes equations for incompressible and compressible flows in Turbomachinery: Results and applications. Can. Aeronaut. Space J. 1989, 35, 189–196. [Google Scholar]
- Walton, A.; Cheng, A.Y.S. Large eddy simulation of pollution dispersion in an urban street canyon-part II: Idealized canyon simulation. Atmos. Environ. 2002, 36, 3615–3627. [Google Scholar] [CrossRef]
- Hassan, A.A.; Crowther, J.M. Modeling of fluid flow and pollutant dispersion in a street canyon. Environ. Monit. Assess. 1998, 53, 281–297. [Google Scholar] [CrossRef]
- Koutsourakis, N.; Bartzis, J.G.; Markatos, C.N. Evaluation of Reynolds stress, k-ε turbulence models in street canyon flows using various experimental datasets. Environ. Fluid Mech. 2012, 12, 379–403. [Google Scholar] [CrossRef]
- Brown, M.J.; Lawson, R.E.; DeCroix, D.S.; Lee, R.L. Mean flow and turbulence measurements around a 2-D array of building in a wind tunnel. In Proceedings of the 11th AMS Joint Conference on the Applications of Air Pollution Meteorology, Long Beach, CA, USA, 10 January 2000. [Google Scholar]
- Demirdzic, I.A. A Finite Volume Method for Computation of Fluid Flow in Complex Geometries; Imperial College London (University of London): London, UK, 1982. [Google Scholar]
- Thangam, S.; Speziale, C.G. Turbulent flow past a backward facing step: A critical evaluation of two-equation models. AIAA J. 1992, 30, 1314. [Google Scholar] [CrossRef]
- Sahm, P.; Louka, P.; Ketzel, M.; Guilloteau, E.; Sini, J.F. Intercomparison of Numerical Urban Dispersion Models—Part I: Street Canyon and Single Building Configurations. Water Air Soil Pollut. Focus 2002, 2, 587–601. [Google Scholar] [CrossRef]
- Apsley, D.; Castro, I.P. Flow and dispersion over hills: Comparison between numerical predictions and experimental data. J. Wind Eng. Ind. Aerodyn. 1997, 67, 375–386. [Google Scholar] [CrossRef]
- Yakhot, V.; Orszag, S.A.; Thangam, S.; Gatski, T.B.; Speziale, C.G. Development of Turbulence Models for Shear Flows by a Double Expansion technique. Phys. Fluids Fluid Dyn. 1992, 4. [Google Scholar] [CrossRef]
- Rotach, M.W. Profiles of Turbulence Statistics and Above an Urban Street Canyon. Atmos. Environ. 1995, 29, 1473–1486. [Google Scholar] [CrossRef]
- Memon, R.; Leung, D.Y.C. On the heating environment in street canyon. Environ. Fluid Mech. 2011, 11, 465–480. [Google Scholar] [CrossRef]
- Tominaga, Y.; Stathopoulos, T. Turbulent Schmidt numbers of CFD analysis with various types of flowfield. Atmos. Environ. 2007, 41, 8091–8099. [Google Scholar] [CrossRef]
- Spalding, D.B. Mixing and chemical reaction in steady confined turbulent flames. Symp. Int. Combust. 1971, 13, 649–657. [Google Scholar] [CrossRef]
- Launder, B.E. Heat and Mass Transport; Turbulence: Topics in Applied Physics; Springer: Berlin, Germany, 1978; Volume 12, pp. 231–287. [Google Scholar]
- Kastner-Klein, P.; Plate, E.J. Wind-tunnel study of concentration fields in street canyons. Atmos. Environ. 1999, 33, 3973–3979. [Google Scholar] [CrossRef]
- Huang, H.; Akutsu, Y.; Arai, M.; Tamura, M. A two-dimensional air quality model in an urban street canyon: Evaluation and sensitivity analysis. Atmos. Environ. 2000, 34, 689–698. [Google Scholar] [CrossRef]
- Lien, F.S.; Yee, E.; Ji, H.; Keats, A.; Hsieh, K.J. Progress and challenges in the development of physically-based numerical models for prediction of flow and contaminant dispersion in the urban environment. Int. J. Comp. Fluid Dyn. 2006, 20, 323–337. [Google Scholar] [CrossRef]
- Li, Y.; Stathopolous, T. Numerical evaluation of wind induced dispersion of pollutants around a building. J. Wind. Eng. Indus. Aerodyn. 1997, 67&68, 757–766. [Google Scholar] [CrossRef]
- Wang, X.; McNamara, K.F. Evaluation of CFD simulation using RANS turbulence models for building effects on pollutant dispersion. Environ. Fluid Mech. 2006, 6, 181–202. [Google Scholar] [CrossRef]
- Solazzo, E.; Cai, X.; Vardoulakis, S. Improved parameterization for the numerical modelling of air pollution within an urban street canyon. Environ. Modell. Softw. 2009, 24, 381–388. [Google Scholar] [CrossRef]
- Brzoska, M.A.; Stock, D.; Lamb, B. Determination of plume capture by the building wake. J. Wind. Eng. Indus. Aerodyn. 1997, 67&68, 909–922. [Google Scholar] [CrossRef]
- Delaunay, D. Numerical simulation of atmospheric dispersion in an urban site: Comparison with field data. J. Wind. Eng. Indus. Aerodyn. 1996, 64, 221–231. [Google Scholar] [CrossRef]
- Baik, J.J.; Kim, J.J.; Fernando, H.J.S. A CFD model for simulating urban flow and dispersion. J. Appl. Meteorol. 2003, 42, 1636–1648. [Google Scholar] [CrossRef]
- Kim, J.-J.; Baik, J.-J. Effects of inflow turbulence intensity on flow and pollutant dispersion in an urban street canyon. J. Wind. Eng. Indus. Aerodyn. 2003, 91, 309–329. [Google Scholar] [CrossRef]
- Santiago, J.; Martilli, A.; Martin, F. CFD simulation of airflow over a regular array of cubes. Part I: Three-dimensional simulation of the flow and validation with wind-tunnel measurements. Bound.-Layer Meteorol. 2007, 122, 609–634. [Google Scholar] [CrossRef]
- Kundu, P.K.; Cohen, I.M. Fluid Mechanics, 3rd ed.; Academic Press: Cambridge, MA, USA, 2005. [Google Scholar]
- Rafailidis, S.; Schatzmann, M. Concentration Measurements with Different Roof Patterns in Street Canyon with Aspect Ratios B/H=1/2 and B/H=1; Universitaet Hamburg, Meterologisches Institute: Hamburg, Germany, 1995. [Google Scholar]
- Llaguno-Munitxa, M.; Bou-Zeid, E.; Hultmark, M. The influence of building geometry on street canyon air flow: Validation of large eddy simulations against wind tunnel experiments. J. Wind Eng. Ind. Aerodyn. 2017, 165, 115–130. [Google Scholar] [CrossRef]
- Oke, T.R. Street design and urban Canopy layer climate. Energy Build. 1988, 11, 103–113. [Google Scholar] [CrossRef]
- Rafailidis, S. Influence of building area density and roof shape on the wind characteristics above a town. Bound. Layer Meteorol. 1997, 85, 255–271. [Google Scholar] [CrossRef]
- Meroney, R.N.; Pavageau, M.; Rafailidis, S. Study of line source characteristics for 2-D physical modelling of pollutant dispersion in street canyons. J. Wind End. Ind. Aerodyn. 1996, 62, 37–56. [Google Scholar] [CrossRef]
- Moriasi, D.N.; Gitau, M.W.; Daggupati, P. Hydrologic and Water Quality Models: Performance Measures and Evaluation. Trans. ASBE 2015, 58, 1763–1785. [Google Scholar]
© 2019 by the authors. Licensee MDPI, Basel, Switzerland. This article is an open access article distributed under the terms and conditions of the Creative Commons Attribution (CC BY) license (http://creativecommons.org/licenses/by/4.0/).