Article

An Exceptional Case of Freezing Rain in Bucharest (Romania)

1
National Institute of Research and Development for Optoelectronics INOE2000, Str. Atomiştilor 409, Măgurele, RO077125 Ilfov, Romania
2
Faculty of Electronics, Telecommunications and Information Technology, Politehnica University of Bucharest, Spl. Independentei 313, RO061071 Bucharest, Romania
3
Department of Physics, Politehnica University of Bucharest, Str. Spl. Independentei 313, RO060042 Bucharest, Romania
*
Author to whom correspondence should be addressed.
Atmosphere 2019, 10(11), 673; https://doi.org/10.3390/atmos10110673
Submission received: 4 October 2019 / Revised: 29 October 2019 / Accepted: 30 October 2019 / Published: 1 November 2019
(This article belongs to the Special Issue Atmospheric Composition and Cloud Cover Observations)

Abstract

:
A high-impact freezing rain event affected parts of southeastern Romania on 24–26 January 2019. The freezing rain caused extensive damages in Bucharest, the capital city of Romania. The meteorological analysis highlighted the presence of a particular synoptic pattern involving a high-pressure system advecting cold air mass at low levels, while at mid-levels a warm and humid intrusion was associated with a low-pressure system of Mediterranean origin. At Bucharest, the vertical profiles from ERA5 and radiosondes emphasized the presence of a thick warm layer between 1000–1400 m above the re-freezing layer close to the surface. A climatology of freezing rain events in Bucharest was built to understand the frequency and intensity of this phenomenon. On average, there were approximately 5 observations of freezing rain in Bucharest per year between 1980–2018. The number of consecutive freezing rain days was used as a proxy for the event severity. Moderate-duration events (2 consecutive days) represented 16 periods of all 59 non-overlapping freezing rain periods in Bucharest and long-duration events (3 consecutive days) represented 3 periods. The monthly distribution showed that freezing rain occurs more frequently between December–February with a maximum in December. The moderate and long-duration freezing rain events were associated with two main sub-synoptic patterns related to the Carpathians lee cyclogenesis.

1. Introduction

Freezing rain—“rain that falls in liquid form but freezes upon impact to form a coating of glaze upon the ground and on exposed objects” [1]—is a meteorological phenomena more frequently observed in Europe during the winter months (i.e., December–February) [2,3]. The extensive ice accumulation on the ground associated with freezing rain can lead to a significant impact on human activities, surface and air transportation, infrastructure and electrical power transmission [4,5,6,7]. Also, freezing rain events associated with a small accumulation of ice or those that occur over a short period can also result in transportation difficulties and an increase in the number of accidents [8].
Previous studies have indicated that freezing rain occurs when an elevated warm layer (i.e., >0 C) is located above a cold layer (i.e., <0 C) close to the surface [4,9,10,11,12,13,14,15,16,17,18]. If the warm layer is thick enough, the ice hydrometeors (i.e., snow) that fall through the layer can melt completely. Subsequently, as newly form liquid hydrometeors cross a subfreezing layer they become supercooled through conduction and evaporation. This occurs in environments in which the number of active ice nuclei is very low. Freezing rain can also occur even if a warm layer is not present [19,20,21,22]. For example, in a study based on 10 years of observations from weather stations in the continental United States, 25% of all freezing rain cases occurred without a warm layer [20]. For those cases, freezing precipitations were associated with the upward motion in a shallow saturated layer situated close to the surface. The temperature within the layer is too warm (i.e., ≥−10 C) for the ice nuclei to be active and the droplets grow by collision and coalescence. Thus, if the warm layer is present, then freezing rain is forming (i.e., diameter of the droplets >0.5 mm). If the warm layer is not present, then freezing drizzle is forming (i.e., diameter of the droplets <5 mm) [23].
Previous studies have analyzed the synoptic-scale patterns and local influences on freezing rain [24,25,26]. For example, surface observations, synoptic-scale weather maps, and radiosonde data were used to develop climatologies for freezing rain at six sites across the United States [27]. The results showed that freezing rain events were primarily driven by warm advection and their frequency was influenced by topographic features (i.e., height <1 km), water bodies (from small bays to oceans) and the dominant storm tracks during winter. Other studies based sounding associated with freezing rain events showed that (1) the depth of the elevated warm layer was between 500–2800 m, (2) the temperature in the warm layer varied between 1 C–10 C, (3) the depth of the cold layer was between 100–1400 m and (4) the temperature in the cold layer varied between −7 C–−1 C [27]. Also for the United States, an analysis of hourly surface observations between 1976–1990 showed that freezing rain occurred on the cold side of stationary fronts (57% of all cases) or was associated with close surface cyclones (43% of all cases) [28]. The majority of the freezing rain events associated with cyclones (77%) occurred when the cyclone was east, southeast or south of the area with freezing rain reports. For Canada, 46 long-duration (i.e., ≥6 h) freezing rain events that occurred in Montreal between 1979–2008 were manually classified based on the 500-hPa trough axis in the west, central and east events [23]. Despite being driven by different synoptic scale features (e.g., strong surface anticyclone, quasi-stationary area of geostrophic frontogenesis) all events were characterized by cold northeasterly wind channelled in the St. Lawrence River valley. The strong low-level temperature inversions in the valley were associated with northeasterly surface winds.
In recent years, several impactful freezing rain events occurred in Europe. For example, a freezing precipitation event that occurred between 25–26 December 2010 in Moscow, Russian Federation affected the public (i.e., power lines were destroyed) and air transport (i.e., flights were cancelled at the Domodedovo Airport) [3]. In 2014, the freezing rain events that occurred between 31 January–4 February over the Balkan Peninsula resulted in 10 cm accumulation of ice in Slovenia and damages estimated at EUR 400 million [29,30]. Despite these major events, few studies were devoted to the climatology and synoptic-scale and local influences on freezing precipitation events. For example, freezing rain events (including freezing drizzle and ice pellets) from Europe between 1995–1998 were analyzed using surface observations [2]. The results showed that freezing precipitation is not an uncommon phenomenon. This type of event occurs more frequently in December–February and in regions characterized by a continental climate (i.e., Central Europe). Also, freezing rain and freezing drizzle are more frequently reported than ice pellets. Recently, a method for estimating the occurrence of freezing rain events based on gridded atmospheric data (i.e., ERA-Interim reanalysis) was developed [3]. The method, which was calibrated with SYNOP weather station observations, was used to develop a pan-European climatology of freezing rain for the period 1979–2014. The results showed that freezing rain events occur more frequently over central and Eastern Europe compared with northern Europe and coastal regions. Over central and Eastern Europe the freezing rain season is October–April with 1–2 events per year.
Despite freezing rain being a high impact hazardous event, very few studies have analyzed this type of weather event in Romania. For example, a study of the spatial and the temporal distribution of freezing rain events in Romania based on the surface observations between 1980–1999 concluded that the conditions associated with the occurrence of freezing rain “are quite difficult to fulfil and mostly depend on local factors” [31]. Recently, a high impact freezing rain event occurred between 24–26 January 2019 in Bucharest, the capital city of Romania and one of the most densely populated cities in Europe (i.e., 9265 inhabitant per km 2 [32]). Given the duration and impact of this event, the aim of this article is (1) to examine the event from a climatological perspective to better understand the frequency and severity of freezing rain in an urban area and (2) to determine the prevalent mesoscale processes associated with long duration freezing-rain events.
This article is organized as follows. The data sets and methods used for analyzing this particular event and its climatology are described in Section 2. Section 3.1 presents the effect of the freezing rain event in the largest city of Romania and its surroundings. The analysis of the phenomenon from a synoptic and mesoscale point of view is detailed in Section 3.2. To assess the impact of the event compared to previous ones, a climatology of freezing rain was performed together with a classification of synoptic patterns leading to freezing rain events in Bucharest (Section 4). Section 5 summarizes the results of this article.

2. Data

2.1. Renalysis

The meteorological analysis of the 24–26 January 2019 freezing rain event was performed using ECMWF (European Centre for Medium-Range Weather Forecasts) ERA5 hourly surface (i.e., mean sea level pressure, 2 m temperature) and upper air (i.e., geopotential height, temperature and wind at different pressure levels) reanalysis data with 0.25 × 0.25 horizontal resolution ([33] (data available from https://cds.climate.copernicus.eu/#!/home, retrieved on 1 May 2019). The synoptic analysis was performed over a European domain situated between 35 N–55 N and 5 E–35 E longitude (Figure 1). To emphasize the influence of regional topography and the physical processes that favoured the freezing rain formation, a meso- α domain was defined between 16 E–34 E and 40 N–50 N (dark blue rectangle in Figure 1). For the local analysis, a meso- β domain was defined between 25.75 E–26.50 E and 44.25 N–44.75 N around Bucharest (black rectangle in Figure 1).
Local observations from the Romanian Atmospheric 3D Observatory (RADO, http://environment.inoe.ro/, accessed on 3 October 2019) located southwest of Bucharest, in Măgurele—a peri-urban area (Figure 1), were collected during the freezing rain event using a vertical pointed Micro Rain Radar (MRR, manufactured by Metek GmbH). The MRR is a Frequency Modulated Continuous Wave (FMCW) radar operating at 24 GHz, used to study, for example, liquid and solid precipitations [34,35] and bright band [36]. These observations were supplemented by radiosonde measurements extracted from the sounding database maintained by the University of Wyoming (http://weather.uwyo.edu/upperair/sounding.html, accessed on 1 September 2019). During the event (00 UTC 24 January–00 UTC 27 January 2019), 7 soundings were available, twice a day at 00 UTC and 12 UTC (local time + 2 h).

2.2. Observations

To understand the climatological context of the freezing rain event, surface observation (SYNOP observations) from Global Surface Archives (World Meteorological Organization FM-12 SYNOP coded data [37]) between 1980–2018 were used. Data were extracted for three weather stations located in Bucharest (i.e., Băneasa, Filaret and Afumaţi). When analyzing the freezing rain reports from weather stations, some issues need to be considered. For example, some stations have reports for limited periods or the reports are missing overnight [22,38]. To address these issues, recent climatological studies of freezing rain in the United States were based only on data from stations that had reports for at least 80% of the annual hours for at least 10 out the 15 years studied [38] or for at least 30 out of 38 years studied [22]. When these criteria are applied to the three stations from Bucharest only Băneasa is identified as suitable for analysis. For Băneasa station, the reports were available every 3-h between 1980–1981 and hourly between 2007–2018. The remaining years (i.e., 1982–2006) had a combination of one hour and 3-hour reports. Between 1980–2018, Băneasa station had reports for more than 90% of the annual hours (considering hourly reports after 2007 and 3-h reports before 2007). In 2000, the Băneasa became a human-augmented automated station. Previous studies on the climatology of freezing rain in Europe did not include data from automated stations arguing that this type of station has a “reduced ability to distinguish [between] different types of precipitation, especially freezing rain and freezing drizzle” [3]. A more recent study indicated that human-augmented and non-augmented automated stations are consistent in their frequencies of freezing rain events [39]. Thus, in this article, we also include automated observations from Băneasa station.
For each SYNOP observation, the present weather consists of 100 codes describing the weather at the time of the observation or in the previous hour. Based on surface observation, the freezing rain events were identified as those observations containing the present weather code 24 (freezing rain within the previous hour), 66 (light freezing rain), and 67 (moderate to heavy freezing rain). During the study periods, 227,752 observations were available from Băneasa and of these, 183 were for freezing rain. To remove erroneous observations, we followed the methodology proposed by Kämäräinen et al. [3] and retained for analysis only the freezing rain observations with surface temperature between −15 C and 5 C. Thus, the freezing rain dataset used in this article consists of 182 observations, the majority of the observations being for light freezing rain events (i.e., 80% of all freezing rain reports).

3. An Exceptional Freezing Rain Event in Bucharest

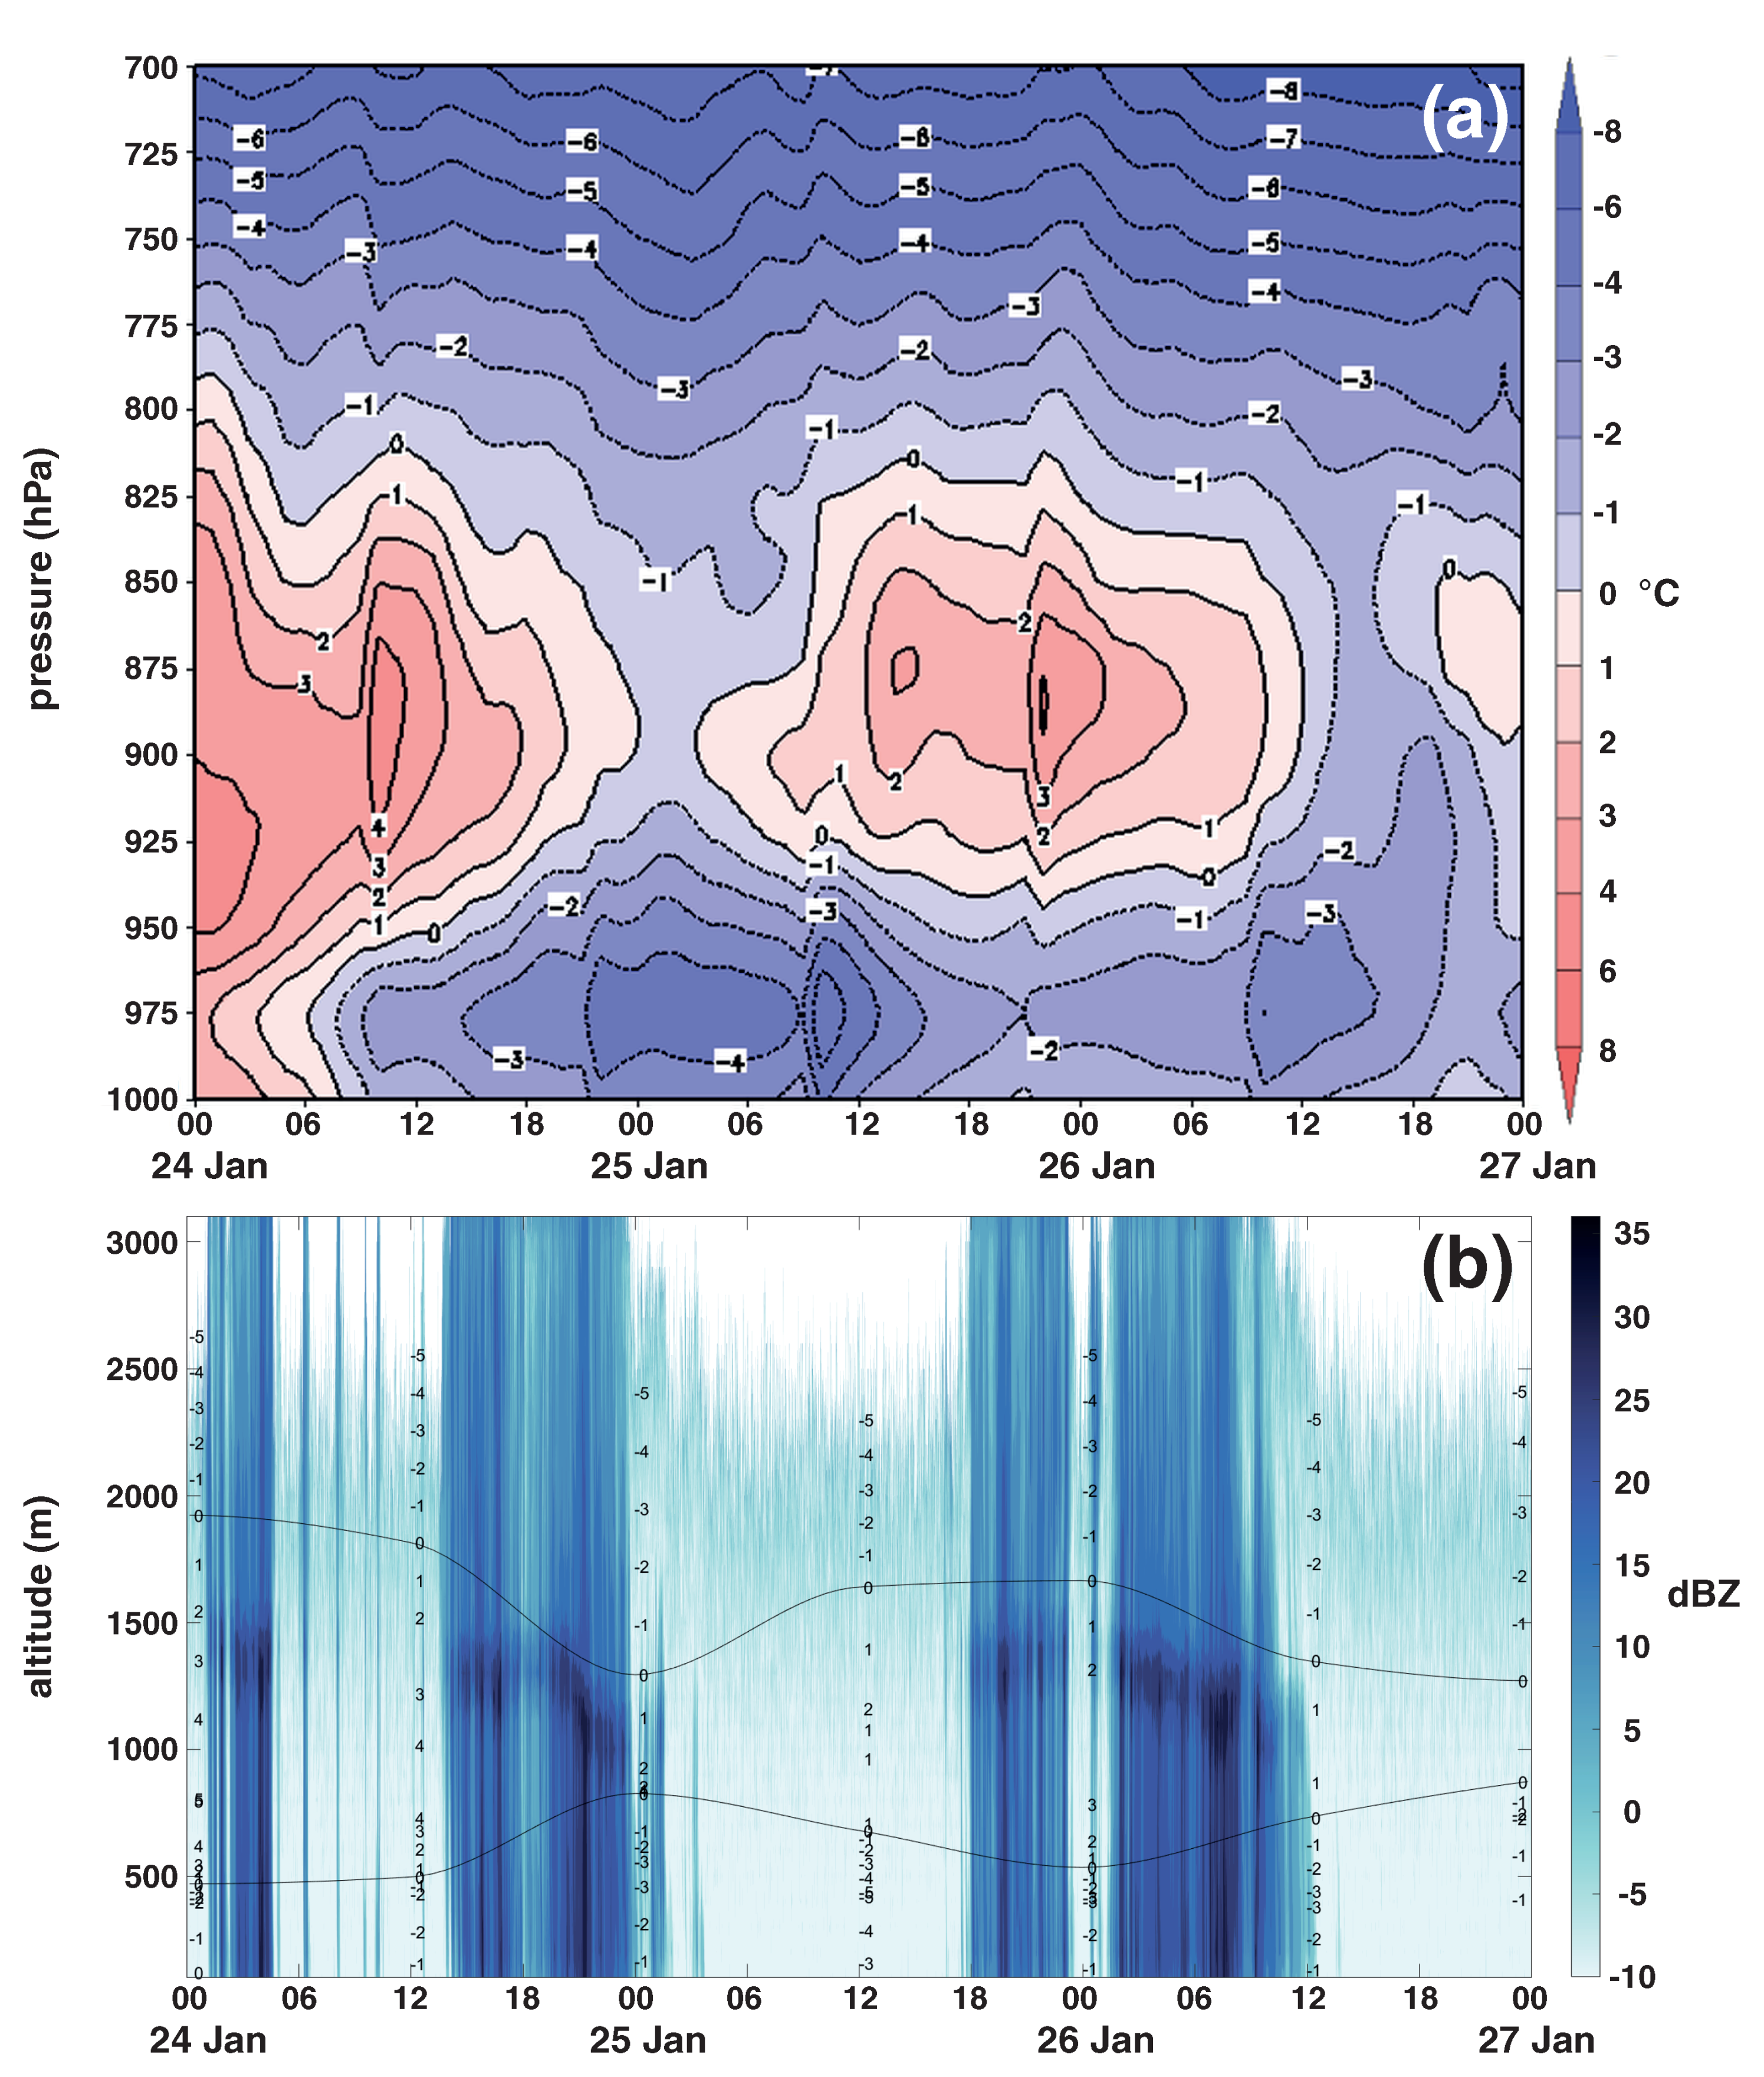
3.1. Description of the Event

On 24–26 January 2019 a freezing rain event affected parts of southeastern Romania including Bucharest, the capital city. During the event, the Romanian National Meteorological Administration issued 47 weather warnings for areas in southeastern Romania (Figure 1). The event resulted in the closing of several motorways connecting Bucharest with the rest of the country. At the Henri Coandă International Airport for three hours on 25 January the air traffic was closed. In Bucharest, the freezing rain affected 2622 trees (e.g., break off branches heavily coated with ice) and 759 cars were damaged (Figure 2). The public transport in Bucharest was interrupted due to power outages. According to the Romanian Emergency Service (personal communication) between 24–26 January, 154 calls were received for issues associated with freezing rain (i.e., 150 medical emergency and 4 car accidents).

3.2. The Synoptic and Mesoscale Analysis

On 24–26 of January 2019, Central and Eastern Europe were under the influence of an anticyclonic regime which determined the advection of polar air masses toward these regions. Southern Europe was directly influenced by an intense Mediterranean cyclonic activity (Figure 3a,c,e).
The pressure systems evolution was influenced by the local topography. By their location and shape, the Carpathians Mountains played the role of a topographic barrier for the dense polar air, which was forced (at the lower levels) to follow the mountain curvature in its motion from north-east towards south-west. The high-pressure system formed two peri-Carpathians lobes, one over Eastern Romania (Moldavian Plateau) and another over Little Carpathians (western Slovakia) and Great Hungarian Plain [40]. Due to the cold air mass intrusion, the pre-existing warm air was lifted. This specific configuration triggers the Carpathians lee cyclogenesis [41]. Simultaneously, a large cut-off low, extended from the lower to upper levels, directed the frontal dynamics of the Mediterranean lows northward. This enhanced the advection of tropical humid air masses towards the Balkans (Figure 3b,d,f). As the Mediterranean lows approach the Balkans, the warm air was observed in a layer between 950–800 hPa, while close to the surface the polar air moved along the curvature of the Carpathians towards southern Romanian. The thermal analysis at meso- α scale reveals a contrast between the surface (1000 hPa) and the mid-troposphere (900 hPa) over southern Romania (Figure 4a–f).
The 26 E longitudinal vertical cross-section over Bucharest and surrounding areas emphasize the intrusion of cold air mass at the lower levels on a north-east wind component, while the warm and humid air mass advance at mid-levels having south-east and south-south-west wind component (Figure 4g–i).
The time series of temperature profile over Bucharest area, performed for the closest ERA5 grid point to Măgurele city (Figure 5a) between 24 Jan 00 UTC and 27 Jan 00 UTC, emphasize the presence of a warm layer with a maximum temperature greater than 3 C around 900 hPa. The cold layer (lower than 2   C) is clearly shown between 24 Jan 12 UTC and 26 Jan 18 UTC (Figure 5a). This thermal structure leading to freezing rain shows similarity with the MRR measurements. The attenuated radar reflectivity shows the presence of a melting layer (i.e., bright band) between 1000–1400 m with values for radar reflectivity >20 dBz (Figure 5b).

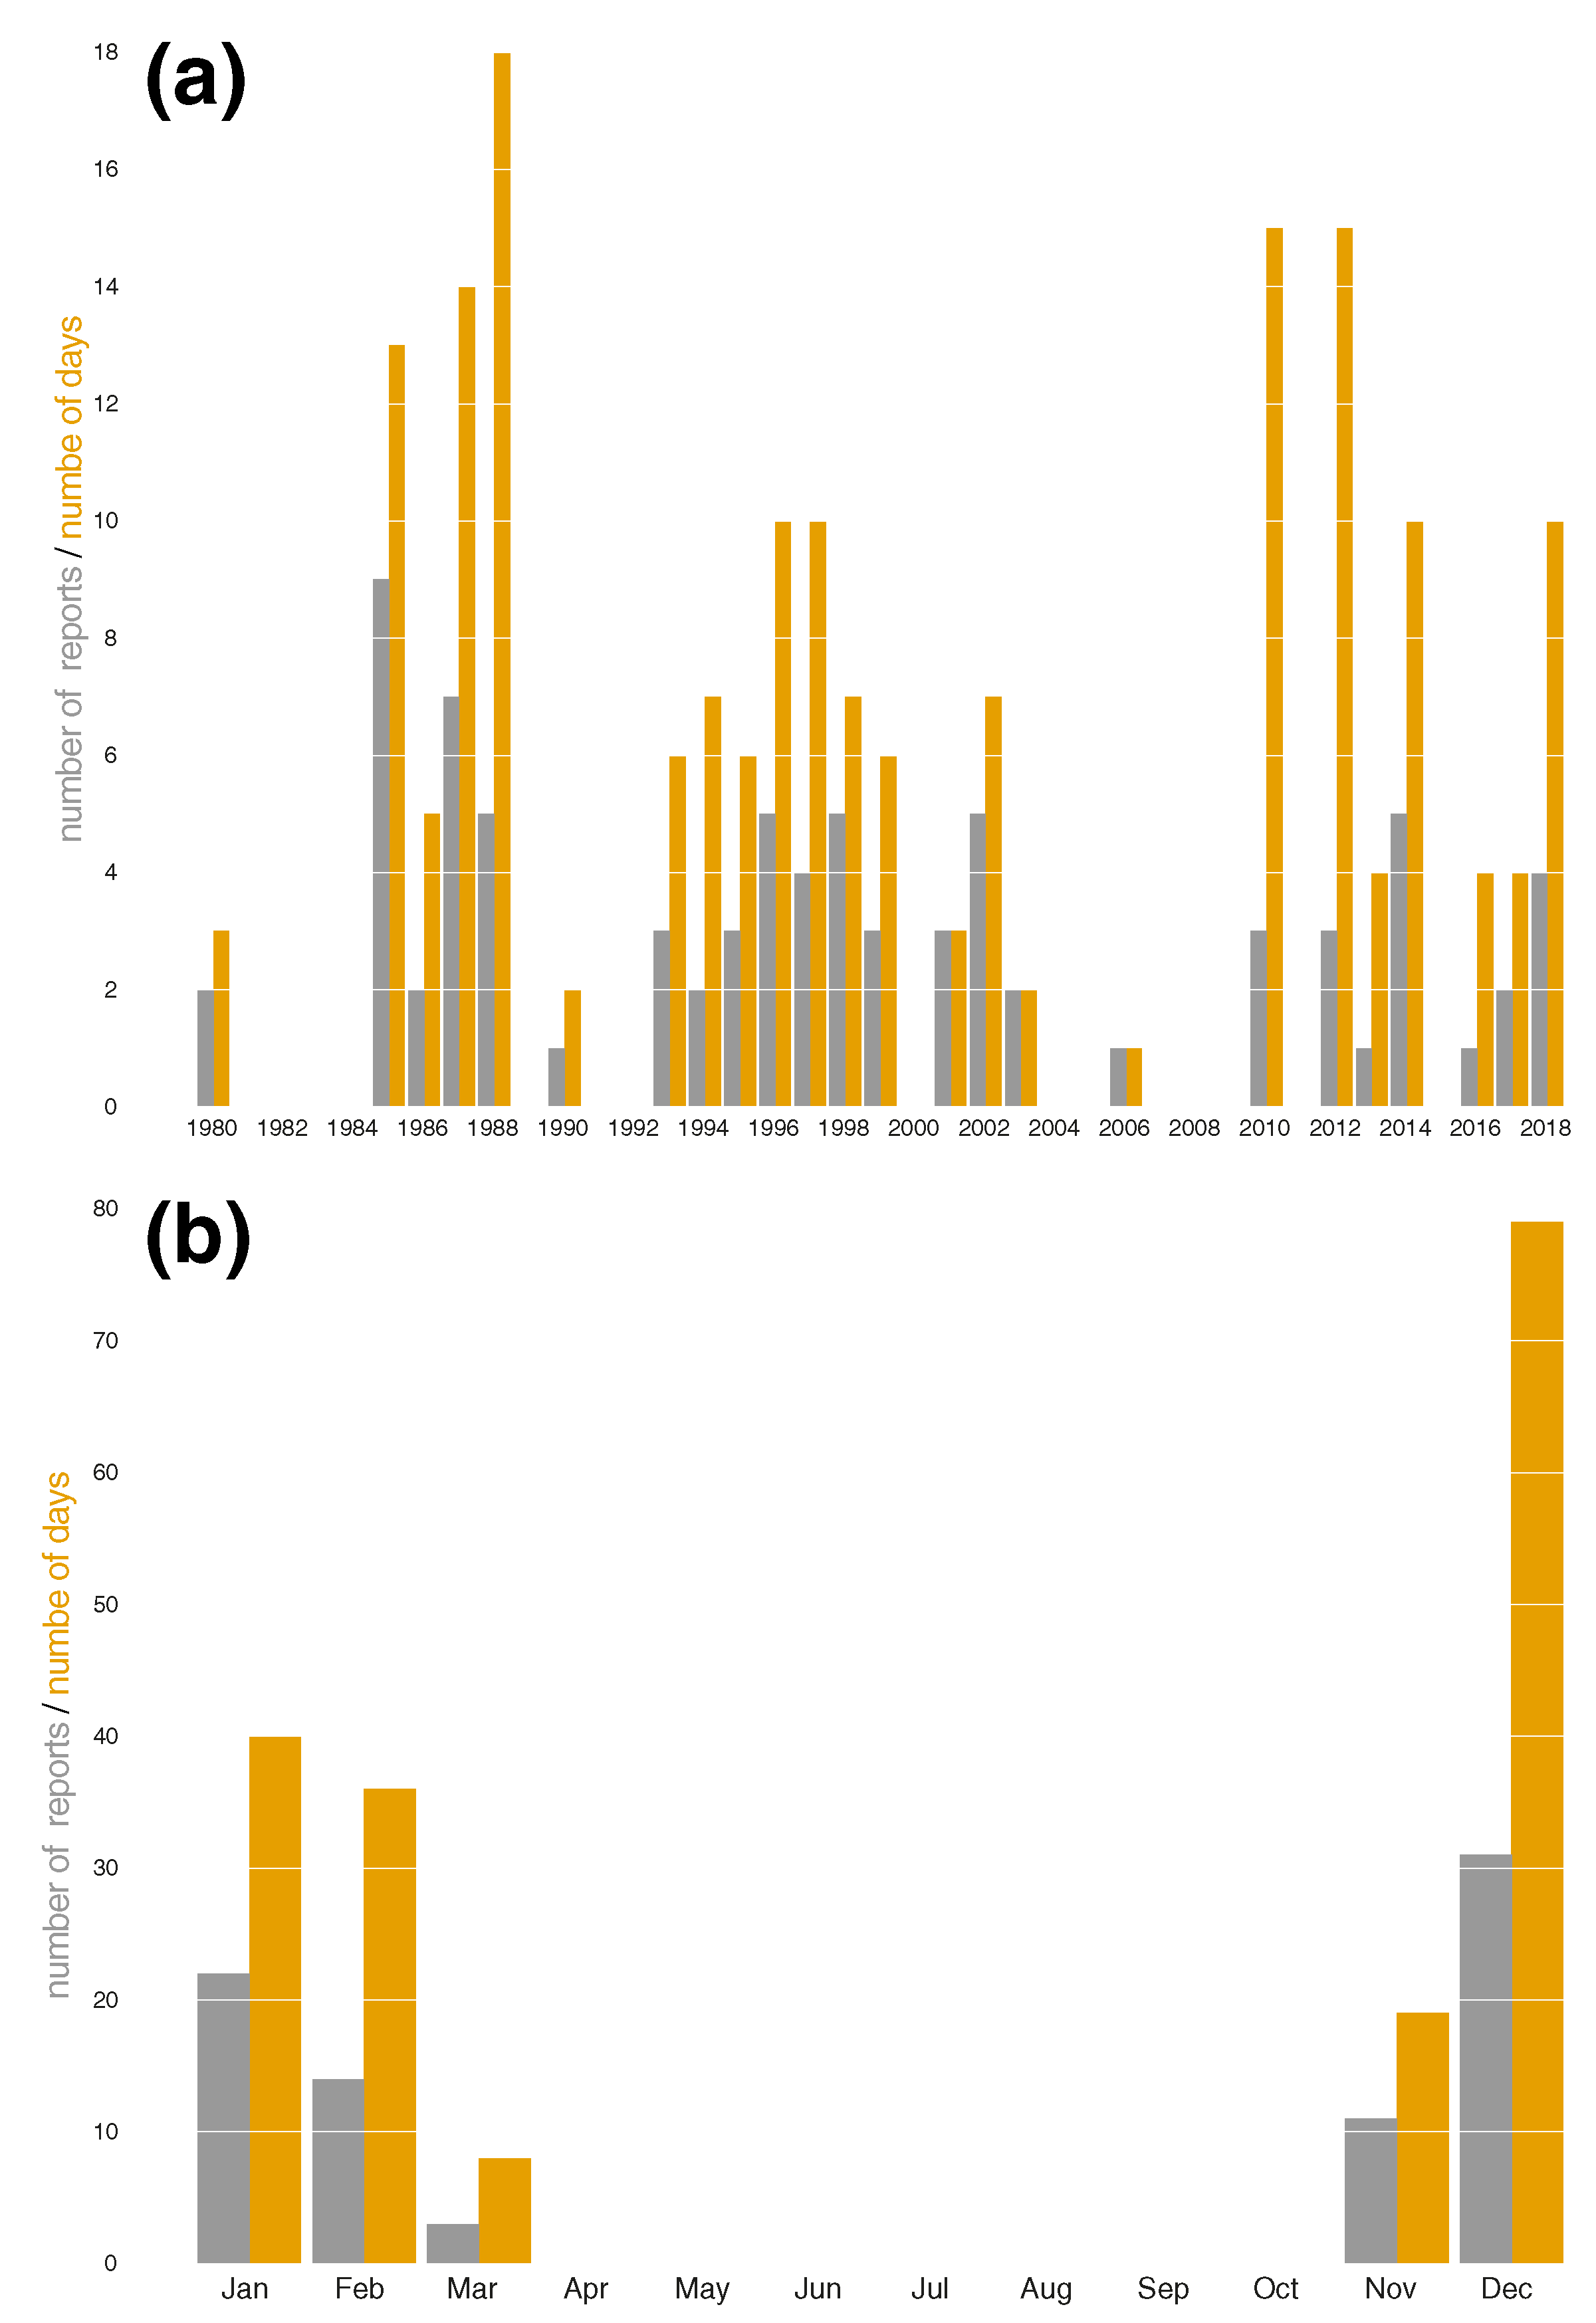
4. Climatology of Freezing Rain in Bucharest

On average, there were approximately 5 observations of freezing rain in Bucharest each year between 1980–2018 (Figure 6a). The number of freezing rain days (i.e., a day in which freezing rain was reported at least once) during the study period was 81 days corresponding to an average of 2 days per year (Figure 6a).
The monthly distribution of the freezing rain reports between 1980–2018 shows that this type of weather event occurs more frequently between December–February with a maximum in December (79 observations, representing 43% of all freezing rain observations, Figure 6b). A similar distribution was observed in the case of the freezing rain days with a maximum in December (31 freezing rain days, representing 38% of all freezing rain days).
To account for the severity of freezing rain events in the United States and Canada, the duration of the event was considered as proxy [22]. Long-duration events being those in which at least six hours of freezing rain were reported. A similar approach could not be applied to the surface observations dataset used in this article, because our dataset contains hourly reports only for 2007–2018. The number of hours of freezing rain cannot be unambiguously determined from our dataset, given that between 1980–2016 the reports were made every three hours. Instead of using the hours of freezing rain, the number of consecutive freezing rain days was used as a proxy for the event severity. Thus, all freezing rain days between 1980–2018 in Bucharest were divided into 59 non-overlapping periods (Figure 7). Moderate-duration events (i.e., two consecutive freezing rain days) represented 27% (16 periods) of all non-overlapping periods and long-duration events (i.e., three or more consecutive freezing rain days) represented 5% (3 periods). Even if the thresholds (i.e., number of consecutive days) for moderate and long-duration events are subjective, we believe that they allow (1) the identification of high-impact freezing rain events (i.e., 2–3 consecutive days), and (2) the construction of a dataset with high-impact events. Thus, the event studied in this article had the largest number of hours with freezing rain, compared with other events that occurred between 2007–2018.
The analyses of prolonged freezing rain events (i.e., moderate and long duration) recorded at Bucharest are driven by a sub-synoptic pattern related to the Carpathians lee cyclogenesis. The synoptic context which favours Carpathians lee cyclogenesis is associated with (1) a high-pressure system over Northern Romania originating either in Scandinavia or Eastern Europe and (2) a low-pressure system over Southern Romania with a Mediterranean origin. The high-pressure system moved southward simultaneously with the slow east-north-east transition of the Mediterranean low. Generally, the Carpathian lee cyclogenesis consists of a small size cyclone over Central and Southern Romania with a rapid evolution of 12–24 h. The processes are detectable only in the low troposphere (Figure 8c,d).
The 20 moderate and long-duration freezing rain events that occurred between 1980–2019 (including the case analyzed in this article) are associated with two main sub-synoptic patterns. These patters leading to Carpathian lee cyclogenesis are differentiated based on the origin of high-pressure system: Scandinavian origin (12 cases) (Figure 8a) and East European origin (7 cases) (Figure 8b) (Table 1). One event could not be included in the two main patters associated with freezing rain events over southern Romania, the Lothar windstorm from 26–27 December 1999 [42]).
The long-duration freezing rain events analyzed in this article were associated with the high pressure system of Scandinavian origin, that enables the fast southern advance of the arctic air-masses. This leads to a high-pressure gradient along the external part of Eastern Carpathian range (Figure 8a). The thermal contrast between the lower and mid-levels layer is higher compared with freezing rain cases associated with East European anticyclones (Figure 8b).

5. Conclusions

An exceptional freezing rain event, that occurred between 24–26 January 2019 in Bucharest, Romania was analysed. Based on weather observations from Bucharest, a climatology of freezing rain between 1980–2018 was constructed. From a total of 59 periods with consecutive days with freezing rain, 27% of all periods were moderate-duration events (2 consecutive days) and only 3% were long-duration events (3 consecutive days).
The meteorological analysis of the moderate and long-duration events revealed a particular sub-synoptic pattern that involves a high-pressure system North of Romania and a low-pressure system South of Romania. While the low-pressure system has always a Mediterranean origin, the high-pressure system can have multiple origins: from Scandinavian Peninsula (favouring the transport of arctic air masses) and from Eastern Europe (favouring the transport of polar air masses). The highest incidence of moderate and long-duration events involve a Scandinavian origin anticyclone. A particular freezing rain event was identified during 26–27 December 1999, involving a cyclonic pattern of North-Atlantic origin. This case requires further analyses as it is related with the Lothar windstorm.
Due to the distribution of high and low-pressure values induced by the local topography, the Carpathians lee cyclogenesis is triggered. Consequently, surface cold air mass uplifted the pre-existent warm air to the mid-level. Generally, the warm core is visible within the middle layers for between 12 and 24 h. If this process coincides with the advection of warm and humid air from the Mediterranean Sea, the precipitation episode is enhanced and its duration increases. The analysed case from 24–26 January 2019 was the most prolonged event registered so far, with 33 hourly reports of freezing rain in Bucharest. The high-pressure system involved had Scandinavian origin.
Because the database of freezing rain events has been built only for Bucharest city and surroundings, further in-depth analysis for a wide area will make the subject of a subsequent paper, focus on understanding the mesoscale processes and the role of Carpathian Mountains.

Author Contributions

Conceptualization, S.A., D.E. and B.A.; methodology, S.A., M.B. and D.E.; resources, L.M. and J.V.; software, D.E. and M.B.; formal analysis, S.A. and B.A.; investigation, S.A., D.E. and B.A.; writing—original draft preparation, S.A. and C.A.M.; writing-all authors; writing—review and editing, D.E., L.M. and J.V.; visualization, D.E., S.A. and M.B.; supervision, S.A. and D.E.

Funding

This research was funded by the Ministry of Research and Innovation through Program I–Development of the national research development system, Subprogram 1.2–Institutional Performance–Projects of Excellence Financing in RDI, Contract No.19PFE/17.10.2018, by the Romanian National Core Program Contract No.18N/2019; and by the European Regional Development Fund through the Competitiveness Operational Programme 2014–2020, POC-A.1-A.1.1.1-F-2015, project Research Centre for environment and Earth Observation CEO-Terra, SMIS code 108109, contract No. 152/2016.

Acknowledgments

The authors acknowledge the Copernicus–European Union’s Earth Observation Programme Service for providing ERA5 data, Copernicus Climate Change Service Climate Data Store, the University of Wyoming for maintaining the sounding database and the Romanian Emergency Service for providing the statics of emergency calls related to the freezing rain event analyzed in the article. The photo showed in Figure 2a was provided by Simona Andrei and the photos in Figure 2b,c were provided by Luminiţa Mărmureanu.

Conflicts of Interest

The authors declare no conflict of interest. The founders had no role in the design of the study; in the collection, analyses, or interpretation of data; in the writing of the manuscript, or in the decision to publish the results.

References

  1. American Meteorological Society. Freezing Rain. Gloss. Meteorol. 2019. Available online: http://glossary.ametsoc.org/wiki/Freezing_rain (accessed on 1 November 2019).
  2. Carriére, J.M.; Lainard, C.; Bot, C.L.; Robart, F. A climatological study of surface freezing precipitation in Europe. Meteorol. Appl. 2000, 7, 229–238. [Google Scholar] [CrossRef]
  3. Kämäräinen, M.; Hyvärinen, O.; Jylhä, K.; Vajda, A.; Neiglick, S.; Nuottokari, J.; Gregow, H. A method to estimate freezing rain climatology from ERA-Interim reanalysis over Europe. Nat. Hazards Earth Syst. Sci. 2017, 17, 243–259. [Google Scholar] [CrossRef] [Green Version]
  4. Martner, B.E.; Snider, J.B.; Zamora, R.J.; Byrd, G.P.; Niziol, T.A.; Joe, P.I. A remote-sensing view of a freezing-rain storm. Mon. Wea. Rev. 1993, 121, 2562–2577. [Google Scholar] [CrossRef]
  5. Norrman, J.; Eriksson, M.; Lindqvist, S. Relationships between road slipperiness, traffic accident risk and winter road maintenance activity. Clim. Res. 2000, 15, 185–193. [Google Scholar] [CrossRef] [Green Version]
  6. Rauber, R.; Olthoff, L.; Ramamurthy, M.; Miller, D.; Kunkel, K. A Synoptic Weather Pattern and Sounding-Based Climatology of Freezing Precipitation in the United States East of the Rocky Mountains. J. Appl. Meteor. 2001, 40, 1724–1747. [Google Scholar] [CrossRef]
  7. Juga, I.; Hippi, M.; Moisseev, D.; Saltikoff, E. Analysis of weather factors responsible for the traffic ‘Black Day’ in Helsinki, Finland, on 17 March 2005. Meteorol. Appl. 2012, 19, 1–9. [Google Scholar] [CrossRef]
  8. Degelia, S.; Christian, J.; Basara, J.; Mitchell, T.; Gardner, D.; Jackson, S.; Raglanda, J.; Mahana, H. An overview of ice storms and their impact in the UnitedStates. Int. J. Climatol. 2015, 36, 2811–2822. [Google Scholar] [CrossRef]
  9. Brooks, C. The nature of sleet and how it is formed. Mon. Wea. Rev. 1920, 48, 69–73. [Google Scholar] [CrossRef]
  10. Penn, S. The prediction of snow vs. rain. Forecasting Guide No. 2. In U.S. Weather Bureau; NOAA Central Library: Silver Spring, MD, USA, 1957; p. 29. [Google Scholar]
  11. Mahaffy, F. The Ice Storm of 25–26 February 1961 at Montreal. Weatherwise 1961, 14, 241–244. [Google Scholar] [CrossRef]
  12. Stewart, R.; King, P. Freezing Precipitation in Winter Storms. Mon. Weather Rev. 1987, 115, 1270–1279. [Google Scholar] [CrossRef]
  13. Pratert, E.; Borho, A. Doppler Radar Wind and Reflectivity Signatures with Overrunning and Freezing-Rain Episodes: Preliminary Results. J. Appl. Meteorol. 1992, 31, 1350–1360. [Google Scholar] [CrossRef]
  14. Rauber, R.M.; Ramamurthy, M.K.; Tokay, A. Synoptic and mesoscale structure of a severe freezing rain event: The St. Valentine’s Day ice storm. Weather Forecast. 1994, 9, 183–208. [Google Scholar] [CrossRef]
  15. Thoreson, A.D. Doppler radar case study of a freezing rain event. In Proceedings of the 27th Conference on Radar Meteorology, Vail, CO, USA, 9–13 October 1995; pp. 412–413. [Google Scholar]
  16. Zerr, R. Freezing Rain: An Observational and Theoretical Study. J. Appl. Meteorol. 1997, 36, 1647–1661. [Google Scholar] [CrossRef]
  17. Cortinas, J., Jr. A climatology of freezing rain over the Great Lakes region of North America. Mon. Weather Rev. 2000, 128, 3574–3588. [Google Scholar] [CrossRef]
  18. Kwon, S.; Byun, H.R.; Park, C.; Kwon, H.N. On the Freezing Precipitation in Korea and the Basic Schemes for Its Potential Prediction. Asia–Pac. J. Atmos. Sci. 2016, 52, 35–50. [Google Scholar] [CrossRef]
  19. Bocchieri, J. The Objective Use of Upper Air Soundings to Specify Precipitation Type. Mon. Weather Rev. 1980, 108, 596–603. [Google Scholar] [CrossRef]
  20. Huffman, G.; Norman, G., Jr. The Supercooled Warm Rain Process and the Specification of Freezing Precipitation. Mon. Weather Rev. 1988, 116, 2172–2182. [Google Scholar] [CrossRef]
  21. Rauber, R.; Olthoff, L.S.; Ramamurthy, M.K.; Kunkel, K.E. The relative importance of warm rain and melting processes in freezing precipitation events. J. Appl. Meteor. 2000, 39, 1185–1195. [Google Scholar] [CrossRef]
  22. McCray, C.; Atallah, E.; Gyakum, J. Long-Duration Freezing Rain Events over North America: Regional Climatology and Thermodynamic Evolution. Weather Forecast. 2019, 34, 665–681. [Google Scholar] [CrossRef]
  23. Ressler, G.; Milrad, S.; Atallah, E.; Gyakum, J. Synoptic-Scale Analysis of Freezing Rain Events in Montreal, Quebec, Canada. Weather Forecast. 2012, 27, 362–378. [Google Scholar] [CrossRef]
  24. Park, C.; Byun, H.R. Three Cases with the Multiple Occurrences of Freezing Rain in One Day in Korea (12 January 2006; 11 January 2008; and 22 February 2009). Atmosphere 2015, 25, 31–49. [Google Scholar] [CrossRef] [Green Version]
  25. Bresson, E.; Laprise, R.; Paquin, D.; Thériault, J.; de Elía, R. Evaluating the ability of CRCM5 to simulate mixed precipitation. Atmos. Ocean 2017, 52, 79–93. [Google Scholar] [CrossRef]
  26. Razy, A.; Milrad, S.M.; Atallah, E.H.; Gyakum, J.R. Synoptic-scale environments conducive to orographic impacts on cold-season surface wind regimes at Montreal, Quebec. J. Appl. Meteorol. Climatol. 2017, 51, 598–616. [Google Scholar] [CrossRef]
  27. Bernstein, B. Regional and local influences on freezing drizzle, freezing rain, and ice pellets. Weather Forecast. 2000, 15, 485–508. [Google Scholar] [CrossRef]
  28. Robbins, C.C.; Cortinas, J.V., Jr. Local and Synoptic Environments Associated with Freezing Rain in the Contiguous United States. Weather Forecast. 2002, 17, 47–65. [Google Scholar] [CrossRef]
  29. Markosek, J. Severe freezing rain in Slovenia. Eur. Forecast. Newsl. 2015, 20, 38–42. [Google Scholar] [CrossRef]
  30. Vajda, A. Impacts of severe winter weather events on critical infrastructure. In Proceedings of the RAIN WP2 Workshop on Past Severe Weather Hazards, Berlin, Germany, 27 February 2015; Available online: http://rain-project.eu/wp-content/uploads/2015/03/Vajda_RAIN_Berlin_workshop_FMI_AVajda.pdf (accessed on 1 November 2019).
  31. Manea, A.; Raliţă, I.; Dumitrescu, A.; Sommerfeld, A.; Wichura, B. Analysis of spatial and temporal distribution of freezing rain events in Romania and Germany. In Proceedings of the 13th International Workshop on Atmospheric Icing of Structures (IWAIS 2009), Andermatt, Switzerland, 8–11 September 2009. [Google Scholar]
  32. Eurostat. Population on 1 January by Age Groups and Sex-Cities and Greater Cities. 2019. Available online: http://appsso.eurostat.ec.europa.eu/nui/show.do?dataset=urb_cpop1&lang=en (accessed on 11 February 2019).
  33. Hersbach, H.; Bell, B.; Berrisford, P.; Horányi, A.; Sabater, J.; Nicolas, J.; Radu, R.; Schepers, D.; Simmons, A.; Soci, C.; et al. Global reanalysis: Goodbye ERA-Interim, hello ERA5. ECMWF Newsl. 2019, 159, 17–24. [Google Scholar] [CrossRef]
  34. Peters, G.; Fischer, B.; Andersson, T. Rain observations with a vertically looking Micro Rain Radar (MRR). Boreal Environ. Res. 2002, 7, 353–362. [Google Scholar]
  35. Kneifel, S.; Maahn, M.; Peters, G.; Simmer, C. Observation of snowfall with a low-power FM-CW K-band radar (Micro Rain Radar). Meteorol. Atmos. Phys. 2011, 113, 75–87. [Google Scholar] [CrossRef] [Green Version]
  36. Cha, J.; Chang, K.; Yum, S.; Choi, Y. Comparison of the bright band characteristics measured by Micro Rain Radar (MRR) at a mountain and a coastal site in South Korea. Adv. Atmos. Sci. 2009, 26, 211–221. [Google Scholar] [CrossRef]
  37. Weather Graphics. Global Surface Archives [World Meteorological Organization FM-12 SYNOP and FM-15 METAR Coded Data File. 2019. Available online: http://www.weathergraphics.com/gsa (accessed on 1 November 2019).
  38. Cortinas, J., Jr.; Bernstein, B.; Robbins, C.; Strapp, J. An Analysis of Freezing Rain, Freezing Drizzle, and Ice Pellets across the United States and Canada: 1976–90. Weather Forecast. 2004, 19, 377–390. [Google Scholar] [CrossRef]
  39. Reeves, H. The uncertainty of precipitation-type observations and its effect on the validation of forecast precipitation type. Weather Forecast. 2016, 31, 1961–1971. [Google Scholar] [CrossRef]
  40. Micu, D.; Dumitrescu, A.; Cheval, S.; Bîrsan, M. Climate of the Romanian Carpathians; Springer International Publishing: Cham Heidelberg, Germany; New York, NY, USA; Dordrecht, The Netherlands; London, UK, 2015; p. 213. [Google Scholar] [CrossRef]
  41. Bordei-Ion, E. Rolul Lantului Alpino-Carpatic in Evolutia Ciclonilor Mediteraneeni (The Role of the Alpine-Carpathic Chain Related to the Evolution of the Mediterranean Cyclones), 2nd ed.; Printech: Bucureşti, Romania, 2009; p. 138. [Google Scholar]
  42. Reeves, H.; Laaksonen, A.; Alper, M.E. Increasing large scale windstorm damage in Western, Central and Northern European forests, 1951–2010. Sci. Rep. 2017, 7, 46397. [Google Scholar] [CrossRef]
Figure 1. Study domain showing the synoptic and mesoscale (dark blue and black rectangles) areas over which analyses were performed. The red contour marks the Romanian territory. The black rectangle represents the location of Bucharest city and the measurement sites. The location of Romanian Atmospheric 3D Observatory (RADO)–Măgurele is indicated (red dot) together with the location of Băneasa (blue dot), Filaret (magenta dot) and Afumaţi (dark blue dot) weather stations. The A–B line shows the position of the cross-section in used in Section 3.2.
Atmosphere 10 00673 g001
Figure 2. (a) Freezing rain impact in Bucharest on 25 January 2019 and (b,c) ice accumulation in Măgurele (southwest of Bucharest). In (b) the ice layer on the branches was estimated at 2–4 cm.
Atmosphere 10 00673 g002
Figure 3. Synoptic analysis of freezing rain event between 24–26 January 2019 at 12 UTC, from ERA5. (a,c,e) shows mean sea level pressure (black contours) and 2 m temperature (shaded according to the scale). (b,d,f) shows the 700 hPa geopotential height (black contours) and temperature (shaded according the scale). The black rectangle marks the position of Bucharest.
Atmosphere 10 00673 g003
Figure 4. Regional and local analysis of freezing rain event during 24–26 January 2019 at 12 UTC from ERA5. (ac) shows temperature at 900 hPa ( C, shaded according to the scale every 1 C between −4 C–4 C and every 2 C for the remaining contours between −10 C–10 C). (df) temperature at 1000 hPa (as in ac). (gi) the south-north vertical cross section at 26 E (A–B, Figure 1) showing temperature (as in a–c), relative humidity (green dotted contours, 5% increments) and wind profile (one pennant, full barb, and half-barb denote 25, 5 and 2.5 m s 1 , respectively).
Atmosphere 10 00673 g004
Figure 5. (a) Time series of temperature profiles between 24–26 January 2019 from ERA5 (shaded according to the scale, as in Figure 3a–c). (b) Micro Rain radar attenuated reflectivity (dBz) observations from Măgurele during the same period as in (a). Temperature profiles from the Bucharest sounding at 00 and 12 UTC are overlapped with the radar reflectively, the black contours separating positive and negative temperature values.
Atmosphere 10 00673 g005
Figure 6. (a) The annual distribution of the number of freezing rain reports (orange bars) and the number of freezing rain days (i.e., days with a least one reports of freezing rain, grey bars) and (b) the monthly distribution of the number of freezing rain reports and the number of freezing rain days between 1980–2018 based on SYNOP observation from Băneasa station.
Atmosphere 10 00673 g006
Figure 7. The distribution of non-overlaping periods with freezing rain between 1980–2018 based on SYNOP observation from Băneasa weather station.
Atmosphere 10 00673 g007
Figure 8. The composite maps of the two main synoptic patterns for prolonged freezing rain events: (a) the Scandinavian pattern, (b) the East European pattern, (c) lee cyclones corresponding to the Scandinavian pattern and (d) lee cyclones corresponding to East European pattern. Mean sea level pressure (black contours) and 2 m temperature (shaded according to the scale).
Atmosphere 10 00673 g008
Table 1. Classification of the moderate (2 consecutive days) and long-duration (3 consecutive days) freezing rain events in Bucharest based on the origin of the high-pressure system. The event analyzed in this article is indicated in red.
No.IntervalNo. of Days with Freezing RainClassification of High-Pressure System
130 Dec–1 Jan 19863Scandinavian origin
213–15 Jan 19873Scandinavian origin
31–3 Dec 19883Scandinavian origin
424–26 Jan 20193Scandinavian origin
56–7 Jan 19852Scandinavian origin
69–10 Feb 19852East-European origin
720–21 Nov 19852East-European origin
87–8 Feb 19872East-European origin
921–22 Nov 19932East-European origin
1027–28 Dec 19952Scandinavian origin
114–5 Feb 19962Scandinavian origin
122–3 Jan 19972Scandinavian origin
1311–12 Jan 19972Scandinavian origin
144–5 Dec 19982East-European origin
1526–27 Dec 19992Lothar windstorm periphery
166–-7 Dec 20022East-European origin
171–-2 Dec 20102Scandinavian origin
184–-5 Feb 20122Scandinavian origin
1929–30 Nov 20142East-European origin
207–-8 Feb 20172Scandinavian origin

