Article

Characteristics of PM2.5 at a High-Altitude Remote Site in the Southeastern Margin of the Tibetan Plateau in Premonsoon Season

1
School of Chemical and Environmental Engineering, Jiangsu University of Technology, Changzhou 213001, China
2
Key Laboratory of Aerosol Chemistry and Physics, State Key Laboratory of Loess and Quaternary Geology, Institute of Earth Environment, Chinese Academy of Sciences, Xi’an 710061, China
3
CAS Center for Excellence in Quaternary Science and Global Change, Xi’an 710061, China
4
School of Social & Environmental Development, National Institute of Development Administration (NIDA), Bangkok 10240, Thailand
5
Institute of Global Environment Change, Xi’an Jiaotong University, Xi’an 710049, China
*
Authors to whom correspondence should be addressed.
Atmosphere 2019, 10(11), 645; https://doi.org/10.3390/atmos10110645
Submission received: 9 September 2019 / Revised: 16 October 2019 / Accepted: 22 October 2019 / Published: 25 October 2019
(This article belongs to the Special Issue Rural and Remote Aerosol)

Abstract

:
The Tibetan Plateau (TP) is one of the world’s most sensitive areas for climate change. Previous studies have revealed that air pollutants emitted from South and Southeast Asia can be transported to and have a negative impact on the TP. However, the majority of the investigators have focused on the pollutant transport processes from South Asian regions (i.e., India and Bangladesh) and parts of Southeast Asia, while the regions adjacent to the southeast fringe of the TP (i.e., Burma and the Sino-Burmese border) have been neglected. Here, fine particulate matter (PM2.5) samples were collected during the period 11 March to 13 May 2018 at Gaomeigu, a high-altitude remote site in the southeastern margin of the TP. Characteristics, sources of PM2.5, and the potential source regions for different chemical components were investigated. During the sampling time, PM2.5 mass loadings ranged from 3.79 to 54.57 µg m−3, with an arithmetic mean concentration of 20.99 ± 9.80 µg m−3. In general, major peaks of organic carbon (OC) and elemental carbon (EC) always coincided with high loadings of K+ and NO3, which implies that common combustion sources caused these species’ concentrations to covary, while the daily variations of crustal elements showed different trends with the other chemical compositions, suggesting different source regions for crustal materials. Five source factors were identified as possible aerosol sources for PM2.5 by positive matrix factorization (PMF). They are the mining industry (5.3%), characterized by heavy metal elements; secondary formation (18.8%), described by the high concentrations of NH4+ and SO42−; traffic-related emissions (26.7%), dominated by carbonaceous species (especially soot-EC) and some metal elements; fugitive dust (15.2%), represented by crustal elements (Ti, Fe, and Mn), Ca2+, and Mg2+; and biomass burning (34.0%), which is typified by high concentrations of K+, NO3, char-EC, primary OC, and secondary OC. The concentration-weighted trajectory (CWT) analysis results showed that the northeast part of Burma is the potential source region for high concentrations of EC and NO3 due to biomass burning emissions, while the tourism industry surrounding Gaomeigu gave strong grid cell values of SO42− as well as moderate values of EC and NO3. Moreover, the mining industry in the southwest direction of Gaomeigu has important impacts on the zinc concentrations.

1. Introduction

The Tibetan Plateau (TP, latitude: 26–29° N, longitude: 73–104° E) is one of the world’s most sensitive areas for climate change [1,2,3]. Due to being located in the immediate vicinity of densely populated and industrialized regions, the increased atmospheric aerosol pollution has significantly impacted the TP’s atmospheric and ecological environment (e.g., glacier shrinkage) over the past decades [4,5,6,7]. Knowledge on compositions, sources, and properties of atmospheric aerosols at the TP is urgently needed, not merely for assessing the effects of pollutants transport [8,9,10,11,12], but also for understanding large-scale aerosol impacts on biogeochemical cycles and climate change [1,13,14].
In recent years, increasing scientific attention has been directed towards atmospheric pollutant transport from South and Southeast Asia and its potential influence on the TP [12,15]. Due to natural forest fires and human-initiated burning activities, particularly agricultural residues combustion, large amounts of atmospheric pollutants are emitted during the dry season in South and Southeast Asia [16,17]. Thus, aerosol concentrations have increased significantly in the TP, especially during the premonsoon period (March–May), under the favorable regional meteorology and boundary-layer dynamics [11]. The monitoring of such a large and high-altitude region, however, cannot cover the entirety of the TP. The majority of studies have been conducted on the Himalayan–Nepalese region [10,12,15,17,18,19,20,21], and some have been carried out on the southeast part of the TP [4,6,11,22], the inner TP [23,24], the northeast TP [25,26], and the western TP regions [27]. Comparatively, atmospheric monitoring of the southeastern margin of the TP region has been relatively rare. Indeed, the southeastern margin of the TP is an important area, located in a transitional zone (average of 3000–4000 m above sea level (a.s.l.)) between the high-altitude TP (average of ~4000 m a.s.l.) and the low-altitude Yunnan–Guizhou Plateau (average of ~2000 m a.s.l.). This area is regarded as one of the “channels” where air pollutants are transported from the upwind regions to the inner TP. Based on global chemical transport models [7,28] and in situ aerosol observations [5], atmospheric brown cloud pollutants from South Asia could be transported up to 5 km above sea level though a “direct channel”. Meanwhile, even though the sources and influence of biomass burning activities in South and Southeastern Asia on regional air quality and climate have been studied extensively [1,16,22,28], few studies have examined the impacts of air pollutant transport from regions near Burma and the Sino-Burmese border.
Until now, the effects of Tibetan aerosol on regional climate variability have remained largely unknown, and this is partly due to the limited observations over the plateau. Here, fine particulate matter (PM2.5) samples were collected at a high-altitude remote site close to the Sino-Burmese border in the southeastern fringe of the TP during the premonsoon season. The mass and related chemical components (carbonaceous components, water-soluble ions, and elements) were analyzed. The objectives of this study were (1) to investigate the general characteristics of PM2.5 and the related chemical composition, (2) to quantitatively apportion the contributions from different sources for PM2.5 loadings, and (3) to identify the source regions responsible for PM2.5 and the selected chemical components in this region.

2. Materials and Methods

2.1. Aerosol Sampling

Sampling was performed at the Lijiang Astronomical Station, Chinese Academy of Sciences (100.03° E, 26.70° N; altitude 3260 m) in Gaomeigu, Yulong County, Yunnan Province, China, which is located in the southeastern margin of the TP, as shown in Figure S1a in the supporting material. It is approximately 120 km in a straight-line distance to the east of the Burma border, and 30 km away from the center of Lijiang city. Gaomeigu is a remote site away from populated regions with no major anthropogenic sources nearby. A total of 64 PM2.5 samples were collected from 11 March to 13 May 2018 on 20 cm × 25 cm QM-A quartz-fiber filters (Whatman Ltd., Maidstone, UK) using a high-volume air sampler (model TE-6070 Tisch Inc., Village of Cleves, OH 45002 USA) with an airflow rate of 1.1 m3 min−1. The sampler was positioned on the rooftop of a building, approximately 10 m above ground. Before sampling, all filters were pre-baked at 900 °C for 3 h to remove organic contaminants. Each sample was continuously collected for 24 h. In addition, one filed blank filter was collected by mounting a blank filter in the sampler without sucking any air, to account for any artifacts introduced during the handling process.

2.2. Laboratory Analyses

The aerosol samplers were analyzed for mass concentrations, carbonaceous aerosol fractions, major ions, and elements in the laboratory. Before and after the sampling, quartz-filters were equilibrated in a controlled room with temperature 20–23 °C and relative humidity between 35% and 45% for 24 h, and then weighed with an electronic microbalance with ± 0.1 mg sensitivity (Sartorius LA130 S-F, Göttingen, Germany). The relative standard deviations (RSDs) for the weighing of pre- and post-sampling filters were lower than 0.01% and 0.03%, respectively.
Organic carbon (OC) and elemental carbon (EC) in the samples were determined by thermal-optical analysis by a thermal/optical OCEC analyzer (model DRI_2001A, Atmoslytic Inc., Calabasas, CA, USA). Briefly, particulate carbon is most commonly measured using thermal techniques by different thermal/optical protocols. IMPROVE (Interagency Monitoring of Protected Visual Environments), NIOSH (National Institute for Occupational Safety and Health), and EUSAAR_2 (European Supersites for Atmospheric Aerosol Research) are the three mainstream thermal/optical protocols for carbon analysis [29,30,31], differing in the optical method for charring correction and in thermal evolution programs [32,33]. Different protocols yield consistency in total carbon determination but discrepancies in the OC/EC split. For example, IMPROVE exhibits much higher EC than the NIOSH-derived protocol owing to the lower temperature of the OC4 step in the IMPROVE method [33,34,35]. However, because of the lacking of definitive standards for OC and EC, these terms are defined by the protocol applied instead of a fundamental quantity [34]. In this study, the samples were analyzed following the IMPROVE_A protocol. This produced four OC fractions (OC1, OC2, OC3, OC4) in 100% He atmosphere at stepwise temperatures of 140, 280, 480, and 580 ℃, respectively; three EC fractions (EC1, EC2, and EC3) in a He/O2 atmosphere with stepped heating of 580, 740, and 840 ℃, respectively, and an OP fraction (pyrolyzed carbon, determined when reflected laser light returns to its initial value after O2 was injected to the analysis atmosphere). The protocol defined OC as OC1 + OC2 + OC3 + OP4 + OP, and EC as EC1 + EC2 + EC3 - OP. The EC fraction was further divided into char-EC (defined as EC1-OP) and soot-EC (defined as EC2 + EC3) according to Han, et al. [36]. The method detection limits (MDLs) were 0.41 μg cm−2 for OC and 0.03 μg cm−2 for EC. Specific quality assurance/quality control (QA/QC) procedures for this analysis can be referred to in the previous study [37].
The concentrations of five inorganic cations (Na+, NH4+, K+, Mg2+, and Ca2+) and three inorganic anions (Cl, NO3, and SO42−) in the samples were extracted with purified water (18.2 M Ω cm) and measured with a DX-600 ion chromatography system (Dionex Inc., Waltham, MA 02451 USA). The concentrations of major elements (including Ca and Fe) and trace elements (including Ti, Mn, Cu, As, Pb, Zn, and Br) on the quartz-fiber filters were determined using an ED-XRF analyzer (Epsilon-5 energy-dispersive X-ray fluorescence spectrometry, PANalytical, Netherlands). Details of the accuracies, precisions, and QA/QC procedures of the inorganic ions and ED-XRF measurements are described in previous publications [38,39,40,41]. It should be noted, at least 10% of the samples were chosen at random for replicated analysis, and the determined repeatability was <10% for all the analytical species. In addition, all the analytical species concentrations (carbonaceous components, ions, and elements) were corrected by subtracting the field blank values.

2.3. PM2.5 Source Apportionment

For source apportionments, receptor-oriented models have been in broad use in source-type quantification, which facilitate the source contributions based on atmospheric concentrations. Receptor modeling by positive matrix factorization (PMF) can identify presumptive sources by apportioning the measured ambient PM2.5 concentration and composition data by multiple linear regression (MLR) calculation, and this approach is typically applied when the source profiles are unknown [42]. A detailed explanation of the principle of PMF can be found elsewhere [43,44]. In PMF analysis, PMF seeks a solution that minimizes an object function, which is defined as the sum of the squared residuals weighted by the respective uncertainties, and the rotational freedom parameter (Fpeak) is used to control rotational ambiguity [45]. In this study, no significant effect of Fpeak values (range: −0.2 to 0.2) on the source profiles or contributions of PMF solutions was found. Therefore, this value was set at 0 in the final model.

2.4. Concentration-Weighted Trajectory (CWT) Analysis

CWT analysis is an effective method to identify the relative significance of potential sources at the receptor on the basis of the hybrid single-particle Lagrangian integrated trajectory (HYSPLIT) model [46]. Briefly, if the geographical field surrounding the receptor site is divided into grid cells (defined by the cell indices i and j), the CWT value for the ijth cell is defined as follows:
C i j =   l = 1 M C l τ i j l l = 1 M τ i j l
where M is representative of the total number of trajectories, l is the index of the trajectory, Cij describes the weighted average concentration in the ijth grid cell, Cl describes the measured concentration at the sampling site on the trajectory l, and τijl represents the time spent in the ijth grid cell by the backward trajectory l. A high value of Cij suggests that air parcels traveling over the ijth cell are in general associated with relatively high concentrations at the receptor site.
In this study, each daily trajectory was calculated for arrival heights of 1000 m above ground using the National Oceanic and Atmospheric Administration (NOAA) HYSPLIT model [47]. Then, CWT analysis was performed based on three-day air mass trajectories which were calculated backward in time to identify the source regions responsible for PM2.5 and the selected chemical components (including EC, SO42−, NO3, Fe, and Zn). A detailed description of the CWT procedures may be found in our previous work [48].

3. Results and Discussion

3.1. General Characteristics of PM2.5 and Chemical Compositions

Table 1 summarizes the concentrations of PM2.5, carbonaceous species, water-soluble ions, and elements during the sampling period. PM2.5 loadings ranged from 3.79 to 54.57 µg m−3, with an arithmetic mean concentration of 20.99 ± 9.80 µg m−3. More than 95% of the data were lower than the Target-1 standard for 24 h average PM2.5 mass in the National Ambient Air Quality Standards (NAAQS) for China (35 µg m−3; GB3095-2012), but 68% of the daily PM2.5 concentration exceeded the NAAQS of the U.S. Environmental Protection Agency (15 µg m−3). For carbonaceous species, the overall average concentrations of OC and EC were 3.92 ± 1.94 and 0.68 ± 0.36 µg m−3, respectively, accounting for ~19.31% and 3.24% of PM2.5 mass. The average water soluble inorganic species (WSIS) concentration was 5.38 ± 2.47 µg m−3 during the campaign, accounting for 27.06% ± 7.22% of the total PM2.5 mass. The values of PM2.5 and related chemical components were somewhat lower than previous data collected in Tengchong County (about 300 km southwest of our sampling site) from 7 April to 24 May 2004 [16]. This may be due to the closer distance of Tengchong to the Sino-Burmese border and Southeast Asia, thus making it more sensitive to aerosol particle transport than Gaomeigu. Overall, the relatively low levels of PM2.5 in Gaomeigu could be considered to be the regional background concentrations for this part of the TP.
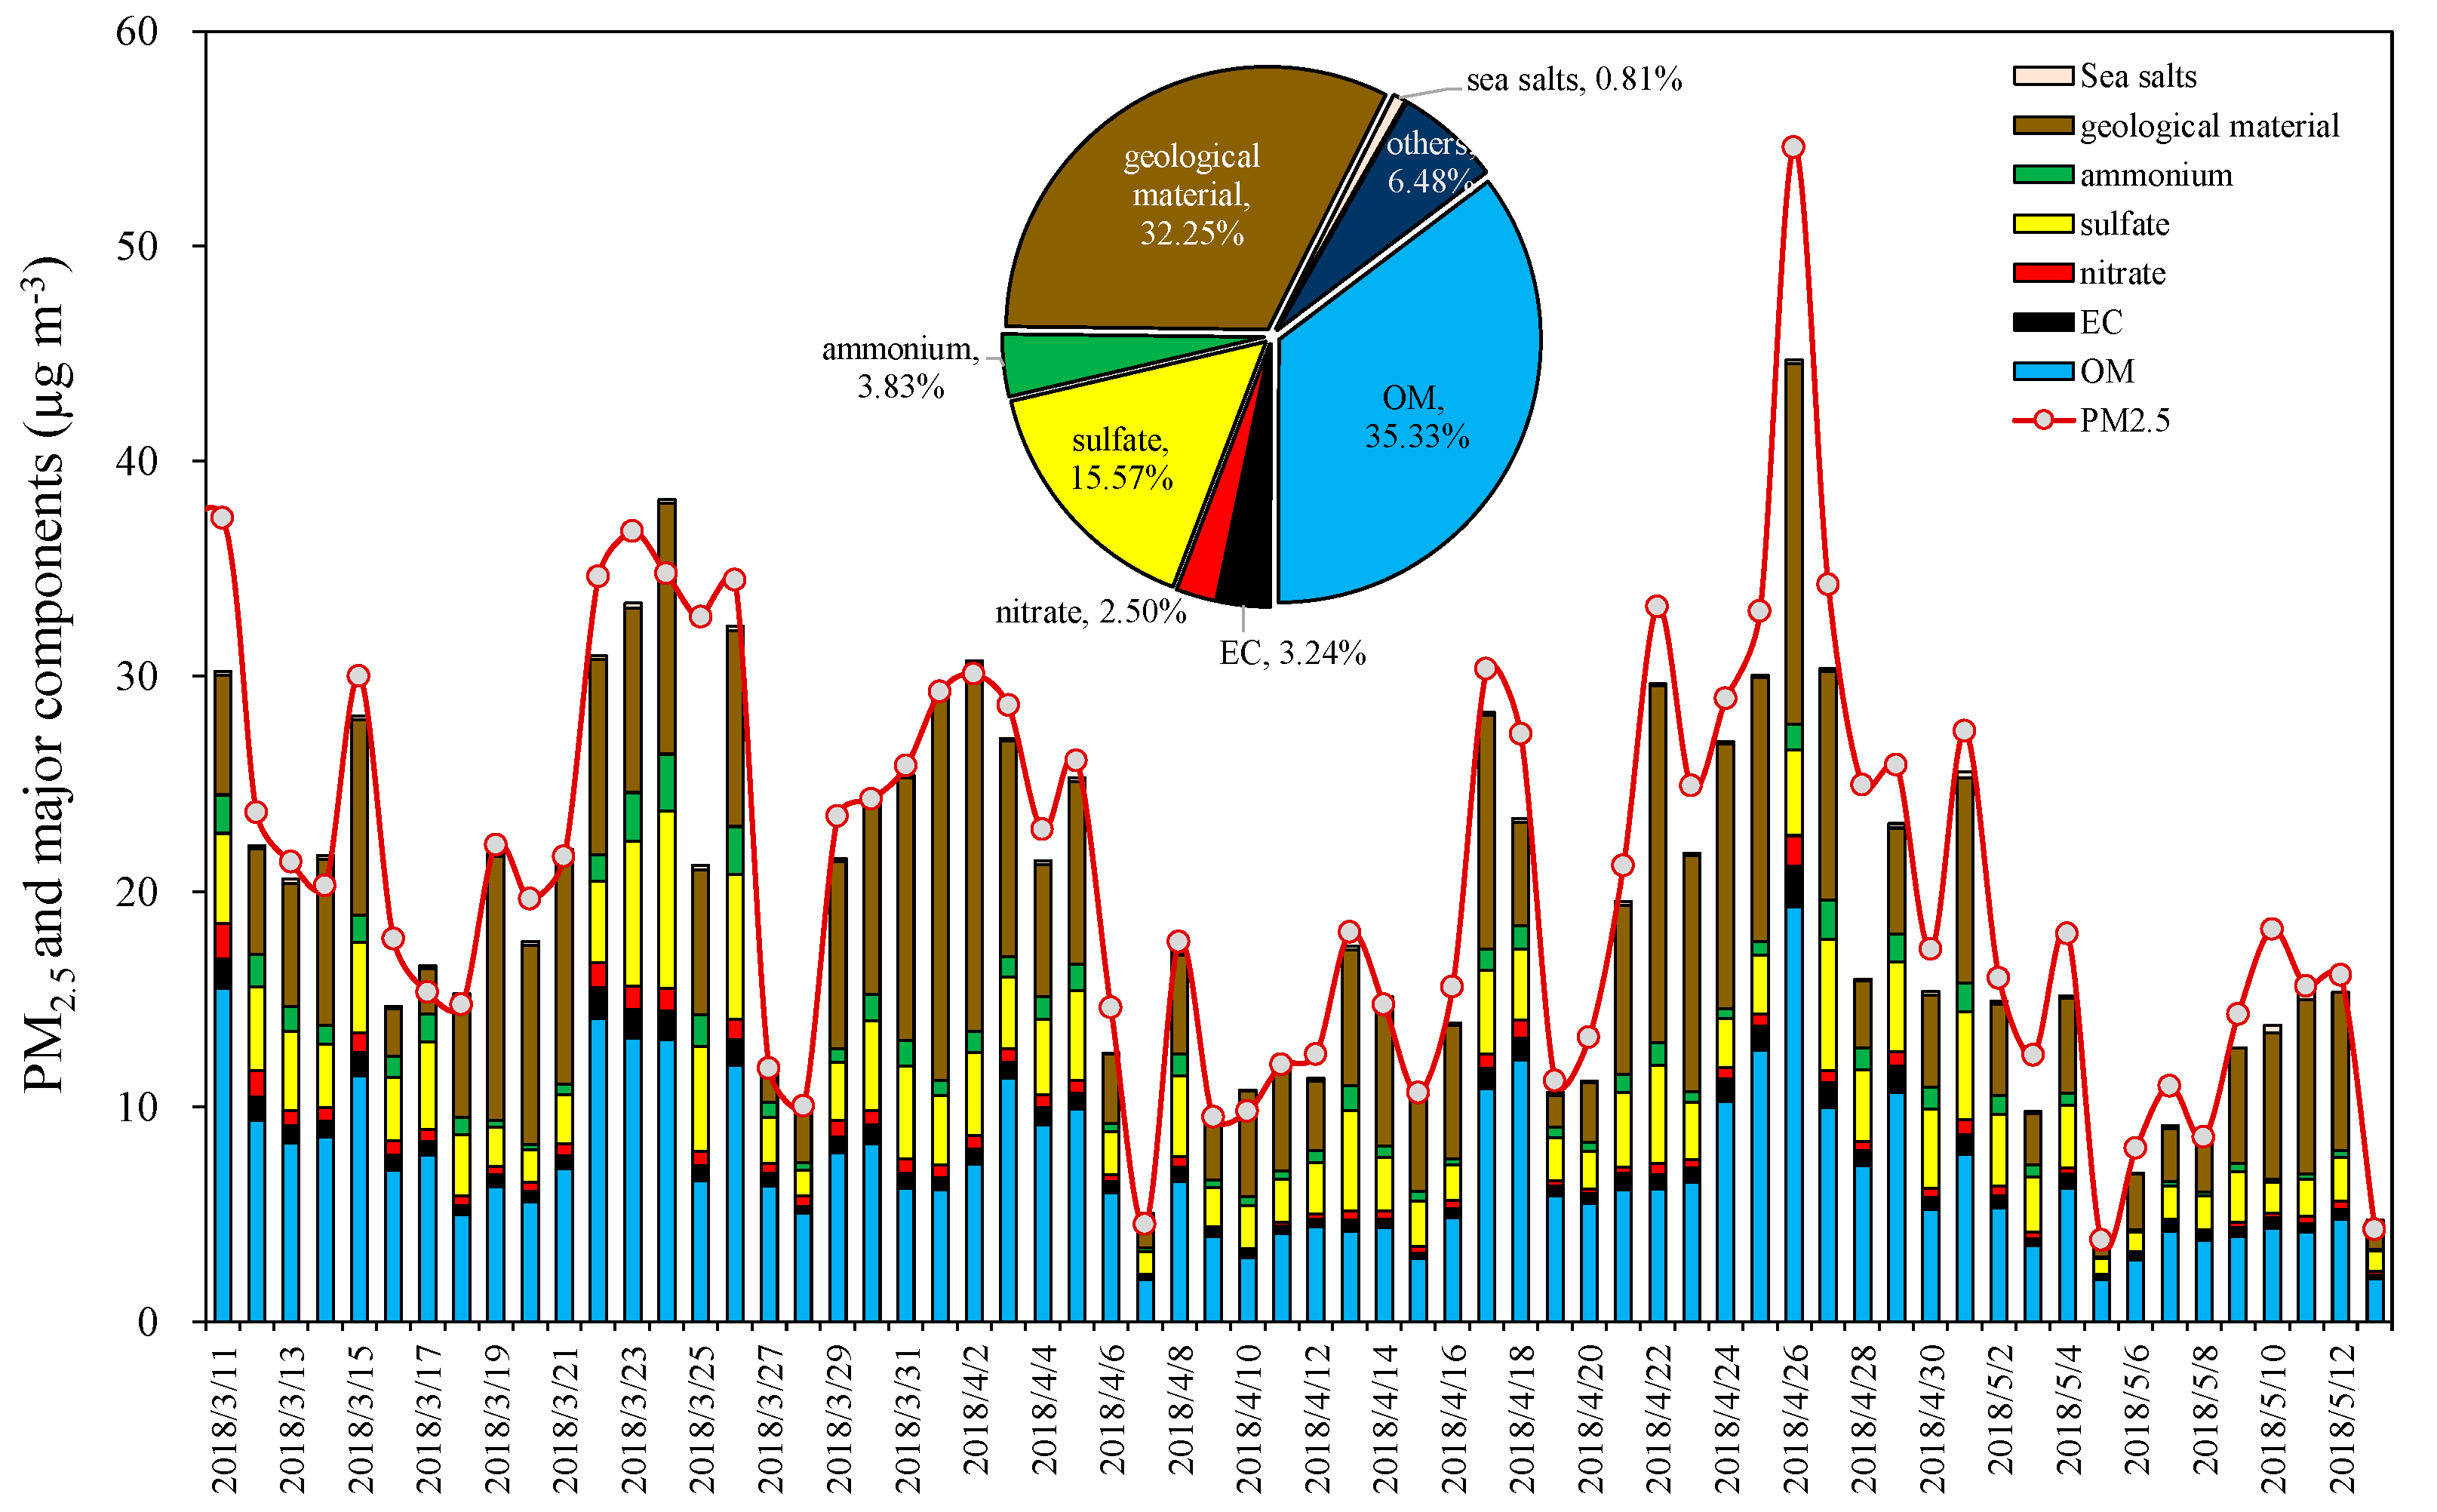
Figure S2 shows the daily variations of PM2.5 and major chemical components at the Gaomeigu site. In general, major peaks of OC and EC always coincided with high loadings of K+ and NO3, which implies that common combustion sources caused these species’ concentrations to covary. According to the three-day trajectories at 1000 m a.g.l. for each day, which were computed using the NOAA HYSPLIT4 model, and the clusters analysis results, as shown in Figure S1b, showed that during the sampling periods, air masses transported mainly from the west and southwest (mainly in the northeast part of Burma and the Sino-Burmese border) to Gaomeigu accounted for 65.6% and 39.7% of all of the trajectories, respectively, and only 5% of the air masses transported from the east (inner China). This indicates the important influence of Southeast Asia, where intensive burning activities or natural forest fires occur frequently during the premonsoon season [16,49].
In addition, there were two significant build-ups for different atmospheric pollutant periods—from 22 to 26 March (Period 1: five days, with a PM2.5 average of 34.67 µg m−3) and 25 to 27 April (Period 2: three days, with a PM2.5 average of 40.61 µg m−3). The highest levels of NH4+ and SO42− were observed during Period 1, while OC, EC, K+, and NO3 were more pronounced in Period 2. These phenomena indicate different formation or removal processes for ammonium and sulfate (i.e., secondary formation in addition to combustion emissions) compared with the other components. For crustal elements, the daily variations showed different trends with the other chemical compositions, suggesting different source regions for crustal materials with other species.

3.1.1. Carbonaceous Aerosol

The ratios of OC/EC ranged from 4.38 to 11.20, with an average of 6.1 ± 1.1. Such high ratios are commonly found in different parts of the TP (e.g., the Qomolangma Station for Atmospheric and Environmental Observation and Research (QOMS) [12] and the Nepal Climate Observatory-Pyramid (NCO-P) stations [10] on the south slopes of the Himalayas and Lulang from the southeast TP [4] during the premonsoon season). EC is commonly produced during incomplete combustion of residential coal, motor vehicle fuel, and biomass [50,51]. OC originates from similar primary anthropogenic sources as EC but can also form from secondary, photochemical processes, both natural (biogenic) and anthropogenic [52,53]. To clarify the effects of emission sources in relation to fossil fuel combustion and biomass burning, we considered primary OC (POC), secondary OC (SOC), char-EC, and soot-EC. POC and SOC were estimated by an EC-tracer method [53], which uses the following equation: SOC = OC – EC × (OC/EC)min and POC = OC – SOC, where (OC/EC)min is the minimum ratio observed during the sampling period. As shown in Table 1, POC and char-EC were the dominant fractions, accounting for ~74.9% and ~81% of total OC and EC, respectively.
Previous works have reported that char-EC formed directly from the organic substances (i.e., fossil fuel, biomass) by pyrolysis, or as an impure form of graphitic carbon obtained as a residue when carbonaceous material is partially burned or heated with limited air, whereas soot is formed and re-condensed at high temperature via gas-phase processes by incomplete combustion [54,55]. Table S1 shows the Pearson correlations carried out to investigate any relationships among chemical components in PM2.5. Excellent correlation between POC and char-EC was observed (r2 = 0.96), meaning that POC shared a common combustion source with char-EC. However, SOC did not show significant correlation with any other species. We speculated that biogenic volatile organic compounds (BVOCs, such as isoprene and lignin pyrolysis products) emitted from pine trees and broad-leaved trees surrounding the sampling site could act as natural precursors, which could be responsible for the formation of SOC through photo-oxidation or multiphase reactions under the strong solar radiation at the TP.

3.1.2. Water-Soluble Ions

To clarify the neutralization of ionic species in the atmosphere, we estimated ion equivalency with all cations and anions, and it showed a slope of 0.96 and r2 = 0.92, as shown in Figure 1a. The strong correlation implies that most of the ionic components were measured, and the PM2.5 aerosols were almost neutral. SO42− (3.10 ± 1.49 µg m−3) ranked highest in terms of mass, followed by NH4+ (0.83 ± 0.56 µg m−3), as ~57.2% and 14.0% of the total measured ions, respectively. Interestingly, relatively high NH4+ but low NO3 (0.53 ± 0.32 µg m−3) values were observed in Gaomeigu.
K+ is generally considered as a tracer for biomass burning [56] but also has other emission sources, such as mineral aerosols or sea salts aerosols [57]. In this study, K+ is found to correlate strongly with char-EC with a correlation coefficient of 0.84 but was weakly associated with those crustal species (i.e., Fe, Mn, and Ca2+) and Cl, indicating that K+ mainly originated from combustion activities that lead to K+ and char-EC association. Thus, K+ was used as the marker of biomass burning in this study. The correlation coefficients among major species, as shown in Table S1., revealed that (1) NH4+ showed correlation with SO42− (r2 = 0.94) and moderate correlations with char-EC, POC, and K+; (2) NO3 was in strong correlation with char-EC (r2 = 0.84), POC (r2 = 0.79), and K+ (r2 = 0.79) but had moderate correlations with SO42− (r2 = 0.47) and NH4+ (r2 = 0.61); and (3) NH4+ and SO42− also showed good correlations with Pb and Br. These values suggest that NO3 might be more impacted by the combustion sources (especially biomass burning) than secondary formation. In contrast, NH4+ and SO42− were influenced by multiple sources, including fossil fuel, secondary formation, and biomass burning.
Gaseous ammonia first reacts with H2SO4 to form (NH4)2SO4 and the remaining free ammonia then reacts with HNO3 to form fine particulate NH4NO3 salt [58]. Ion balances of ammonium and sulfate equivalent concentration (NH4+ = 0.85 × SO42−, r2 = 0.89) as shown in Figure 1b, suggested that limited ammonium led to the existence as NH4HSO4 and (NH4)2SO4. No sufficient ammonium was available to neutralize the nitrated NH4NO3. A previous study by Shen, et al. [59] pointed out that water soluble Ca2+ from mineral dust is important for neutralizing acidic species at remote sites due to the relatively low ammonium concentrations. Further investigation using the relationships between NH4+ + Ca2+ and SO42 + NO3 with a slope of 1.05 and r2 = 0.94 indicated the existence of CaSO4 and Ca(NO3)2 in addition to (NH4)2SO4.

3.1.3. Minerals and Trace Elements

Table 1 showed the mean, minimum, and maximum values of the elemental concentrations. Crustal elements, such as Ca and Fe, were the most abundant species, followed by elements related to anthropogenic processes in the order of Zn > Cu > Pb > Br > As. As shown in Table S1, good correlations were found between Ca, Fe, Mn, and Ca2+, indicating a common influence of geological sources and road dust resuspension. For trace elements, Br showed good correlations with the biomass burning marker (K+, r2 = 0.65), combustion indicators (POC and char-EC, r2 = 0.65 – 0.71), secondary indicators (SO42−, NH4+, and NO3, r2 = 0.68 – 0.85), and Pb (r2 = 0.53), suggesting complex combusted emission sources and possible transport to Br. Trace elements Cu, Zn, and As were not strongly inter-correlated with other components, indicating that the atmospheric occurrence of these elements is influenced by different sources.

3.1.4. Material Balance

For material balance calculations, groupings included organics, geological material, secondary inorganic aerosols (sulfate, nitrate, and ammonium), EC, sea salts, and others. The dust (geological material) was calculated by dividing the measured elemental Fe concentration by 5.22%; this conversion was based on a prior study which showed that Fe accounts for 5.22% of the topsoil in Yunnan Province [60]. The OC to organic matter (OM) conversion factor (fOM/OC) was estimated based on the mass balance approach according to Srinivas and Sarin [61] by the following equation:
fOM/OC = [PM2.5 − (WSIShydrated + DUST + EC + nss-K+)]/OC
where, WSIShydrated = 1.29 × (nss-SO42− + NO3 + NH4+ + sea salt), which corresponds to the concentration of hydrated water-soluble inorganic species [62]. Sea salt was estimated as 3.2 × Na+ [63]. Non-sea-salt SO42 (nss-SO42−) and non-sea-salt K+ (nss-K+) were calculated as SO42− – 0.252 × Na+ and K+ – 0.036 × Na+, respectively [62]. Based on the approach, the averaged conversion factor during the sampling time varies from 1.1 to 5.38, with an average of 1.95 ± 0.74. It should be noted that five samples with a conversion factor less than one were excluded due to no physical meaning of these samples.
The mean conversion factor (1.95) was used here to reconstruct the mass closure. The mass fraction of an individual component during the sampling time is presented in Figure 2. Approximately ~6.48% of the measured mass was not quantified by the chemical analysis. Reconstructed mass and gravimetric PM2.5 mass showed good correlations with each other (gravimetric PM2.5 = 1.09 × reconstructed mass, r2 = 0.94). Possible errors or uncertainties in the gravimetric analyses could be responsible for the differences between reconstructed mass and gravimetric PM2.5 on several days. The largest PM2.5 components were the organics, constituting 35.3% ± 8.1% of PM2.5 mass. Followed by the organic matter, geological material constituted an average of 32.3% ± 11.9% of PM2.5 mass, which is consistent with previous works carried out in remote sites in the TP [4,25]. The third-largest component, secondary inorganic aerosols, constituted 21.9% of PM2.5 mass, with 15.6% ± 4.53% of sulfate, 3.83% ± 1.67% of ammonium, and 2.50% ± 0.86% of nitrate. The EC contribution to PM2.5 was relatively stable, ranging from 1.9% to 4.7% during the sampling period. However, no clear pattern was observed between the higher and lower PM2.5 days.

3.2. Source Apportionment

The aerosol data, including POC, SOC, char-EC, soot-EC, NH4+, K+, Mg2+, Ca2+, F, Cl, NO3, SO42, Ba, Ti, Mn, Fe, Ni, Cu, Zn, As, and Pb, were used in source apportionment analyses, following the procedures described by Green, et al. [64]. After iterative testing from four to seven factors in modeling exercises, five major factors were identified, and the profiles for each factor and the factor loadings are shown in Figure 3.
Factor 1 was dominated by the heavy metal elements (including Ba, Ni, Cu, Zn, As, and Pb), which accounted for 5.3% of the total PM2.5 mass. We concluded that this factor was the mining industry. The Sanjiang metallogenic belt in the TP is one of the most important mineral resources for precious and base metals in China and is also an integral part of the global metallogenic belt [63,65]. As a result, Yunnan Province is called the “kingdom of nonferrous metals” in China due to its rich mineral resources. The Lanping basin (99.0–99.7° E, 26.0–26.87° N), located in the western part of Yunnan Province, is famous for its metal ore deposits enriched with lead, zinc, copper, and silver [66]. Also, Burma is a country endowed with rich mineral resources that benefits from favorable geological conditions; thus, it has several world-renowned mineral deposits and mines [67]. For example, the Jinding deposit in the Lanping basin (yellow diamond in Figure S1a) and the Bawdwin mines (97.3° E, 23.1° N, blue diamond in Figure S1a) in northeastern Burma are world-class supergiant Pb–Zn deposits (associated with copper–nickel–cobalt paragenesis) [67]. These trace elements might be from mineral exploration processes.
The NH4+, and SO42 concentrations in the profiles of the second factor were relatively high, and this factor is most readily explained as secondary formation. This factor accounted for 18.8% of PM2.5 and was nearly equal to the combination of the sulfate/PM2.5 ratio and the ammonium/PM2.5 ratio in the material balance.
The third PMF factor was dominated by carbonaceous species (soot-EC, POC, SOC, and char-EC), followed by some heavy metal elements (i.e., Ni and Zn) and crustal elements (i.e., Ba, Ti, Mn, and Fe), contributing 26.7% to PM2.5. Previous studies have proved that the main elements related to vehicle exhaust are Pb, Br, Zn, Ni, and Cu [24,68]. For example, Ni may be emitted from fuel burning as well as vehicular emissions [69]. Zn could be derived from the abrasion of rubber tires on roads [70]. Therefore, this factor is most probably traffic-related emissions. Despite Gaomeigu being a remote site with no nearby anthropogenic emissions, there are several famous tourist spots in the area, such as Lijiang city (straight-line distance: ~30 km) to the northeast, the Shangri-La spot (straight-line distance: ~20 km) to the north, Dali to the south, and Nujiang Lisu Autonomous Prefecture to the west. The PM2.5 in Gaomeigu would be perturbed by the tourism industry (i.e., vehicular emissions from tourist visits).
Factor 4 was enriched in crustal elements (i.e., Ti, Mn, and Fe), as well as Ca2+ and Mg2+, clearly representing mineral aerosol and fugitive dust, which accounted for 15.2% of PM2.5. This contributed value was much lower than that of geological material to PM2.5 in the material balance. Various product and transport processes of geological material (including naturally windblown dust, agricultural tilling, traffic-related road dust, mining explorations, etc.) could be responsible for the differences between the two ratios.
The fifth PMF factor was the largest contributor (34.0%) to PM2.5 mass, and this factor had high loadings for K+ and NO3 and moderate loadings for POC, SOC, and char-EC, which is best interpreted as biomass burning during the sampling time, confirming the important influence of biomass burning in Gaomeigu.

3.3. Identification of Source Regions

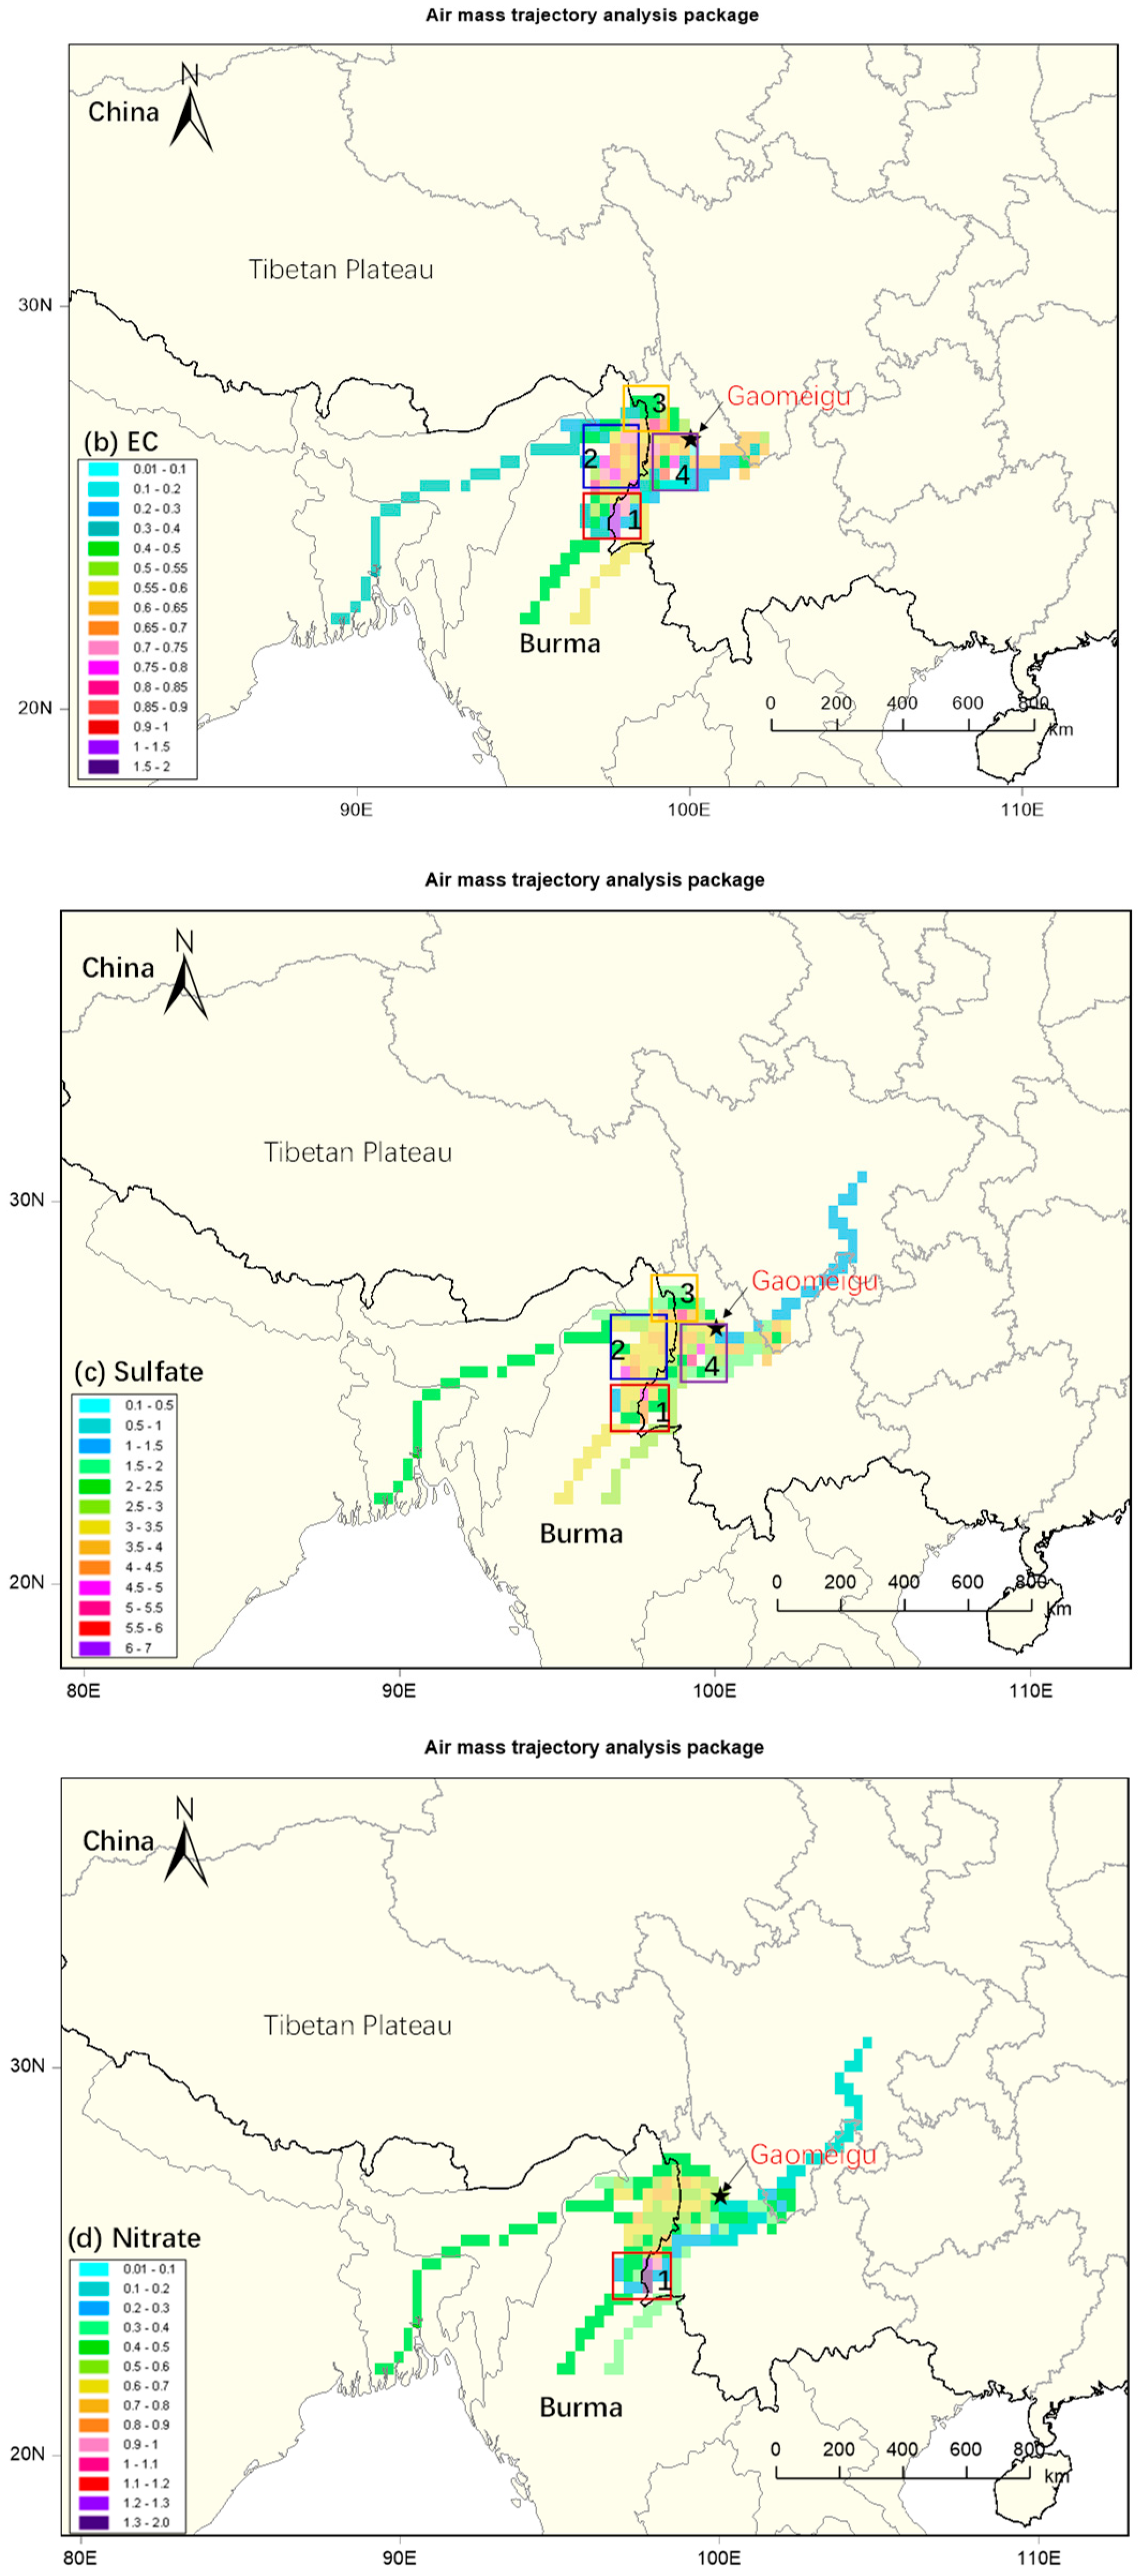
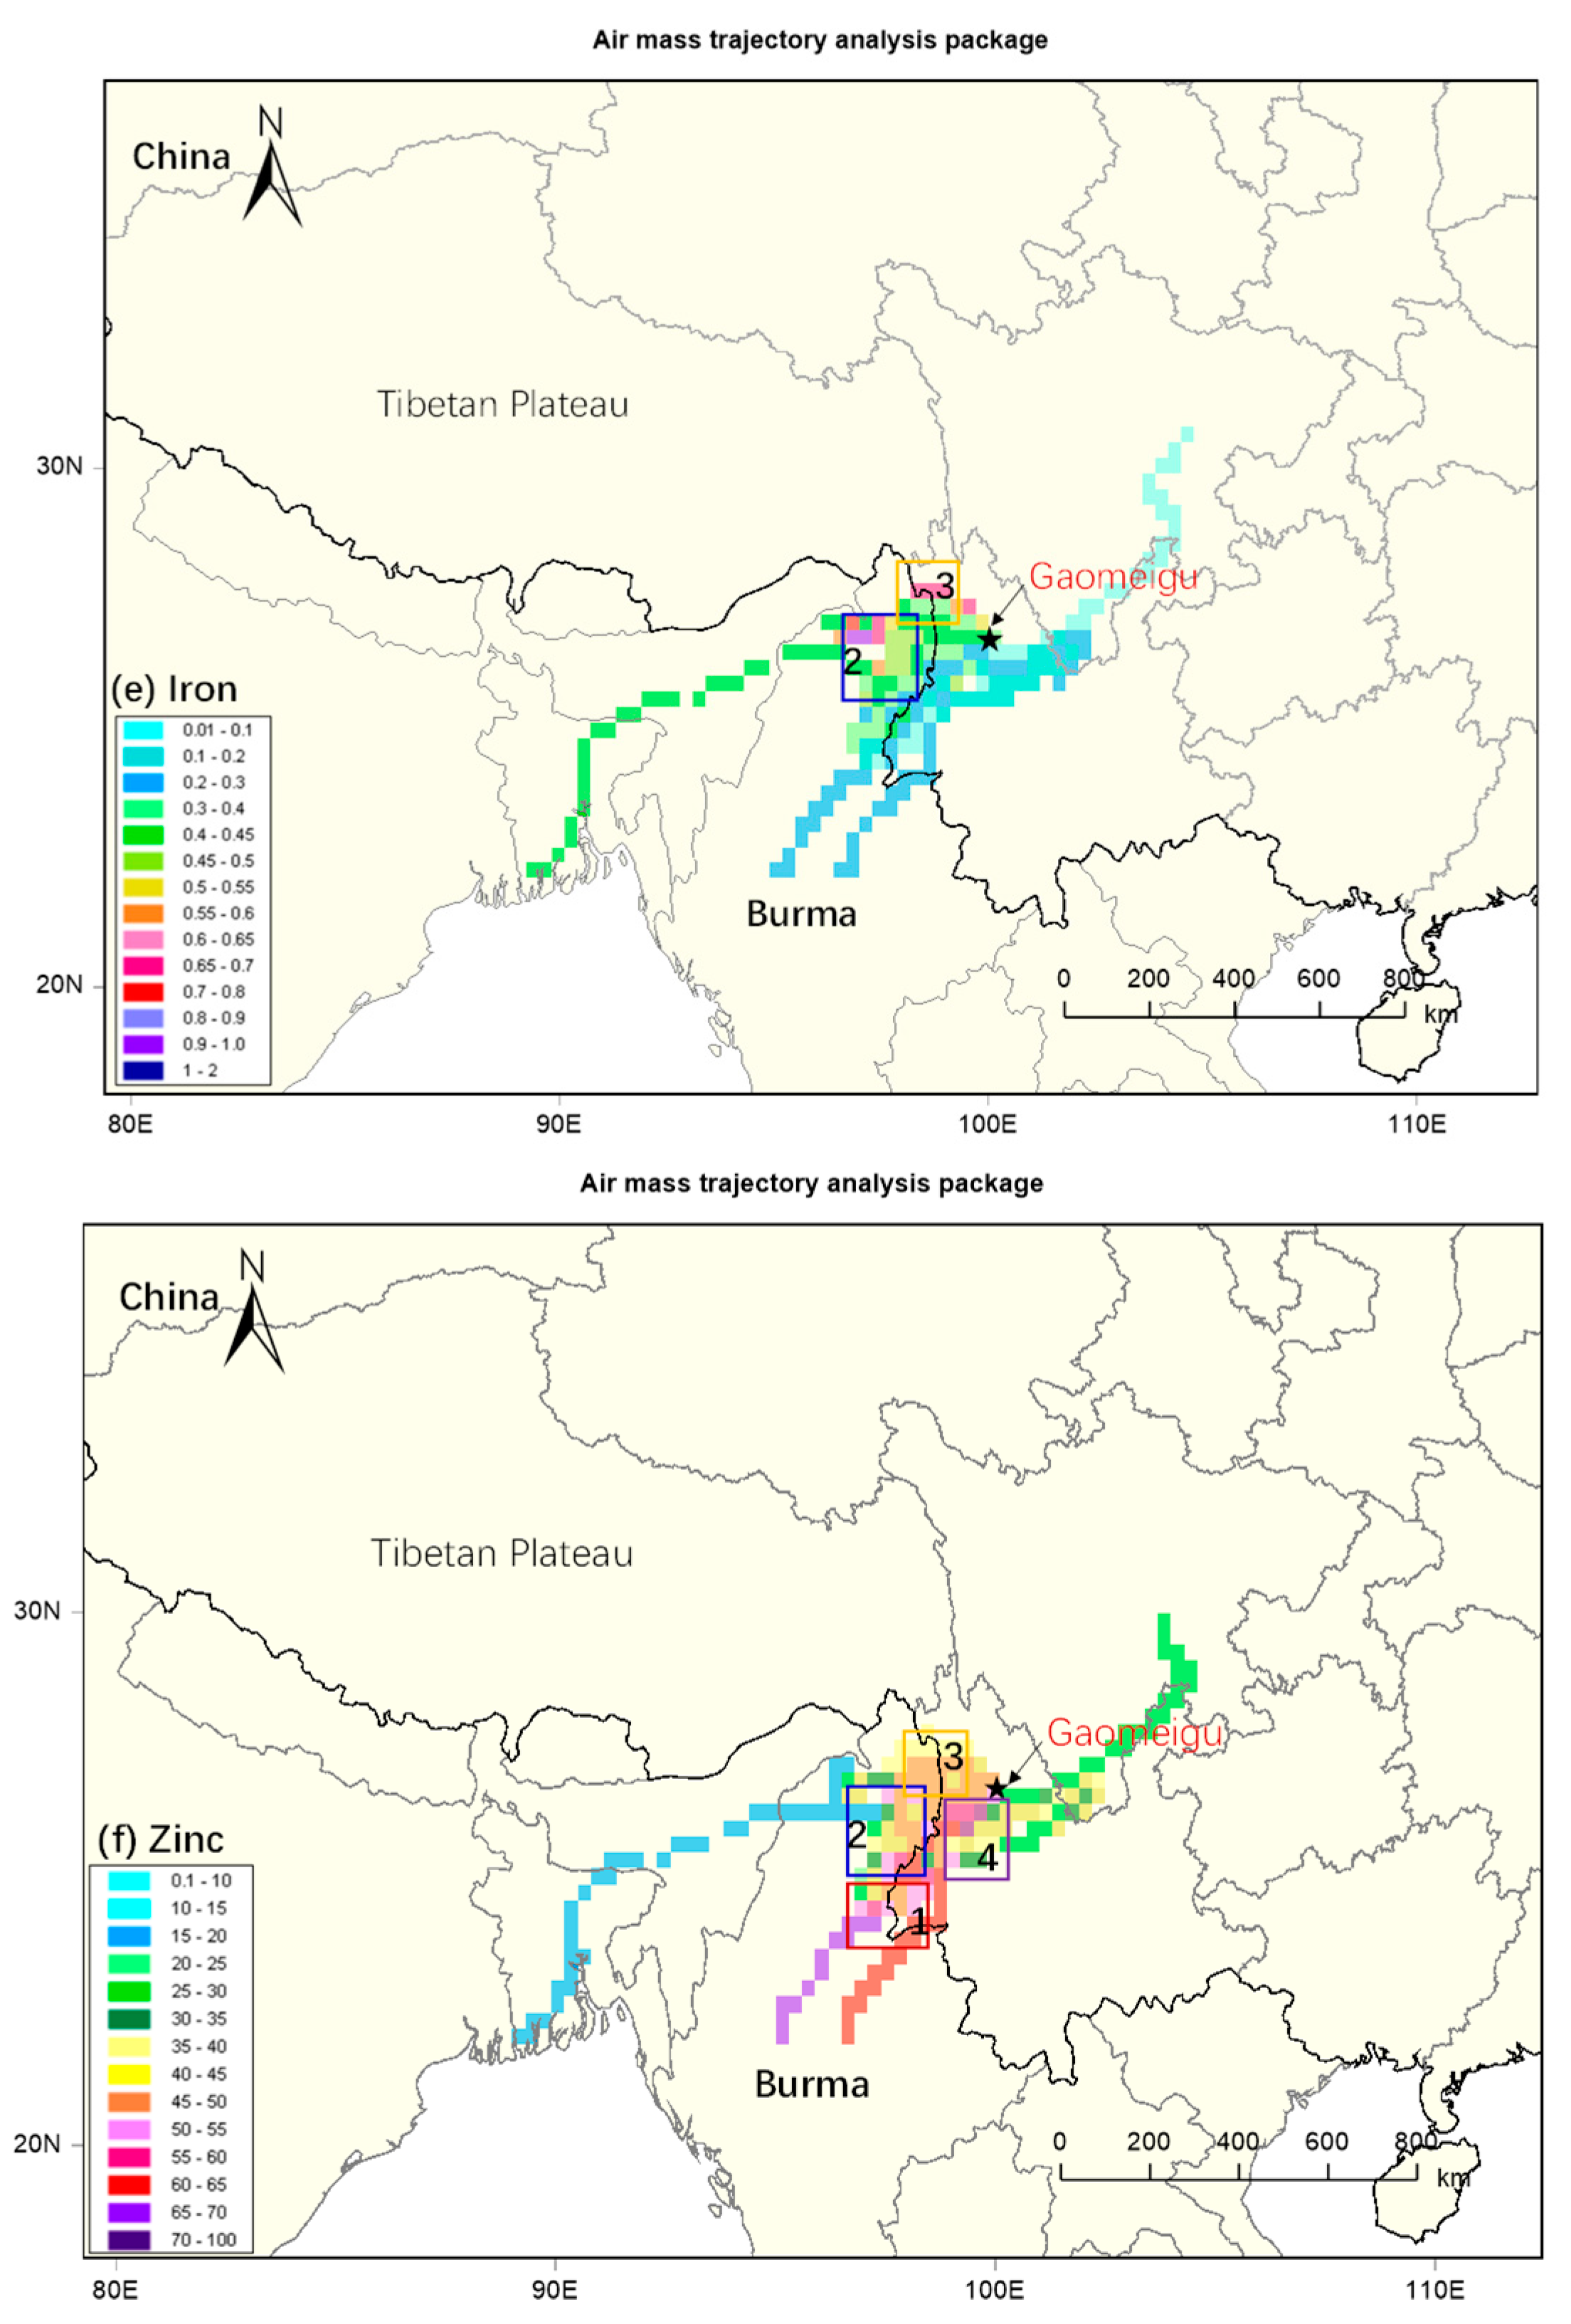
PM2.5 and typical pollutants (EC, SO42, NO3, Fe, and Zn) were selected for CWT analysis to identify the potential source regions. The CWT analysis provided the maps of spatial distribution of the weighted trajectory concentrations around the receptor sites, which aided us in determining the relative contributions of potential source regions to PM2.5 and the chemical compositions measured at the receptor sites. In this study, for discussion purposes, we defined “pollution” as concentrations larger than the 75th percentile of all the data. The 75th percentile values for PM2.5, EC, SO42, NO3, Fe, and Zn were 28.35, 0.82, 4.15, 0.69, 0.51, and 63 ng m−3, respectively. CWT results of the spatial distribution of each component are shown in Figure 4a–f.
As indicated in Figure 4, source regions were mainly distributed in regions to the south, west, and north of the sampling site with high emissions, and relatively lower CWT values were distributed in areas to the east of Gaomeigu. In order to assess the source regions, which have important impacts on the different elevated chemical compositions measured at Gaomeigu, four different source regions (based on different directions around the site) were defined in this study. The definitions of the four source regions are as follows: Region 1—source region located to the southwest of the sampling site, including the northeastern part of Burma, the Sino-Burmese border, and the western part of Yunnan Province; Region 2—source region located to the west of the sampling site, mainly in the northeastern part of Burma; Region 3—source region located to the northwest of the sampling site, including the northwestern part of Yunnan Province, the northern part of Burma, and some parts of Sino-Burmese border; and Region 4—source region located to the southwest of the sampling site, mostly in the northwestern part of Yunnan Province.
From the CWT analysis, major sources of PM2.5 were distributed to the west of the sampling site, as shown in Figure 4a. High concentrations of PM2.5 were attributed to the western and northwestern airflows through the northeastern part of Burma to the sampling site (especially from Regions 1 and 2), while moderate CWT values were found in areas near the sampling site, suggesting that some local emissions also have potential impacts on PM2.5 levels. The CWT concentration gradients showed that source regions for high EC, as shown in Figure 4b, somewhat coincided with the high PM2.5 spatial distribution. The calculation suggests that EC concentrations are considerably high in Region 2 in northeast Burma, especially around the Sino-Burmese border in Region 1, which is consistent with the intense fire counts in Burma, as shown in Figure S1. Besides Regions 2 and 1, scattered pink grid cells were distributed around the sampling site. As the source apportionment factor profiles show in Figure 3, char-EC and soot-EC were mainly apportioned to biomass burning and traffic-related emission sources. Therefore, scattered high EC levels around Gaomeigu were mainly due to traffic emissions from tourism and sparse open fires in Yunnan Province.
Different sulfate and nitrate distributed patterns were observed in the CWT calculations, as shown in Figure 4d and e. For sulfate, scattered high concentrations were distributed both at the surrounding areas and the eastern part of Burma. For the concentrations of nitrate, there was a strong influence from the Sino-Burmese border in Region 1, which might be impacted by combustion sources (especially biomass burning) because NO3 showed strong correlations with char-EC, POC, and K+, as discussed in Section 3.1.2. Different distribution areas between sulfate and nitrate indicate that the tourism industry might have an important influence on sulfate concentrations in Gaomeigu.
While the iron mapping suggests long-range transport from the northwest direction, only air parcel transport though some parts of Regions 2 and 3 (i.e., the Hengduan Mountains) have an important impact on the elevated Fe concentrations. The results obtained from the CWT model analysis for zinc, as shown in Figure 4f, showed that Zn concentrations are influenced by air masses from southwest directions. It is clear that the Gaomeigu atmosphere is enriched with aerosols containing zinc from northeast Burma. The mineral exploration processes of the supergiant Pb–Zn deposits (i.e., the Jinding deposit in the Lanping basin and the Bawdwin mines) make it reasonable to obtain significantly high Zn values from the air parcel path.

4. Summary and Conclusions

Twenty-four-hour samples of airborne PM2.5 particulate matter were collected at the southeast margin of the TP during the premonsoon season, and the concentrations of PM2.5 mass, carbonaceous species, inorganic ions, and elements were determined. Aerosol chemical material balance calculations, source apportionment, and potential source region identifications were performed. The major findings are summarized below.
The average 24 h PM2.5 concentration was 20.99 ± 9.80 µg m−3, with more than 95% of the data lower than the Target-1 standard for 24 h average PM2.5 mass in the NAAQS, exhibiting regional background concentrations on this part of the TP. The material balance calculations showed that geological material, organic matter, and three inorganic ions (sulfate, nitrate, and ammonium) were the dominant components, which contributed 32.3% ± 11.9%, 35.3% ± 8.13%, and 21.9% to PM2.5 mass, respectively. The Pearson correlations among chemical components in PM2.5 indicated that NO3 and Br might be more impacted by combustion sources (especially biomass burning) due to their strong correlations with K+, POC, and char-EC, while NH4+ and SO42 were influenced by multiple sources, mainly from secondary formation.
Source apportionment analyses by PMF identified five sources for PM2.5, ranked in the following order: biomass burning (34.0%), traffic-related emissions (26.7%), secondary formation (18.8%), fugitive dust (15.2%), and the mining industry (5.3%). This confirms the important influence of biomass burning on Gaomeigu.
By combining CWT analysis maps with source apportionment results, we concluded that the northeast part of Burma is the potential source region for high concentrations of EC and NO3 due to biomass burning emissions, while the tourism industry surrounding Gaomeigu gave strong grid cell values of SO42 as well as moderate values of EC and NO3. Moreover, the mining industry in the southwest direction of Gaomeigu has an important impact on zinc concentrations. Despite CWT providing qualitative information on the transport efficiency of different pollutants from the source regions to Gaomeigu, quantification of the transported pollutants could not be obtained from the analysis, which needs to be attempted in the future by using chemical transport models.

Supplementary Materials

The following are available online at https://www.mdpi.com/2073-4433/10/11/645/s1, Figure S1: (a) Fire counts map over the sampling site and surrounding areas during the campaign which was drawn from Wang, et al. [1]. (b) Cluster analysis of the three-day air mass back trajectories at Gaomeigu based on each day back trajectory during the sampling periods by using the HYSPLIT model. The blue and yellow diamonds in S1(a) represented the locations of two super-giant Pb-Zn deposits in Burma and Yunnan, Province, China, respectively. Figure S2: Temporal variations of analyzed chemical species in PM2.5 from Gaomeigu (11th March to 13th May 2018). Table S1: Pearson correlation coefficients (r2) for different chemical species at Gaomeigu during the sampling time.

Author Contributions

Data curation, Y.Z. and S.L.; Formal analysis, L.L. and R.T.; Funding acquisition, Y.H. and S.P.; Software, Z.Y.; Writing—original draft, Z.Z.; Writing—review and editing, Q.W. and J.C.

Funding

National Natural Science Foundation of China: 41661144020, 41603129, and 41877391. Youth Innovation Promotion Association, Chinese Academy of Sciences: 2019402.

Acknowledgments

This study was supported by the National Natural Science Foundation of China (41661144020, 41603129, and 41877391). Qiyuan Wang also acknowledged the support from the Youth Innovation Promotion Association, Chinese Academy of Sciences (2019402).

Conflicts of Interest

The authors declare no conflict of interest.

References

  1. Xu, B.; Cao, J.; Hansen, J.; Yao, T.; Joswia, D.R.; Wang, N.; Wu, M.; Wang, H.B.; Zhao, W.; Yang, X.; et al. Black soot and the survival of tibetan glaciers. Proc. Natl. Acad. Sci. USA 2009, 106, 22114–22118. [Google Scholar] [CrossRef] [PubMed]
  2. Lau, W.K.; Kim, M.-K.; Kim, K.-M.; Lee, W.-S. Enhanced surface warming and accelerated snow melt in the himalayas and tibetan plateau induced by absorbing aerosols. Environ. Res. Lett. 2010, 5, 025204. [Google Scholar] [CrossRef]
  3. Lau, K.M.; Kim, M.K.; Kim, K.M. Asian summer monsoon anomalies induced by aerosol direct forcing: The role of the tibetan plateau. Clim. Dyn. 2006, 26, 855–864. [Google Scholar] [CrossRef]
  4. Zhao, Z.; Cao, J.; Shen, Z.; Xu, B.; Zhu, C.; Chen, L.W.A.; Su, X.; Liu, S.; Han, Y.; Wang, G. Aerosol particles at a high-altitude site on the southeast tibetan plateau, china: Implications for pollution transport from south asia. J. Geophys. Res. Atmos. 2013, 118, 11360–11375. [Google Scholar] [CrossRef]
  5. Li, C.; Bosch, C.; Kang, S.; Andersson, A.; Chen, P.; Zhang, Q.; Cong, Z.; Chen, B.; Qin, D.; Gustafsson, O. Sources of black carbon to the himalayan-tibetan plateau glaciers. Nat. Commun. 2016, 7, 12574. [Google Scholar] [CrossRef] [PubMed]
  6. Zhu, C.-S.; Cao, J.-J.; Hu, T.-F.; Shen, Z.-X.; Tie, X.-X.; Huang, H.; Wang, Q.-Y.; Huang, R.-J.; Zhao, Z.-Z.; Močnik, G.; et al. Spectral dependence of aerosol light absorption at an urban and a remote site over the tibetan plateau. Sci. Total Environ. 2017, 590, 14–21. [Google Scholar] [CrossRef]
  7. Lüthi, Z.L.; Bojan, S.; Kim, S.W.; Lauer, A.; Mues, A.; Rupakheti, M.; Kang, S. Atmospheric brown clouds reach the tibetan plateau by crossing the himalayas. Atmos. Chem. Phys. 2015, 4, 28105–28146. [Google Scholar] [CrossRef]
  8. Bonasoni, P.; Laj, P.; Angelini, F.; Arduini, J.; Bonafè, U.; Calzolari, F.; Cristofanelli, P.; Decesari, S.; Facchini, M.C.; Fuzzi, S.; et al. The abc-pyramid atmospheric research observatory in himalaya for aerosol, ozone and halocarbon measurements. Sci. Total Environ. 2008, 391, 252–261. [Google Scholar] [CrossRef]
  9. Bonasoni, P.; Laj, P.; Marinoni, A.; Sprenger, M.; Angelini, F.; Arduini, J.; Bonafè, U.; Calzolari, F.; Colombo, T.; Decesari, S.; et al. Atmospheric brown clouds in the himalayas: First two years of continuous observations at the nepal climate observatory-pyramid (5079 m). Atmos. Chem. Phys. 2010, 10, 7515–7531. [Google Scholar] [CrossRef]
  10. Decesari, S.; Facchini, M.C.; Carbone, C.; Giulianelli, L.; Rinaldi, M.; Finessi, E.; Fuzzi, S.; Marinoni, A.; Cristofanelli, P.; Duchi, R.; et al. Chemical composition of pm10 and pm1 at the high-altitude himalayan station nepal climate observatory-pyramid (nco-p) (5079 ma.S.L.). Atmos. Chem. Phys. 2010, 10, 4583–4596. [Google Scholar] [CrossRef]
  11. Zhao, Z.; Wang, Q.; Xu, B.; Shen, Z.; Huang, R.; Zhu, C.; Su, X.; Zhao, S.; Long, X.; Liu, S.; et al. Black carbon aerosol and its radiative impact at a high-altitude remote site on the southeastern tibet plateau. J. Geophys. Res. Atmos. 2017, 122, 5515–5530. [Google Scholar] [CrossRef]
  12. Cong, Z.; Kang, S.; Kawamura, K.; Liu, B.; Wan, X.; Wang, Z.; Gao, S.; Fu, P. Carbonaceous aerosols on the south edge of the tibetan plateau: Concentrations, seasonality and sources. Atmos. Chem. Phys. 2015, 15, 1573–1584. [Google Scholar] [CrossRef]
  13. Ramanathan, V.; Carmichael, G. Global and regional climate changes due to black carbon. Nat. Geosci. 2008, 1, 221–227. [Google Scholar] [CrossRef]
  14. Ramanathan, V.; Chung, C.; Kim, D.; Bettge, T.; Buja, L.; Kiehl, J.; Washington, W.; Fu, Q.; Sikka, D.; Wild, M. Atmospheric brown clouds: Impacts on south asian climate and hydrological cycle. Proc. Natl. Acad. Sci. USA 2005, 102, 5326. [Google Scholar] [CrossRef]
  15. Marinoni, A.; Cristofanelli, P.; Laj, P.; Duchi, R.; Calzolari, F.; Decesari, S.; Sellegri, K.; Vuillermoz, E.; Verza, G.P.; Villani, P.; et al. Aerosol mass and black carbon concentrations, a two year record at nco-p (5079 m, southern himalayas). Atmos. Chem. Phys. 2010, 10, 8551–8562. [Google Scholar] [CrossRef]
  16. Engling, G.; Zhang, Y.; Chan, C.; Sang, X.F.; Lin, M.; Ho, K.; Li, Y.; Lin, C.; Lee, J.J. Characterization and sources of aerosol particles over the southeastern tibetan plateau during the southeast asia biomass-burning season. Tellus B 2011, 63, 117–128. [Google Scholar] [CrossRef]
  17. Ielpo, P.; Fermo, P.; Comite, V.; Mastroianni, D.; Viviano, G.; Salerno, F.; Tartari, G. Chemical characterization of biomass fuel particulate deposits and ashes in households of mt. Everest region (nepal). Sci. Total Environ. 2016, 573, 751–759. [Google Scholar] [CrossRef]
  18. Wu, G.; Ram, K.; Fu, P.; Wang, W.; Zhang, Y.; Liu, X.; Stone, E.A.; Pradhan, B.B.; Dangol, P.M.; Panday, A.K.; et al. Water-soluble brown carbon in atmospheric aerosols from godavari (nepal), a regional representative of south Asia. Environ. Sci. Technol. 2019, 53, 3471–3479. [Google Scholar] [CrossRef]
  19. Shrestha, P.; Barros, A.P.; Khlystov, A. Chemical composition and aerosol size distribution of the middle mountain range in the nepal himalayas during the 2009 pre-monsoon season. Atmos. Chem. Phys. 2010, 10, 11605–11621. [Google Scholar] [CrossRef]
  20. Sellegri, K.; Laj, P.; Venzac, H.; Boulon, J.; Picard, D.; Villani, P.; Bonasoni, P.; Marinoni, A.; Cristofanelli, P.; Vuillermoz, E. Seasonal variations of aerosol size distributions based on long-term measurements at the high altitude himalayan site of nepal climate observatory-pyramid (5079 m), nepal. Atmos. Chem. Phys. Discuss. 2010, 10, 6537–6566. [Google Scholar] [CrossRef]
  21. Marcq, S.; Laj, P.; Roger, J.C.; Villani, P.; Sellegri, K.; Bonasoni, P.; Marinoni, A.; Cristofanelli, P.; Verza, G.P.; Bergin, M. Aerosol optical properties and radiative forcing in the high himalaya based on measurements at the nepal climate observatory-pyramid site (5079ma.S.L.). Atmos. Chem. Phys. 2010, 10, 5859–5872. [Google Scholar] [CrossRef]
  22. Li, C.; Yan, F.; Kang, S.; Chen, P.; Hu, Z.; Gao, S.; Qu, B.; Sillanpää, M. Light absorption characteristics of carbonaceous aerosols in two remote stations of the southern fringe of the tibetan plateau, china. Atmos. Environ. 2016, 143, 79–85. [Google Scholar] [CrossRef]
  23. Ming, J.; Xiao, C.; Sun, J.; Kang, S.; Bonasoni, P. Carbonaceous particles in the atmosphere and precipitation of the nam co region, central tibet. J. Environ. Sci. 2010, 22, 1748–1756. [Google Scholar] [CrossRef]
  24. Cong, Z.; Kang, S.; Luo, C.; Li, Q.; Huang, J.; Gao, S.; Li, X. Trace elements and lead isotopic composition of pm10 in lhasa, tibet. Atmos. Environ. 2011, 45, 6210–6215. [Google Scholar] [CrossRef]
  25. Zhao, Z.; Cao, J.; Shen, Z.; Huang, R.-J.; Hu, T.; Wang, P.; Zhang, T.; Liu, S. Chemical composition of pm2.5 at a high-altitude regional background site over northeast of tibet plateau. Atmos. Pollut. Res. 2015, 6, 815–823. [Google Scholar] [CrossRef]
  26. Meng, J.; Wang, G.; Li, J.; Cheng, C.; Cao, J. Atmospheric oxalic acid and related secondary organic aerosols in qinghai lake, a continental background site in tibet plateau. Atmos. Environ. 2013, 79, 582–589. [Google Scholar] [CrossRef]
  27. Cao, J.J.; Xu, B.Q.; He, J.Q.; Liu, X.Q.; Han, Y.M.; Wang, G.H.; Zhu, C.S. Concentrations, seasonal variations, and transport of carbonaceous aerosols at a remote mountainous region in western china. Atmos. Environ. 2009, 43, 4444–4452. [Google Scholar] [CrossRef]
  28. Cao, J.J.; Tie, X.X.; Xu, B.Q.; Zhao, Z.Z.; Zhu, C.S.; Li, G.H.; Liu, S.X. Measuring and modeling black carbon (bc) contamination in the se tibetan plateau. J. Atmos. Chem. 2010, 67, 45–60. [Google Scholar] [CrossRef]
  29. Fermo, P.; Piazzalunga, A.; Vecchi, R.; Valli, G.; Ceriani, M. A tga/ft-ir study for measuring oc and ec in aerosol samples. Atmos. Chem. Phys. 2006, 6, 255–266. [Google Scholar] [CrossRef]
  30. Cuccia, E.; Massabò, D.; Ariola, V.; Bove, M.C.; Fermo, P.; Piazzalunga, A.; Prati, P. Size-resolved comprehensive characterization of airborne particulate matter. Atmos. Environ. 2013, 67, 14–26. [Google Scholar] [CrossRef]
  31. Cavalli, F.; Viana, M.; Yttri, K.E.; Genberg, J.; Putaud, J.P. Toward a standardised thermal-optical protocol for measuring atmospheric organic and elemental carbon: The eusaar protocol. Atmos. Meas. Tech. 2010, 3, 79–89. [Google Scholar] [CrossRef]
  32. Bautista, A.T.; Pabroa, P.C.B.; Santos, F.L.; Quirit, L.L.; Asis, J.L.B.; Dy, M.A.K.; Martinez, J.P.G. Intercomparison between NIOSH, IMPROVE_a, and EUSAAR_2 protocols: Finding an optimal thermal—Optical protocol for philippines oc/ec samples. Atmos. Pollut. Res. 2015, 6, 334–342. [Google Scholar] [CrossRef]
  33. Wu, C.; Huang, X.; Ng, W.; Griffith, S.; Yu, J. Inter-comparison of niosh and improve protocols for oc and ec determination: Implications for inter-protocol data conversion. Atmos. Meas. Tech. Discuss. 2016, 9, 4547–4560. [Google Scholar] [CrossRef]
  34. Chow, J.C.; Watson, J.G.; Crow, D.; Lowenthal, D.H.; Merrifield, T. Comparison of improve and niosh carbon measurements. Aerosol Sci. Technol. 2001, 34, 23–34. [Google Scholar] [CrossRef]
  35. Chow, J.C.; Watson, J.G.; Chen, L.W.A.; Arnott, W.P.; Moosmüller, H.; Fung, K. Equivalence of elemental carbon by thermal/optical reflectance and transmittance with different temperature protocols. Environ. Sci. Technol. 2004, 38, 4414–4422. [Google Scholar] [CrossRef]
  36. Han, Y.; Cao, J.; Chow, J.C.; Watson, J.G.; An, Z.; Jin, Z.; Fung, K.; Liu, S. Evaluation of the thermal/optical reflectance method for discrimination between char- and soot-ec. Chemosphere 2007, 69, 569–574. [Google Scholar] [CrossRef]
  37. Chow, J.C.; Watson, J.G.; Robles, J.; Wang, X.; Chen, L.-W.A.; Trimble, D.L.; Kohl, S.D.; Tropp, R.J.; Fung, K.K. Quality assurance and quality control for thermal/optical analysis of aerosol samples for organic and elemental carbon. Anal. Bioanal. Chem. 2011, 401, 3141–3152. [Google Scholar] [CrossRef]
  38. Zhang, T.; Cao, J.; Tie, X.; Shen, Z.; Liu, S.; Ding, H.; Han, Y.; Wang, G.; Ho, K.; Qiang, J. Water-soluble ions in atmospheric aerosols measured in xi’an, china: Seasonal variations and sources. Atmos. Res. 2011, 102, 110–119. [Google Scholar] [CrossRef]
  39. Xu, H.; Cao, J.; Chow, J.C.; Huang, R.J.; Shen, Z.; Chen, L.W.A.; Ho, K.F.; Watson, J.G. Inter-annual variability of wintertime pm2.5 chemical composition in xi’an, china: Evidences of changing source emissions. Sci. Total Environ. 2016, 545, 546–555. [Google Scholar] [CrossRef]
  40. Xu, H.M.; Cao, J.J.; Ho, K.F.; Ding, H.; Han, Y.M.; Wang, G.H.; Chow, J.C.; Watson, J.G.; Khol, S.D. Lead concentrations in fine particulate matter after the phasing out of leaded gasoline in xi’an, china. Atmos. Environ. 2012, 46, 217–224. [Google Scholar] [CrossRef]
  41. Zhao, Z.; Cao, J.; Chow, J.C.; Watson, J.G.; Chen, A.L.W.; Wang, X.; Wang, Q.; Tian, J.; Shen, Z.; Zhu, C.; et al. Multi-wavelength light absorption of black and brown carbon at a high-altitude site on the southeastern margin of the tibetan plateau, China. Atmos. Environ. 2019, 212, 54–64. [Google Scholar] [CrossRef]
  42. Chen, L.W.A.; Lowenthal, D.H.; Watson, J.G.; Koracin, D.; Kumar, N.; Knipping, E.M.; Wheeler, N.; Craig, K.; Reid, S. Toward effective source apportionment using positive matrix factorization: Experiments with simulated pm2.5 data. J. Air Waste Manag. Assoc. 2010, 60, 43–54. [Google Scholar] [CrossRef]
  43. Belis, C.A.; Pikridas, M.; Lucarelli, F.; Petralia, E.; Cavalli, F.; Calzolai, G.; Berico, M.; Sciare, J. Source apportionment of fine pm by combining high time resolution organic and inorganic chemical composition datasets. Atmos. Environ. 2019, 3, 116816. [Google Scholar] [CrossRef]
  44. Brown, S.G.; Eberly, S.; Paatero, P.; Norris, G.A. Methods for estimating uncertainty in pmf solutions: Examples with ambient air and water quality data and guidance on reporting pmf results. Sci. Total Environ. 2015, 518, 626–635. [Google Scholar] [CrossRef]
  45. Paatero, P.; Hopke, P.K.; Song, X.-H.; Ramadan, Z. Understanding and controlling rotations in factor analytic models. Chemom. Intell. Lab. Syst. 2002, 60, 253–264. [Google Scholar] [CrossRef]
  46. Wang, Y.Q.; Zhang, X.Y.; Draxler, R.R. Trajstat: Gis-based software that uses various trajectory statistical analysis methods to identify potential sources from long-term air pollution measurement data. Environ. Model. Softw. 2009, 24, 938–939. [Google Scholar] [CrossRef]
  47. Roland, R.; Draxler, G.D.H. An overview of the HYSPIT_4 modelling system for trajectories, dispersion and deposition. Aust. Met. Mag. 1998, 47, 295–308. [Google Scholar]
  48. Wang, Q.; Zhao, Z.; Tian, J.; Zhu, C.; Ni, H.; Zhang, Y.; Zhang, N.; Shen, Z.; Han, Y.; Cao, J. Seasonal transport and dry deposition of black carbon aerosol in the southeastern tibetan plateau. Aerosol Sci. Eng. 2017, 1, 160–168. [Google Scholar] [CrossRef]
  49. Wang, Q.; Han, Y.; Ye, J.; Liu, S.; Pongpiachan, S.; Zhang, N.; Han, Y.; Tian, J.; Wu, C.; Long, X.; et al. High contribution of secondary brown carbon to aerosol light absorption in the southeastern margin of tibetan plateau. Geophys. Res. Lett. 2019, 46, 4962–4970. [Google Scholar] [CrossRef]
  50. Penner, J.E.; Eddleman, H.; Novakov, T. Towards the development of a global inventory for black carbon emissions. Atmos. Environ. Part A Gen. Top. 1993, 27, 1277–1295. [Google Scholar] [CrossRef]
  51. Vassura, I.; Venturini, E.; Marchetti, S.; Piazzalunga, A.; Bernardi, E.; Fermo, P.; Passarini, F. Markers and influence of open biomass burning on atmospheric particulate size and composition during a major bonfire event. Atmos. Environ. 2014, 82, 218–225. [Google Scholar] [CrossRef]
  52. Seinfeld, J.H.; Pandis, S. Atmospheric Chemistry and Physics: From Air Pollution to Climate Change; Wiley-Interscience: Hoboken, NJ, USA, 1998; Volume 51. [Google Scholar]
  53. Turpin, B.J.; Huntzicker, J.J. Identification of secondary organic aerosol episodes and quantitation of primary and secondary organic aerosol concentrations during scaqs. Atmos. Environ. 1995, 29, 3527–3544. [Google Scholar] [CrossRef]
  54. Zhu, C.-S.; Chen, C.-C.; Cao, J.-J.; Tsai, C.-J.; Chou, C.C.K.; Liu, S.-C.; Roam, G.-D. Characterization of carbon fractions for atmospheric fine particles and nanoparticles in a highway tunnel. Atmos. Environ. 2010, 44, 2668–2673. [Google Scholar] [CrossRef]
  55. Han, Y.M.; Lee, S.C.; Cao, J.J.; Ho, K.F.; An, Z.S. Spatial distribution and seasonal variation of char-ec and soot-ec in the atmosphere over china. Atmos. Environ. 2009, 43, 6066–6073. [Google Scholar] [CrossRef]
  56. Andreae, M.O. Soot carbon and excess fine potassium: Long-range transport of combustion-derived aerosols. Science 1983, 220, 1148–1151. [Google Scholar] [CrossRef] [PubMed]
  57. Li, C.; Kang, S.; Zhang, Q.; Kaspari, S. Major ionic composition of precipitation in the nam co region, central tibetan plateau. Atmos. Res. 2007, 85, 351–360. [Google Scholar] [CrossRef]
  58. Ram, K.; Sarin, M.M. Day-night variability of ec, oc, wsoc and inorganic ions in urban environment of indo-gangetic plain: Implications to secondary aerosol formation. Atmos. Environ. 2011, 45, 460–468. [Google Scholar] [CrossRef]
  59. Shen, Z.; Arimoto, R.; Cao, J.; Zhang, R.; Li, X.; Du, N.; Okuda, T.; Nakao, S.; Tanaka, S. Seasonal variations and evidence for the effectiveness of pollution controls on water-soluble inorganic species in total suspended particulates and fine particulate matter from xi’an, china. J. Air Waste Manag. Assoc. 2008, 58, 1560–1570. [Google Scholar] [CrossRef]
  60. Centre, C.N.E.M. Environmental Background Values of Soil in China; China Environmental Science Press: Hangzhou, China, 1990. (In Chinese) [Google Scholar]
  61. Srinivas, B.; Sarin, M.M. Pm2.5, ec and oc in atmospheric outflow from the indo-gangetic plain: Temporal variability and aerosol organic carbon-to-organic mass conversion factor. Sci. Total Environ. 2014, 487, 196–205. [Google Scholar] [CrossRef]
  62. Sciare, J.; Oikonomou, K.; Cachier, H.; Mihalopoulos, N.; Andreae, M.O.; Maenhaut, W.; Sarda-Estève, R. Aerosol mass closure and reconstruction of the light scattering coefficient over the eastern mediterranean sea during the minos campaign. Atmos. Chem. Phys. 2005, 5, 2253–2265. [Google Scholar] [CrossRef]
  63. Liu, H.T.; Li, J.S.; Yan, J.G. Integrated information ore-finding model and direction in the south-central segment of the “sanjiang metallogenic belt”, southwestern China. Geol. China 2008, 35, 101–110. (In Chinese) [Google Scholar]
  64. Green, M.C.; Chen, L.W.A.; DuBois, D.W.; Molenar, J.V. Fine particulate matter and visibility in the lake tahoe basin: Chemical characterization, trends, and source apportionment. J. Air Waste Manag. Assoc. 2012, 62, 953–965. [Google Scholar] [CrossRef] [PubMed]
  65. Wang, L.Q.; Tang, J.X.; Danzhen, W.X.; Wang, Y.; Li, Z. Geological characteristics of lead-zinc ore deposits in qinghai-tibet plateau. Sci. Technol. Rev. 2017, 35, 83–88. (In Chinese) [Google Scholar]
  66. Zhao, H. Study on the Characteristics and Metallogenic Conditions of Copper-Polymetallic Deposits in Middle-Northern Lanpin Basin, Western Yunnan. Ph.D. Thesis, China University of Geosciences, Beijing, China, 2006. (In Chinese). [Google Scholar]
  67. Win, S.; Myint, M.M. Mineral potential of myanmar. Resour. Geol. 1998, 48, 209–218. [Google Scholar] [CrossRef]
  68. Zhang, N.; Cao, J.; Ho, K.; He, Y. Chemical characterization of aerosol collected at mt. Yulong in wintertime on the southeastern tibetan plateau. Atmos. Res. 2012, 107, 76–85. [Google Scholar] [CrossRef]
  69. Pacyna, J.M.; Pacyna, E.G. An assessment of global and regional emissions of trace metals to the atmosphere from anthropogenic sources worldwide. Environ. Rev. 2011, 9, 269–298. [Google Scholar] [CrossRef]
  70. Rogge, W.F.; Hildemann, L.M.; Mazurek, M.A.; Cass, G.R.; Simoneit, B.R.T. Sources of fine organic aerosol. 3. Road dust, tire debris, and organometallic brake lining dust: Roads as sources and sinks. Environ. Sci. Technol. 1993, 27, 1892–1904. [Google Scholar] [CrossRef]
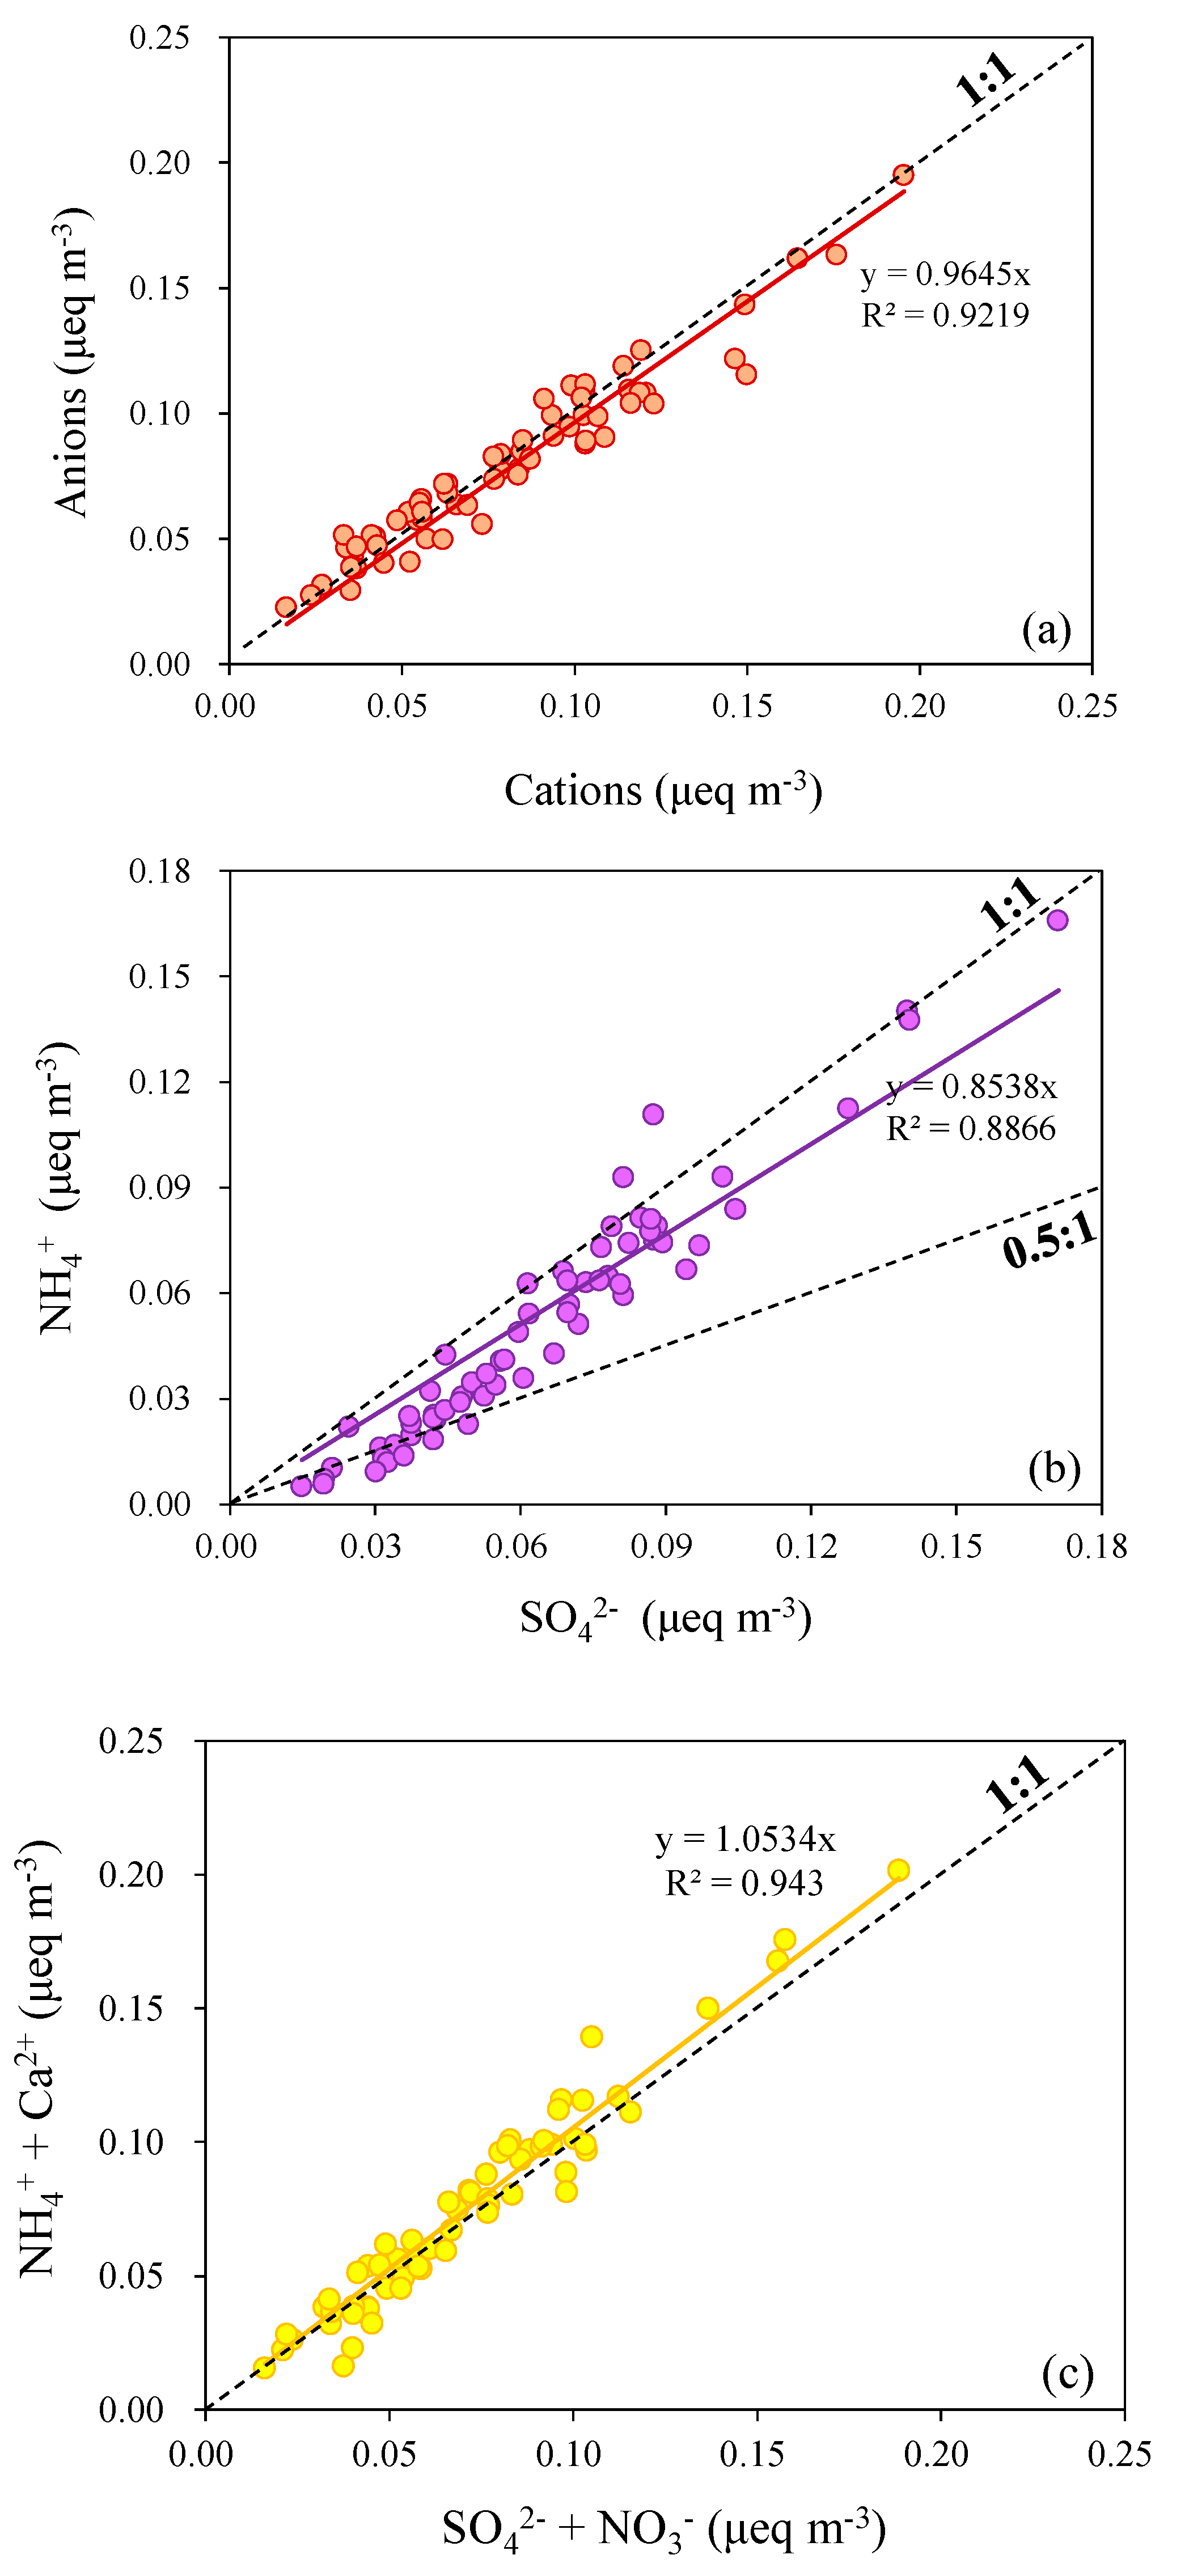
Figure 1. Correlation of (a) anions and cations, (b) NH4+ and SO42−, (c) NH4+ + Ca2+ and SO42− + NO3 equivalent concentration in PM2.5.
Atmosphere 10 00645 g001
Figure 2. Daily variations in composition of PM2.5 at the sampling site. Pie chart is the averaged PM2.5 material balance between 11 March and 13 May 2018.
Atmosphere 10 00645 g002
Figure 3. Source apportionment of PM2.5 at the sampling site.
Atmosphere 10 00645 g003
Figure 4. Maps of the concentration-weighted trajectories (CWT) for PM2.5 (a) and different chemical species (i.e., EC (b), sulfate (c), nitrate (d), iron (e), and zinc (f)) at arrival heights of 1000 m above ground level during the campaign. The CWT analysis was conducted by TrajStat software developed by Wang, Zhang and Draxler [46]. Grid cells with light blueish and greenish hues indicate the weak or insignificant sources in those areas, and the yellowish and orangish shades represent the probability of moderate sources, while pink, red, violet, and purple signify the presence of relatively strong particulate sources to PM at the receptor site.
Atmosphere 10 00645 g004aAtmosphere 10 00645 g004bAtmosphere 10 00645 g004c
Table 1. Arithmetic averages, standard deviations, minimum and maximum values for mass and chemical components during the sampling time (unit: µg m−3). PM: particulate matter; OC: organic carbon; EC: elemental carbon; POC: primary OC; SOC: secondary OC.
ComponentsAVESTDMinMax
MassPM2.520.999.803.7954.57
Carbonaceous speciesOC3.921.941.0910.55
EC0.680.360.101.91
POC2.971.560.438.36
SOC0.970.600.052.91
char-EC0.560.330.081.46
soot-EC0.120.070.020.45
Water-soluble inorganic ionsF0.030.010.020.05
Cl0.130.030.070.22
NO20.070.030.0030.15
NO30.530.320.091.64
SO42−3.101.490.718.21
Na+0.060.030.010.16
NH4+0.830.560.082.65
K+0.110.090.0010.37
Mg2+0.060.040.0030.21
Ca2+0.530.200.211.30
ElementsCa0.760.330.031.83
Fe0.360.220.030.94
Ti (ng m−3)35.8523.491.17102.91
Mn (ng m−3)9.214.921.9321.52
Ni (ng m−3)2.291.600.385.07
Cu (ng m−3)28.1413.706.8873.24
As (ng m−3)3.853.090.3815.66
Ba (ng m−3)14.377.300.7826.57
Pb (ng m−3)5.782.481.3412.63
Zn (ng m−3)46.7622.210.7888.25
Br (ng m−3)4.812.230.7711.86