Optical and Physical Characteristics of the Lowest Aerosol Layers over the Yellow River Basin


 ,
, 
Abstract
:1. Introduction
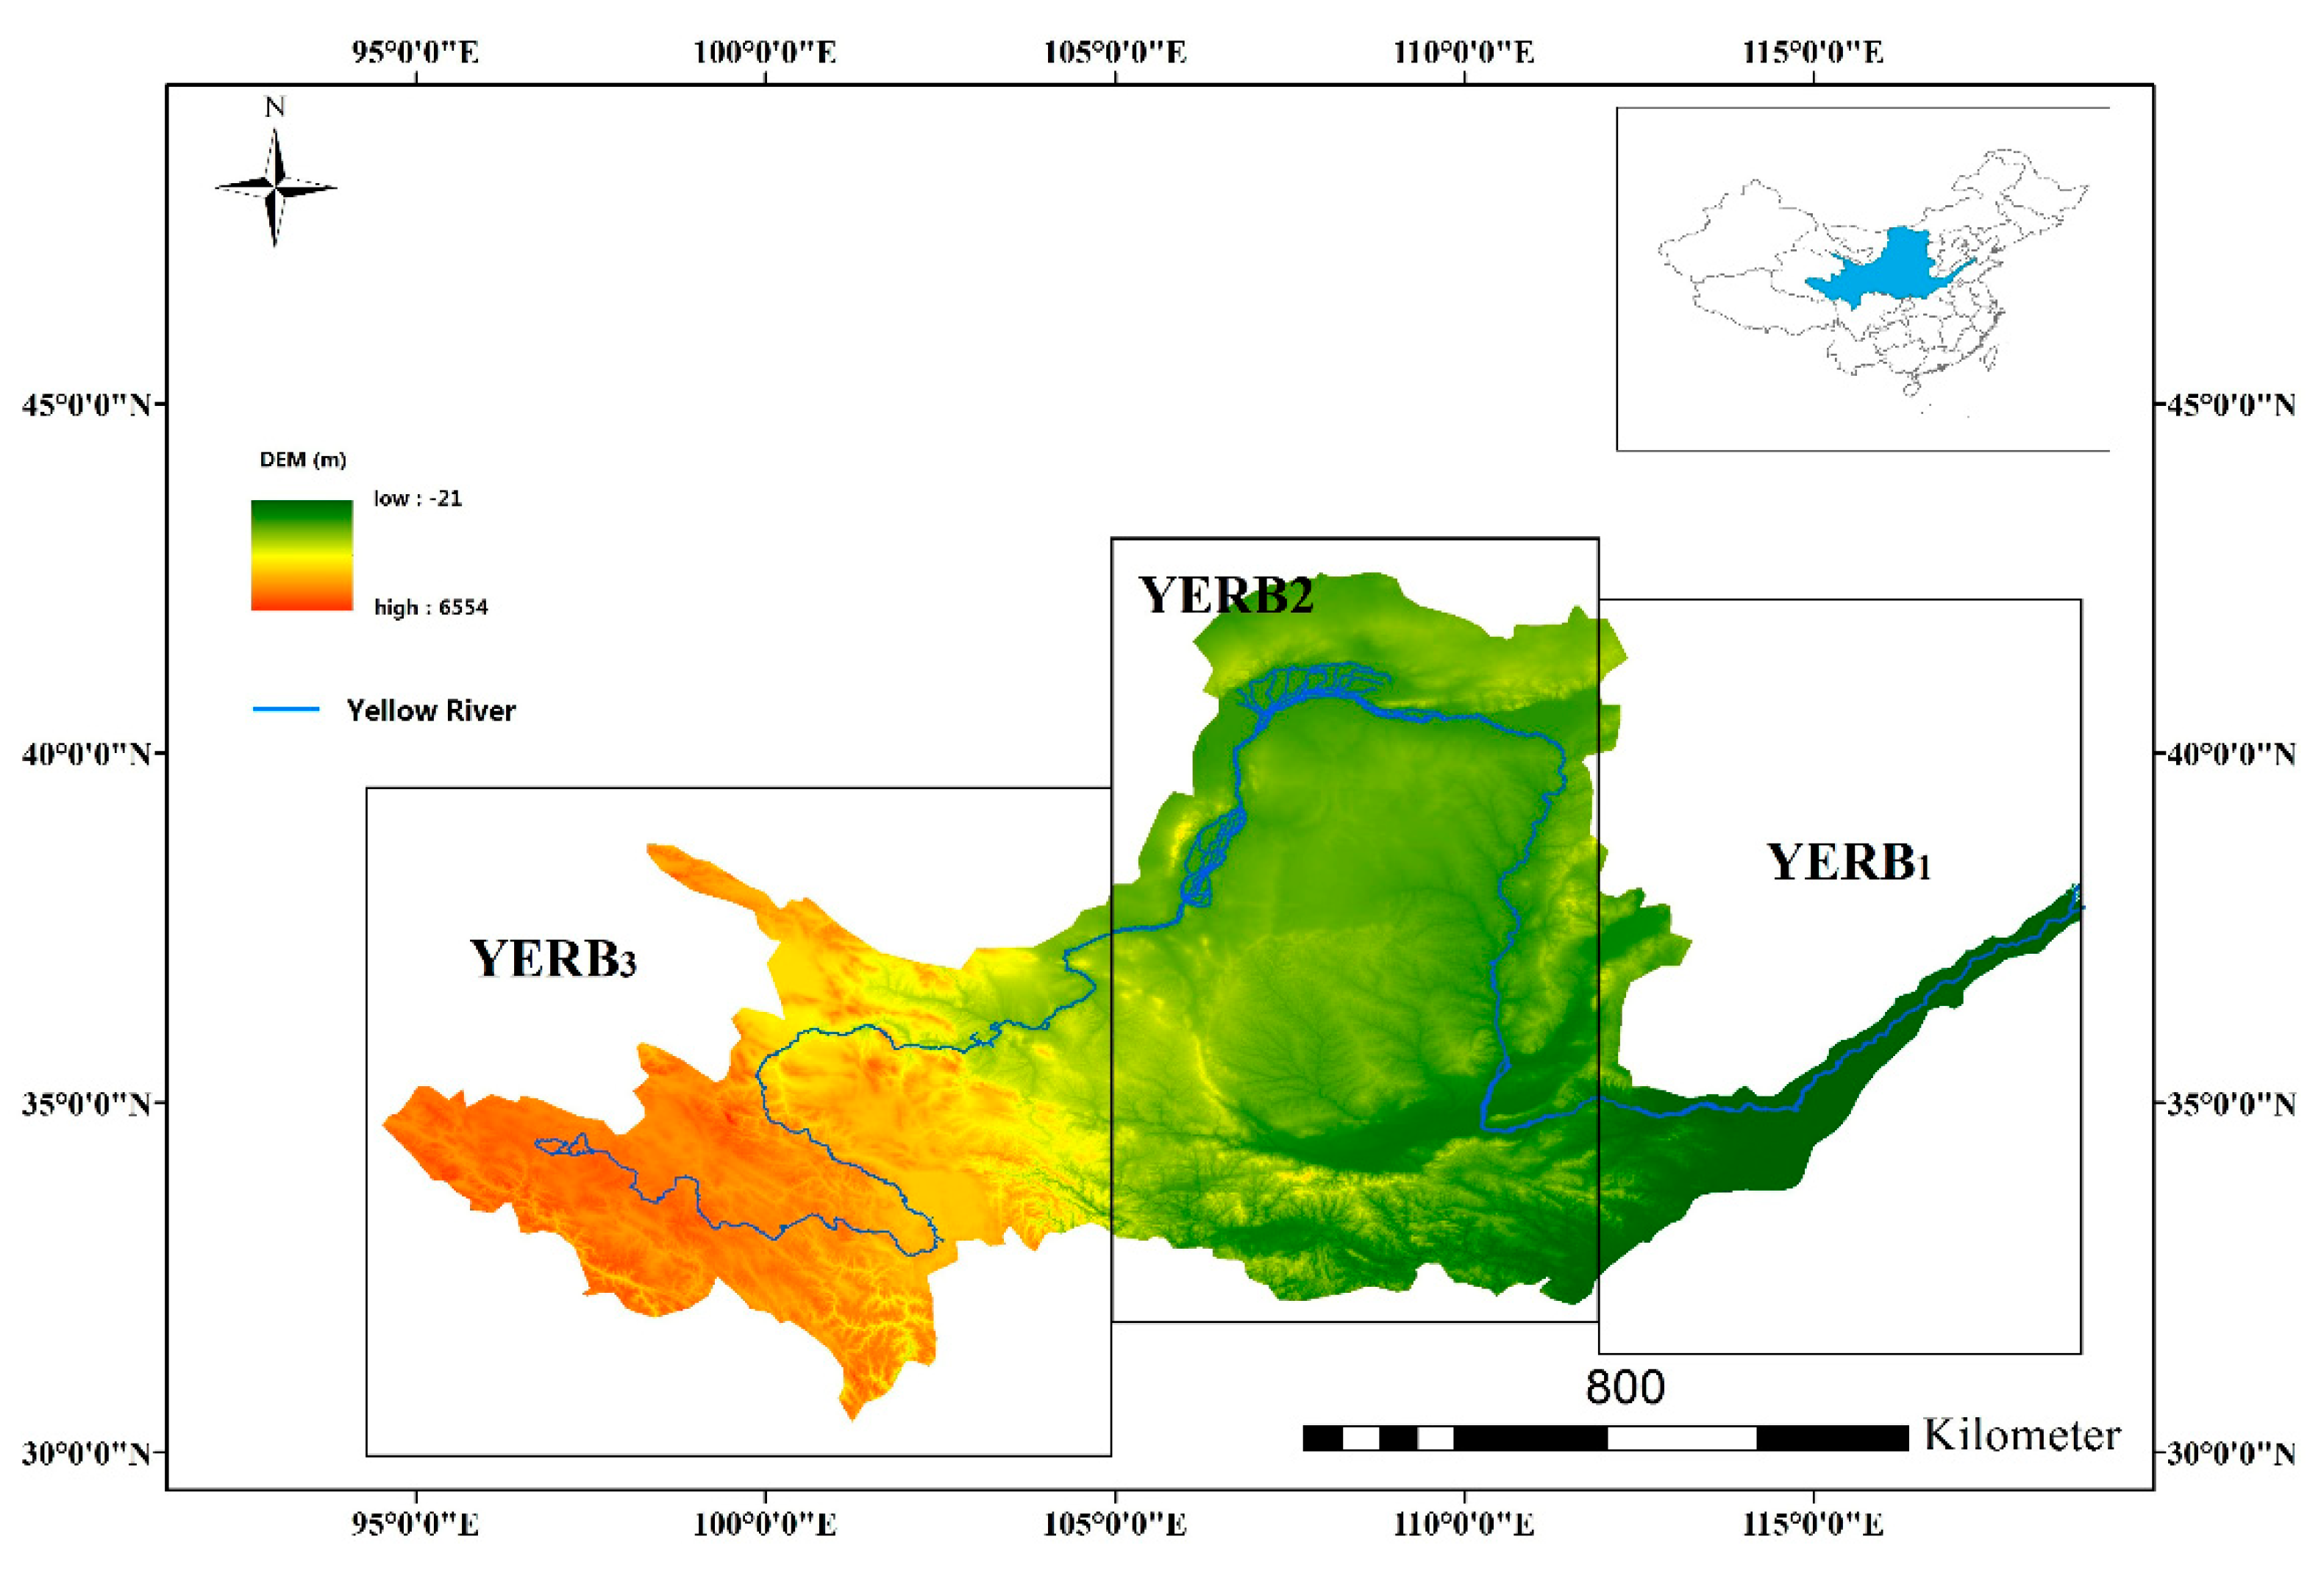
2. Study Area
3. Materials and Methods
4. Results and Discussions
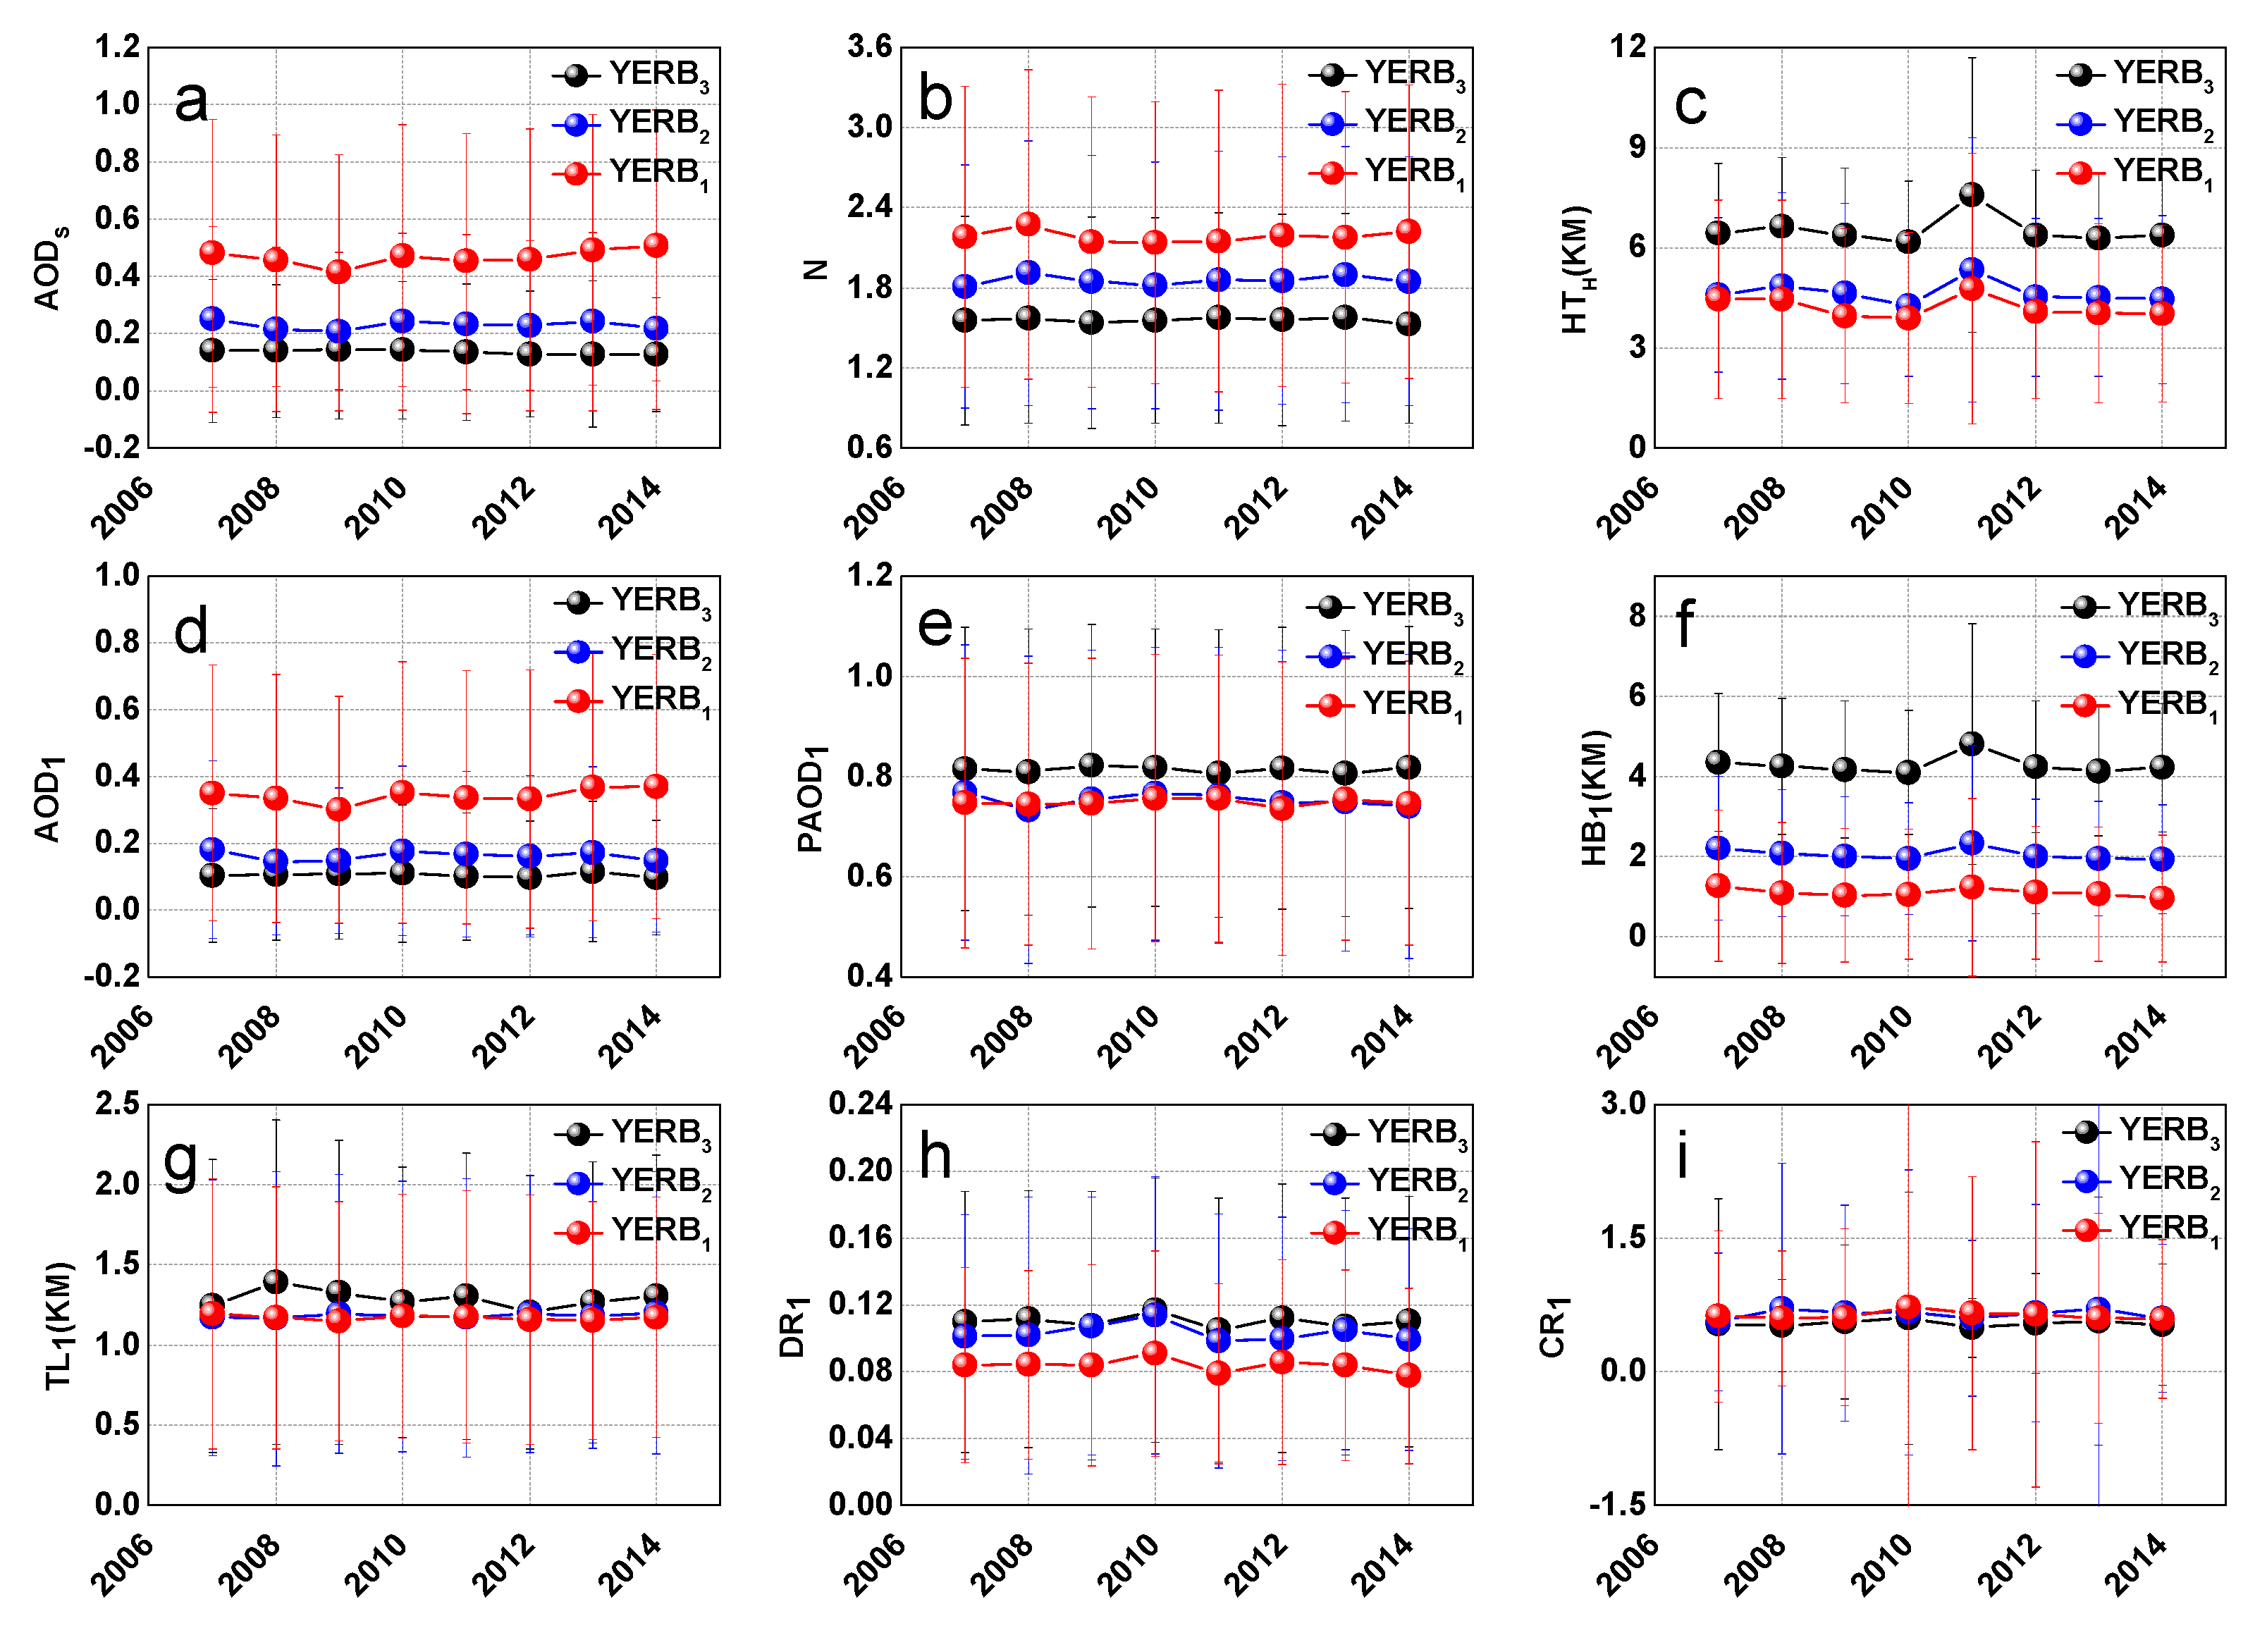
4.1. Interannual Variations and Characteristics of Aerosol Layers over the YERB
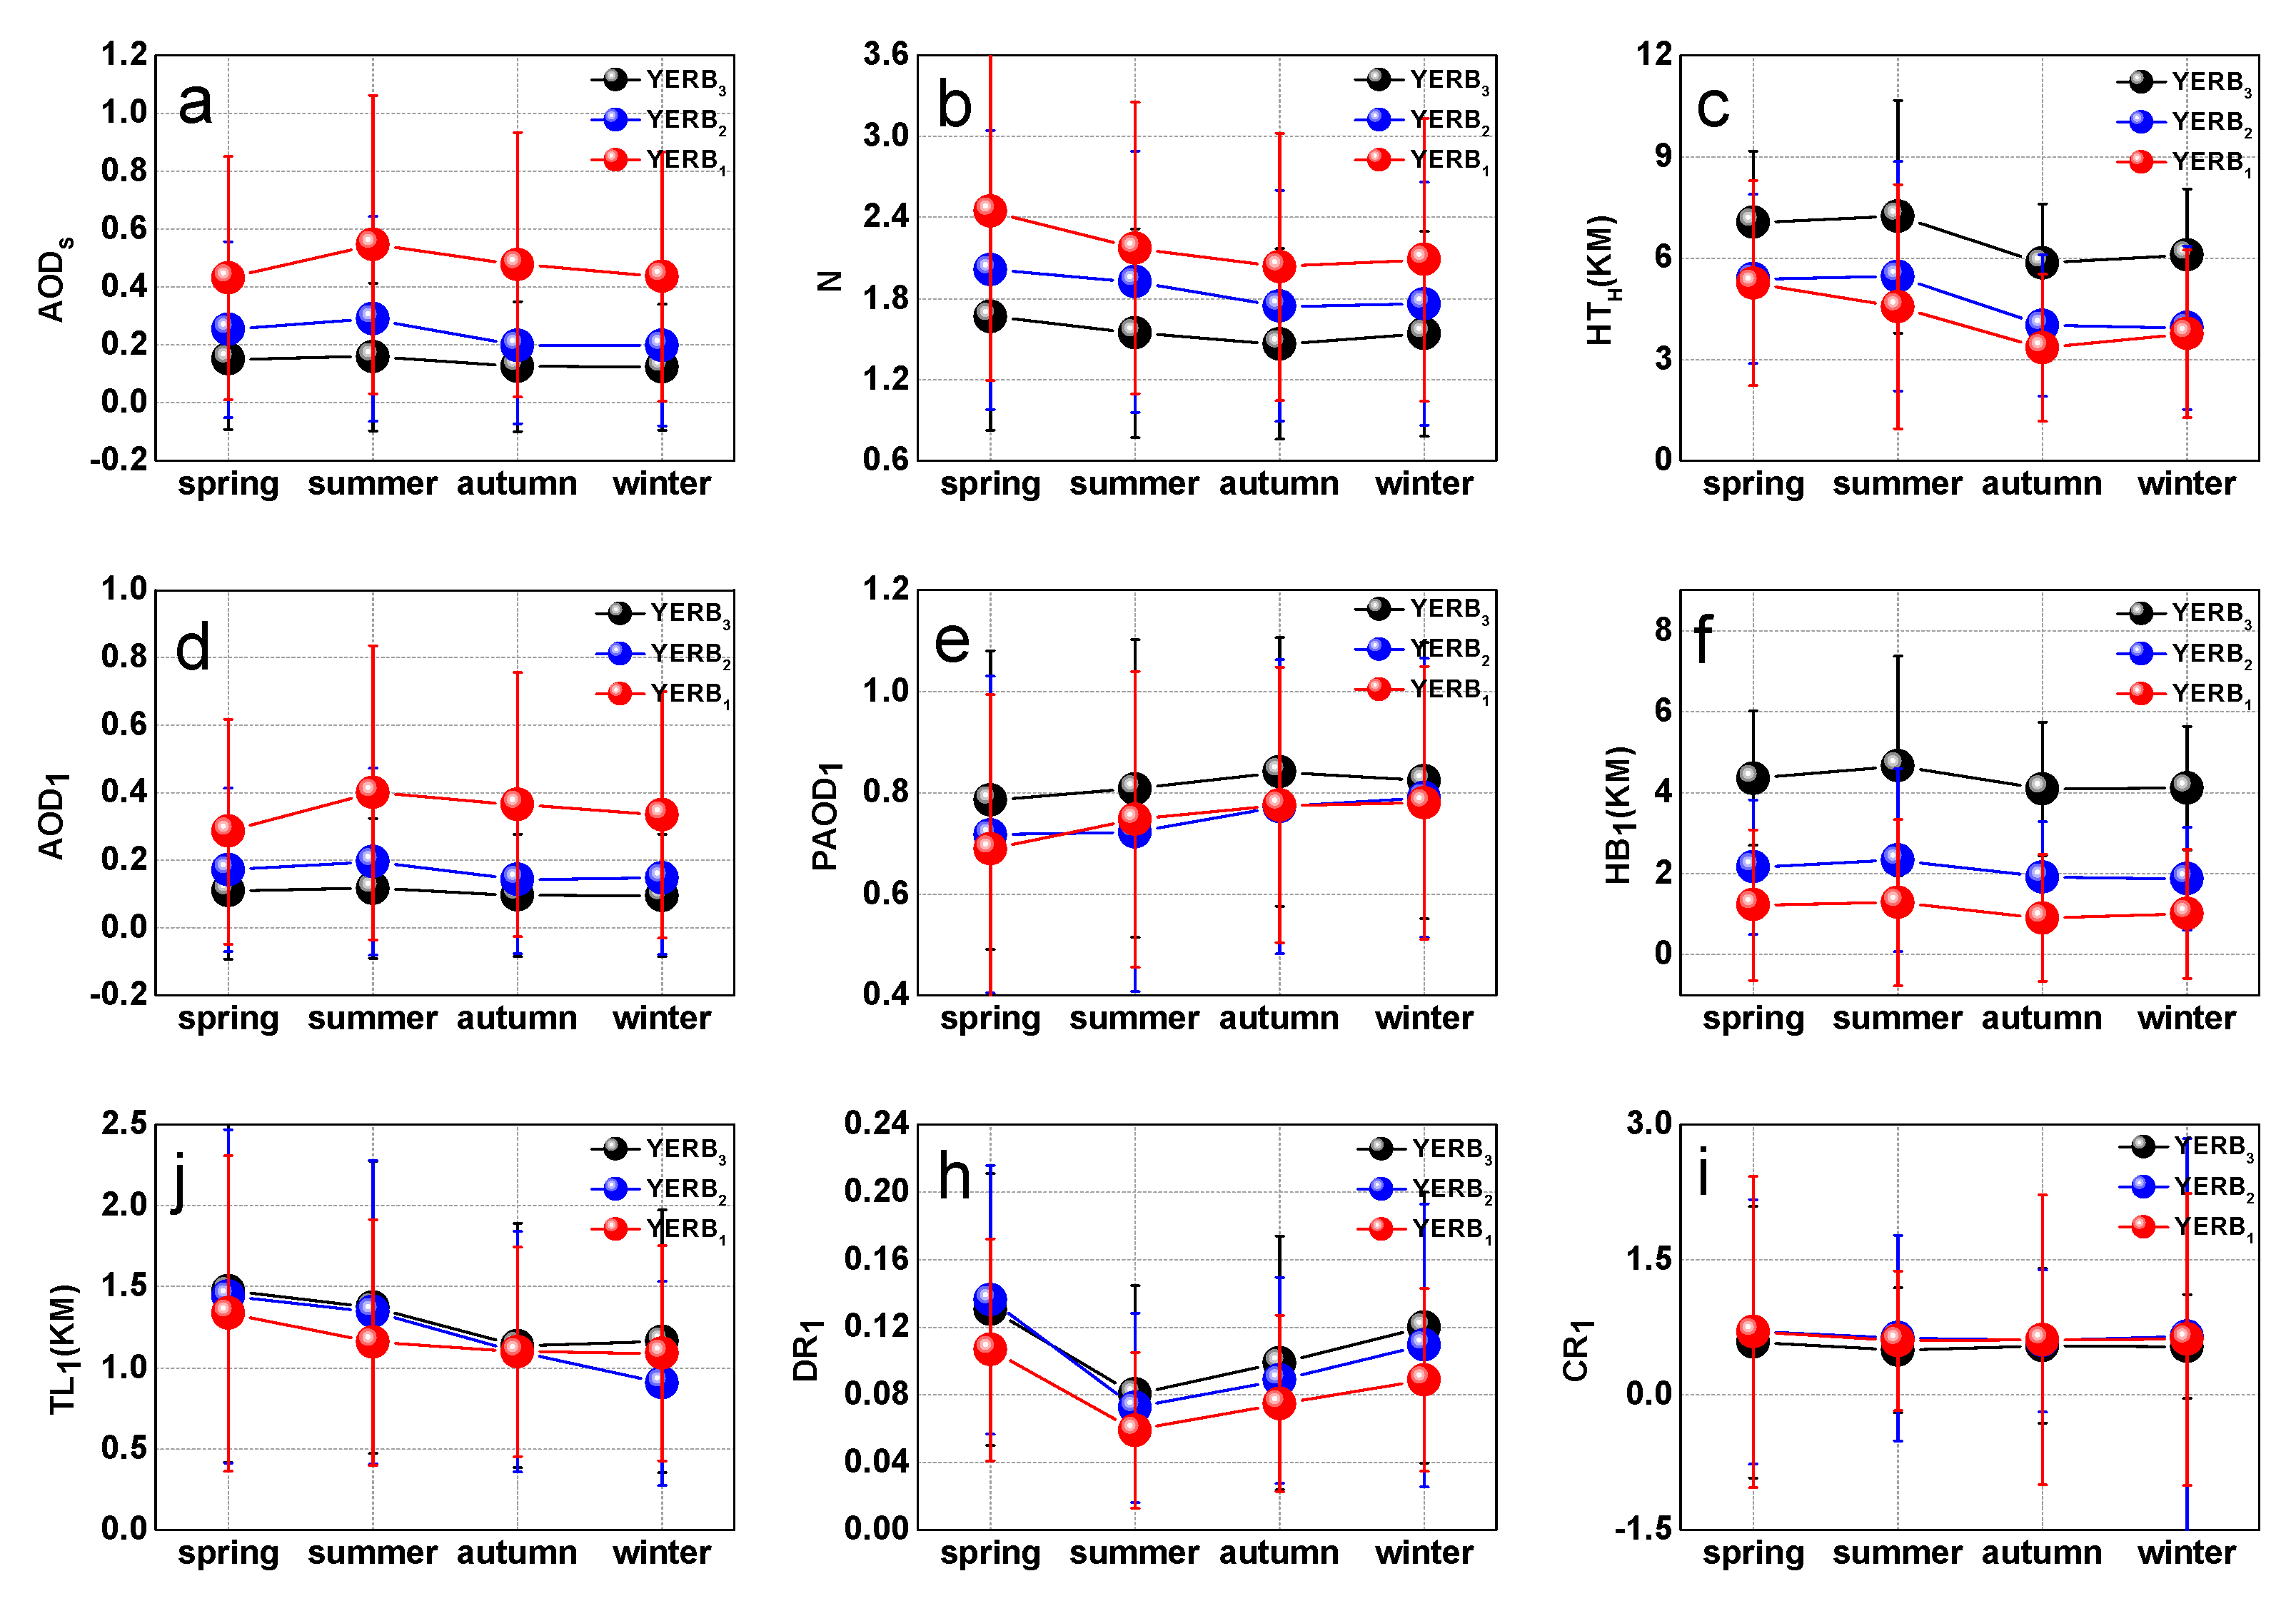
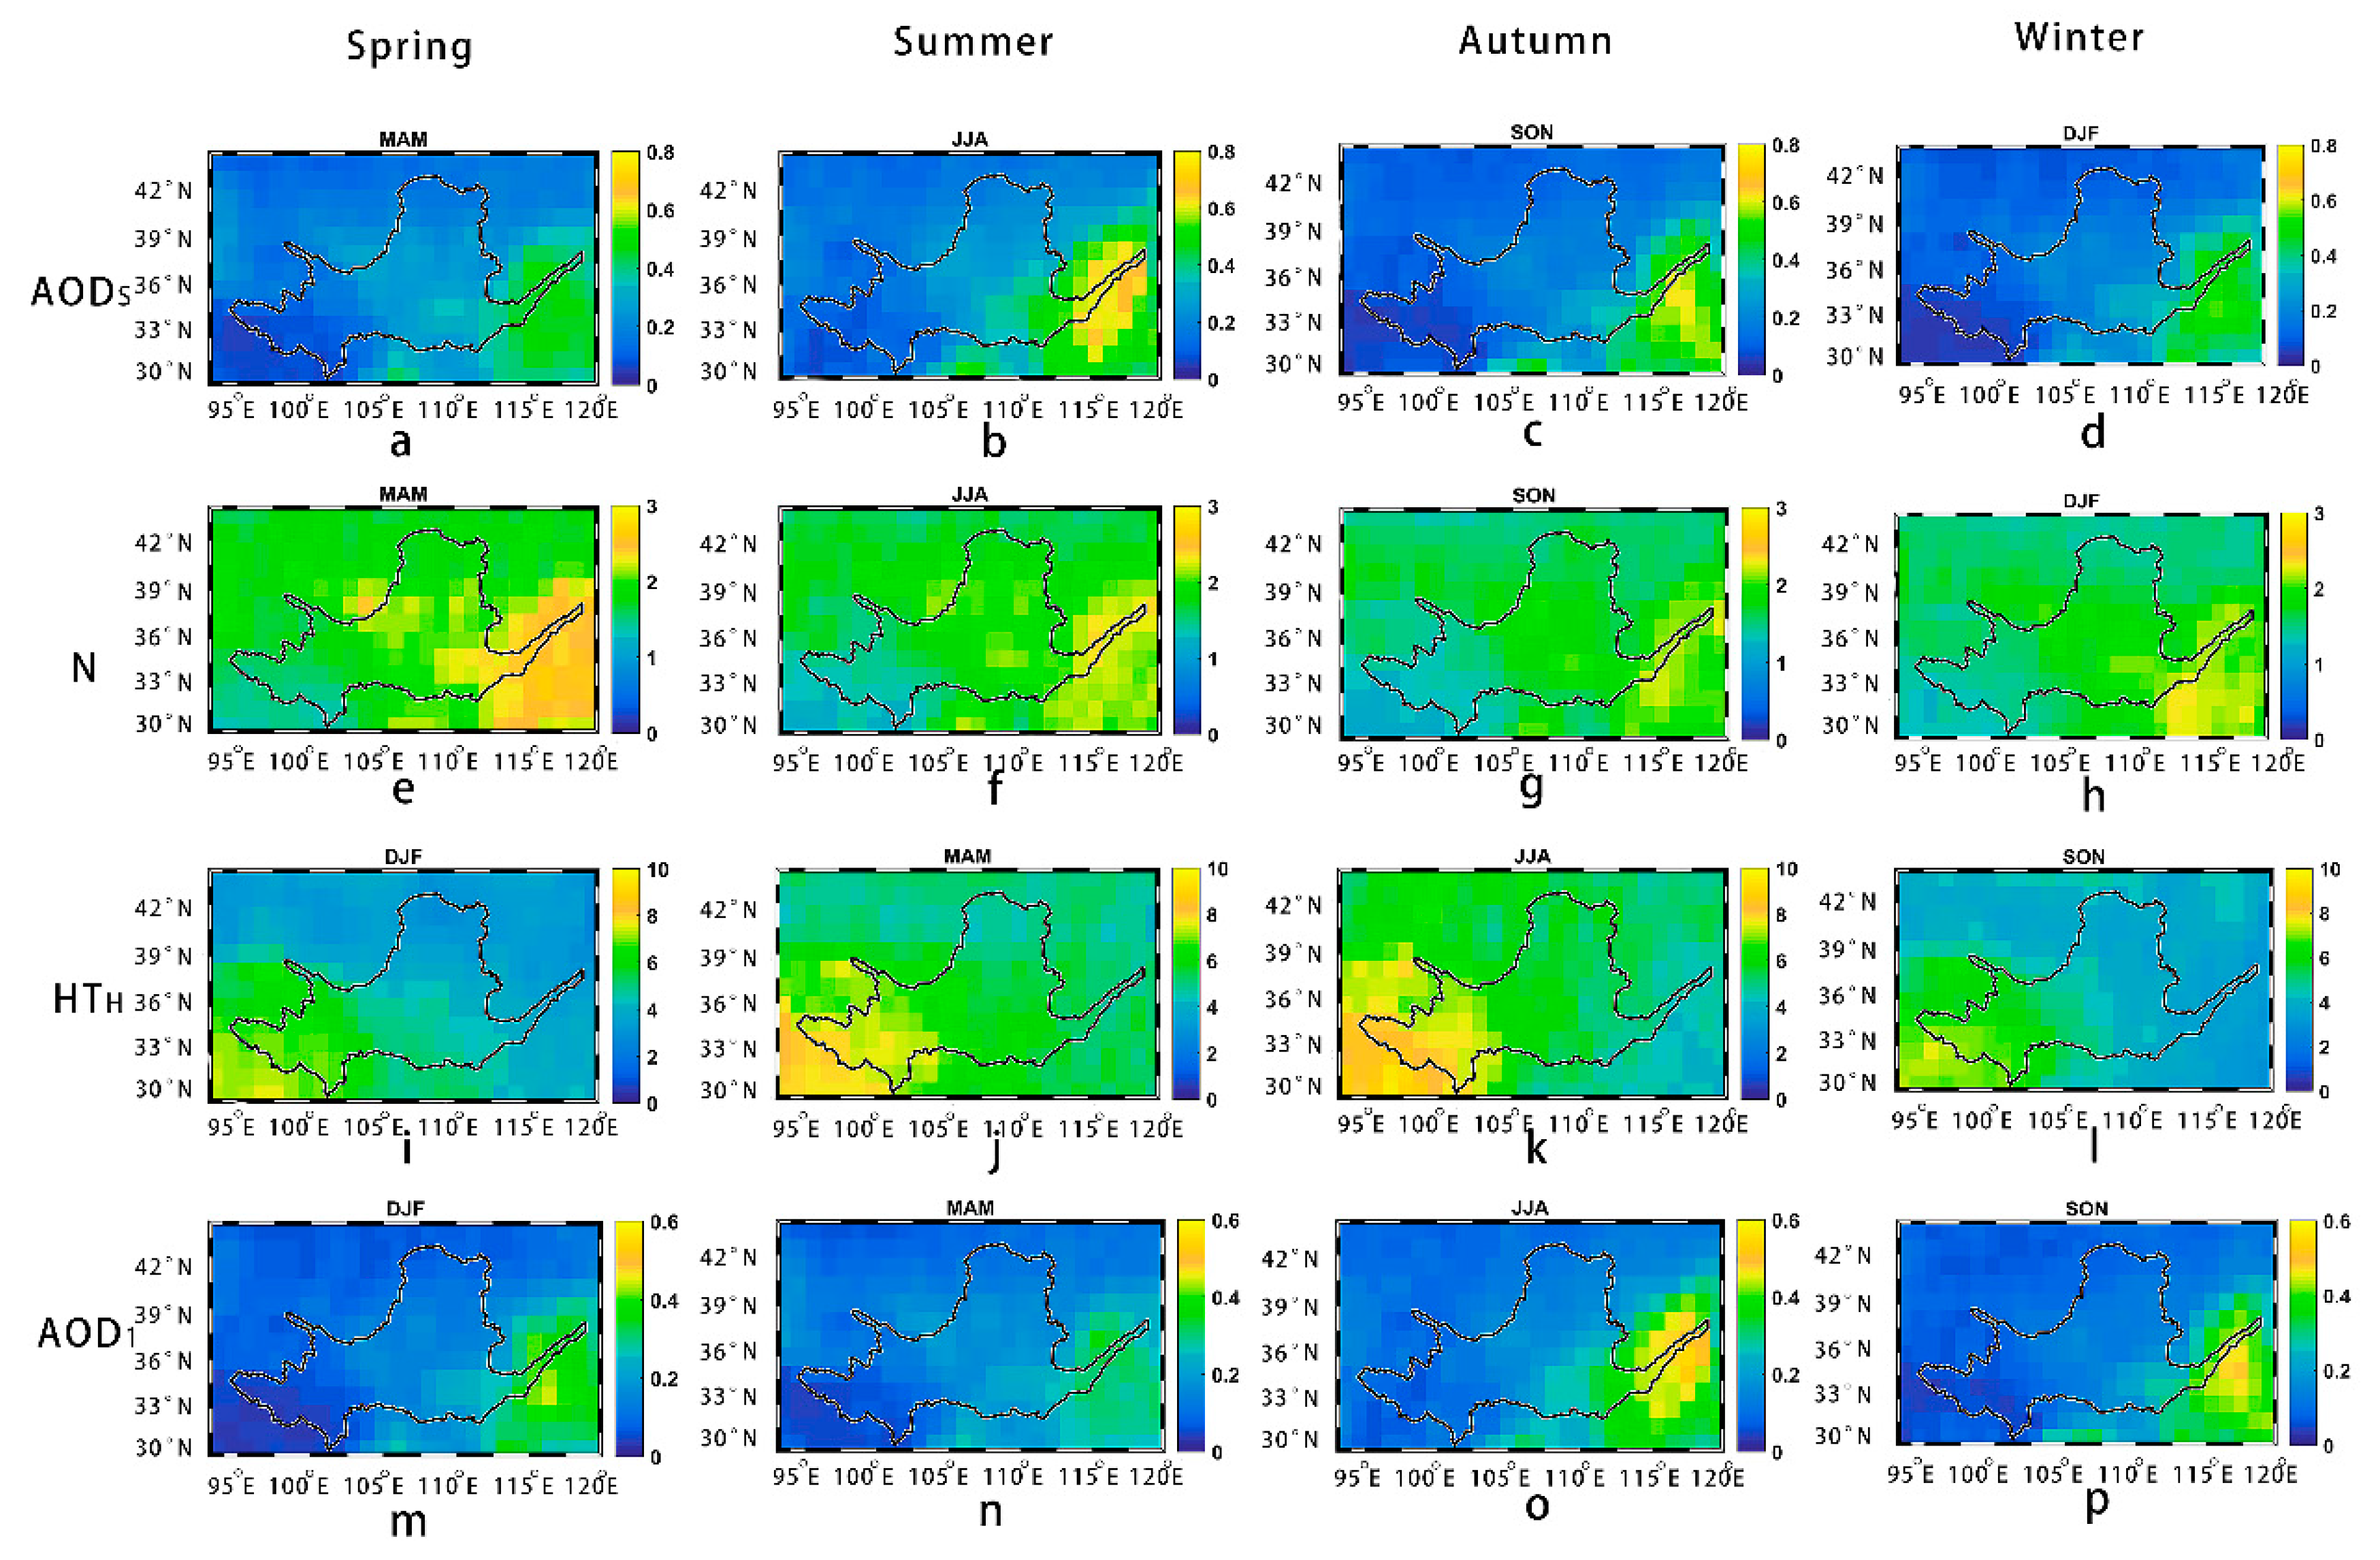
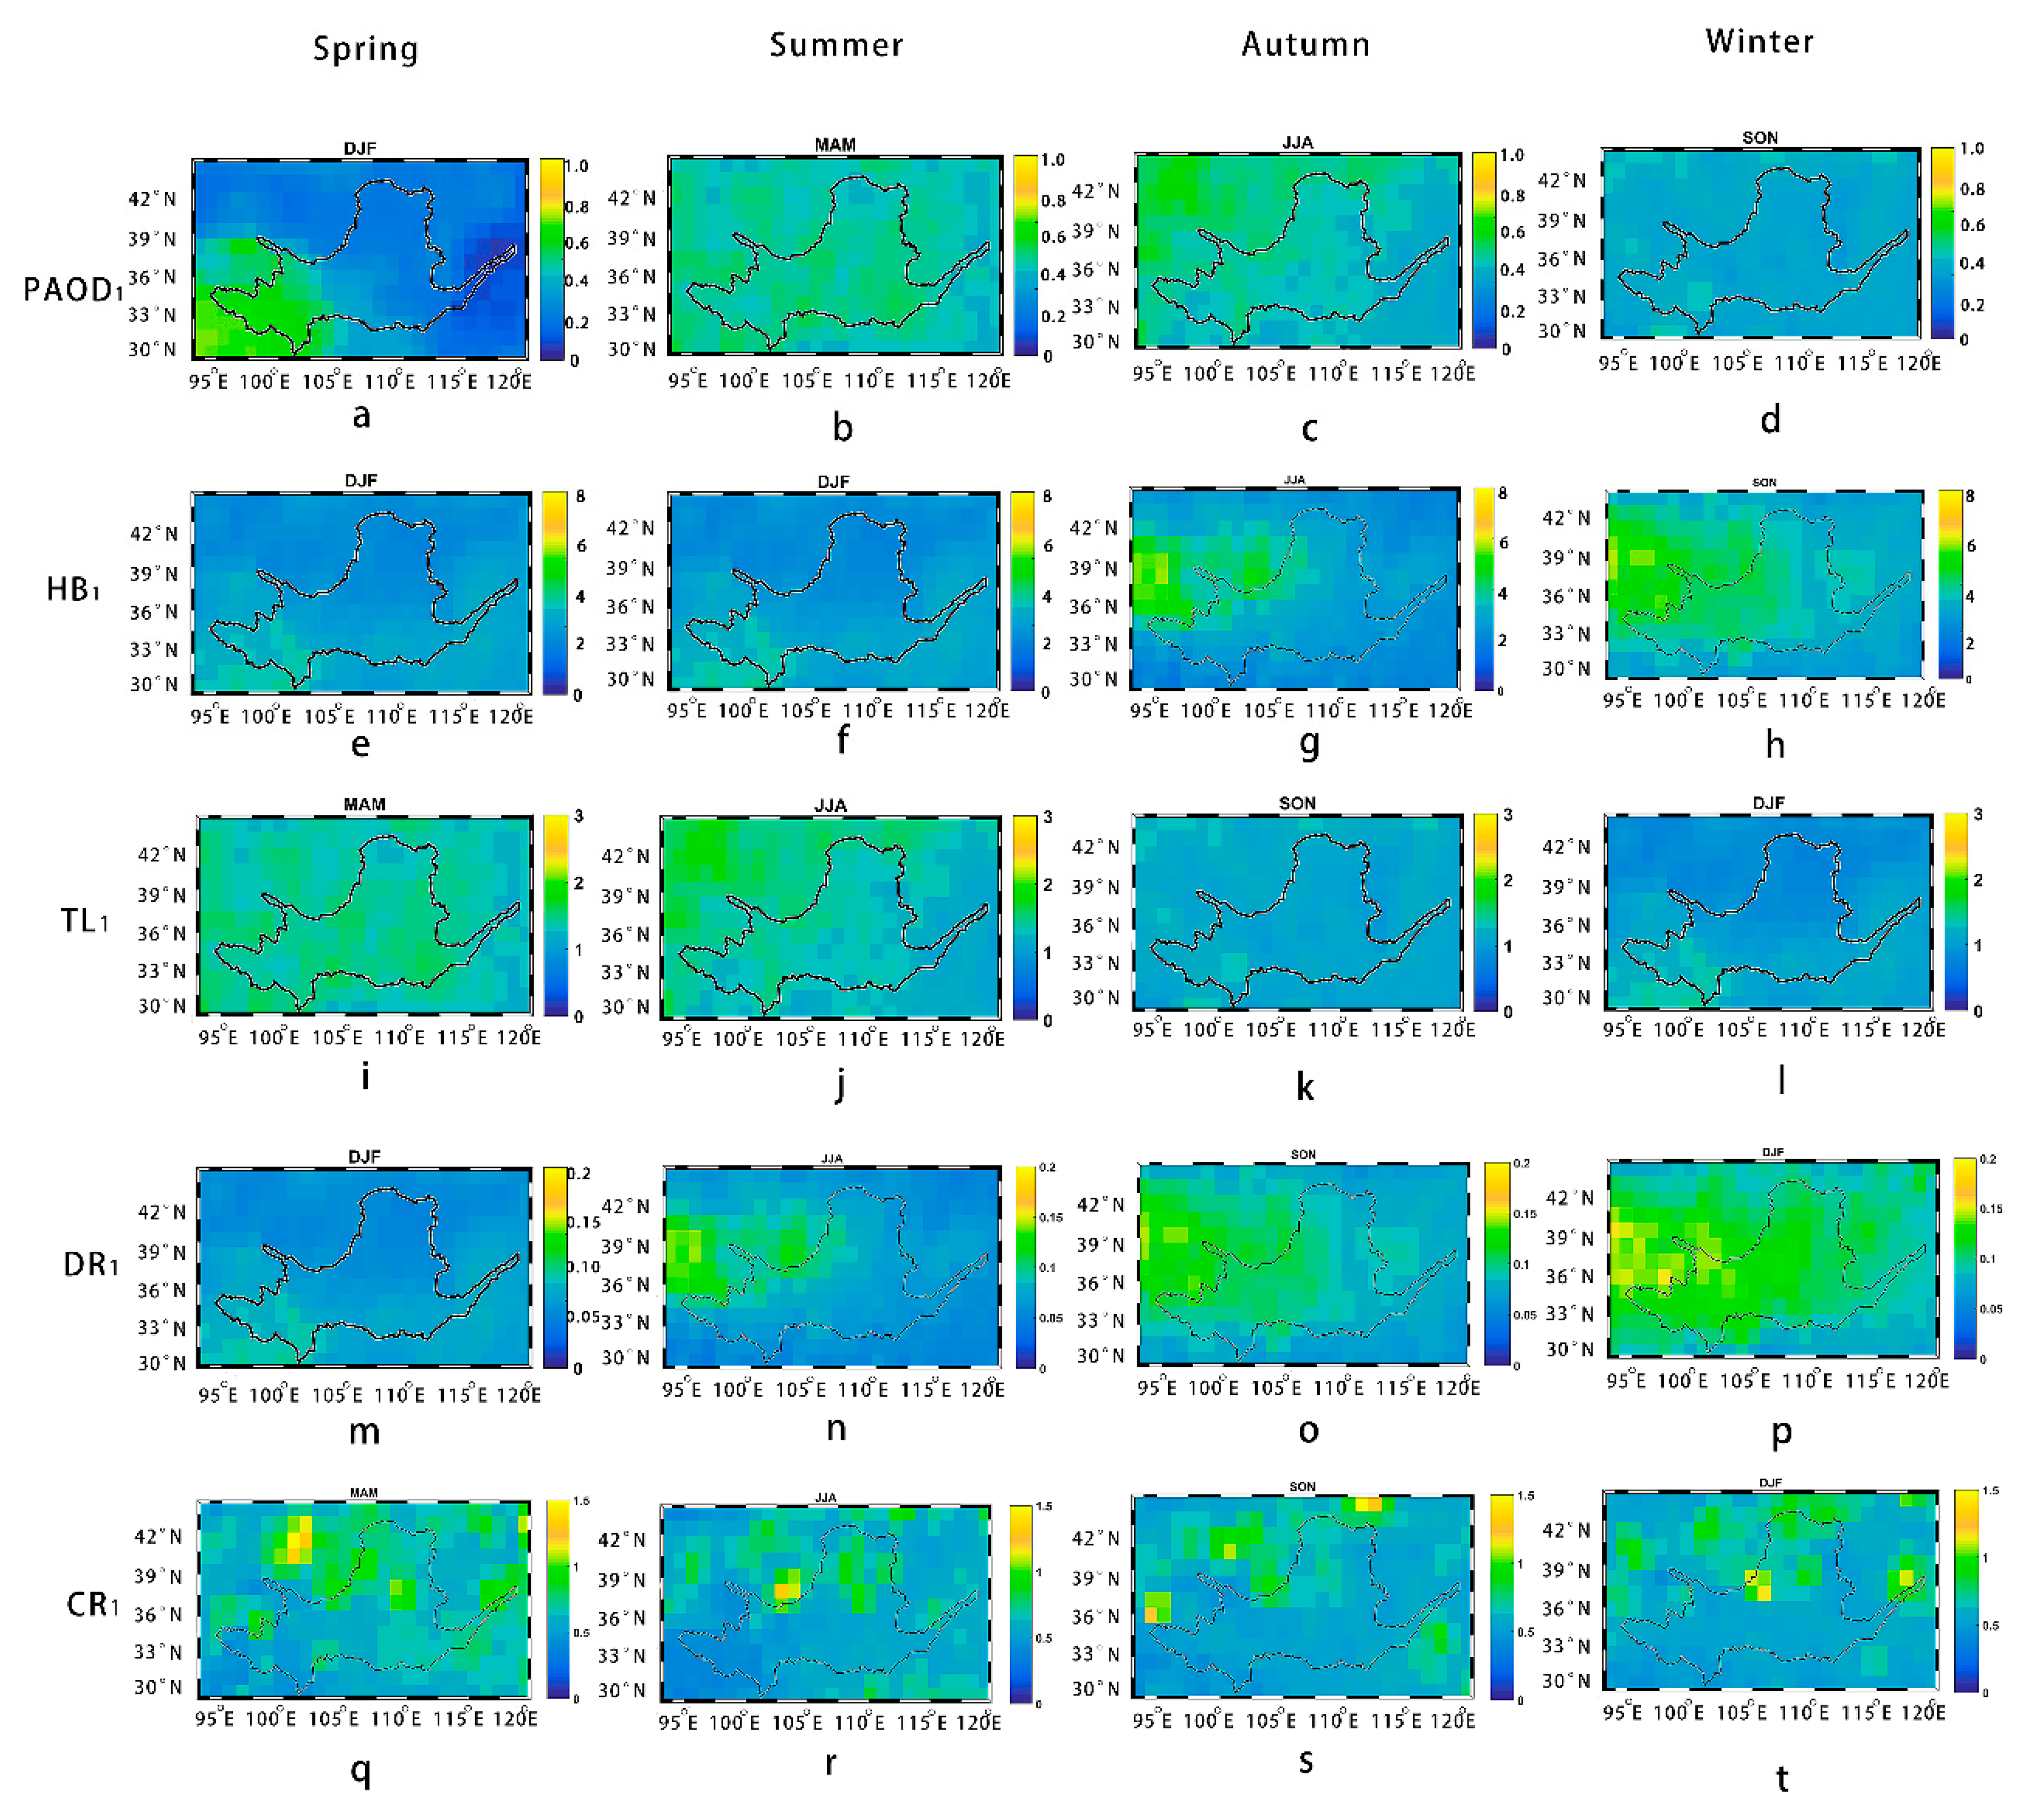
4.2. Seasonal Variations and Characteristics of Aerosol Layers over the YERB
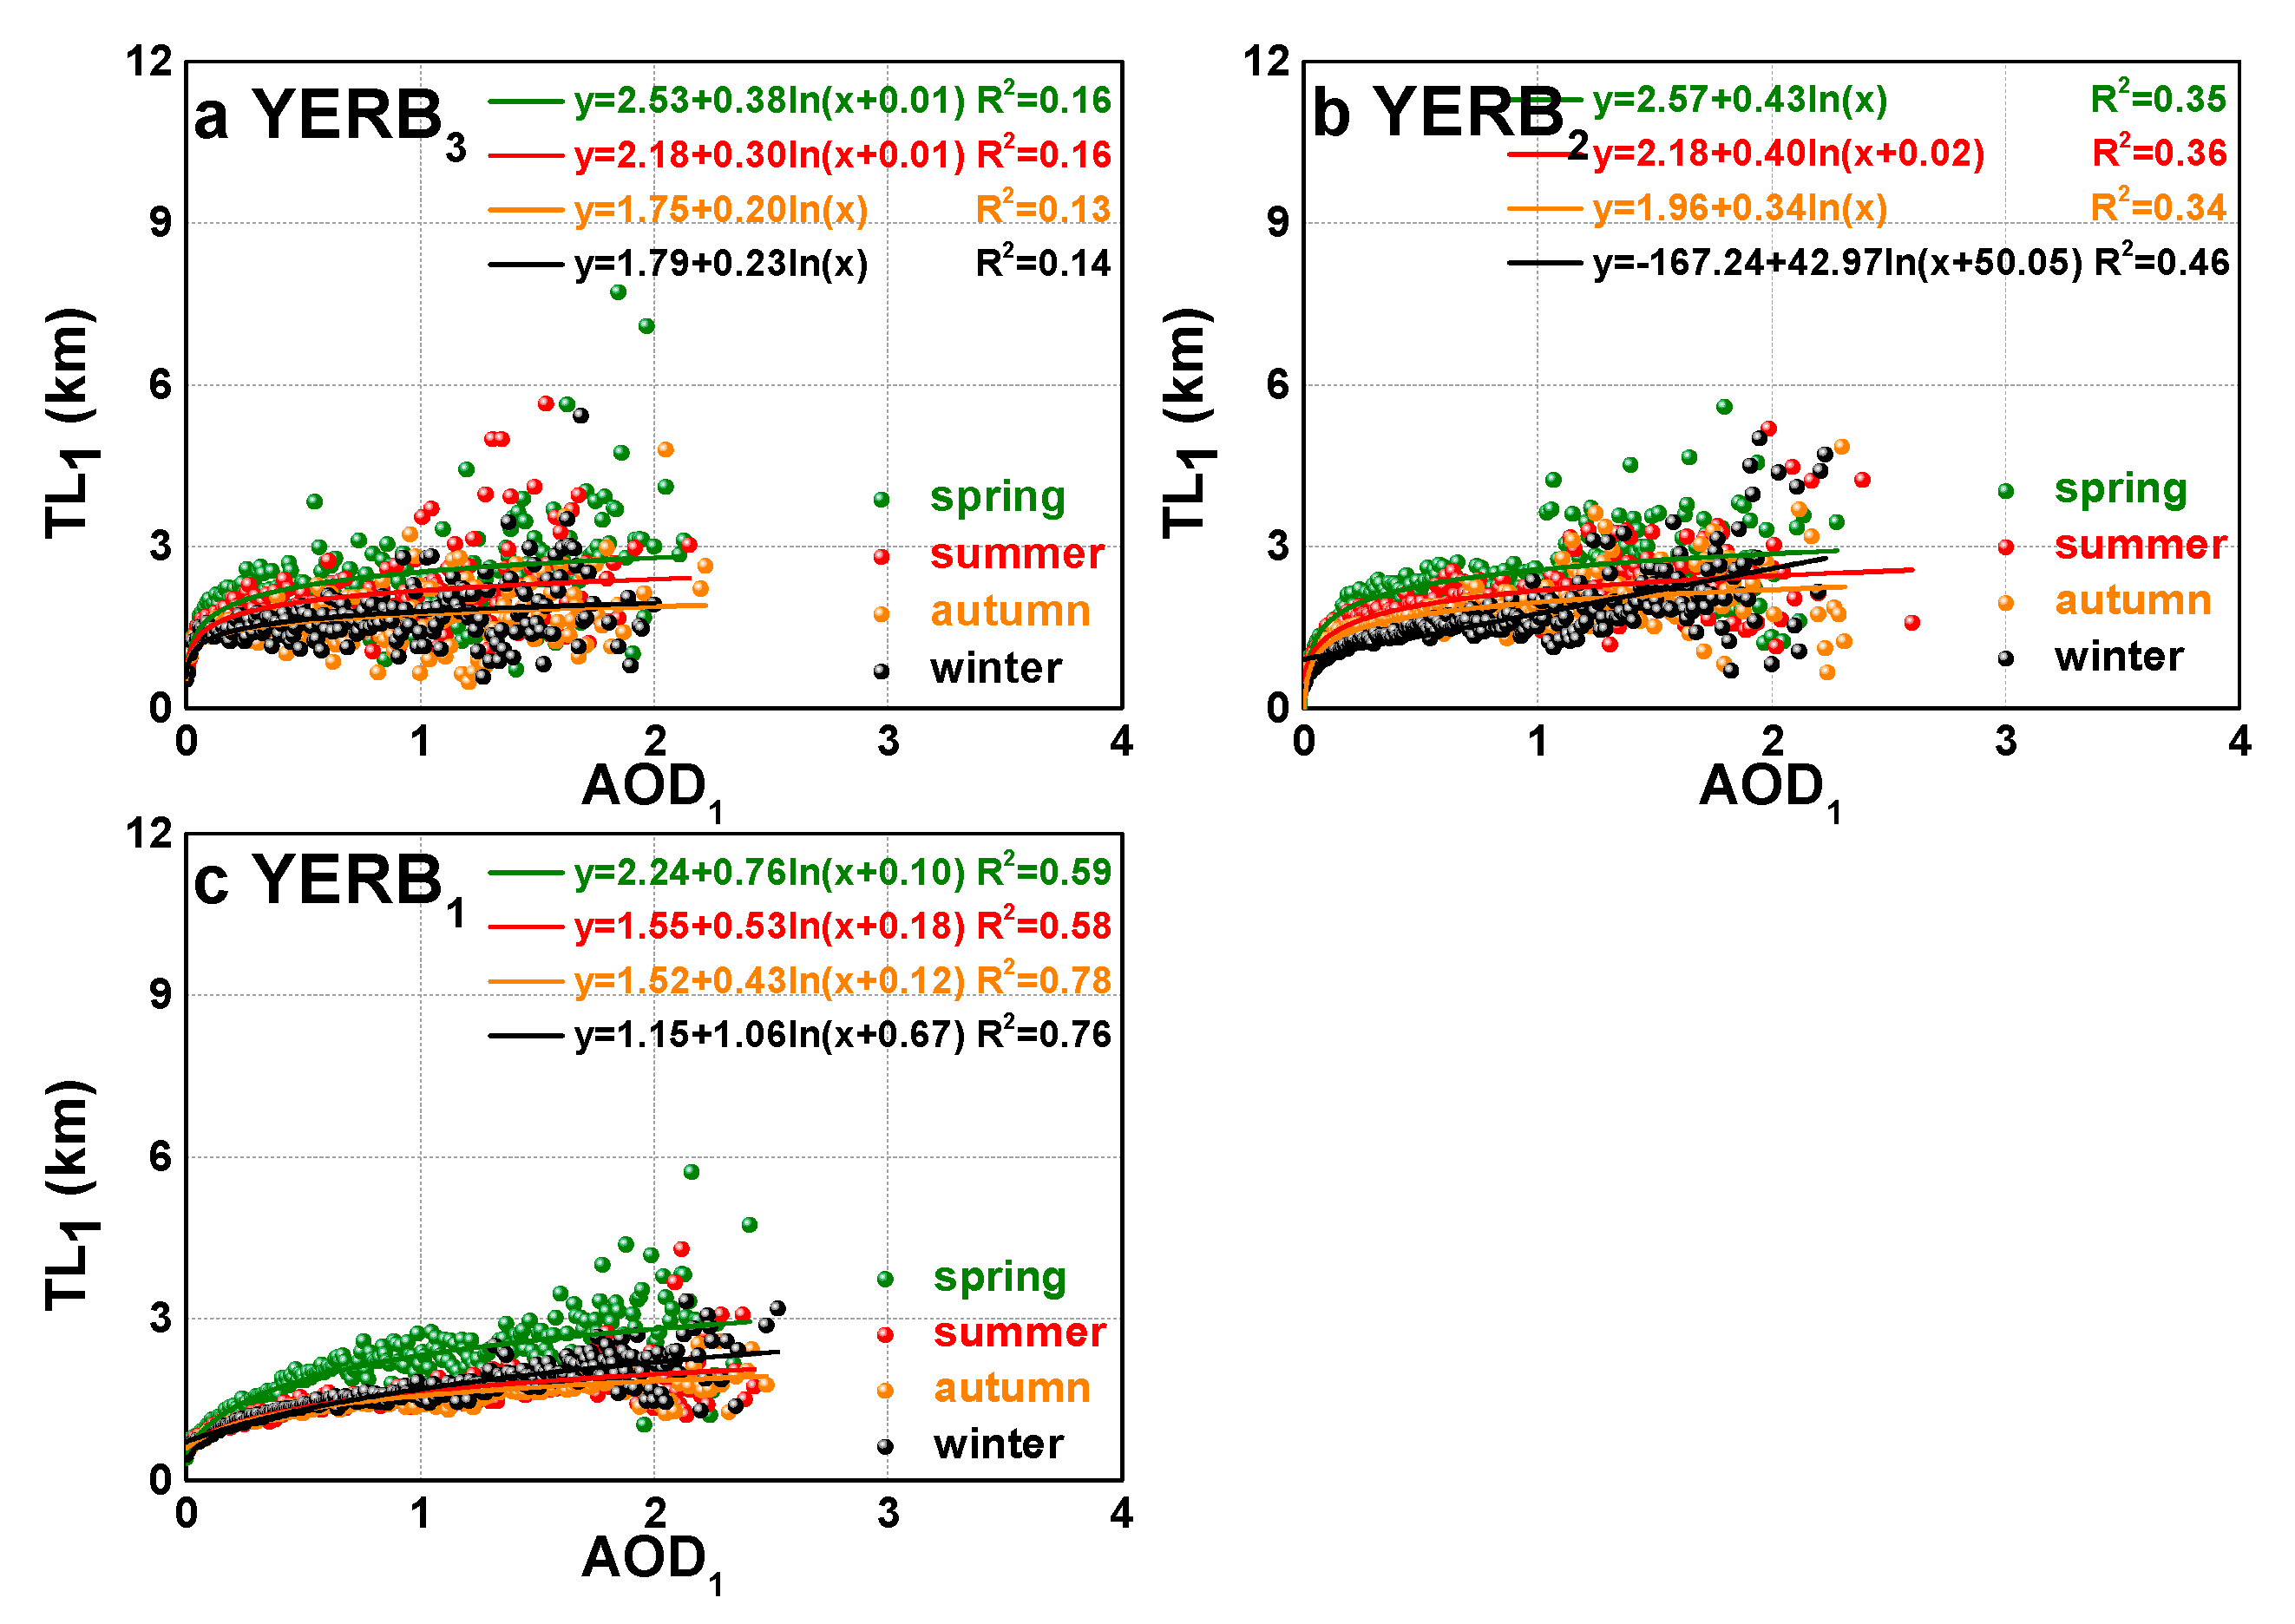
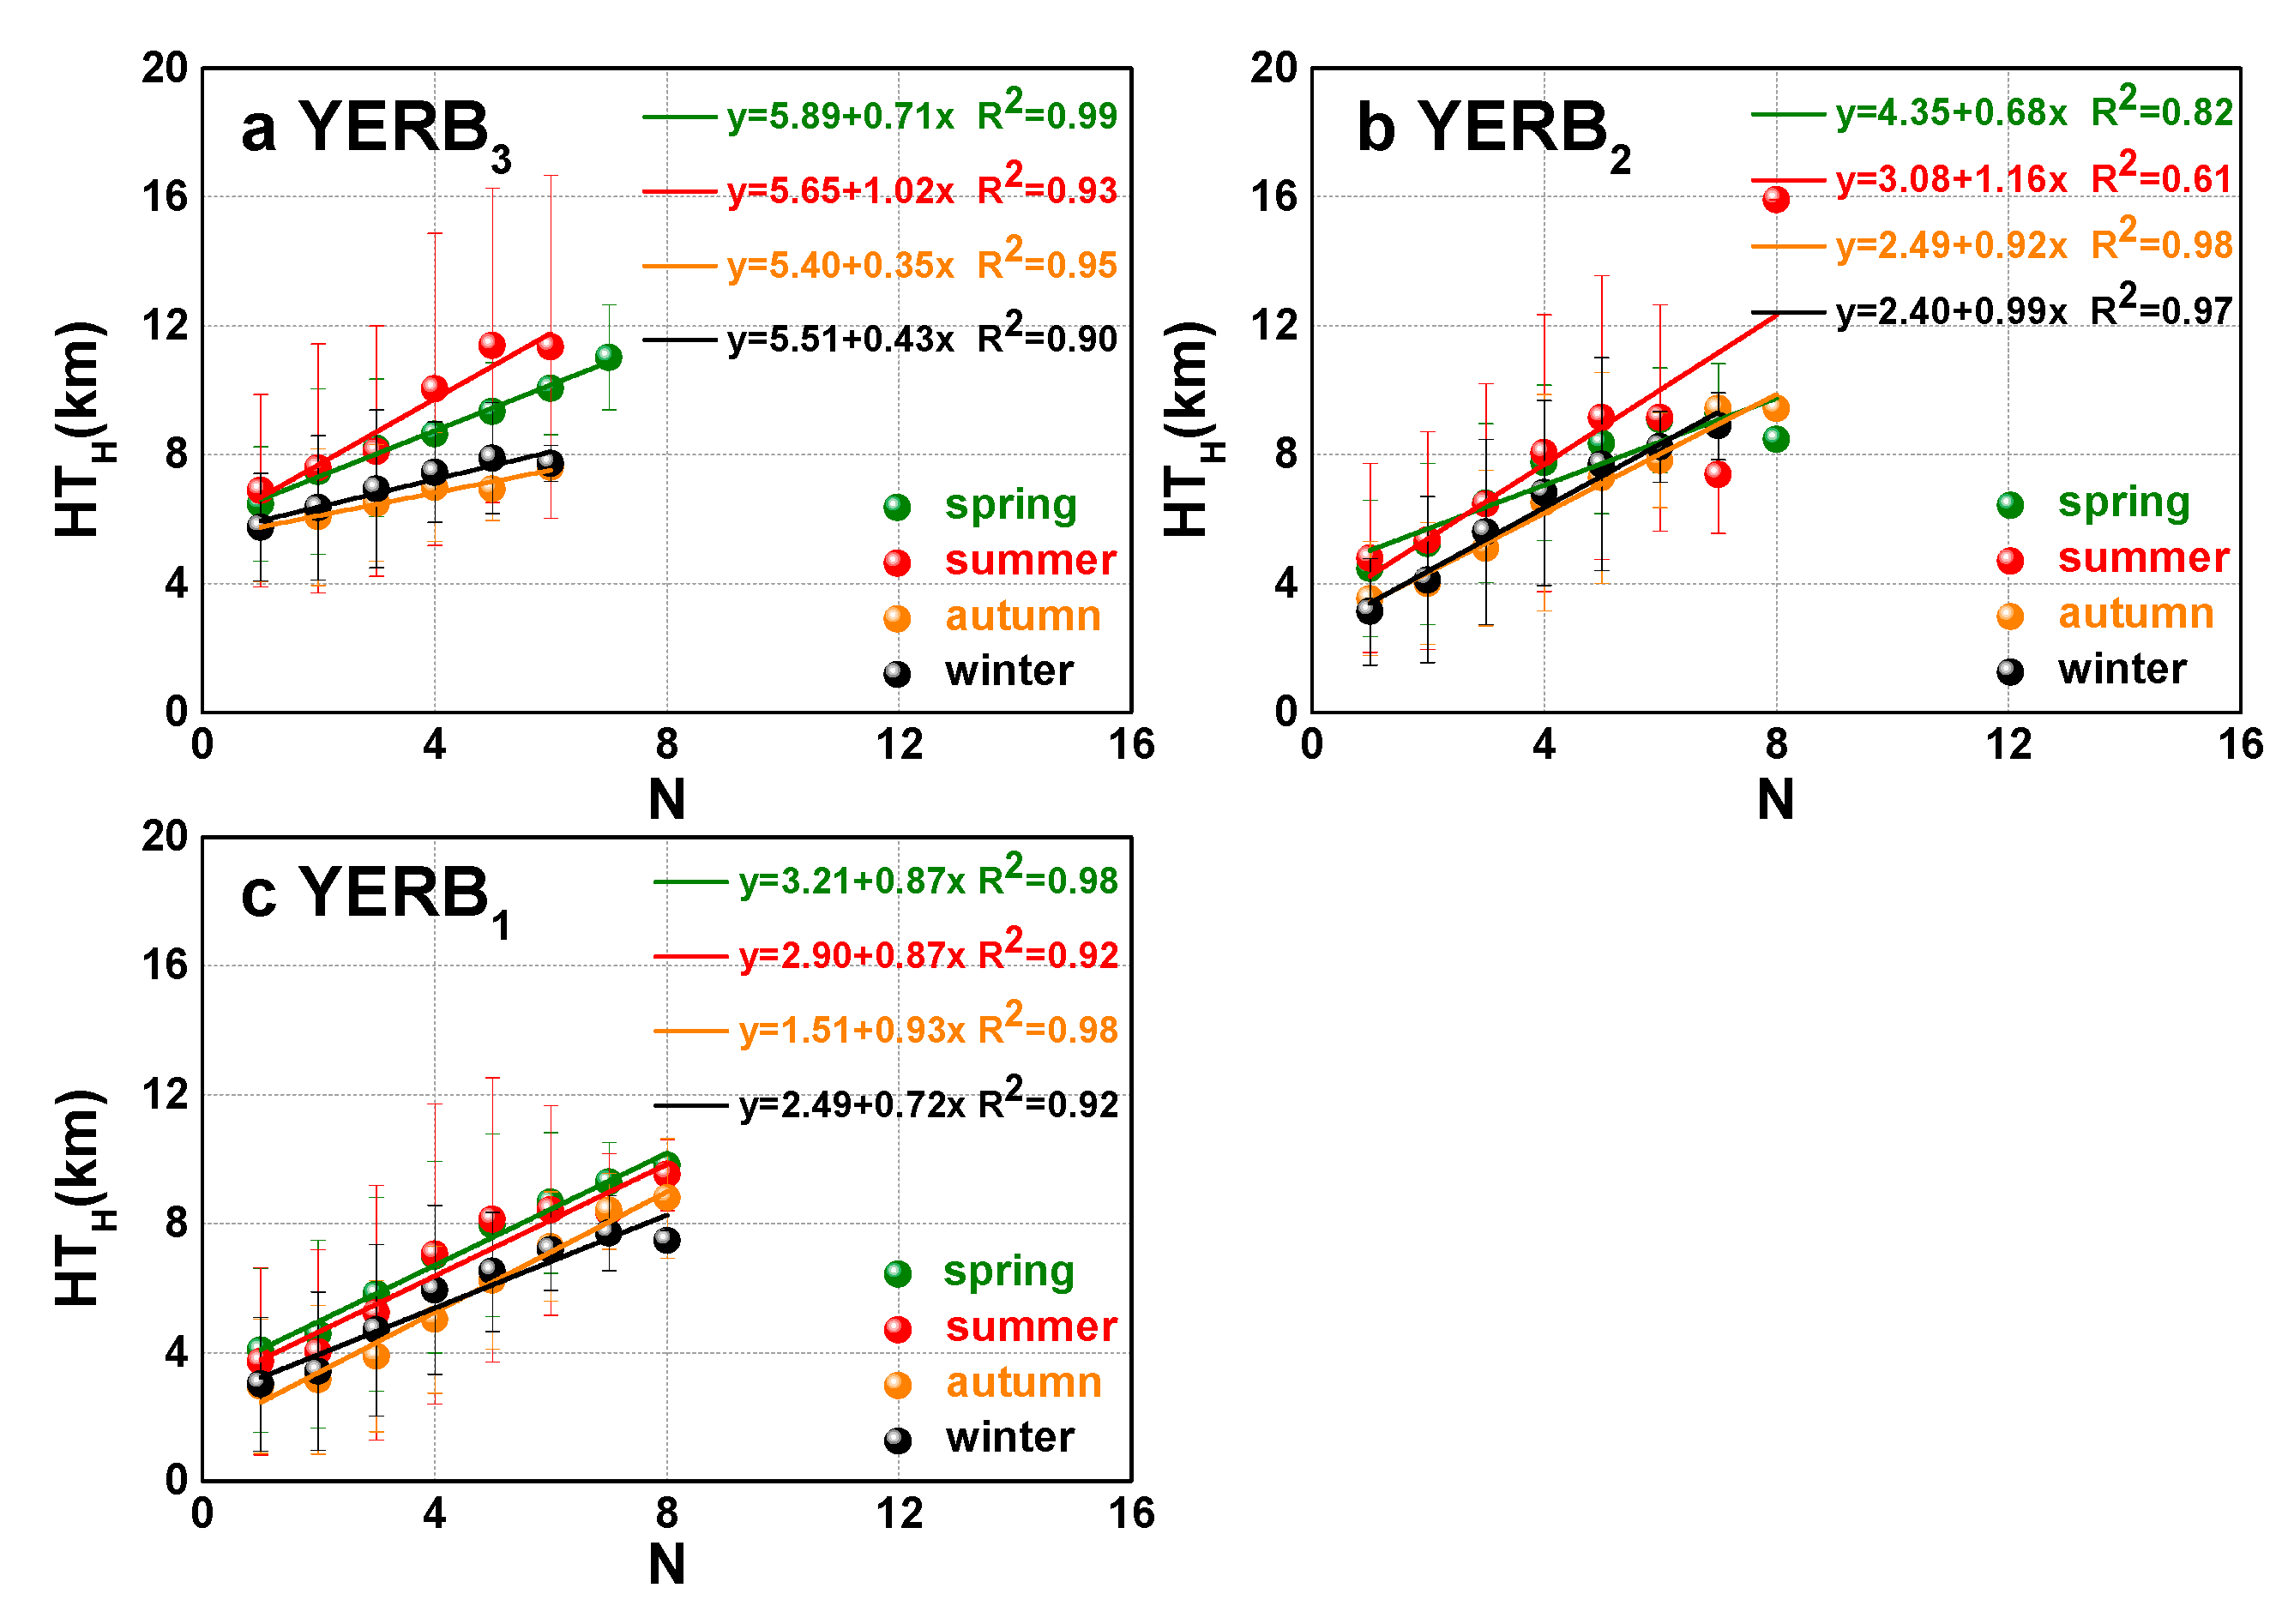
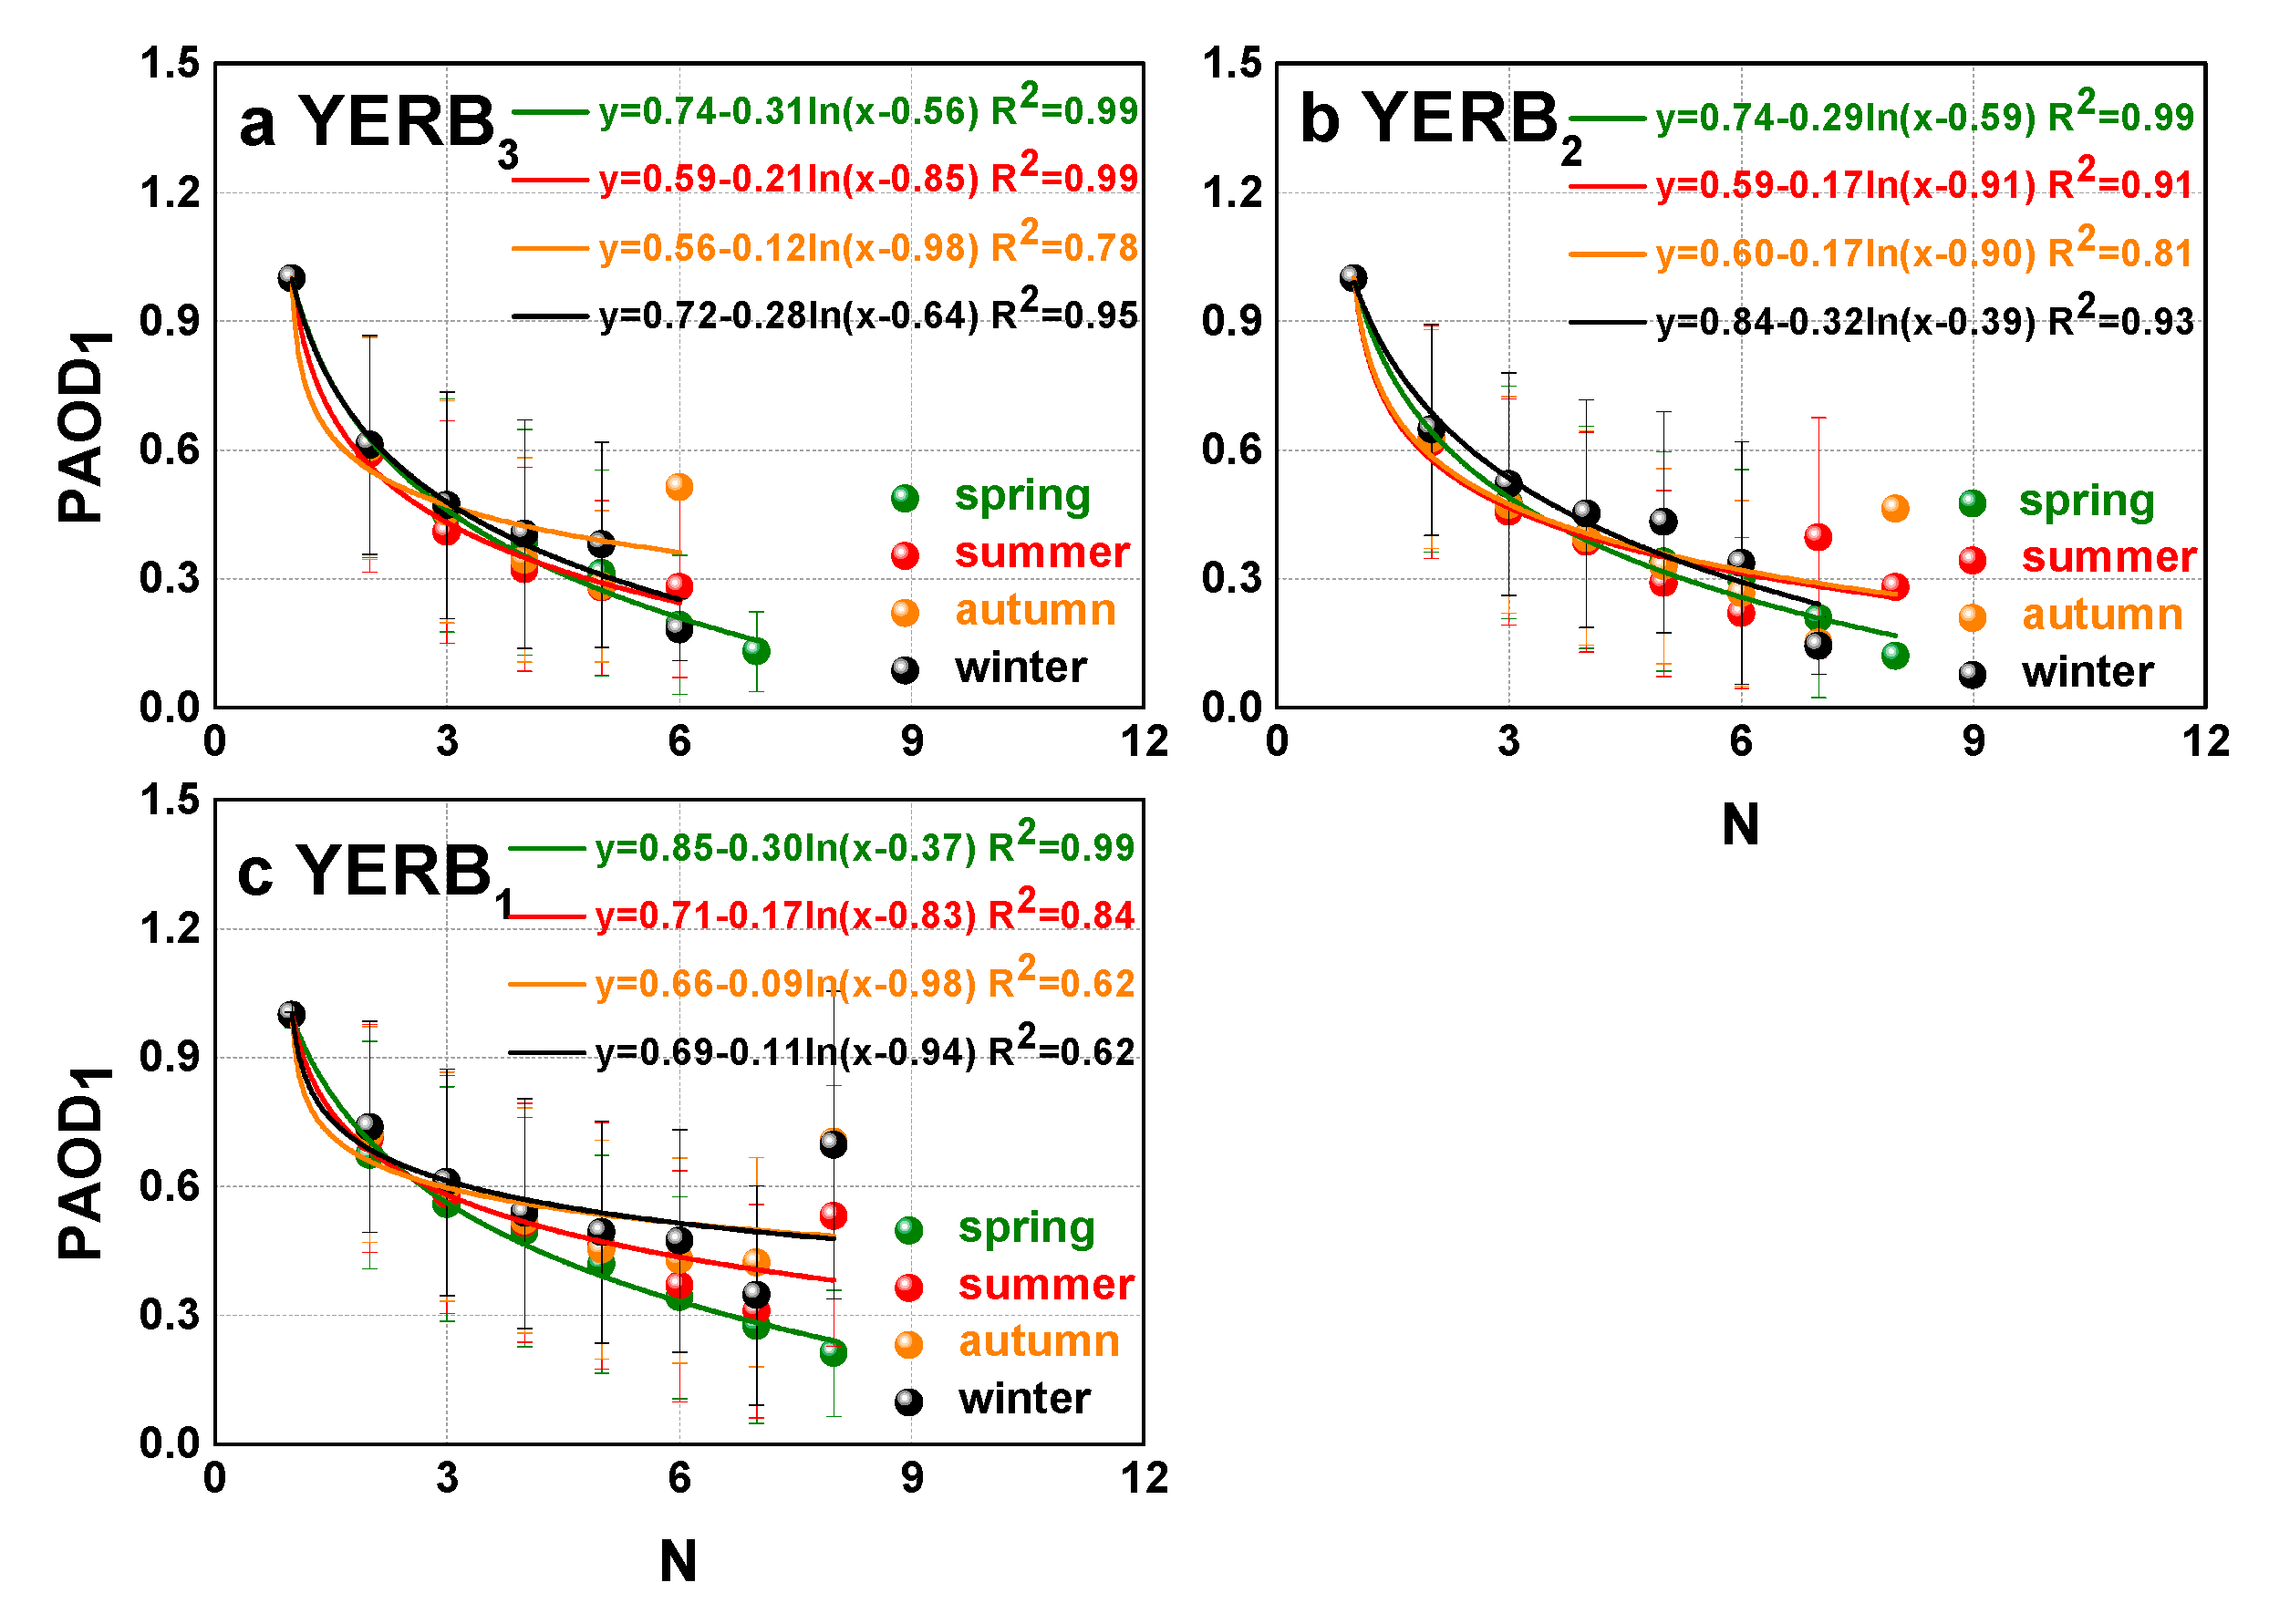
4.3. The Correlations of the Lowest Aerosol Properties over the YERB
5. Conclusions
- (a)
- AODS values and relative large values of aerosol amount (N > 2) were observed over the YERB1 region, as YERB1 is the most polluted region, and the atmosphere possesses strong vertical movement, which can lead to a clear vertical stratification.
- (b)
- High values of the HTH were observed over the YERB. In addition, the HTH and the HB1 significantly vary with respect to the topography and seasons as high values observed in spring and summer compared to autumn and winter. However, the TL1 did not vary with topographical features, and low values of the TL1 values (approximately 1–1.5 km) were observed over the YERB.
- (c)
- PAOD1 was quite large (0.7–1.0) over the YERB, which suggested that atmospheric aerosols were primarily concentrated in the bottom layer.
- (d)
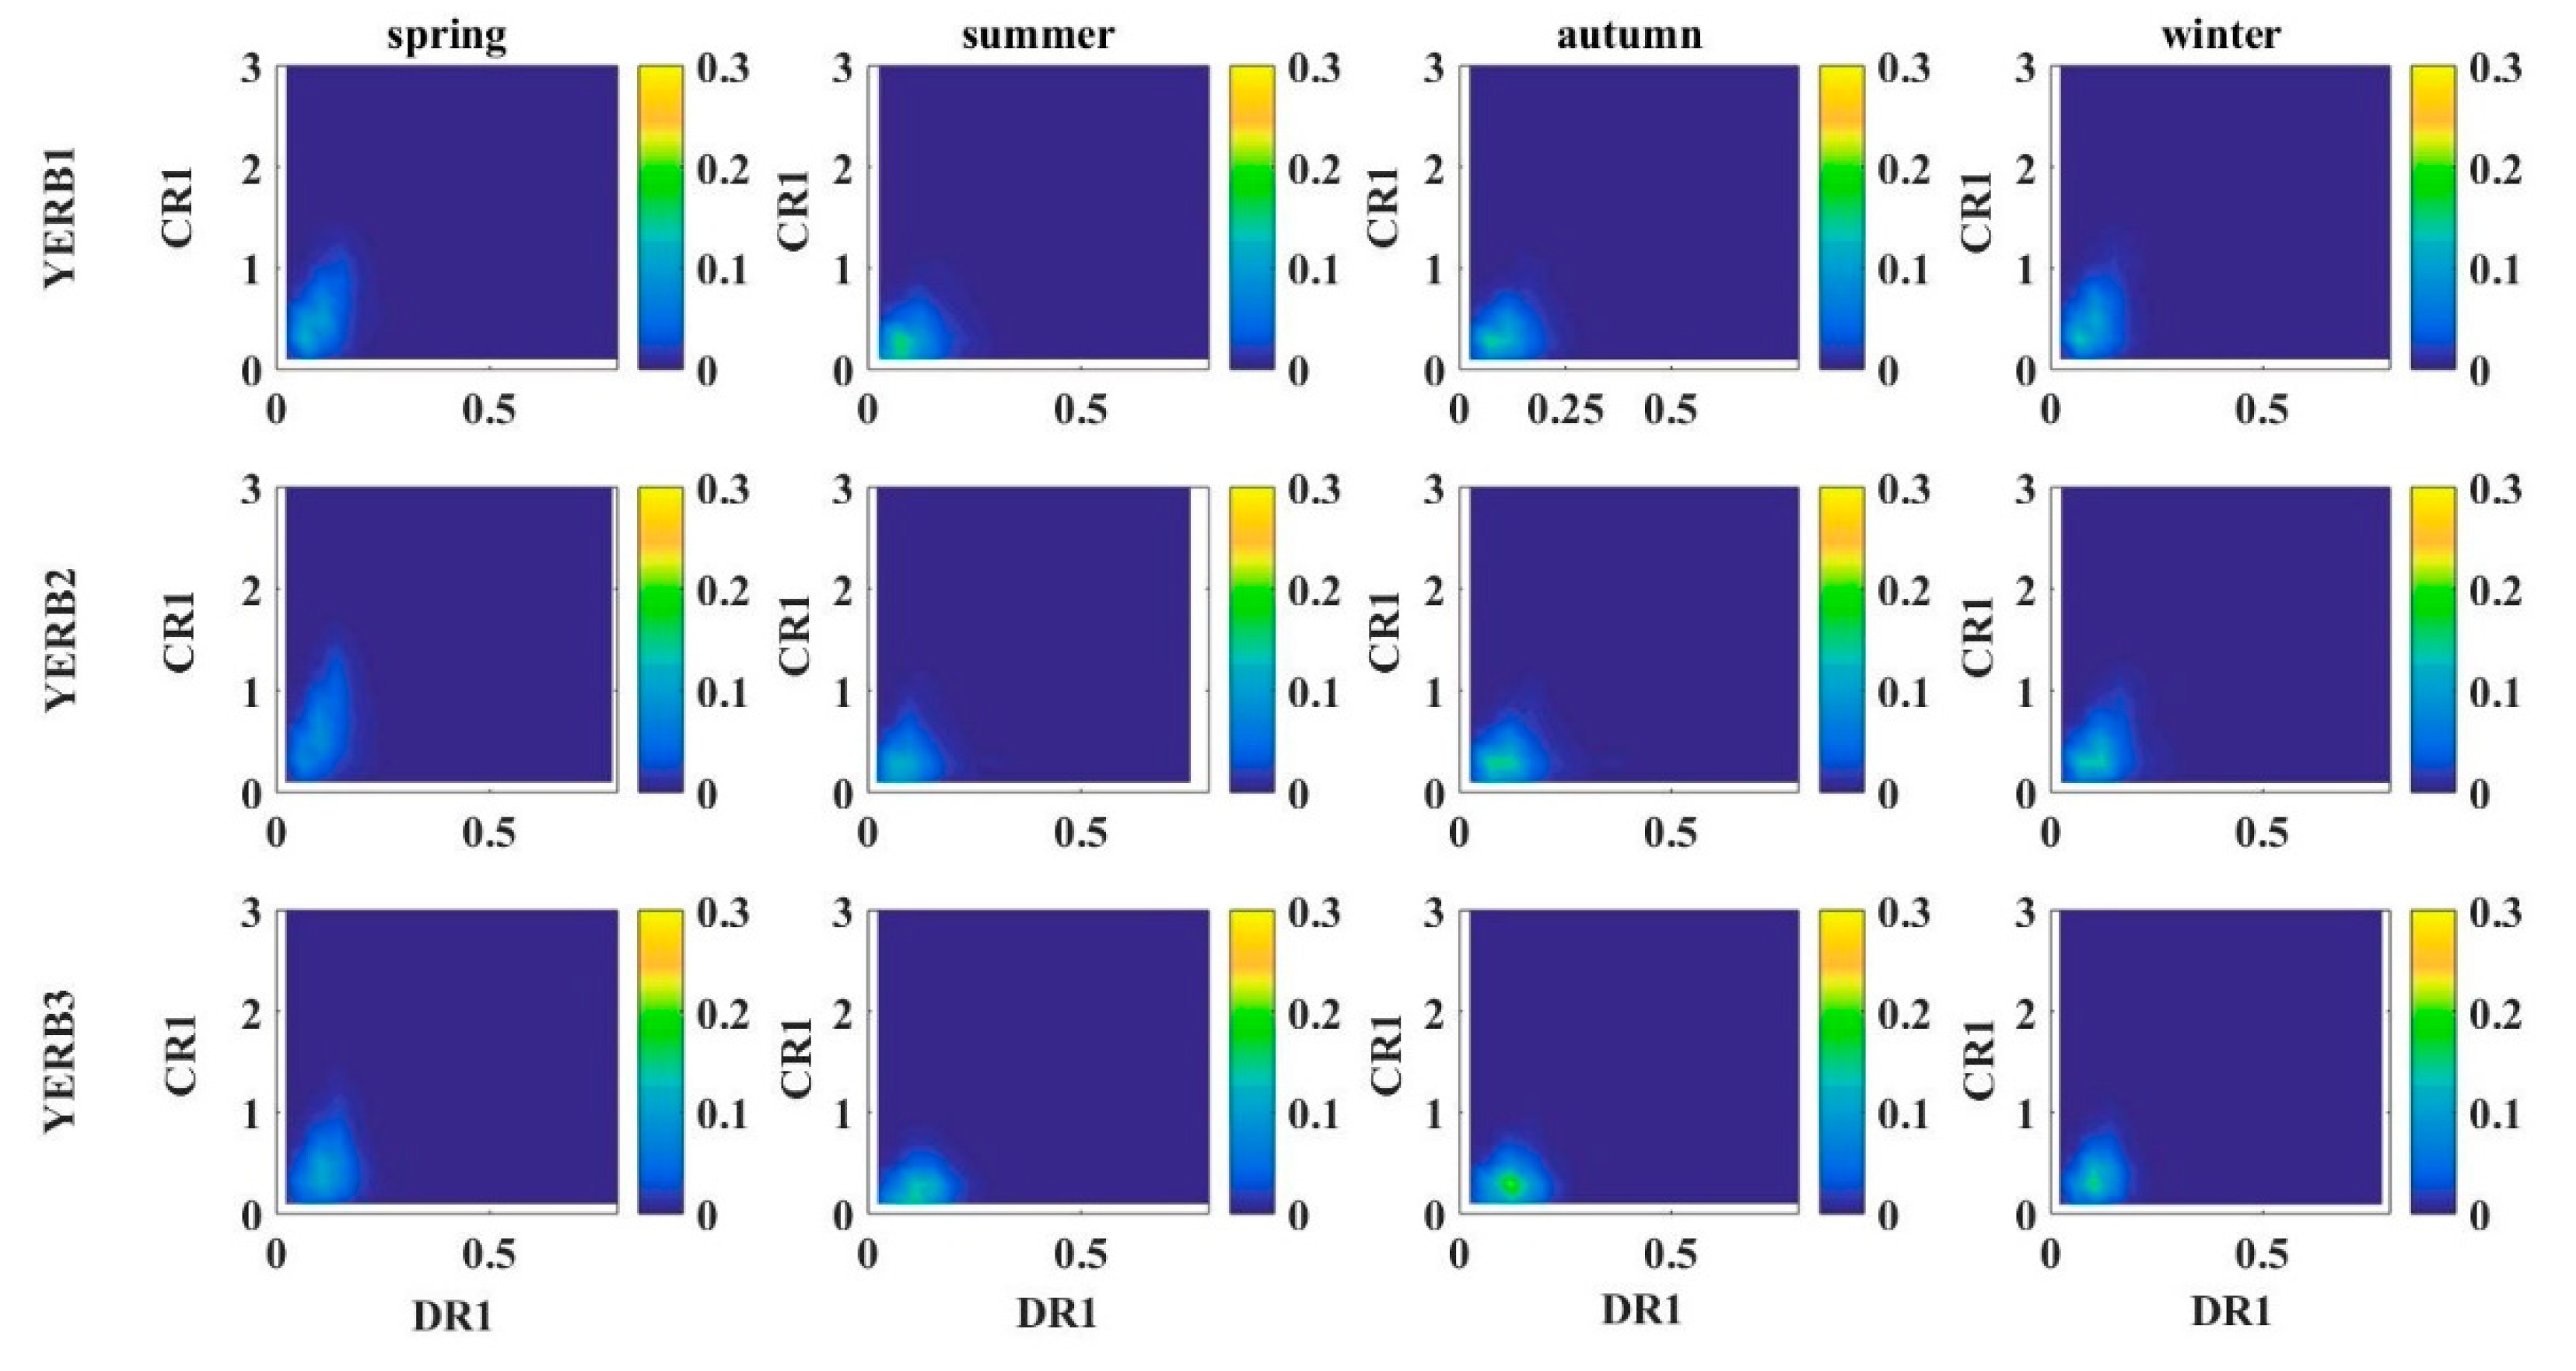
- The values of DR1 (0.15–0.2) and CR1 (~1) were large over the YERB in spring because of dust aerosols.
- (e)
- A positive correlation between AOD1 and TL1 and A and HTH was observed over the whole YERB, whereas N and PAOD1 showed a significant log-negative correlation.
Author Contributions
Funding
Acknowledgments
Conflicts of Interest
Abbreviations
| Lon | longitude |
| Lat | latitude |
| AODN | The AOD of the nth aerosol layer; N = 1, 2, …, 7, 8 |
| AODS | The sum of AODs from all aerosol layers |
| HTN | The height of the nth aerosol layer top; N = 1, 2, …, 7, 8 |
| HBN | The height of the nth aerosol layer base; N = 1, 2, …, 7, 8 |
| HTH | The height of the highest aerosol layer top |
| TLN | The thickness of the nth aerosol layer; N = 1, 2, …, 7, 8 |
| N | The amounts of all aerosol layers |
| PAODN | The AOD proportion of the nth aerosol layer; N = 1, 2, …, 7, 8 |
| DRN | The integrated volume depolarization ratio of the nth aerosol layer; N = 1, 2, …, 7, 8 |
| CRN | The integrated attenuated total color ratio of the nth aerosol layer; N = 1, 2, …, 7, 8 |
References
- Hinds, W.C. Aerosol Technology; Wiley & Sons: Hoboken, NJ, USA, 2000; Volume 31, p. 175. [Google Scholar]
- Kulmala, M.; Kontkanen, J.; Junninen, H.; Lehtipalo, K.; Manninen, H.E.; Nieminen, T.; Petäjä, T.; Sipilä, M.; Schobesberger, S.; Rantala, P.; et al. Direct Observations of Atmospheric Aerosol Nucleation. Science 2013, 339, 943–946. [Google Scholar] [CrossRef]
- Mcmurry, P.H. A review of atmospheric aerosol measurements. Atmos. Environ. 2000, 34, 1959–1999. [Google Scholar] [CrossRef]
- Qin, Y.; Oduyemi, K. Atmospheric aerosol source identification and estimates of source contributions to air pollution in Dundee, UK. Atmos. Environ. 2003, 37, 1799–1809. [Google Scholar] [CrossRef]
- Rogge, W.F.; Hildemann, L.M.; Mazurek, M.A.; Cass, G.R.; Simoneit, B.R.T. Sources of fine organic aerosol. 5. Natural gas home appliances. Environ. Sci. Technol. 1993, 27, 2736–2744. [Google Scholar] [CrossRef]
- Wolfgang, F.; Rogge, L.M.H.; Mazurek, A.M.; Cass, G.R.; Simoneit, B.R.T. Sources of fine organic aerosol. 7. Hot asphalt roofing tar pot fumes. Environ. Sci. Technol. 1997, 31, 2726–2730. [Google Scholar]
- Han, G.; Xu, H.; Gong, W.; Liu, J.; Du, J.; Ma, X.; Liang, A. Feasibility Study on Measuring Atmospheric CO2 in Urban Areas Using Spaceborne CO2-IPDA LIDAR. Remote Sens. 2018, 10, 985. [Google Scholar] [CrossRef]
- Ge, H.; Xin, M.; Ailin, L.; Tianhao, Z.; Yannan, Z.; Miao, Z.; Wei, G. Performance evaluation for china’s planned co2-ipda. Remote Sens. 2017, 9, 768. [Google Scholar]
- Zhang, M.; Ma, Y.; Gong, W.; Zhu, Z. Aerosol Optical Properties of a Haze Episode in Wuhan Based on Ground-Based and Satellite Observations. Atmosphere 2014, 5, 699–719. [Google Scholar] [CrossRef] [Green Version]
- Gong, W.; Zhang, M.; Han, G.; Ma, X.; Zhu, Z. An Investigation of Aerosol Scattering and Absorption Properties in Wuhan, Central China. Atmosphere 2015, 6, 503–520. [Google Scholar] [CrossRef] [Green Version]
- Kaiser, J.; Granmar, M. Mounting evidence indicts fine-particle pollution. Science 2005, 307, 1858–1861. [Google Scholar] [CrossRef]
- Magistrale, P.V. Health Aspects of Air Pollution; Springer: Berlin/Heidelberg, Germany, 1992; pp. 25–31. [Google Scholar]
- Tie, X.; Wu, D.; Brasseur, G. Lung cancer mortality and exposure to atmospheric aerosol particles inguangzhou, china. Atmos. Environ. 2009, 43, 2375–2377. [Google Scholar] [CrossRef]
- Edenhofer, O.; Seyboth, K. Intergovernmental Panel on Climate Change (IPCC). Encycl. Energy Nat. Resour. Environ. Econ. 2013, 26, 48–56. [Google Scholar]
- Edenhofer, O. Climate Change 2014: Mitigation of Climate Change: Working Group iii Contribution to the Fifth Assessment Report of the Intergovernmental Panel on Climate Change; Cambridge University Press: Cambridge, UK, 2014. [Google Scholar]
- Rosenfeld, D. Suppression of Rain and Snow by Urban and Industrial Air Pollution. Science 2000, 287, 1793–1796. [Google Scholar] [CrossRef] [PubMed]
- Twomey, S. The Influence of Pollution on the Shortwave Albedo of Clouds. J. Atmos. Sci. 1977, 34, 1149–1152. [Google Scholar] [CrossRef] [Green Version]
- Parrish, D.D.; Tong, Z. Climate change. Clean air for megacities. Science 2009, 326, 674–675. [Google Scholar] [CrossRef]
- Shen, X.L.; Dang, T.G.; Liu, J. Summary of Beijing-Tianjin-Hebei Haze Causes and Solutions Research. Adv. Mater. Res. 2014, 1010, 639–644. [Google Scholar] [CrossRef]
- Gao, Y.; Zhang, M.; Liu, Z.; Wang, L.; Wang, P.; Xia, X.; Tao, M.; Zhu, L. Modeling the feedback between aerosol and meteorological variables in the atmospheric boundary layer during a severe fog–haze event over the North China Plain. Atmos. Chem. Phys. Discuss. 2015, 15, 4279–4295. [Google Scholar] [CrossRef]
- Dui, W.U.; Liao, B.; Chen, H.; Cheng, W.U. Advances in studies of haze weather over pearl river delta. Clim. Environ. Res. 2014, 19, 248–264. (In Chinese) [Google Scholar]
- Liu, Y. Accessing the Impact of Sea-Salt Emissions on Aerosol Chemical Formation and Deposition over Pearl River Delta, China. Aerosol Air Qual. Res. 2015, 15, 329–340. [Google Scholar] [CrossRef]
- Shen, X.; Sun, J.; Zhang, X.; Zhang, Y.; Zhang, L.; Che, H.; Ma, Q.; Yu, X.; Yue, Y.; Zhang, Y. Characterization of submicron aerosols and effect on visibility during a severe haze-fog episode in Yangtze River Delta, China. Atmos. Environ. 2015, 120, 307–316. [Google Scholar] [CrossRef] [Green Version]
- Bilal, M.; Nichol, J.E. Evaluation of MODIS aerosol retrieval algorithms over the Beijing-Tianjin-Hebei region during low to very high pollution events. J. Geophys. Res. Atmos. 2015, 120, 7941–7957. [Google Scholar] [CrossRef]
- Holben, B.; Eck, T.; Slutsker, I.; Tanre, D.; Buis, J.; Setzer, A.; Vermote, E.; Reagan, J.; Kaufman, Y.; Nakajima, T.; et al. AERONET—A Federated Instrument Network and Data Archive for Aerosol Characterization. Remote Sens. Environ. 1998, 66, 1–16. [Google Scholar] [CrossRef]
- Dubovik, O.; Smirnov, A.; Holben, B.N.; King, M.D.; Kaufman, Y.J.; Eck, T.F.; Slutsker, I. Accuracy assessments of aerosol optical properties retrieved from Aerosol Robotic Network (AERONET) Sun and sky radiance measurements. J. Geophys. Res. Space Phys. 2000, 105, 9791–9806. [Google Scholar] [CrossRef] [Green Version]
- Holben, B.N.; Eck, T.F.; Slutsker, I.; Chatenet, B.; Smirnov, A.; Pinker, R.T. Diurnal variability of aerosol optical depth observed at AERONET (Aerosol Robotic Network) sites. Geophys. Res. Lett. 2002, 29, 1–30. [Google Scholar]
- Omar, A.H.; Won, J.; Winker, D.M.; Yoon, S.; Dubovik, O.; McCormick, M.P. Development of global aerosol models using cluster analysis of Aerosol Robotic Network (AERONET) measurements. J. Geophys. Res. Space Phys. 2005, 110, 10–14. [Google Scholar] [CrossRef]
- Gong, W.; Zhu, Z.; Li, P.; Qin, Q. Mobile aerosol lidar for earth observation atmospheric correction. In Proceedings of the IEEE International Conference on Geoscience and Remote Sensing Symposium, Denver, CO, USA, 31 July–4 August 2006; pp. 1126–1129. [Google Scholar]
- Han, D.W.; Liu, W.Q.; Zhang, Y.J.; Lu, Y.H.; Liu, J.G.; Yu, T. An atmospheric aerosol lidar and its experiment in beijing. In Proceedings of the Semiconductor Lasers and Applications III, Beijing, China, 12–13 November 2007. [Google Scholar]
- Hamilton, P. Lidar measurement of backscatter and attenuation of atmospheric aerosol. Atmos. Environ. 1969, 3, 221–223. [Google Scholar] [CrossRef]
- Karasiński, G.; Kardaś, A.E.; Markowicz, K.; Malinowski, S.P.; Stacewicz, T.; Stelmaszczyk, K.; Chudzyński, S.; Skubiszak, W.; Posyniak, M.; Jagodnicka, A.K.; et al. LIDAR investigation of properties of atmospheric aerosol. Eur. Phys. J. Spéc. Top. 2007, 144, 129–138. [Google Scholar] [CrossRef]
- Devara, P.; Raj, P.E.; Sharma, S. Remote sensing of atmospheric aerosol in the nocturnal boundary layer using lidar. Environ. Pollut. 1994, 85, 97–102. [Google Scholar] [CrossRef]
- Ansmann, A.; Müller, D. Lidar and Atmospheric Aerosol Particles. Lidar 2006, 102, 105–141. [Google Scholar]
- Cohen, A.; Kleiman, M. On the Measurement of Atmospheric Aerosol Concentration by a Lidar. J. Appl. Meteorol. 1978, 17, 234–235. [Google Scholar] [CrossRef] [Green Version]
- Winker, D.M.; Pelon, J.R.; Mccormick, M.P. The calipso mission: Spaceborne lidar for observation of aerosols and clouds. Bull. Am. Meteorol. Soc. 2010, 91, 1211–1229. [Google Scholar] [CrossRef]
- Winker, D.M.; Hunt, W.H.; McGill, M.J. Initial performance assessment of CALIOP. Geophys. Res. Lett. 2007, 34, 228–262. [Google Scholar] [CrossRef]
- Che, H.; Zhang, X.-Y.; Xia, X.; Goloub, P.; Holben, B.; Zhao, H.; Wang, Y.; Zhang, X.-C.; Wang, H.; Blarel, L.; et al. Ground-based aerosol climatology of China: Aerosol optical depths from the China Aerosol Remote Sensing Network (CARSNET) 2002–2013. Atmos. Chem. Phys. Discuss. 2015, 15, 7619–7652. [Google Scholar] [CrossRef]
- Che, H.; Zhang, X.; Chen, H.; Damiri, B.; Goloub, P.; Li, Z.; Zhang, X.; Wei, Y.; Zhou, H.; Dong, F.; et al. Instrument calibration and aerosol optical depth validation of the China Aerosol Remote Sensing Network. J. Geophys. Res. Space Phys. 2009, 114, 03206. [Google Scholar] [CrossRef]
- Wang, H.; Yang, Z.; Saito, Y.; Liu, J.P.; Sun, X.; Wang, Y. Stepwise decreases of the Huanghe (Yellow River) sediment load (1950–2005): Impacts of climate change and human activities. Glob. Planet. Chang. 2007, 57, 331–354. [Google Scholar] [CrossRef]
- Shen, X.; Sun, J.; Zhang, Y.; Weijun, L.I.; Chi, J.; Zhang, L.; Fan, R. The characteristics of atmospheric aerosol particle number size distribution in arctic yellow river station influenced by long-range transport of autumn air mass. J. Glaciol. Geocryol. 2016. [Google Scholar] [CrossRef]
- Winker, D.M.; Pelon, J. The Calipso Mission. In Proceedings of the 2003 IEEE International Geoscience and Remote Sensing Symposium (IGARSS ’03), Toulouse, France, 21–25 July 2004; Volume 1322, pp. 1329–1331. [Google Scholar]
- Winker, D.M.; Pelon, J.R.; McCormick, M.P. The CALIPSO mission: Spaceborne lidar for observation of aerosols and clouds. In Proceedings of the Third International Asia-Pacific Environmental Remote Sensing Remote Sensing of the Atmosphere, Ocean, Environment, and Space, Hangzhou, China, 23–27 OCtober 2003; pp. 1–11. [Google Scholar]
- Winker, D.M.; Vaughan, M.A.; Omar, A.; Hu, Y.; Powell, K.A.; Liu, Z.; Hunt, W.H.; Young, S.A. Overview of the CALIPSO Mission and CALIOP Data Processing Algorithms. J. Atmos. Ocean. Technol. 2009, 26, 2310–2323. [Google Scholar] [CrossRef]
- Winker, D.M.; Tackett, J.L.; Getzewich, B.J.; Liu, Z.; Vaughan, M.A.; Rogers, R.R. The global 3-D distribution of tropospheric aerosols as characterized by CALIOP. Atmos. Chem. Phys. Discuss. 2013, 13, 3345–3361. [Google Scholar] [CrossRef] [Green Version]
- Lolli, S.; D’Adderio, L.P.; Campbell, J.R.; Sicard, M.; Welton, E.J.; Binci, A.; Rea, A.; Tokay, A.; Comerón, A.; Barragan, R.; et al. Vertically Resolved Precipitation Intensity Retrieved through a Synergy between the Ground-Based NASA MPLNET Lidar Network Measurements, Surface Disdrometer Datasets and an Analytical Model Solution. Remote Sens. 2018, 10, 1102. [Google Scholar] [CrossRef]
- Che, H.; Xia, X.; Zhu, J.; Li, Z.; Dubovik, O.; Holben, B.; Goloub, P.; Chen, H.; Estelles, V.; Cuevas-Agulló, E.; et al. Column aerosol optical properties and aerosol radiative forcing during a serious haze-fog month over North China Plain in 2013 based on ground-based sunphotometer measurements. Atmos. Chem. Phys. Discuss. 2014, 14, 2125–2138. [Google Scholar] [CrossRef] [Green Version]
- Wang, L.; Liu, Z.; Sun, Y.; Ji, D.; Wang, Y. Long-range transport and regional sources of PM2.5 in Beijing based on long-term observations from 2005 to 2010. Atmos. Res. 2015, 157, 37–48. [Google Scholar] [CrossRef]
- Tang, G.; Zhu, X.; Hu, B.; Xin, J.; Wang, L.; Münkel, C.; Mao, G.; Wang, Y. Impact of emission controls on air quality in Beijing during APEC 2014: Lidar ceilometer observations. Atmos. Chem. Phys. Discuss. 2015, 15, 12667–12680. [Google Scholar] [CrossRef]
- Fan, X.; Xia, X.A.; Chen, H. Comparison of column-integrated aerosol optical and physical properties in an urban and suburban site on the north china plain. Adv. Atmos. Sci. 2015, 32, 477–486. [Google Scholar] [CrossRef]
- Liu, B.; Cong, Z.; Wang, Y.; Xin, J.; Wan, X.; Pan, Y.; Liu, Z.; Wang, Y.; Zhang, G.; Wang, Z.; et al. Background aerosol over the Himalayas and Tibetan Plateau: Observed characteristics of aerosol mass loading. Atmos. Chem. Phys. Discuss. 2017, 17, 449–463. [Google Scholar] [CrossRef]
- Li, C.; Bosch, C.; Kang, S.; Andersson, A.; Chen, P.; Zhang, Q.; Cong, Z.; Chen, B.; Qin, D.; Gustafsson, Ö. Sources of black carbon to the Himalayan–Tibetan Plateau glaciers. Nat. Commun. 2016, 7, 12574. [Google Scholar] [CrossRef]
- Xu, C.; Ma, Y.M.; You, C.; Zhu, Z.K. The regional distribution characteristics of aerosol optical depth over the Tibetan Plateau. Atmos. Chem. Phys. Discuss. 2015, 15, 12065–12078. [Google Scholar] [CrossRef] [Green Version]
- Zhang, M.; Wang, L.; Bilal, M.; Gong, W.; Zhang, Z.; Guo, G. The Characteristics of the Aerosol Optical Depth within the Lowest Aerosol Layer over the Tibetan Plateau from 2007 to 2014. Remote Sens. 2018, 10, 696. [Google Scholar] [CrossRef]
- Liu, Y.; Huang, J.; Shi, G.; Takamura, T.; Khatri, P.; Bi, J.; Shi, J.; Wang, T.; Wang, X.; Zhang, B. Aerosol optical properties determined from sky-radiometer over Loess Plateau of Northwest China. Atmos. Chem. Phys. Discuss. 2011, 11, 23883–23910. [Google Scholar] [CrossRef]
- Bi, J.; Huang, J.; Fu, Q.; Wang, X.; Shi, J.; Zhang, W.; Huang, Z.; Zhang, B. Toward characterization of the aerosol optical properties over Loess Plateau of Northwestern China. J. Quant. Spectrosc. Radiat. Transf. 2011, 112, 346–360. [Google Scholar] [CrossRef]
- Huang, J.; Zhang, W.; Zuo, J.; Jianrong, B.I.; Shi, J.; Wang, X.; Chang, Z.; Huang, Z.; Yang, S.; Zhang, S. An overview of the semi-arid climate and environment research observatory over the loess plateau. Adv. Atmos. Sci. 2008, 25, 906. [Google Scholar] [CrossRef]
- Wu, Z.; Ma, N.; Gros, J.; Kecorius, S.; Lu, K.; Shang, D.; Wang, Y.; Wu, Y.; Zeng, L.; Hu, M.; et al. Thermodynamic properties of nanoparticles during new particle formation events in the atmosphere of North China Plain. Atmos. Res. 2017, 188, 55–63. [Google Scholar] [CrossRef]
- Zhang, S.; Ma, N.; Kecorius, S.; Wang, P.; Hu, M.; Wang, Z.; Gros, J.; Wu, Z.; Wiedensohler, A. Mixing state of atmospheric particles over the North China Plain. Atmos. Environ. 2016, 125, 152–164. [Google Scholar] [CrossRef]
- Liu, Z.-Y.; Chen, J.-B.; Jin, L.; Zhang, Y.-J.; Lei, C. Roadbed temperature study based on earth-atmosphere coupled system in permafrost regions of the Qinghai-Tibet Plateau. Cold Reg. Sci. Technol. 2013, 86, 167–176. [Google Scholar] [CrossRef]
- Tian, P.; Cao, X.; Zhang, L.; Wang, H.; Shi, J.; Huang, Z.; Zhou, T.; Liu, H. Observation and simulation study of atmospheric aerosol nonsphericity over the Loess Plateau in northwest China. Atmos. Environ. 2015, 117, 212–219. [Google Scholar] [CrossRef]
- Wang, L.; Xin, J.; Li, X.; Wang, Y. The variability of biomass burning and its influence on regional aerosol properties during the wheat harvest season in North China. Atmos. Res. 2015, 157, 153–163. [Google Scholar] [CrossRef]
- Yao, H.; Song, Y.; Liu, M.; Archer-Nicholls, S.; Lowe, D.; McFiggans, G.; Xu, T.; Du, P.; Li, J.; Wu, Y.; et al. Direct radiative effect of carbonaceous aerosols from crop residue burning during the summer harvest season in East China. Atmos. Chem. Phys. Discuss. 2017, 17, 5205–5219. [Google Scholar] [CrossRef] [Green Version]
- Tao, M.; Wang, Z.; Tao, J.; Chen, L.; Wang, J.; Hou, C.; Wang, L.; Xu, X.; Zhu, H. How Do Aerosol Properties Affect the Temporal Variation of MODIS AOD Bias in Eastern China? Remote Sens. 2017, 9, 800. [Google Scholar] [CrossRef]
- Biswas, J.; Pathak, B.; Patadia, F.; Bhuyan, P.K.; Gogoi, M.M.; Babu, S.S. Satellite-retrieved direct radiative forcing of aerosols over North-East India and adjoining areas: Climatology and impact assessment. Int. J. Clim. 2017, 37, 4756. [Google Scholar] [CrossRef]
- Garai, A.; Kleissl, J. Air and Surface Temperature Coupling in the Convective Atmospheric Boundary Layer. J. Atmos. Sci. 2011, 68, 2945–2954. [Google Scholar] [CrossRef]
© 2019 by the authors. Licensee MDPI, Basel, Switzerland. This article is an open access article distributed under the terms and conditions of the Creative Commons Attribution (CC BY) license (http://creativecommons.org/licenses/by/4.0/).
Share and Cite
Zhang, M.; Liu, J.; Bilal, M.; Zhang, C.; Zhao, F.; Xie, X.; Khedher, K.M. Optical and Physical Characteristics of the Lowest Aerosol Layers over the Yellow River Basin. Atmosphere 2019, 10, 638. https://doi.org/10.3390/atmos10100638
Zhang M, Liu J, Bilal M, Zhang C, Zhao F, Xie X, Khedher KM. Optical and Physical Characteristics of the Lowest Aerosol Layers over the Yellow River Basin. Atmosphere. 2019; 10(10):638. https://doi.org/10.3390/atmos10100638
Chicago/Turabian StyleZhang, Miao, Jing Liu, Muhammad Bilal, Chun Zhang, Feifei Zhao, Xiaoyan Xie, and Khaled Mohamed Khedher. 2019. "Optical and Physical Characteristics of the Lowest Aerosol Layers over the Yellow River Basin" Atmosphere 10, no. 10: 638. https://doi.org/10.3390/atmos10100638
APA StyleZhang, M., Liu, J., Bilal, M., Zhang, C., Zhao, F., Xie, X., & Khedher, K. M. (2019). Optical and Physical Characteristics of the Lowest Aerosol Layers over the Yellow River Basin. Atmosphere, 10(10), 638. https://doi.org/10.3390/atmos10100638