Article

Inter-Annual Variability of Boreal Summer Intra-Seasonal Oscillation Propagation from the Indian Ocean to the Western Pacific

1
Earth System Modeling Center and Climate Dynamics Research Center, Nanjing University of Information Science and Technology, Nanjing 210044, China
2
School of Atmospheric Sciences, Sun Yat-sen University, Guangzhou 510275, China
*
Author to whom correspondence should be addressed.
Atmosphere 2019, 10(10), 596; https://doi.org/10.3390/atmos10100596
Submission received: 27 August 2019 / Revised: 23 September 2019 / Accepted: 25 September 2019 / Published: 2 October 2019
(This article belongs to the Section Meteorology)

Abstract

:
The inter-annual variability of boreal summer intra-seasonal oscillation (BSISO) propagation from the Indian Ocean (IO) to the western Pacific (WP) is investigated for the boreal summers (May to September) of 1979–2018. It is shown that the interannual variability of BSISO mainly happens in its evolution, not in its strength over the IO. Here, we classify four distinctive modes for inter-annual variability of BSISO propagation: (i) northeast mode, propagating from the IO to the western equatorial Pacific (WEP) and the western North Pacific (WNP); (ii) north-only mode, only propagating to the WNP; (iii) east-only mode, only propagating to the WEP; and (iv) stationary mode, propagating to neither the WEP nor the WNP. It is found that the Maritime Continent (MC) and WEP are two key regions determining these four modes concerning mean state moisture and vertical motion. Associated with central equatorial Pacific cooling, the BSISO of northeast and north-only modes can reach the WP by passing over the MC due to positive mean moisture anomalies and upward mean motion anomalies over the MC. The strong negative mean moisture anomalies and downward mean motion anomalies over the WEP, related to strong central Pacific cooling, prevents the development of BSISO there, resulting in north-only mode. For the east-only and stationary modes associated with the central Pacific warming, their BSISO can hardly pass the MC due to negative mean moisture anomalies and downward mean motion anomalies. The positive mean moisture anomalies and upward mean motion anomalies over the WEP related to strong central Pacific warming, however, will reinitiate the BSISO in the WEP for the east-only mode.

1. Introduction

Whether the boreal summer intra-seasonal oscillation (BSISO) originating from the Indian Ocean (IO) can propagate to the western Pacific (WP) in a certain year is important for improving sub-seasonal predictability of the East Asian summer monsoon system. To address this, we should know the inter-annual variability of the BSISO propagation from the IO to the WP. Tropical intra-seasonal oscillation (ISO) undergoes a strong seasonal cycle [1,2,3]. During the boreal winter, its pronounced characteristic is eastward propagation from the equatorial IO to the WP, with its main convection located to the south of the equator. During the boreal summer, the propagation of the BSISO becomes more complex, and the fundamental propagation is prominently northward, coexisting with the eastward propagation along the equator in the IO [4,5,6] and northwestward propagation in the WP [7,8,9,10]. An independent northward mode, which is not associated with eastward equatorial propagation, was found in the boreal summer from May to October [11]. However, this type of ISO, characterized by isolated northward propagation, occurs rarely [12]. The propagation of the BSISO originating from the equatorial IO was further classified into three types—northward and eastward (NE), northward only (N-only), and eastward only (E-only) [13]. The findings regarding these propagations of the BSISO enrich our understanding and improve sub-seasonal climate predictability. The understanding of inter-annual variability of the BSISO propagation, however, remains obscured, and calls for urgent investigation to understand the inter-annual variability of boreal summer sub-seasonal predictability.
Current studies considering the interannual variability of the BSISO mainly focus on the intensity. Although the overall boreal winter ISO intensity, based on different indices, was found to have a very weak linkage with the El Niño Southern Oscillation (ENSO) [14,15,16], the BSISO over the WP in May–July was found to be intensified via the easterly vertical shear during years when El Niño developed [17,18]. The inter-annual variation of the BSISO over the Asian summer monsoon region was further found to exhibit two modes. The first mode, characterized by strengthening or weakening uniformly over the Asian summer monsoon region, is related to sea surface temperature (SST) anomaly difference between the central-eastern North Pacific and the IO; and the second mode, characterized by a see-saw pattern between the IO and the WP, is linked to ENSO events [19]. A strong BSISO was also found over the WP due to El Niño-like SST anomalies in the tropical Pacific, anomalous easterly vertical shear, and enhanced background moisture in the WP [20]. Wu and Cao (2016) [21] found a pronounced different relationship to the ENSO; the 10–20-day and 30–60-day western North Pacific (WNP) BSISO intensity enhanced during El Niño developing summer and La Niña decaying summer, respectively. In models, the leading empirical orthogonal function (EOF) modes of BSISO intensity are closely linked to the models’ ENSO, which resembles the observed relationship [22].
Few works have discussed inter-annual variability of BSISO propagation and periodicity. The inter-annual variation of northwestward propagation of the BSISO in the WNP was found to be affected by the ENSO through changing the mean circulation, while the northward propagation over the Indian summer monsoon region is insensitive to the ENSO [18]. The boreal summer WNP precipitation was found to have a short period (20–40 days) during a warm summer when its Niño3.4 index is positive, and a long period (40–70 days) during a cool summer. The former is associated with the northwestward propagation of the BSISO over the WNP, while the latter is related to the northeastward propagation from the IO to the WNP [9].
The Maritime Continent (MC), located along the way of ISO eastward propagation from the IO to the WP, is a key region affecting ISO propagation. The MC works as a barrier to block the boreal winter ISO [23], mainly through limiting overall latent heat flux [24,25] and moist statistic energy (MSE) generation ahead of the main convection envelope [26,27] or through a rigorous diurnal cycle associated with land–sea or mountain–valley breezes and cloudiness [28]. The unique geographical characteristics of the MC—more and taller islands are located in the south than in the north—lead to more ISO weakening events during the boreal winter when they cross the MC mainly on the south side of the equator [29]. In addition to the south–north difference, different areas over the MC in the east–west direction are controlled by different physical processes for Madden-Julian oscillation (MJO) [30]. Besides, the mountainous islands over the MC are beneficial for the stronger eastward-propagating MJO by enhancing mean states including the westerly wind and moisture over the MC [31]. The Kelvin-wave responses and positive SST anomalies over the MC and WP were further found to be important for the eastward propagation of the BSISO over the MC, through moistening of the troposphere ahead of the convection [32]. The eastward propagation of the year-round MJO events from the IO to the WP is strongly linked to the strength of the dry anomaly over the eastern MC and WP; and the stronger the MJO is, the more inclined it is to propagate eastward [33].
Until now, the inter-annual variability of BSISO propagation from the IO to the WP remains unclear. We will investigate this variability by specifying four propagation types and present their underlying mechanisms. This paper is organized as follows. In Section 2, we will give a brief description of the data and methods used. In Section 3, the spatial structures and temporal evolution characteristics of the four selected modes will be illustrated. The background dynamic and thermodynamic conditions are analyzed in Section 4. A summary is given in Section 5.

2. Data and Methods

2.1. Data

In this work, we use the National Oceanic and Atmospheric Administration (NOAA) daily outgoing longwave radiation (OLR) as a proxy for deep convection in the tropics [34]. OLR is widely used to represent the evolution of the BSISO [35]. The daily wind at 850 hPa, temperature, specific humidity, and geopotential height, as well as monthly mean specific humidity and vertical velocity, are obtained from the Japanese 55-Year Reanalysis project organized by the Japan Meteorological Agency [36]. Monthly mean SST is from the Extended Reconstructed SST version 5 (ERSST.v5) [37]. All data are interpolated onto a 2.5° × 2.5° grid using bilinear interpolation, and the period of 1979–2018 has been chosen as the study period. Here, the boreal summer is referred to as May–September. The intra-seasonal signal is obtained by 30–90-day bandpass filtering using a 121-point Lanczos filter [38].

2.2. Classification of BSISO Propagation from IO to WP

Figure 1a shows the BSISO intensity, denoted by the standard deviation of 30–90-day filtered OLR anomalies from May to September in the 40-year period examined in this study. During the boreal summer, strong intra-seasonal variability is found over the IO from the equatorial IO (EIO) to the Arabian Sea and Bay of Bengal, and the WNP, covering the South China Sea and Phillippe Sea. Strong intra-seasonal variability is also found over the western equatorial Pacific (WEP).
Figure 1b–g shows the BSISO evolution. From day 0 to day 10, the BSISO over the IO has a northeastward propagation, with the northward-propagating part reaching the Indian subcontinent and the Bay of Bengal and the eastward-propagating part spreading through the MC to the WEP. From day 15 to day 25, the ISO over the MC continues to move northward to the WNP, and the ISO over the WEP also propagates northwestward to the WNP. After originating from the EIO (65°–95° E, 5° S–5° N), the BSISO has two centers, i.e., the WEP (140°–170° E, 5° S–5° N) and WNP (105°–135° E, 10° S–20° N), over the WP; thus, these three key regions are selected to further define different types of BSISO propagation.
Following this evolution of regressed BSISO (Figure 1), two criteria in the lead–lag regression map of OLR anomalies onto EIO ISO or 30–90-day filtered OLR anomalies of each year are used to determine whether the ISO originating from the EIO may impact the WP:
  • A 5–30-day lagged window after the peak of EIO ISO is used to define whether the ISO signal over the WEP and WNP originates from the EIO. The 5–30-day lagged window is selected based on the evolution of regressed BSISO for all years over the WP from day 5 to day 30 (Figure 1).
  • The ratio of WEP/WNP ISO strength during this 5–30 window to EIO strength is used to detect whether the ISO originating from the EIO may propagate to the WEP or WNP for a particular year. The ratio is used to eliminate the effect of BSISO strength at origin and isolate the role of mean state.
The WEP/WNP ISO strength is defined by the minima of boreal summer regressed OLR anomalies averaged over these two regions onto EIO OLR during this 5–30-day lagged window. The 40-year averaged ratio of WEP to EIO ISO strength is 0.42, and that of WNP to EIO is 0.36. The ISO originated from the EIO is seen to be able to affect the WEP or WNP when the associated ratio is above the averaged ratio and remains in the IO when these two ratios are below the averaged ratio.
Based on these criteria, the BSISO evolution patterns can be separated into four modes, including BSISO originating from the EIO reaching both WEP and WNP regions (northeast mode), only reaching the WEP region (east-only mode), only reaching the WNP region (north-only mode), and only staying in the IO (stationary mode). Of the 40 years studied, there are eleven northeast mode years, eight north-only mode years, seven east-only mode years, and fourteen stationary mode years (Table 1). Since we focus on inter-annual variability, we only have one mode represented by the summer averaged BSISO evolution for each year.
MSE is often used to represent the evolution of BSISO [39,40], which is defined as m =   c p T + g z + L q , where T is temperature, c p is the specific heat at constant pressure, z is height, g is the gravitational acceleration, L is the latent heat of vaporization at 0 °C, and q is specific humidity.

3. Four BSISO Propagation Modes

The regressed ISO evolutions over the EIO, WEP, and WNP averaged in Table 1 and their associated years are shown in Figure 2 for the four BSISO propagation modes. For the northeast mode (Figure 2a), the regressed OLR anomaly over the WEP (blue line) reaches its minimum at day 15, while that over the WNP reaches its minimum at day 25 (red line). These two minima also appear during north-only mode years, although the OLR anomaly over the WEP is very weak (Figure 2b). During the east-only mode years, the OLR anomaly over the WEP reaches its minimum near day 18, and the negative peak over the WNP is outside of the 5–30-day lagged window (Figure 2c). During the stationary mode years, the regressed OLR anomalies are very weak over both WEP and WNP, but that over the MC (5° S–5° N, 100°–130° E) is stronger by about 1.0 W m−2 than those over both WEP and WNP (Figure 2d). The OLR variation of each mode over the EIO shows almost the same amplitude and phase change, which means that the inter-annual variability of the ISO mainly occurs in its evolution rather than in its strength at origin.
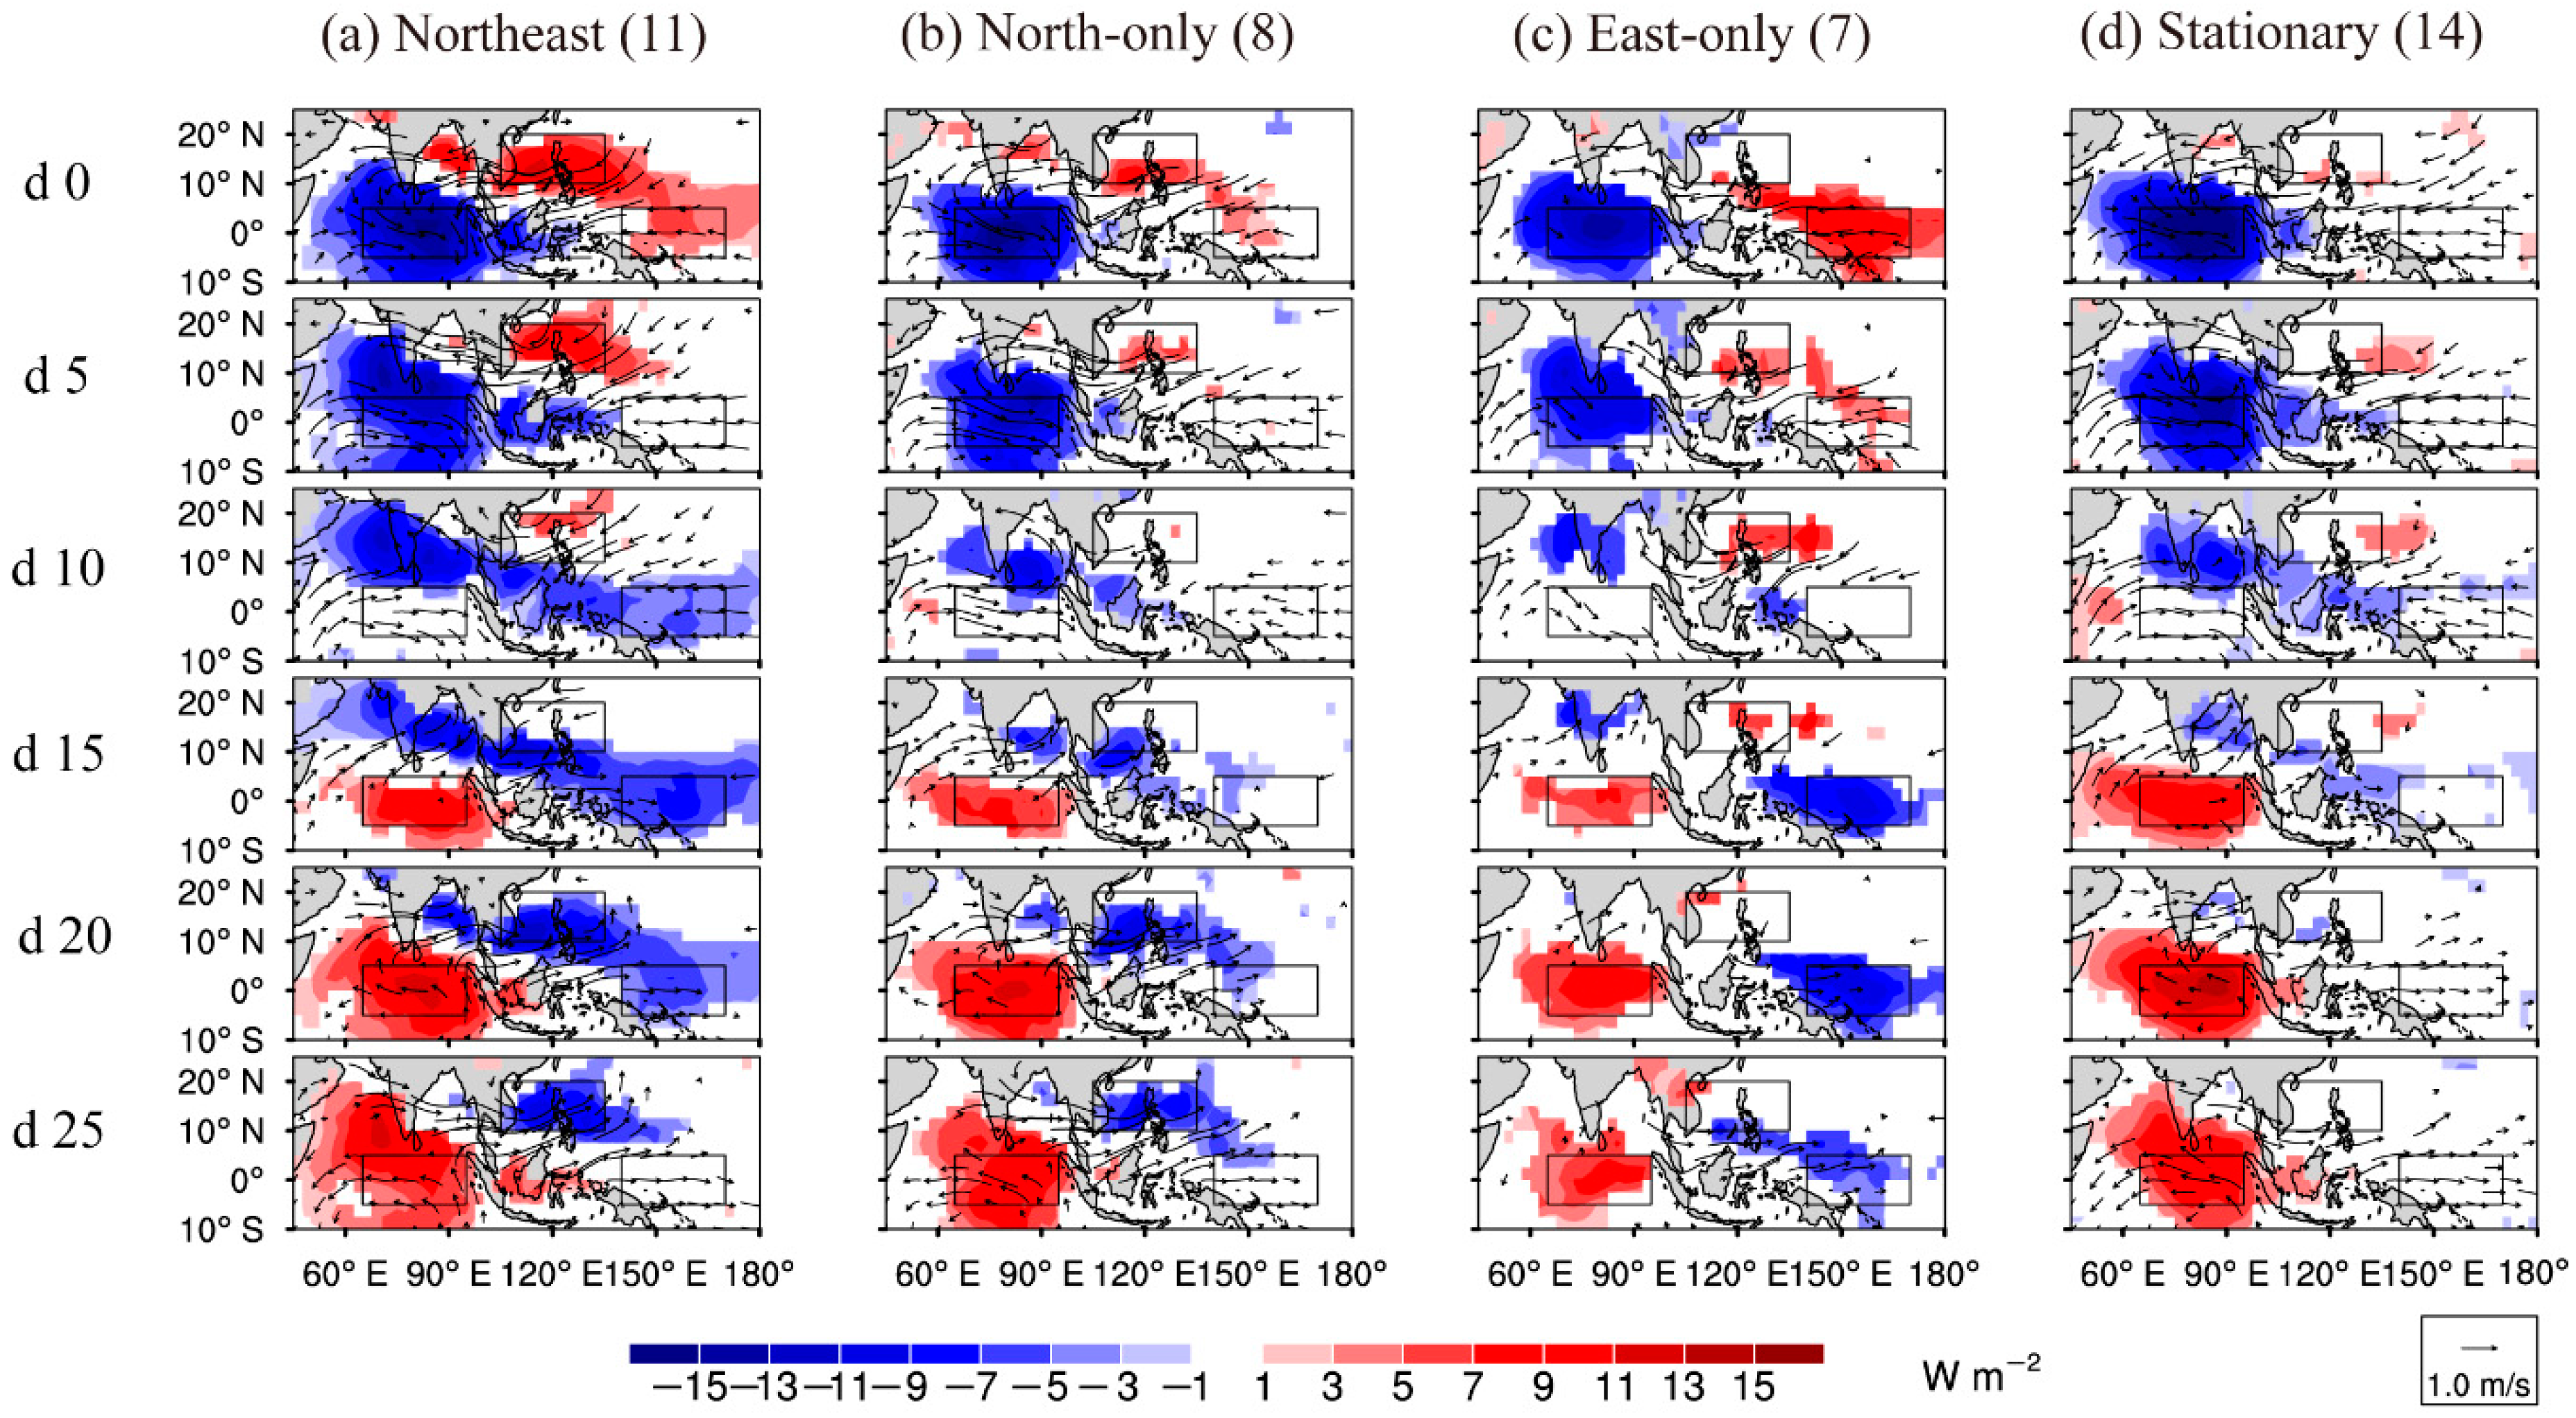
The propagations of these four BSISO modes are shown in Figure 3. During the northeast mode years (Figure 3a), the convection over the EIO propagates northward and eastward simultaneously from day 0, with lower-tropospheric easterly winds to the east and north and westerly wind bursts under the convection. The northward part, accompanied by lower-tropospheric westerly wind anomalies to the south, reaches the Indian subcontinent and the Bay of Bengal at day 15, and gradually weakens thereafter. The convection reaches the MC at day 5, while its strength is not suppressed compared to the strengths of the other three modes. From day 5, the northeastward part moves into the WNP and peaks at day 25. The branch of eastward propagation spreads through the MC and influences the WEP at day 10 and peaks at day 15, resulting in a northwest–southeast-oriented rain band. From day 15, the convection moves northwestward from the WEP to the WNP, and peaks over the WNP at day 25, accompanied by a strong westerly wind anomaly over the WNP. The negative convection anomaly appears over the EIO at day 15. The northeast mode is quite similar to the evolution of regressed BSISO over the IO (Figure 1b–g), which was revealed in previous works [41,42,43].
During the north-only mode years (Figure 3b), the northeastward propagation, like that for the northeast mode, is observed. The northward branch, however, is a little weak over the Indian subcontinent, and is dominated by the branch over the Bay of Bengal. The convection reaches Indonesia at day 5, with a strong easterly wind anomaly to the east. From day 5, the convection over the MC is dominated by the northeastward propagation, which reaches the WNP at day 15 and peaks at day 25. The eastward part, however, is suppressed, and no strong convection reaches the WEP.
During the east-only mode years (Figure 3c), the BSISO is dominated by eastward propagation. The northward part reaches the Indian subcontinent at day 10, and decays very quickly. The eastward part reaches the MC at day 5, through it is suppressed. Only a small part of the convection over the WEP propagates northwestward into the WNP after day 25. Its strength, however, is very weak by then. For this east-only mode, there is a jump over the MC for the eastward propagation in terms of both convection and circulation, and the BSISO is re-originated over the WEP. Here, we still use the name east-only mode since the BSISO originating from the EIO can only reach the WEP.
During the stationary mode years (Figure 3d), the convection is confined in the IO, and only an isolated pattern appears. At day 0, the convection in the EIO is accompanied by strong westerly wind anomaly below and by strong easterly wind anomalies to the east and north from the MC to the WEP. Then, the convection moves northeastward and decays quickly. At day 5, the convection reaches the MC, though its intensity resembles that of the northeast mode and decays rapidly, followed by weak convection over both WEP and WNP. At day 15, the BSISO is dominated by the negative phase over the EIO.
The evolutions of MJO can also be represented by column-integrated MSE [39]. Four propagations of regressed column-integrated MSE anomaly maps are shown in Figure 4. The MSE maxima of the four modes at day 0 are all at the east side of the ISO convection center. During the northeast mode years (Figure 4a), the evolution of column-integrated MSE anomaly closely follows OLR evolution. During the north-only mode years (Figure 4b), the positive MSE center propagates eastward ahead of its OLR center from day 0 to day 10. However, it is different from the OLR during day 15 to day 25; that is, the MSE center keeps propagating eastward, arriving at the WEP where the OLR center hardly reaches, and then moves northwestward to the WNP. During the east-only mode years (Figure 4c), the amplitude of MSE maximum at day 0, like that of OLR (Figure 3c), is the smallest over the four modes. From day 0 to day 15, the MSE center propagates eastward, passing over the MC, and decays rapidly with little signal over the MC at day 10 and little signal over the MC and WP at day 15 when the OLR signal is reorganized over the WEP. However, the MSE center over the WEP shows up again after day 20, later than the OLR signal. During the stationary mode years (Figure 4d), the MSE center over the EIO, like that of the northeast mode, propagates northeastward to the Indian subcontinent, Bay of Bengal, and WEP from day 0 to day 10, and starts to decay afterward, while the OLR signal stalls over the MC at day 10.
In summary, the BSISO represented by OLR anomalies can pass over the MC without being suppressed, and can reach the WEP and then the WNP during the northeast mode years, while it can reach the west part of the MC and then move to the WNP during the north-only mode years. During the east-only mode years, the BSISO is dominated by the eastward propagation; its convection is suppressed over the MC, and reorganized to the east part of the MC, before moving to the WEP and peaking there. The BSISO during the stationary mode years, however, is confined over the IO and MC. However, there is some inconsistencies in each mode between the OLR and vertical-integrated MSE evolutions (except for the northeast mode). There is no OLR anomaly over the WEP after day 15 in the north-only mode, but its MSE anomaly still propagates eastward. For the east-only mode, the reorganized MSE signal shows up several days later than the OLR signal over the WEP. In the situation of stationary mode, MSE can arrive at the WEP at day 10, but OLR cannot, resembling the situation of north-only mode. It seems that the vertically integrated MSE anomalies cannot represent the interannual variability of the BSISO very well, which may be due to the method applied in this study or the nonlinear relationship between MSE and OLR. The reason for this should be explored in the future.

4. Different Background Characteristics of the Four Propagation Modes

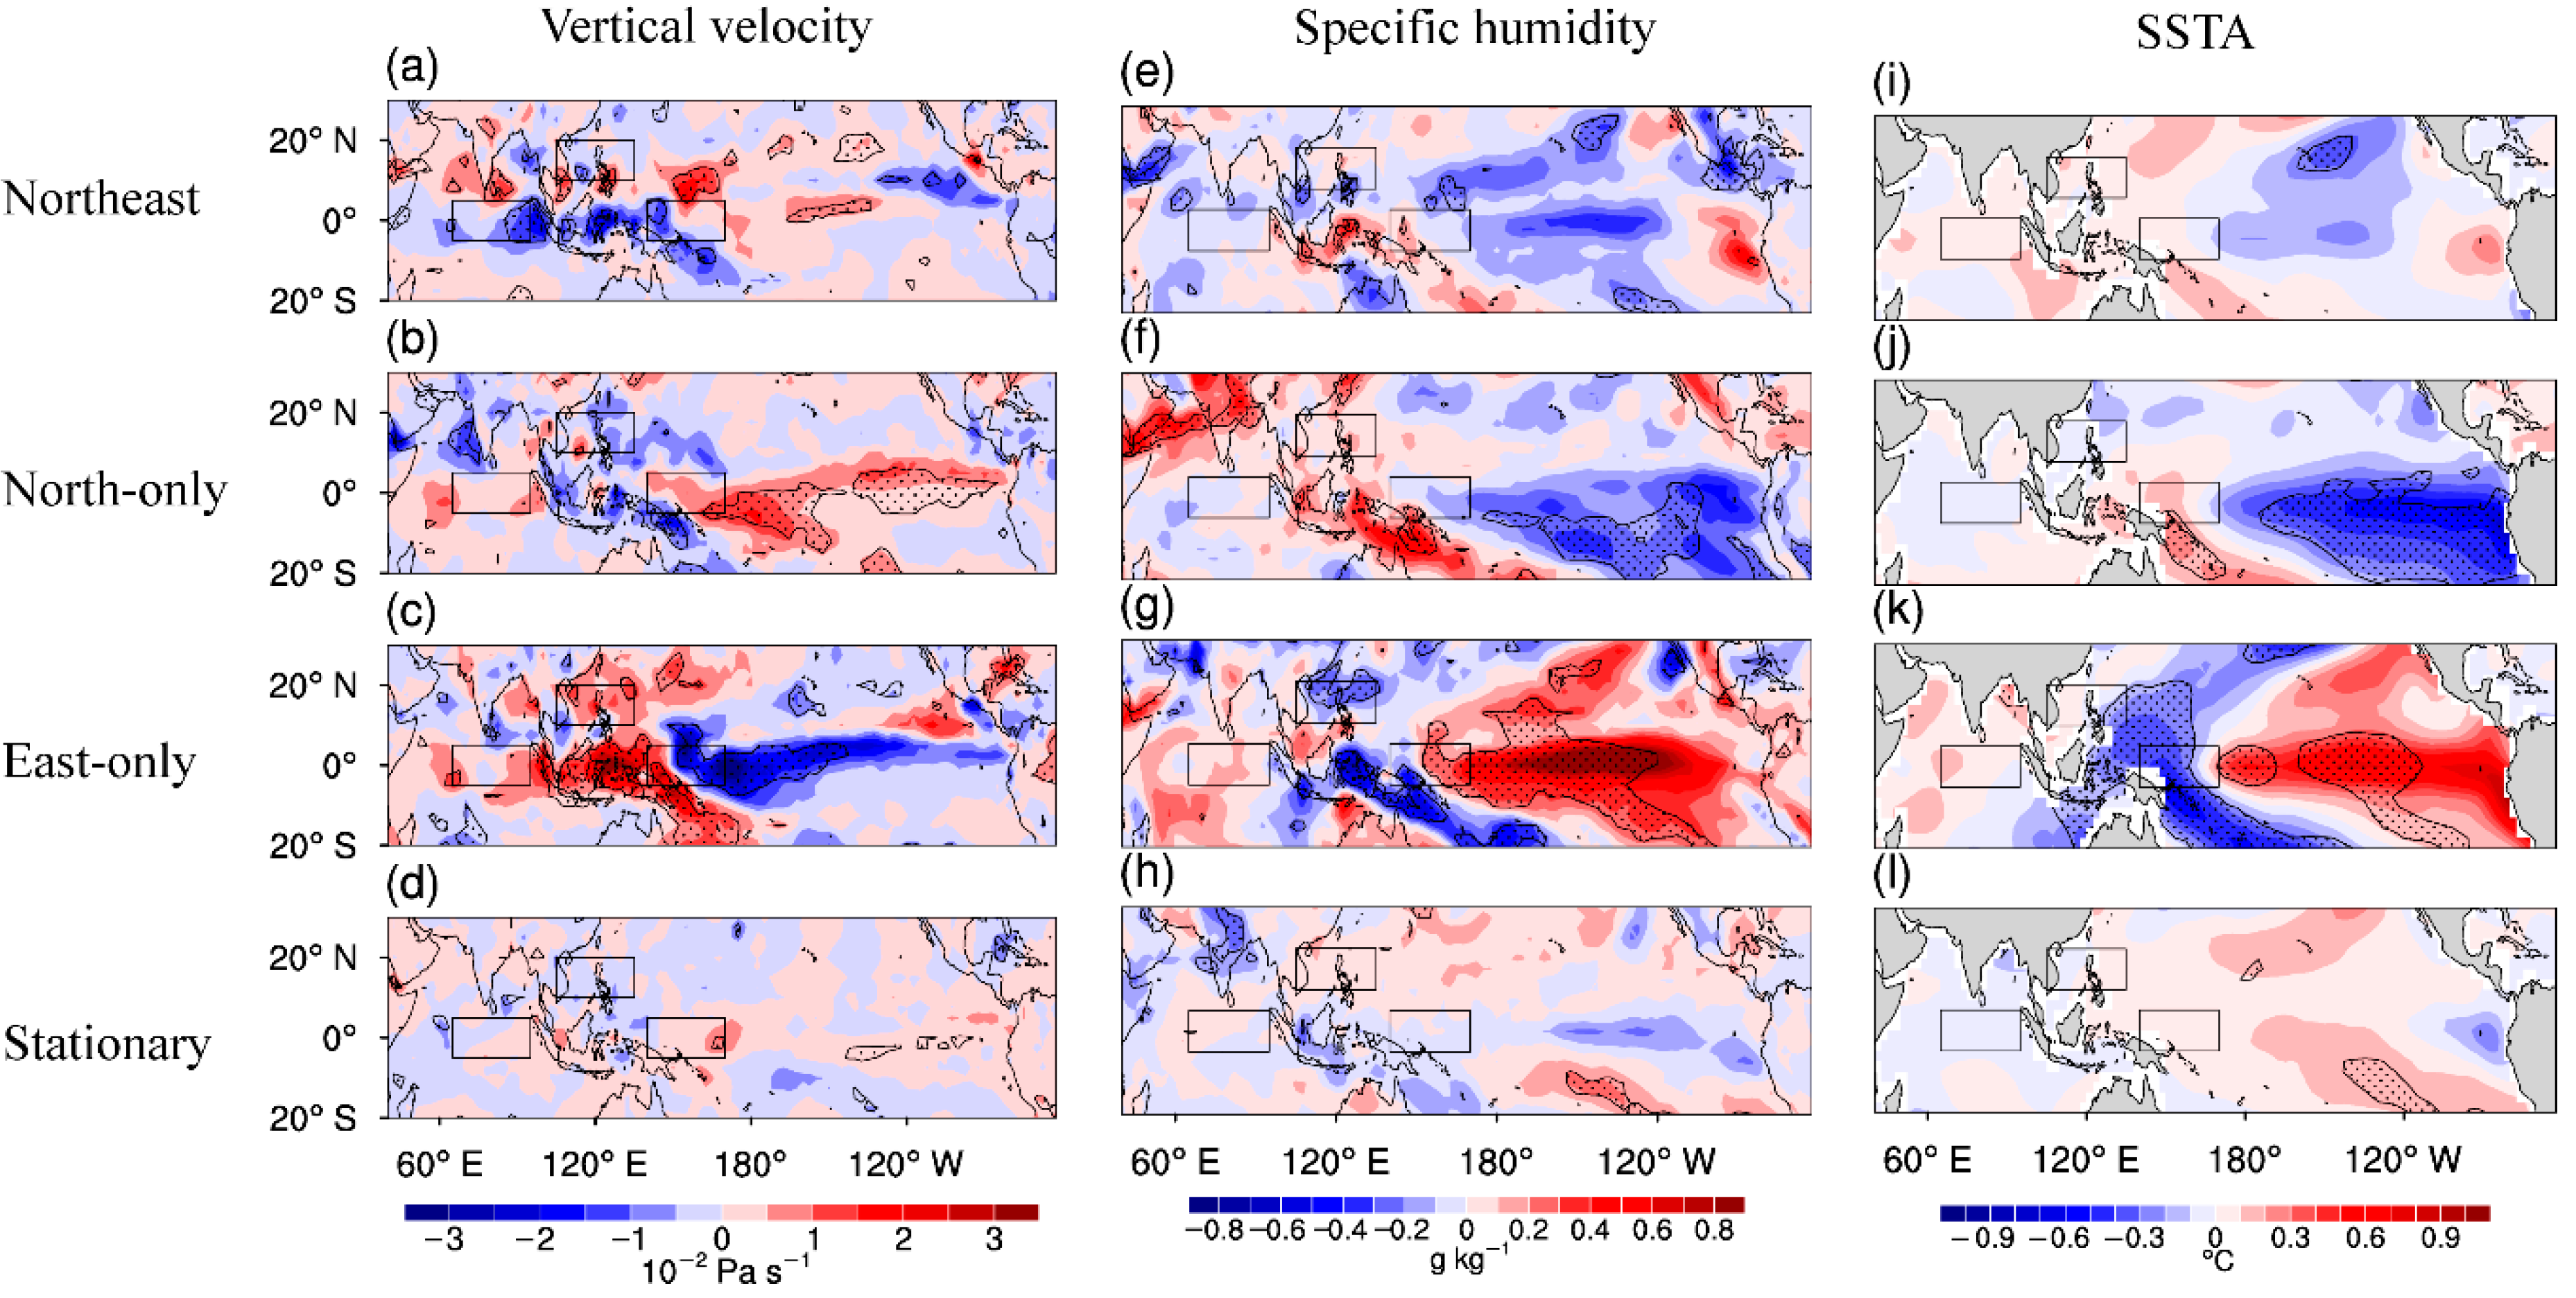
To investigate what factors determine the propagation pathway of these four modes, the background mean states are analyzed first (Figure 5). Strong upward motion and positive mean moisture anomalies occur over the MC (Figure 5a,e), associated with the weak central equatorial Pacific cooling during the northeast mode years (Figure 5i), which can facilitate the ISO maintenance by transporting moist air upward to further trigger convections [44]. Thus, the BSISO can reach the WEP and WNP due to the weak change in mean state over the WEP and WNP regions.
During the north-only mode years, however, strong cooling occurs over the central equatorial Pacific (Figure 5j), which also excites strong seasonal mean upward motion anomalies (Figure 5b) and positive mean moisture anomalies (Figure 5f) over the MC; thus, the BSISO can pass over the MC and reach the WP. This differs from the northeast mode years, where strong seasonal mean downward motion anomalies and negative moisture anomalies over the central and eastern equatorial Pacific are excited by this strong central Pacific cooling, which will suppress the BSISO, resulting in the north-only mode.
During the east-only mode years, the central equatorial Pacific exhibits strong warming, exciting strong upward motion and positive mean moisture anomalies, which can reorganize the depressed ISO when passing over the MC by strong downward motion and negative moisture anomalies (Figure 5c,g,k).
During the stationary mode years, weak central Pacific warming, downward motion, and negative moisture anomalies over the MC (Figure 5d,h,l), which are not statistically significant, provide disadvantageous seasonal mean background conditions to the ISO propagating to the WP.
In general, the dynamic (vertical velocity) and thermodynamic (specific humidity) mean states over the MC and WEP are key for the EIO ISO in terms of its propagation to the WNP and WEP.

5. Conclusions and Discussion

In this study, we examined the inter-annual variability of BSISO propagation from the IO to the WP using observed OLR and reanalysis datasets during the boreal summers (May–September) of 1979–2018. Based on their propagation characteristics, the year-to-year propagations of the BSISO can be classified into four modes, i.e., northeast, north-only, east-only, and stationary modes. During the northeast mode years, the BSISO is characterized by northward and eastward propagation, resulting in a strong northwest–southeast-tilted rain belt structure over the Indian subcontinent, Bay of Bengal, MC, and WEP; and the BSISO can reach the WEP and WNP (Figure 3a). During the north-only mode years, the eastward-propagating BSISO can only reach the WNP after passing over the MC (Figure 3b). In contrast, the BSISO in the east-only mode decays quickly over the MC; however, it reorganizes itself over the east part of the MC (Figure 3c). During the stationary mode years, the EIO ISO only moves northward to the land masses and eastward to the MC with quick decay (Figure 3d).
Our analysis of background mean states reveals that the distinctive four modes can be attributed to the changes of seasonal mean moisture and vertical motion over the two key regions: the MC and the WEP (Figure 6). During the northeast and north-only mode years, positive seasonal mean moisture anomalies and upward motion anomalies over the MC, related to central equatorial Pacific cooling, have a beneficial effect on the EIO ISO arriving at the WP (Figure 6a,b). However, the ISO of the north-only mode cannot reach the WEP due to the negative effect of strong local negative mean moisture anomalies and downward mean motion, associated with strong central Pacific cooling (Figure 6b). During the east-only and stationary mode years, the negative mean moisture anomalies and downward mean motion prevent the ISO from passing over the MC (Figure 6c,d). However, the ISO is reinitiated over the WEP for the east-only mode due to the beneficial effect of local positive seasonal mean moisture anomalies and upward motion anomalies associated with strong central Pacific warming (Figure 6c).
Our results can help to predict whether the BSISO originating from the IO can reach the WEP and WNP or not. The changes of mean states over the MC and WEP regions are related to both the strength and phase of the central equatorial Pacific SST anomaly, which calls for improvement of the ENSO evolution prediction.

Author Contributions

Methodology, F.L. and H.W.; formal analysis, J.Z.; writing—original draft preparation, J.Z.; writing—review and editing, F.L. and J.Z. All authors have read and approved the final manuscript.

Funding

This research was funded by the China National 973 Project (2015CB453200), the National Natural Science Foundation of China (41420104002 and 41475084), the Natural Science Foundation of Jiangsu province (BK20150907 and BK20150062), ONR (Grant N00014-16-12260), NRL (Grant N00173-16-1-G906), the Jiangsu Shuang-Chuang Team (R2014SCT001), and the Priority Academic Program Development of Jiangsu Higher Education Institutions (PAPD).

Conflicts of Interest

The authors declare no conflict of interest.

References

  1. Madden, R.A. Seasonal variations of the 40–50 day oscillation in the tropics. J. Atmos. Sci. 1986, 43, 3138–3158. [Google Scholar] [CrossRef]
  2. Jones, C.; Carvalho, L.M.; Wayne Higgins, R.; Waliser, D.E.; Schemm, J.E. Climatology of tropical intraseasonal convective anomalies: 1979–2002. J. Clim. 2004, 17, 523–539. [Google Scholar] [CrossRef]
  3. Zhang, C.; Dong, M. Seasonality in the Madden–Julian oscillation. J. Clim. 2004, 17, 3169–3180. [Google Scholar] [CrossRef]
  4. Lau, K.-M.; Chan, P. Aspects of the 40–50 day oscillation during the northern summer as inferred from outgoing longwave radiation. Mon. Weather Rev. 1986, 114, 1354–1367. [Google Scholar] [CrossRef]
  5. Wang, B.; Webster, P.J.; Teng, H. Antecedents and self-induction of active-break south Asian monsoon unraveled by satellites. Geophys. Res. Lett. 2005, 32. [Google Scholar] [CrossRef] [Green Version]
  6. Yasunari, T. Cloudiness fluctuations associated with the northern hemisphere summer monsoon. J. Meteorol. Soc. Jpn. 1979, 57, 227–242. [Google Scholar] [CrossRef]
  7. Hsu, H.-H.; Weng, C.-H. Northwestward propagation of the intraseasonal oscillation in the western North Pacific during the boreal summer: Structure and mechanism. J. Clim. 2001, 14, 3834–3850. [Google Scholar] [CrossRef]
  8. Kemball-Cook, S.; Wang, B. Equatorial waves and air–sea interaction in the boreal summer intraseasonal oscillation. J. Clim. 2001, 14, 2923–2942. [Google Scholar] [CrossRef]
  9. Liu, F.; Li, T.; Wang, H.; Deng, L.; Zhang, Y. Modulation of boreal summer intraseasonal oscillations over the western north Pacific by ENSO. J. Clim. 2016, 29, 7189–7201. [Google Scholar] [CrossRef]
  10. Murakami, M. Analysis of the deep convective activity over the western Pacific and southeast Asia. J. Meteorol. Soc. Jpn. Ser. II 1983, 61, 60–76. [Google Scholar] [CrossRef]
  11. Wang, B.; Rui, H. Synoptic climatology of transient tropical intraseasonal convection anomalies: 1975–1985. Meteorol. Atmos. Phys. 1990, 44, 43–61. [Google Scholar] [CrossRef]
  12. Lawrence, D.M.; Webster, P.J. The boreal summer intraseasonal oscillation: Relationship between northward and eastward movement of convection. J. Atmos. Sci. 2002, 59, 1593–1606. [Google Scholar] [CrossRef]
  13. Pillai, P.A.; Sahai, A.K. Moisture dynamics of the northward and eastward propagating boreal summer intraseasonal oscillations: Possible role of tropical Indo-west Pacific SST and circulation. Clim. Dyn. 2015, 47, 1335–1350. [Google Scholar] [CrossRef]
  14. Hendon, H.H.; Zhang, C.; Glick, J.D. Interannual Variation of the Madden-Julian Oscillation during Austral Summer. J. Clim. 1999, 12, 2538–2550. [Google Scholar] [CrossRef]
  15. Salby, M.L.; Hendon, H.H. Intraseasonal behavior of clouds, temperature, and motion in the Tropics. J. Atmos. Sci. 1994, 51, 2207–2224. [Google Scholar] [CrossRef]
  16. Slingo, J.; Rowell, D.; Sperber, K.; Nortley, F. On the predictability of the interannual behaviour of the Madden-Julian Oscillation and its relationship with El Niño. Q. J. R. Meteorol. Soc. 1999, 125, 583–609. [Google Scholar] [CrossRef]
  17. Liu, F.; Wang, B. Role of horizontal advection of seasonal-mean moisture in the Madden-Julian oscillation: A theoretical model analysis. J. Clim. 2016, 29, 6277–6293. [Google Scholar] [CrossRef]
  18. Teng, H.Y.; Wang, B. Interannual variations of the boreal summer intraseasonal oscillation in the Asian-Pacific region. J. Clim. 2003, 16, 3572–3584. [Google Scholar] [CrossRef]
  19. Li, J.; Mao, J. Factors controlling the interannual variation of 30–60-day boreal summer intraseasonal oscillation over the Asian summer monsoon region. Clim. Dyn. 2018, 52, 1651–1672. [Google Scholar] [CrossRef]
  20. Deng, L.; Li, T. Relative roles of background moisture and vertical shear in regulating interannual variability of boreal summer intraseasonal oscillations. J. Clim. 2016, 29, 7009–7025. [Google Scholar] [CrossRef]
  21. Wu, R.; Cao, X. Relationship of boreal summer 10–20-day and 30–60-day intraseasonal oscillation intensity over the tropical western North Pacific to tropical Indo-Pacific SST. Clim. Dyn. 2016, 48, 3529–3546. [Google Scholar] [CrossRef]
  22. Kim, H.M.; Kang, I.S.; Wang, B.; Lee, J.Y. Interannual variations of the boreal summer intraseasonal variability predicted by ten atmosphere–ocean coupled models. Clim. Dyn. 2008, 30, 485–496. [Google Scholar] [CrossRef]
  23. Zhang, C.; Ling, J. Barrier effect of the Indo-Pacific maritime continent on the MJO: perspectives from tracking MJO precipitation. J. Clim. 2017, 30, 3439–3459. [Google Scholar] [CrossRef]
  24. Maloney, E.D.; Sobel, A.H. Surface fluxes and ocean coupling in the tropical intraseasonal oscillation. J. Clim. 2004, 17, 4368–4386. [Google Scholar] [CrossRef]
  25. Sobel, A.H.; Maloney, E.D.; Bellon, G.; Frierson, D.M. The role of surface heat fluxes in tropical intraseasonal oscillations. Nat. Geosci. 2008, 1, 653–657. [Google Scholar] [CrossRef]
  26. Adames, Á.F.; Kim, D. The MJO as a dispersive, convectively coupled moisture wave: Theory and observations. J. Atmos. Sci. 2016, 73, 913–941. [Google Scholar] [CrossRef]
  27. Raymond, D.J. A new model of the Madden-Julian oscillation. J. Atmos. Sci. 2001, 58, 2807–2819. [Google Scholar] [CrossRef]
  28. Hagos, S.M.; Zhang, C.; Feng, Z.; Burleyson, C.D.; De Mott, C.; Kerns, B.; Martini, M.N. The impact of the diurnal cycle on the propagation of Madden-Julian oscillation convection across the Maritime Continent. J. Adv. Modeling Earth Syst. 2016, 8, 1552–1564. [Google Scholar] [CrossRef]
  29. Burleyson, C.D.; Hagos, S.M.; Feng, Z.; Kerns, B.W.J.; Kim, D. Large-Scale Environmental Characteristics of MJOs that Strengthen and Weaken over the Maritime Continent. J. Clim. 2018, 31, 5731–5748. [Google Scholar] [CrossRef]
  30. Tan, H.; Ray, P.; Barrett, B.S.; Tewari, M.; Moncrieff, M.W. Role of topography on the MJO in the maritime continent: a numerical case study. Clim. Dynam. 2018. [Google Scholar] [CrossRef]
  31. Tseng, W.L.; Hsu, H.H.; Keenlyside, N.; Chang, C.; Tsuang, B.J.; Tu, C.Y.; Jiang, L.C. Effects of Surface Orography and Land-Sea Contrast on the Madden-Julian Oscillation in the Maritime Continent: A Numerical Study Using ECHAM5-SIT. J. Clim. 2017, 30, 9725–9741. [Google Scholar] [CrossRef]
  32. Fu, J.X.; Wang, W.; Ren, H.L.; Jia, X.; Shinoda, T. Three different downstream fates of the boreal-summer MJOs on their passages over the Maritime Continent. Clim. Dyn. 2017, 51, 1841–1862. [Google Scholar] [CrossRef] [Green Version]
  33. Kim, D.; Kug, J.S.; Sobel, A.H. Propagating versus nonpropagating Madden-Julian oscillation events. J. Clim. 2014, 27, 111–125. [Google Scholar] [CrossRef]
  34. Liebmann, B. Description of a complete (interpolated) outgoing longwave radiation dataset. Bull. Am. Meteorol. Soc. 1996, 77, 1275–1277. [Google Scholar]
  35. Lee, J.-Y.; Wang, B.; Wheeler, M.C.; Fu, X.; Waliser, D.E.; Kang, I.-S. Real-time multivariate indices for the boreal summer intraseasonal oscillation over the Asian summer monsoon region. Clim. Dyn. 2013, 40, 493–509. [Google Scholar] [CrossRef]
  36. Kobayashi, S.; Ota, Y.; Harada, Y.; Ebita, A.; Moriya, M.; Onoda, H.; Miyaoka, K. The JRA-55 Reanalysis: General specifications and basic characteristics. J. Meteorol. Soc. Jpn. 2015, 93, 5–48. [Google Scholar] [CrossRef]
  37. Huang, B.; Thorne, P.W.; Banzon, V.F.; Boyer, T.; Chepurin, G.; Lawrimore, J.H.; Zhang, H.M. Extended Reconstructed Sea Surface Temperature, Version 5 (ERSSTv5): Upgrades, Validations, and Intercomparisons. J. Clim. 2017, 30, 8179–8205. [Google Scholar] [CrossRef]
  38. Duchon, C.E. Lanczos filtering in one and two dimensions. J. Appl. Meteorol. 1979, 18, 1016–1022. [Google Scholar] [CrossRef]
  39. Maloney, E.D. The Moist Static Energy Budget of a Composite Tropical Intraseasonal Oscillation in a Climate Model. J. Clim. 2009, 22, 711–729. [Google Scholar] [CrossRef] [Green Version]
  40. Wang, L.; Li, T.; Maloney, E.; Wang, B. Fundamental causes of propagating and nonpropagating MJOs in MJOTF/GASS Models. J. Clim. 2017, 30, 3743–3769. [Google Scholar] [CrossRef]
  41. Annamalai, H.; Slingo, J.M. Active/break cycles: Diagnosis of the intraseasonal variability of the Asian Summer Monsoon. Clim. Dyn. 2001, 18, 85–102. [Google Scholar] [CrossRef]
  42. Li, T.; Wang, B. The influence of sea surface temperature on the tropical intraseasonal oscillation: A numerical study. Mon. Weather Rev. 1994, 122, 2349. [Google Scholar] [CrossRef]
  43. Wang, B.; Webster, P.; Kikuchi, K.; Yasunari, T.; Qi, Y.J. Boreal summer quasi-monthly oscillation in the global tropics. Clim. Dyn. 2006, 27, 661–675. [Google Scholar] [CrossRef]
  44. Deng, L.; Li, T.; Liu, J.; Peng, M. Factors controlling the interannual variations of MJO intensity. J. Meteorol. Res. 2016, 30, 328–340. [Google Scholar] [CrossRef]
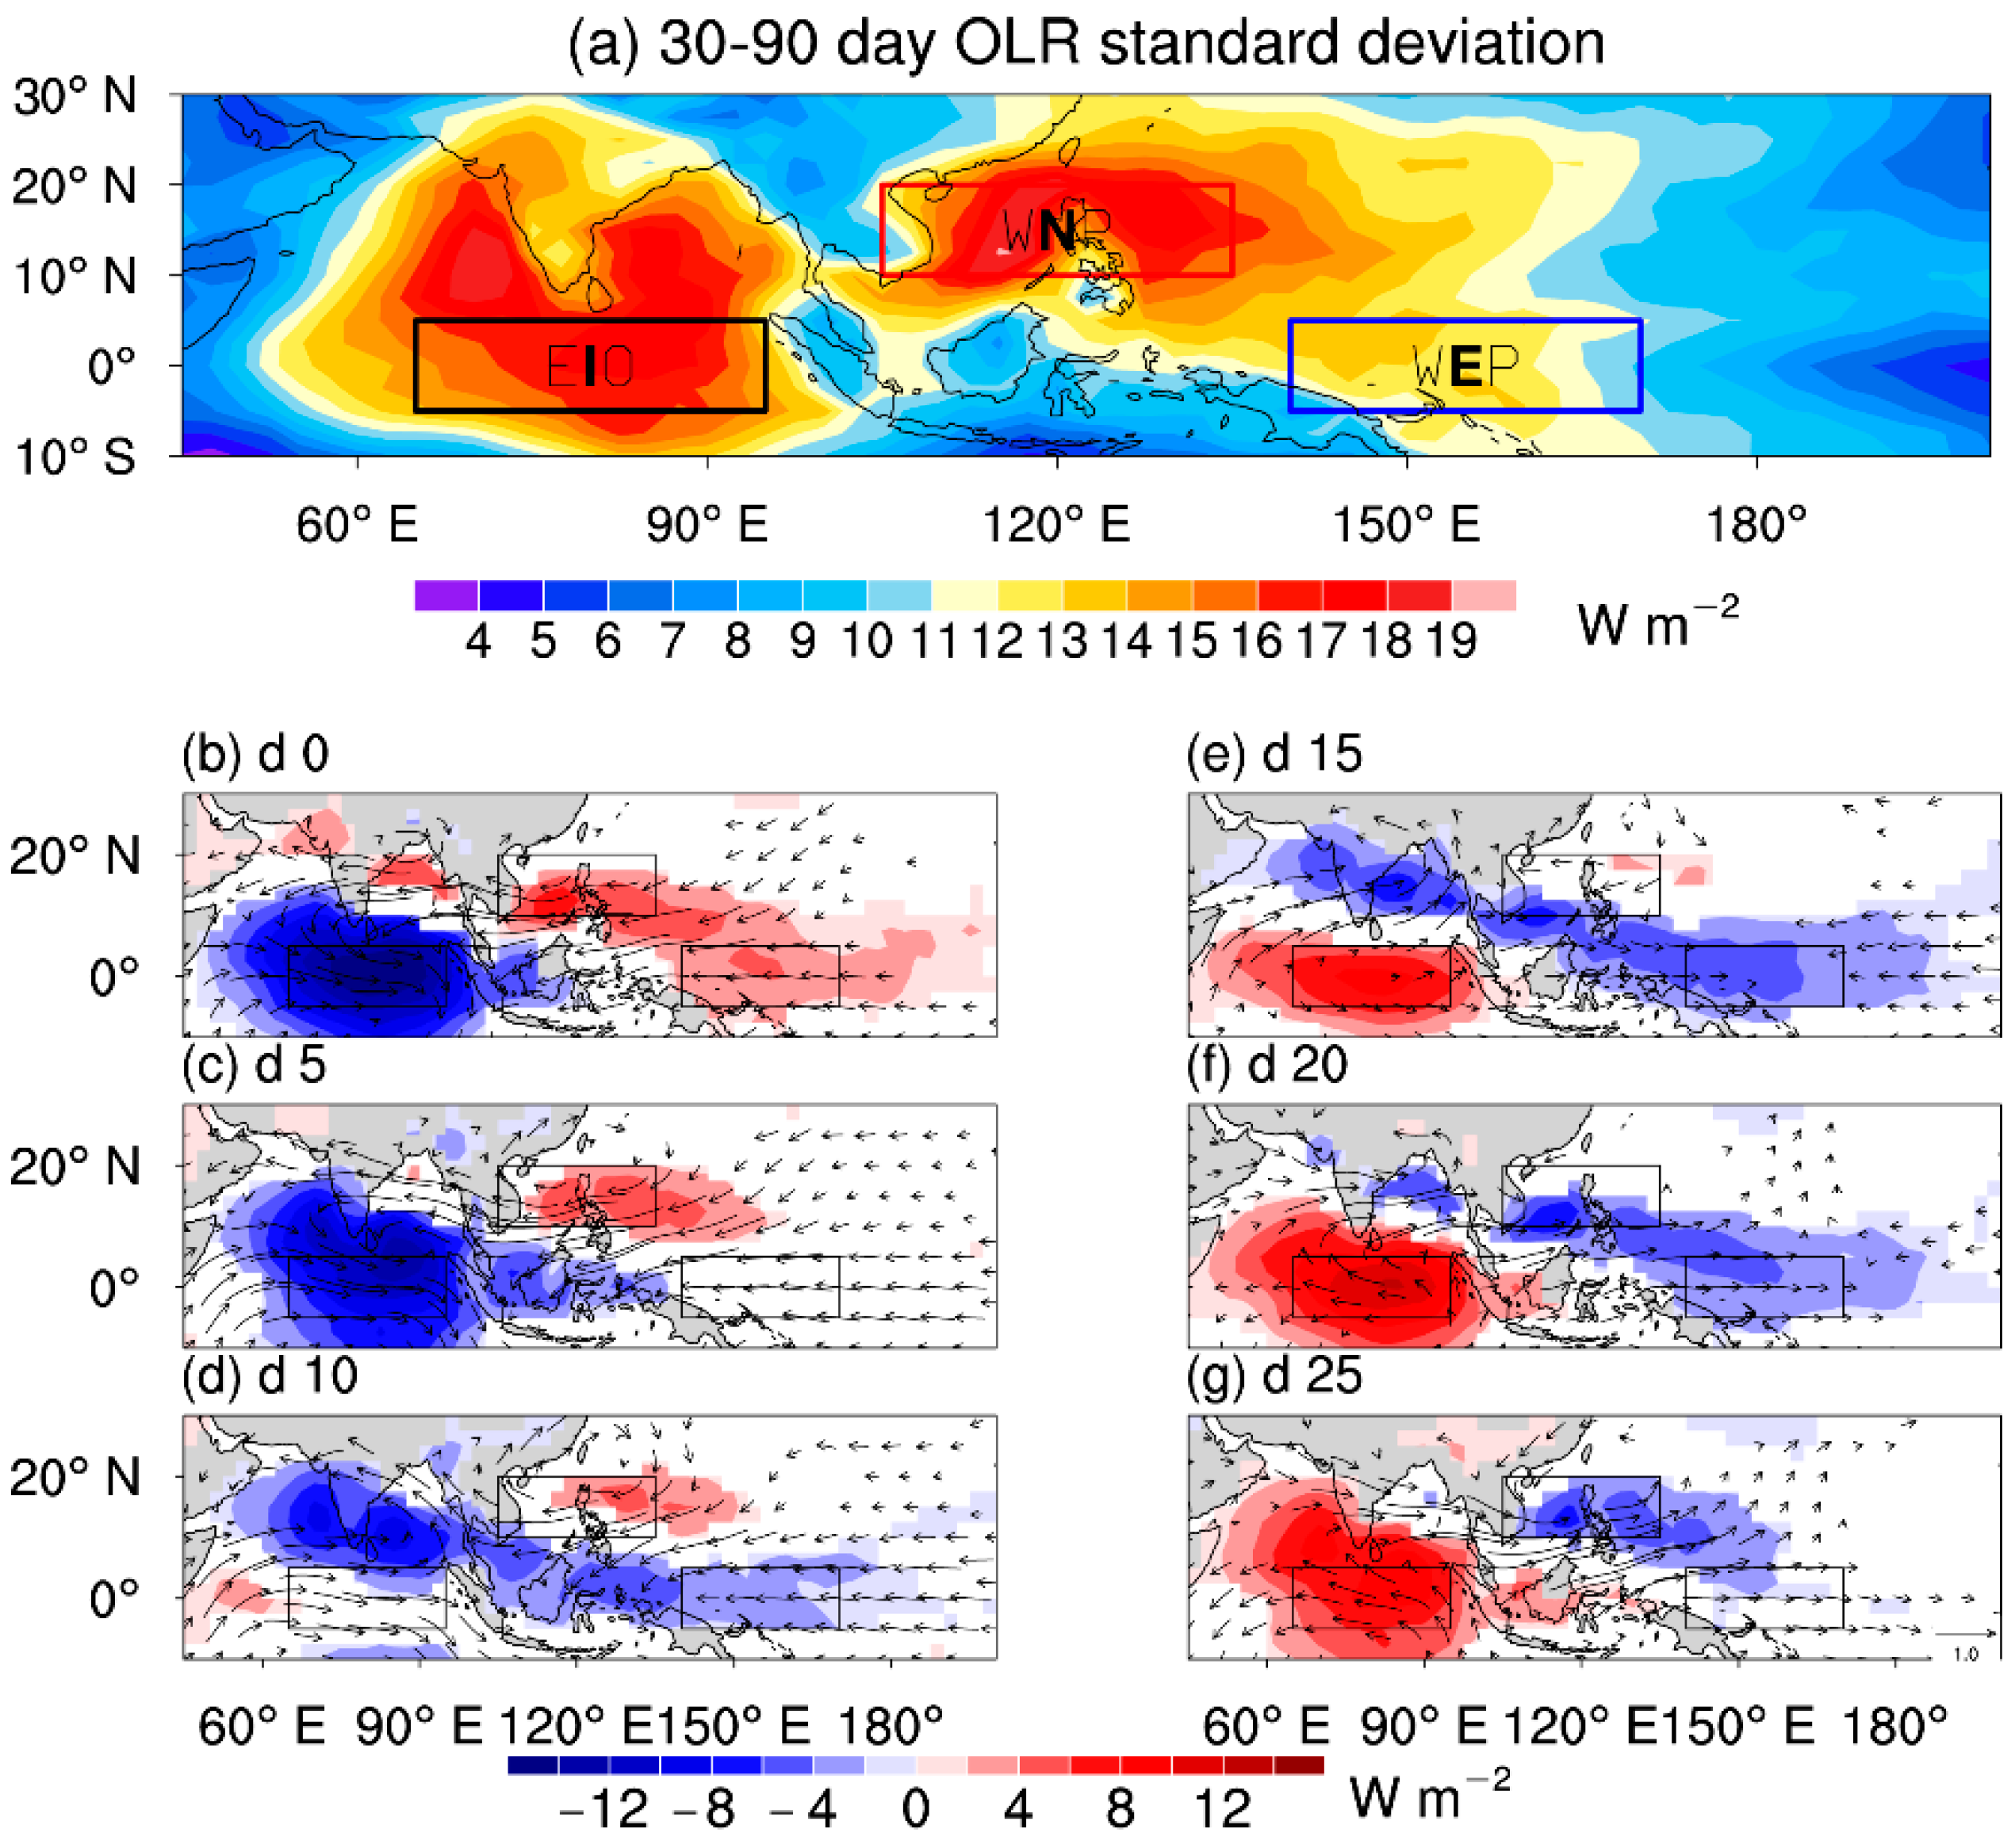
Figure 1. Spatial–temporal evolution characteristics of boreal summer intra-seasonal oscillation (BSISO). (a) The BSISO intensity, denoted by the standard deviation of 30–90-day bandpass-filtered outgoing longwave radiation (OLR) during May–September. The black box denotes the equatorial Indian Ocean (EIO, 5° S–5° N, 65°–95° E), the red box denotes the western North Pacific (WNP, 10°–20° N, 105°–135° E), and the blue box denotes the western equatorial Pacific (WEP, 5° S–5° N, 140°–170° E). (bg) Lagged regression map of OLR anomalies (shading; W m 2 ) and 850-hPa wind anomalies (vector; m/s) from day 0 to day 25 at 5-day intervals onto the EIO OLR anomaly for all summers. A 30–90-day bandpass filter is applied to the OLR before the regression. Anomalies are plotted only when they are significant at the 90% confidence level by Student’s t test.
Atmosphere 10 00596 g001
Figure 2. Regionally averaged OLR evolutions related to EIO ISO for the four modes. Lagged regression of OLR anomalies (W m 2 ) averaged over the EIO (black line), WNP (red line), WEP (blue line), and the Maritime Continent (MC) (yellow line) onto the EIO OLR anomaly for (a) northeast mode, (b) north-only mode, (c) east-only mode, and (d) stationary mode years. The number inside the brackets above each panel denotes the number of years of the mode during the 40-year study period. A 30–90-day bandpass-filter is applied to the OLR before the regression.
Atmosphere 10 00596 g002
Figure 3. Spatial–temporal OLR evolution characteristics of the four modes. Evolution of the regressed OLR anomalies (shading; W m−2) and 850-hPa wind anomalies (vector; m/s) from day 0 to day 25 for (a) northeast mode, (b) north-only mode, (c) east-only mode, and (d) stationary mode. Only anomalies above 90% significance by Student’s t test are plotted.
Atmosphere 10 00596 g003
Figure 4. Spatial–temporal moist statistic energy (MSE) evolution characteristics of the four modes. Evolution of column-integrated MSE anomalies (106 J m−2 by lagged regression against 30–90-day bandpass-filtered OLR anomaly averaged over the EIO from day 0 to day 25 for (a) northeast mode, (b) north-only mode, (c) east-only mode, and (d) stationary mode. Only anomalies above 90% significance by Student’s t test are plotted.
Atmosphere 10 00596 g004
Figure 5. Observed mean state change associated with the four modes. Composite boreal summer (May–September) mean of anomalous 300-hPa to 500-hPa averaged pressure velocity (ad; 10−2 Pa s−1), anomalous 850-hPa specific humidity (eh; g/kg), and sea surface temperature anomalies (SSTA) patterns (il; °C) for northeast, north-only, east-only, and stationary mode years. Stippling indicates the region where anomalies are above the 90% significance level by Student’s t test.
Atmosphere 10 00596 g005
Figure 6. Schematic diagram for the four modes studied. Shown are the different BSISO propagation and associated mean state change for (a) northeast mode, (b) north-only mode, (c) east-only mode, and (d) stationary mode. Clouds denote the BSISO convective center. Arrows denote the propagation of convection, and rectangles denote key regions with different mean state change.
Atmosphere 10 00596 g006
Table 1. List of specific years included in the relevant mode. SWEP, SWNP and SEIO represent the ISO strength over WEP, WNP and EIO, respectively. IO: equatorial Indian Ocean; WEP: western equatorial Pacific; WNP: western North Pacific; ISO: intra-seasonal oscillation.
Names of ModesDefinitionYears
Northeast (11)SWEP/SEIO > 0.42, SWNP/SEIO > 0.361997, 1992, 1998, 1999, 2000, 2001, 2002, 2007, 2008, 2009, 2014
North-only (8)SWEP/SEIO < 0.42, SWNP/SEIO > 0.361981, 1985, 1988, 1990, 2006, 2010, 2011, 2018
East-only (7)SWEP/SEIO > 0.42, SWNP/SEIO < 0.361980, 1983, 1986, 1987, 1993, 2004, 2015
Stationary (14)SWEP/SEIO < 0.42, SWNP/SEIO < 0.361982, 1984, 1989, 1991, 1994, 1995, 1996, 1997, 2003, 2005, 2012, 2013, 2016, 2017