1. Introduction
The Brazilian population reached 190.8 million in 2010, will be approximately 208.9 million in 2018 [
1] and the share of the population aged >80 increased by approximately 48% between 1997 and 2007. Thus, when considering urban growth and the weather patterns of these environments, it is important to highlight the vulnerability of the urban population to thermal stress, often observed in large cities, but now also perceived in medium- and small-sized cities [
1].
Older adults do not perceive thermal comfort in the same way as younger adults [
2,
3]. On average, older adults have a lower level of activity, therefore a lower metabolic rate than younger people, which is the main reason why they require a higher ambient temperature [
4,
5].
In addition to age, body fat is one of the most important characteristics for identifying the thermo-physiological differences between individuals [
6,
7]. The increased percentage of obese people across the globe [
8], as well as population ageing [
9], is also a growing characteristic of the new urban population growth model.
The contemporary lifestyle has led people to spend more time in uniform thermoneutral environments, without big temperature variations, as well as without the need to face great thermal challenges, to which the body must adapt itself in open spaces. People with a higher percentage of body fat usually have a higher level of activity, so they prefer lower temperatures [
10,
11], because both heat conduction and blood flow are influenced by body fat.
Therefore, due to the considerable importance of body mass in determining thermal comfort and thermal sensation conditions of individuals, one of the most common ways of measuring this influence is based on the analysis of the Body Mass Index (BMI) of respondents. A person’s BMI can be calculated by dividing the weight over the height squared. Thus, a BMI between 18.5 and 25 indicates normal weight, while a BMI below 18.5 is considered underweight, and a BMI above 25 is classified as overweight [
12].
Some studies have identified a strong relationship between the BMI of acclimatized individuals and their thermal sensation [
6,
7,
12], showing that people with lower BMI experienced greater thermal discomfort in the limbs.
All these individual aspects, associated to the environmental aspects of urban centers, led to the development of thermal comfort and thermal prediction studies for populations in open spaces, in order to verify the comfort and preference patterns of the population in countries like Brazil, Colombia, China, Iran, Japan, Singapore and the Mediterranean coast, during different times of the year and zones [
13,
14,
15,
16,
17,
18,
19,
20,
21,
22,
23,
24].
In the recent Brazilian context, there are researches in cities of tropical climate, both humid and semi-humid [
25,
26], but in subtropical climate, there is one made by Rossi et al. [
27] for the city of Curitiba [
27], and Santa Maria [
14,
28]. Ruiz and Correa [
29] presents to Mendoza, Argentina, an adaptive model for outdoor thermal comfort [
29].
The interurban climatic conditions are directly related to the creation of thermally comfortable microclimates in urban environments, which are influenced by the heterogeneous use of land, the design and the particular characteristics of each urban area [
30,
31], as well as the patterns of shading, urban vegetation distribution, ventilation, and street orientation [
23,
24,
32,
33,
34,
35,
36,
37,
38,
39,
40].
However, most climatic studies in medium-sized urban areas are related to general analyzes of urban climate and heat island [
41,
42,
43], with gaps in terms of thermal comfort studies [
44,
45,
46,
47,
48,
49] or seeking the construction of an adequate thermal comfort model for these types of environments [
50].
Celuppi et al. [
51], when studying the Brazilian population, approaches that pedestrians are affected by the subjective, psychological, cultural and social aspects as well as their state of mind. Thus, it is noticed that the feeling of comfort is directly linked to the experience built during their lifes [
51,
52,
53]. Therefore, the impacts of external, environmental factors and statistical methods are often used to offset the influence of difficult to measure personal subjective internal factors [
23,
40].
Thus, most studies aim at calibrating the interpretative ranges of different comfort indexes to solve issues raised for countless different locations [
14,
20,
26,
27,
53,
54,
55,
56,
57]. However, the calibration of the thermal comfort ranges of a given index not always answers all the questions raised about the thermal comfort of a given location [
14,
54]. Therefore, the development of a predictive model based on the physiological and subjective aspects of the population, as well as on the physical aspects of the reference environment, becomes a solution for better interpretations of the bioclimatic aspects for medium-sized cities [
25,
29,
54,
58,
59,
60].
Thus, the present study proposes the definition of an empirical model based on the cross-sectional interviews carried out in the city of Santa Maria, state of Rio Grande do Sul, Brazil, based on environmental, subjective and individual variables, paving the way for future studies that promote the improvement and adequacy of this model in order to meet a wider application demand in subtropical regions.
2. Location and Characterization of the Study Area
There is a range of studies carried out in temperate and subtropical countries [
5,
12,
13,
14,
16,
21,
23,
24,
25,
40,
55,
61,
62,
63,
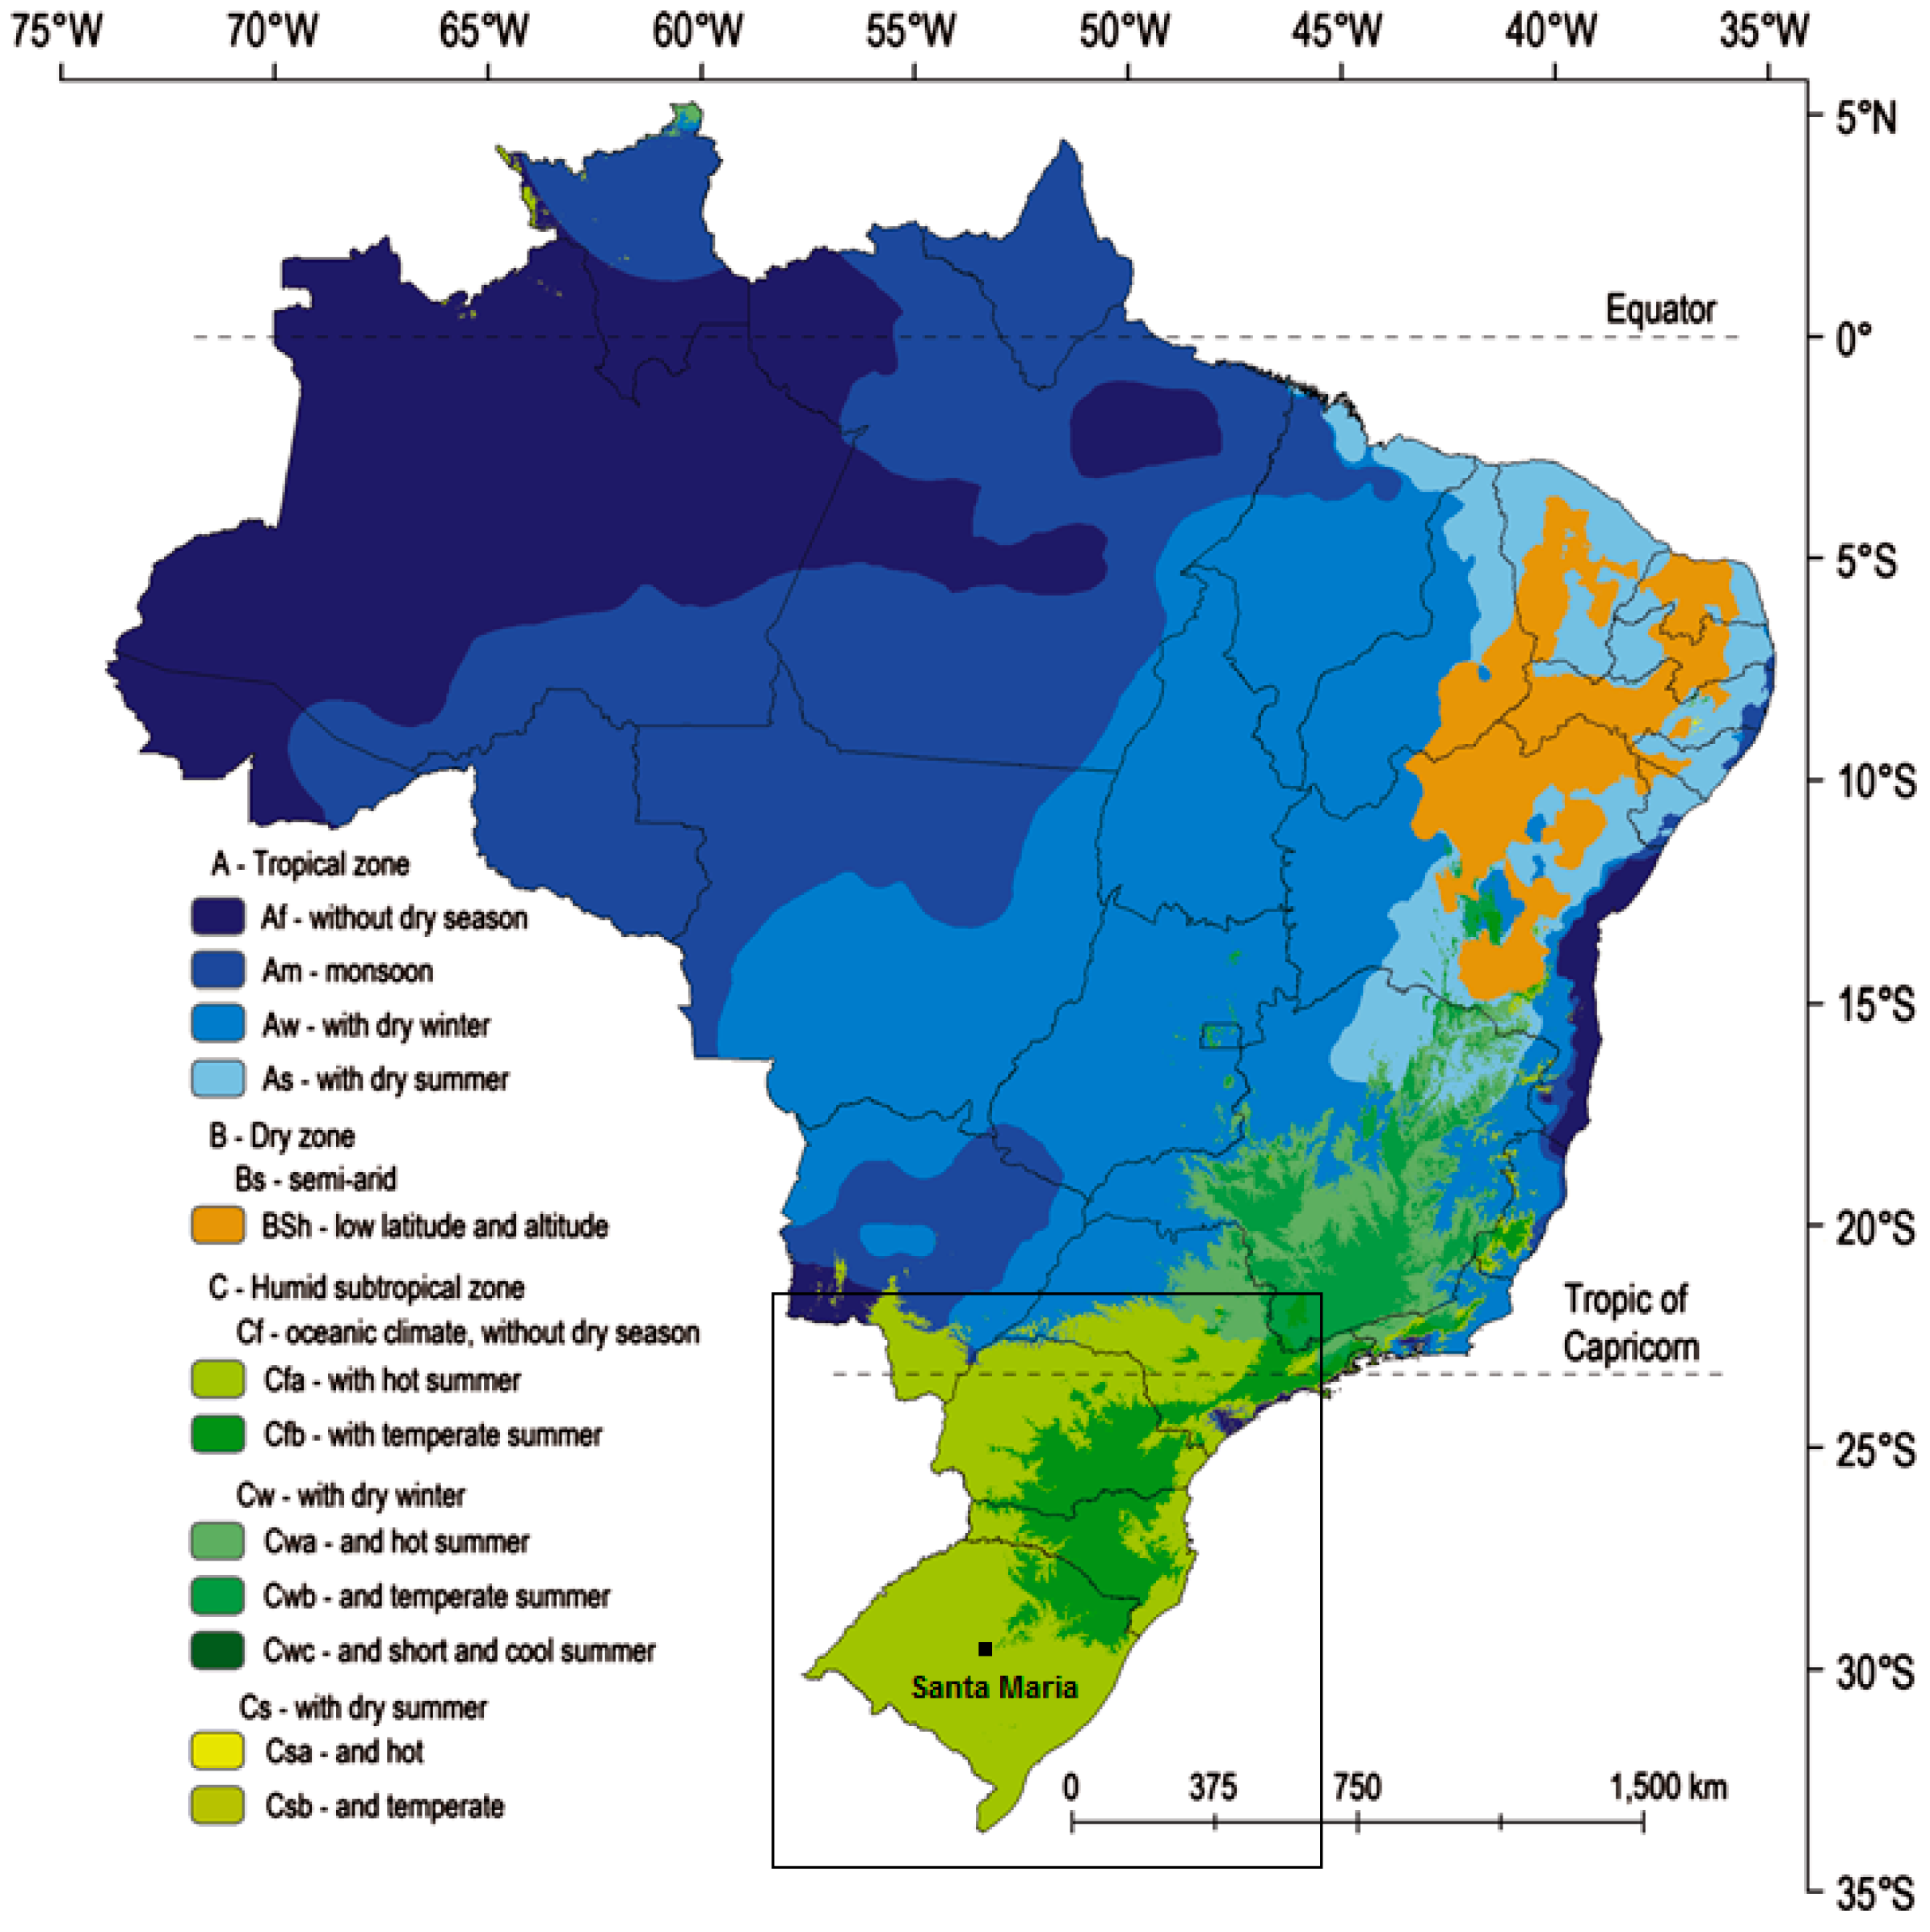
64], each of them characterized by specific climatic and cultural conditions, carried out by means of a cross-sectional approach. However, there is a gap in studies that elucidate the issues of thermal comfort in subtropical climates, which are characteristic of the geographical areas south of the Tropic of Capricorn and north of the Tropic of Cancer [
65,
66], mainly in relation to the Brazilian subtropical climate zone (
Figure 1).
There is also a greater lack of studies aimed at the analysis of the human thermal comfort in medium and small-sized urban environments. According to the United Nations [
69], half of the world’s urban population lived in centers with less than 500,000 inhabitants, and this population tends to decrease over time. However, by 2030, these smaller cities will continue to represent about 45% of all urban areas [
48].
In Brazil, such studies are vital, because of the expression that small- and medium-sized cities have acquired in recent years, since they account for 66.22% of the total population [
70] and play an important role in the country’s economic and spatial dynamics. In Brazil, small cities are those with less than 100 thousand inhabitants and medium-sized cities between 100,000 and 500,000 [
70]. According to the demographic census [
70], 62,575,769 people (38.88%) lived in small municipalities with less than 100 thousand inhabitants and 43,992,408 people (27.34%) lived in medium-sized municipalities, with a population between 100,000 and 500,000 inhabitants.
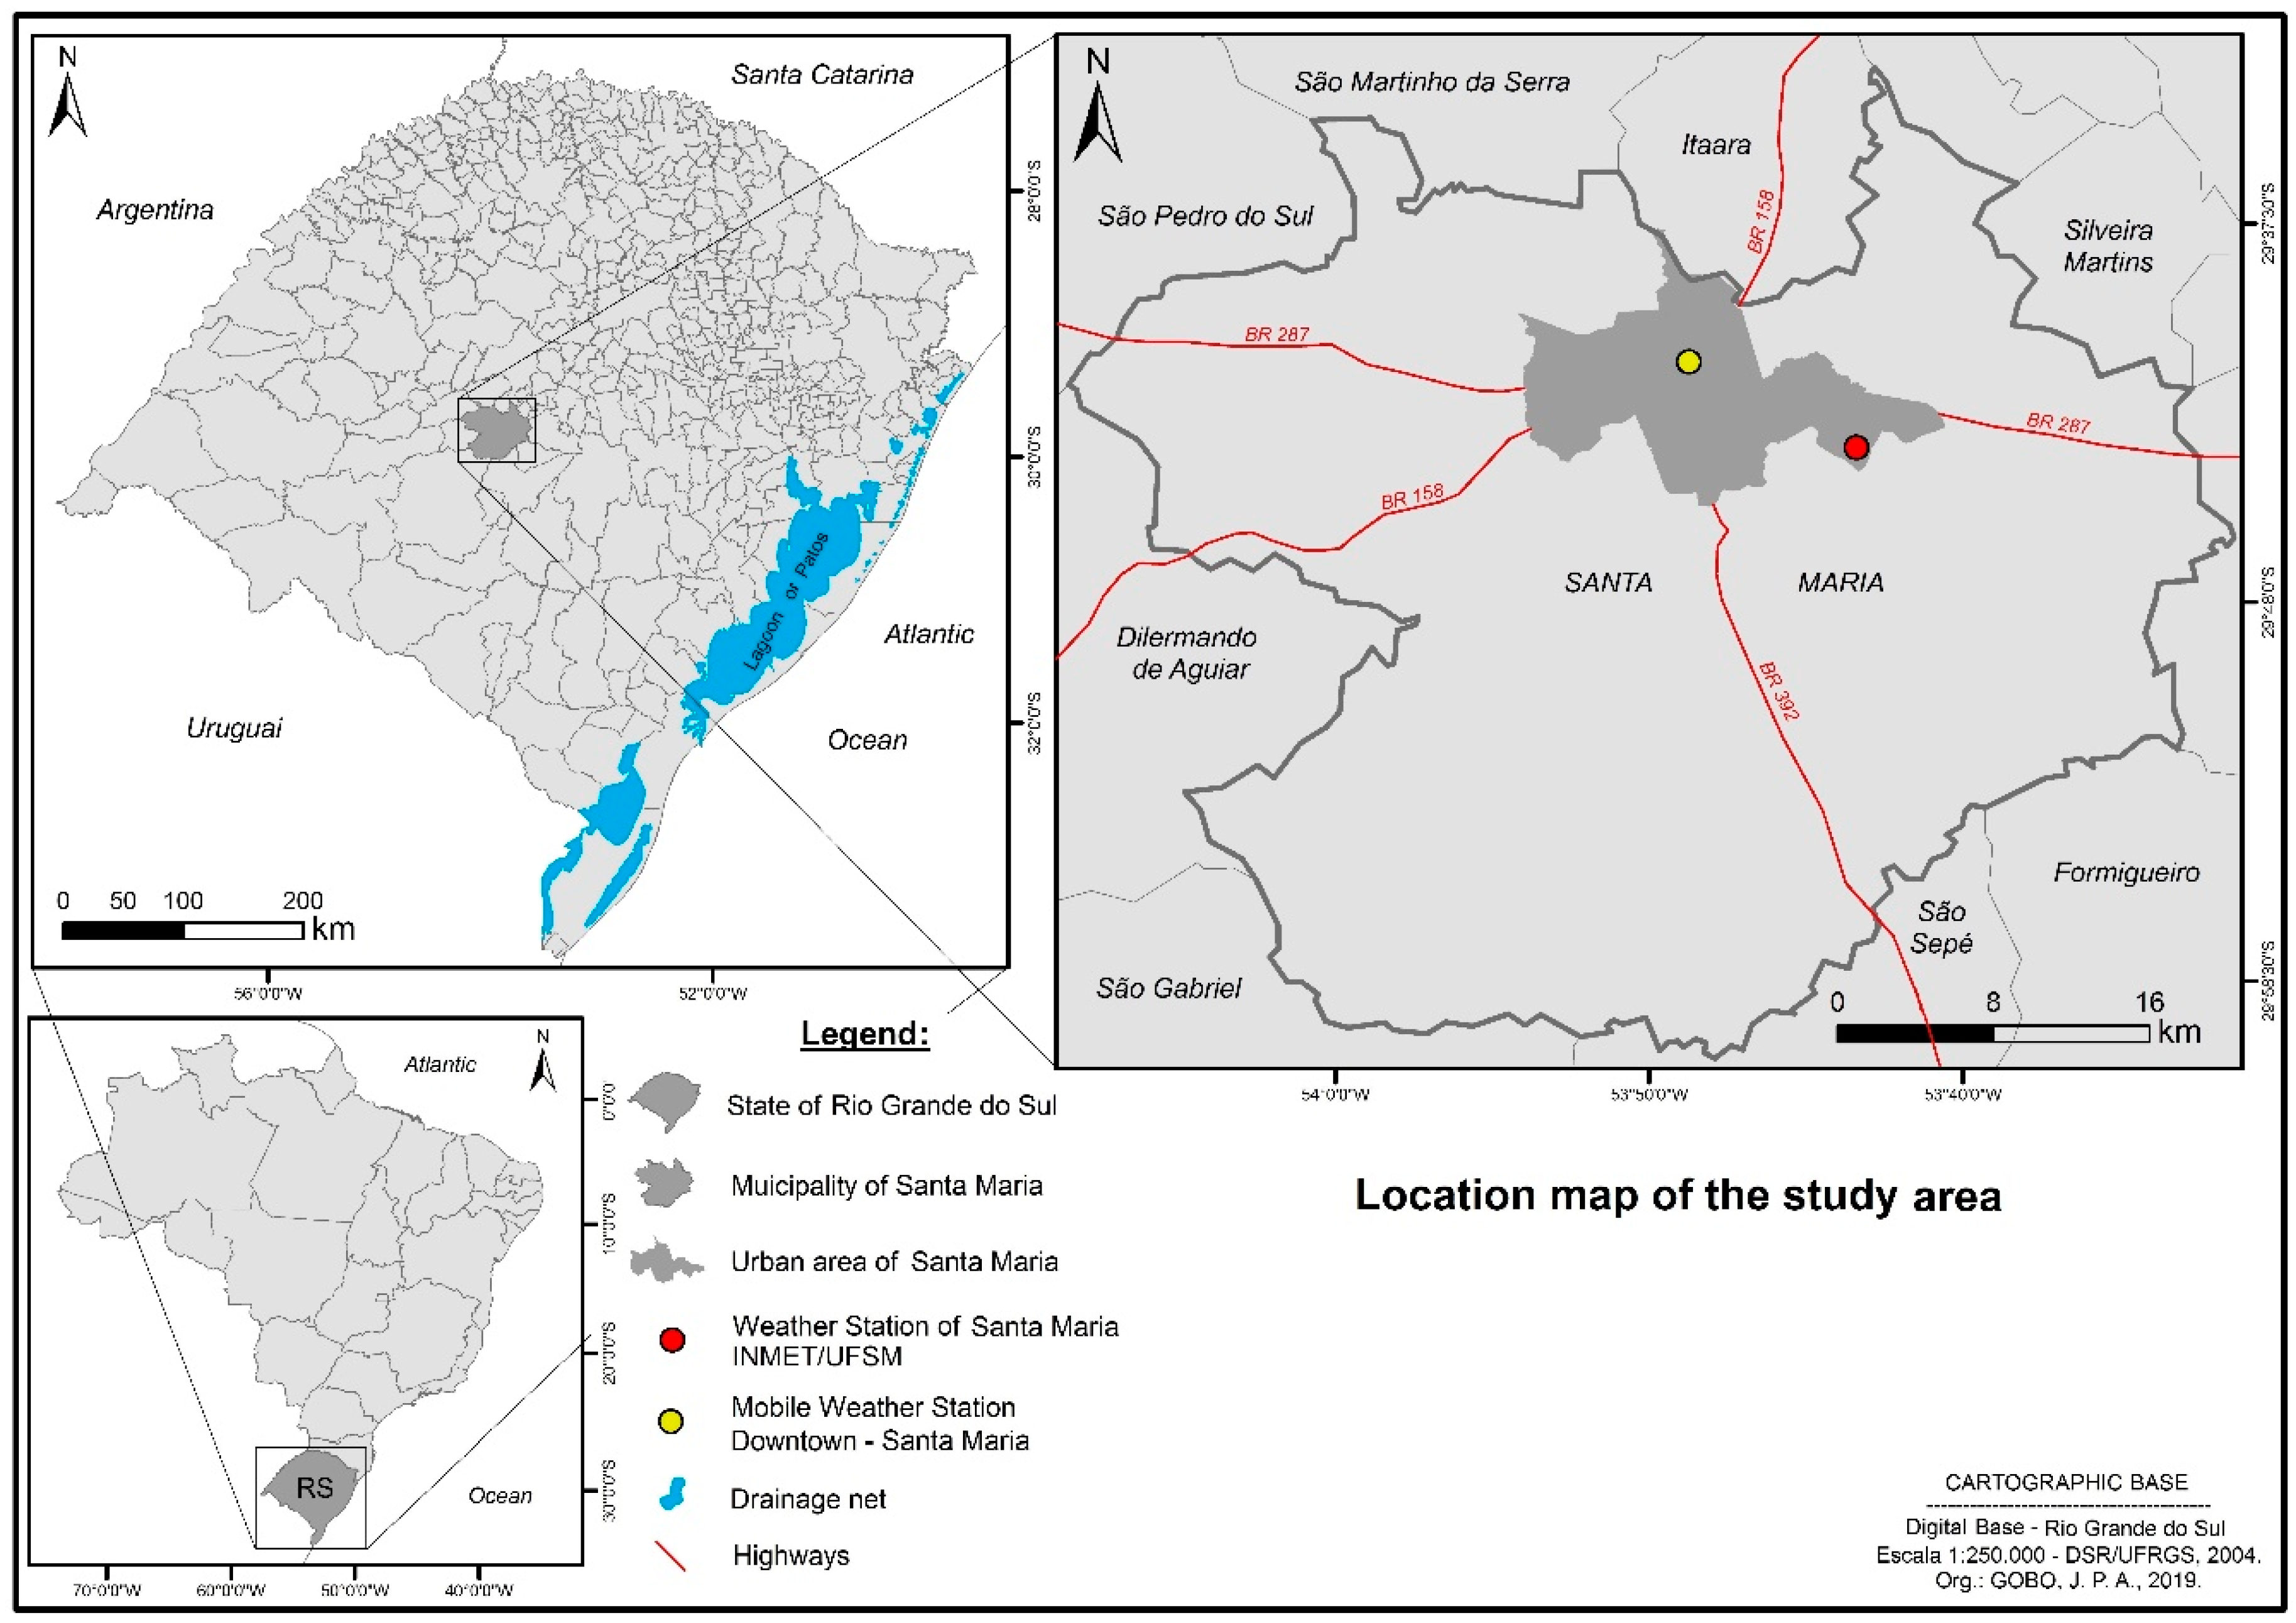
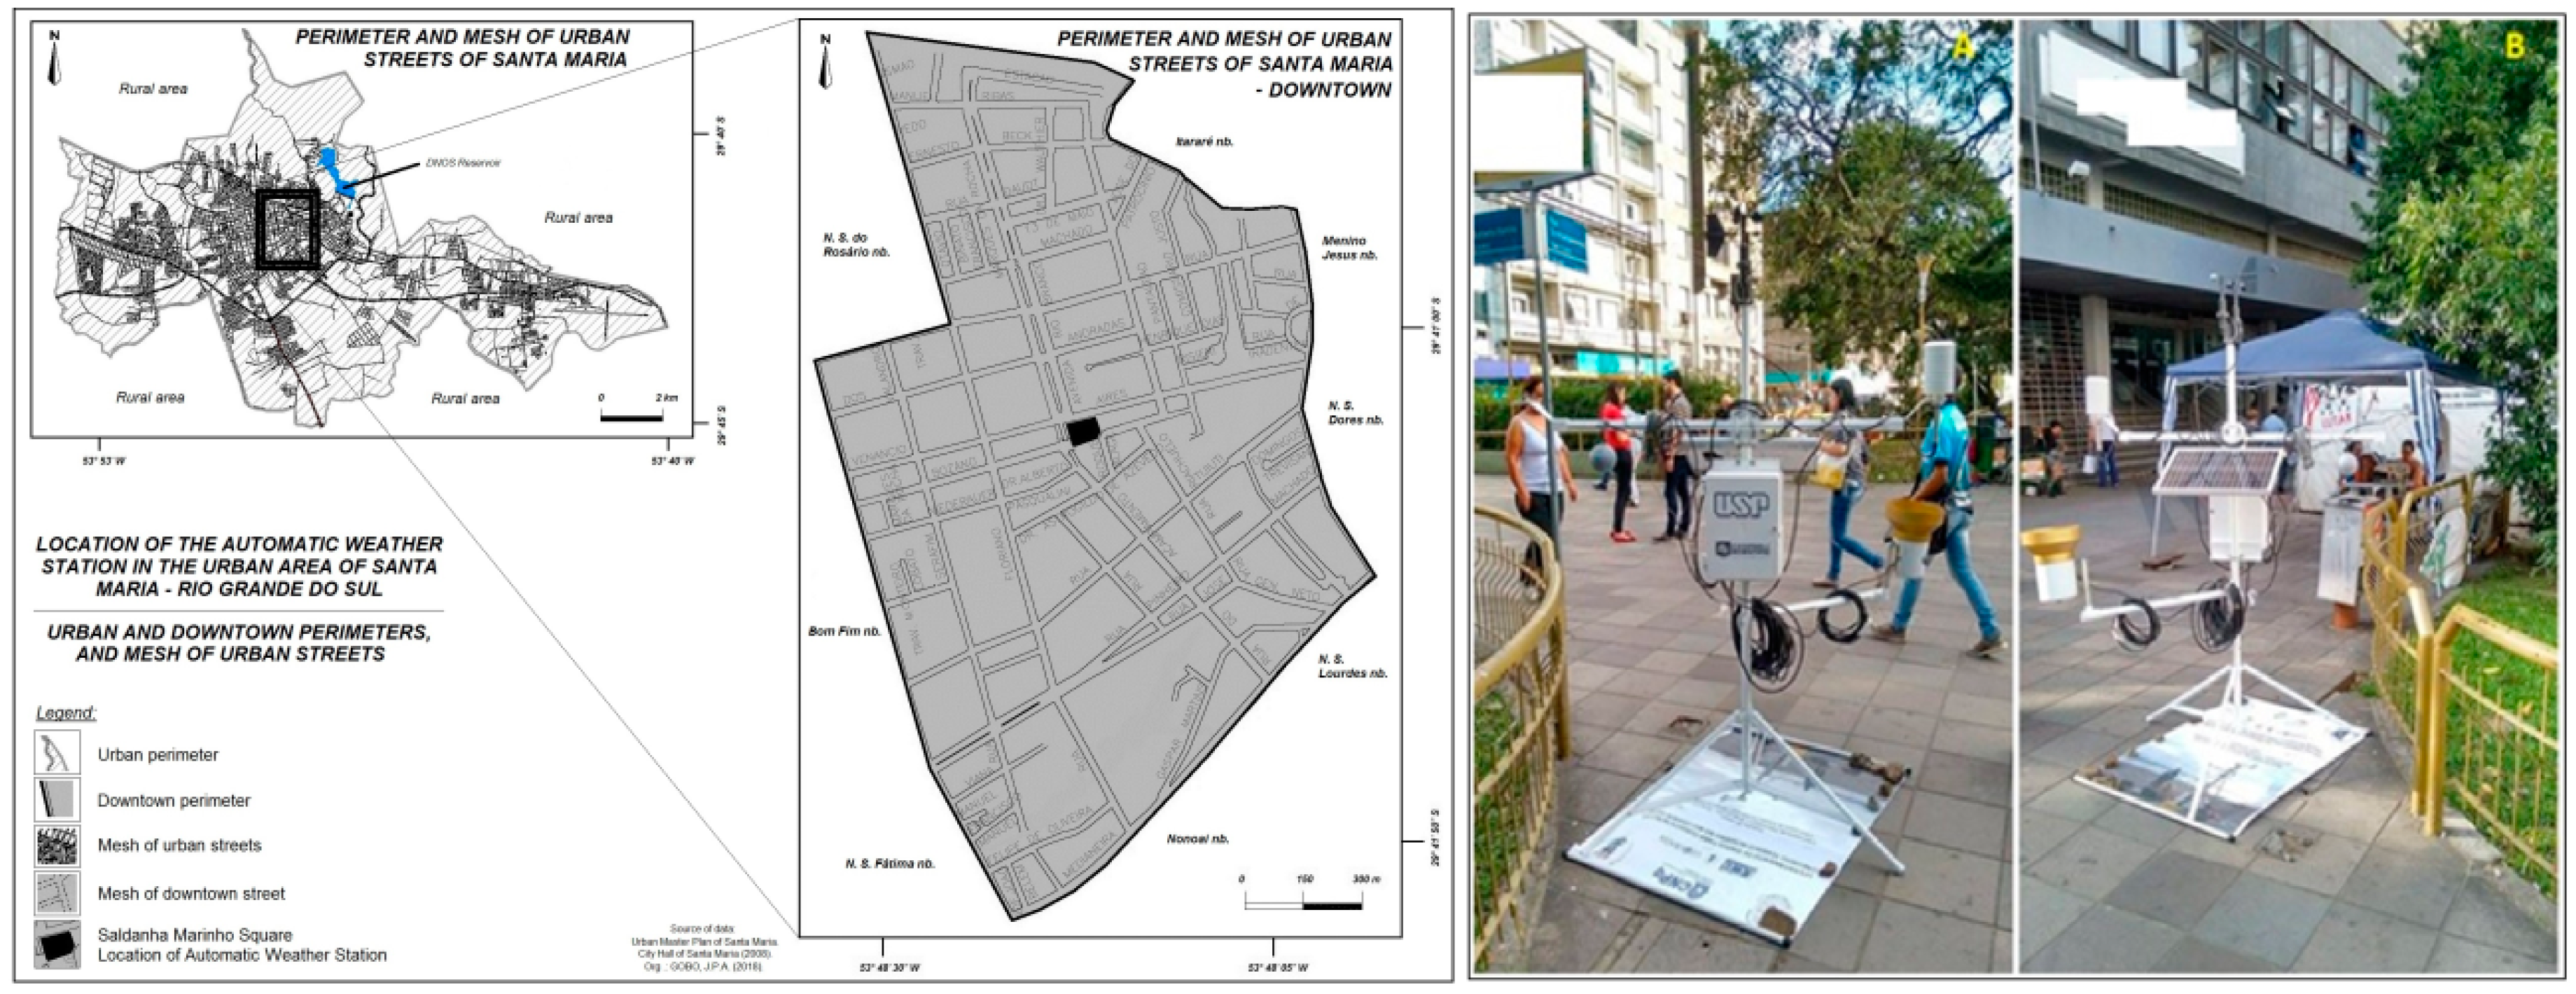
Located in the extreme south of Brazil, the state of Rio Grande do Sul is situated between the geographical coordinates: Latitude 27°04′48″ north, longitude 53°01′53″ North, latitude 33°45′06″ south, longitude 53°23′48″ South (
Figure 2), and has an estimated population of 11,322,895 inhabitants [
70].
The municipality of Santa Maria is located in the geographical center of the state, with a population estimated at 278,445 inhabitants [
70], and is climatically characterized, according to Sartori [
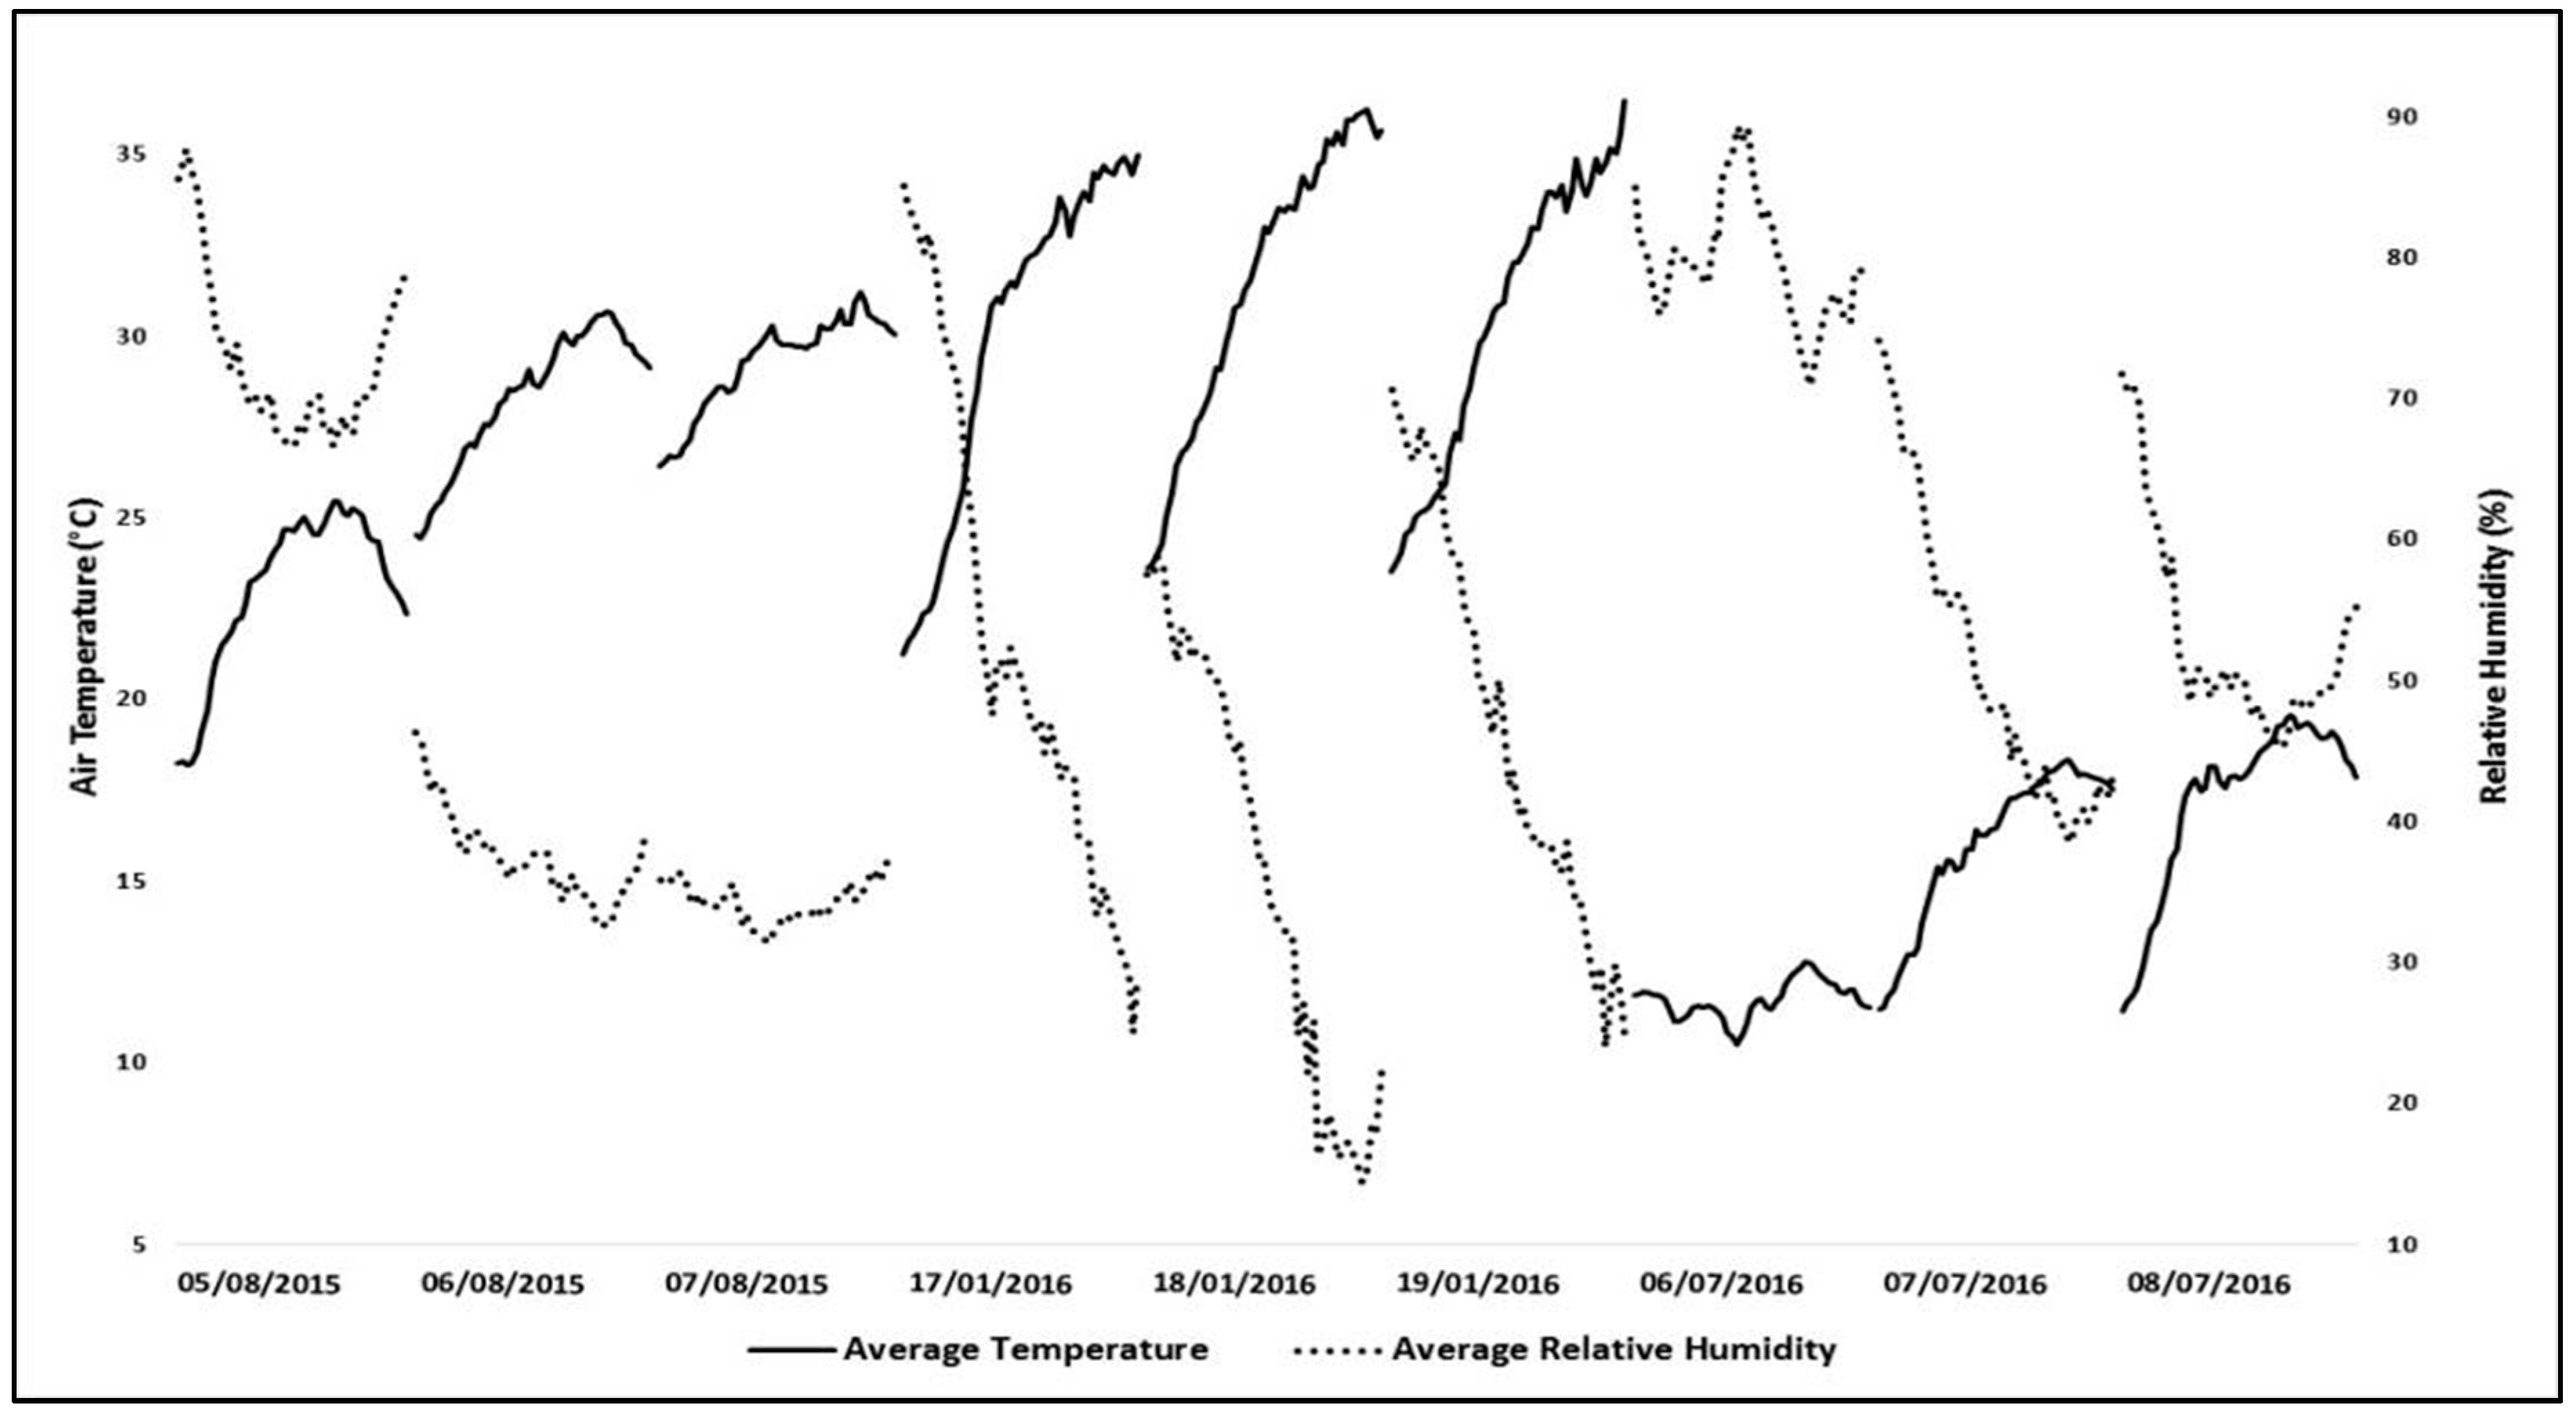
28], whose warmest month (January), with an average temperature above 24 °C and average maximum temperature of 32 °C, and coldest month (July), with average temperatures between 13 °C and 15 °C, and average minimum temperature between 7 °C and 10 °C.
Santa Maria is in the Subtropical climate type, with rainfall ranging from 1500 to 1700 mm per year, distributed in 90 to 110 rainy days, with annual average temperature between 17 °C and 20 °C, with the average temperature in the coldest month ranging from 11 °C to 14 °C and the average temperature in the hottest month ranging from 23 °C to 26 °C [
71]. In terms of general climate classification [
67], the city is classified as type Cfa, with hot and rainy temperate climate, no dry season, hot summer and hottest month with average temperature above 22 °C, coldest month with an average temperature above 3 °C and average air temperature in the hottest four months above 10 °C.
5. Results
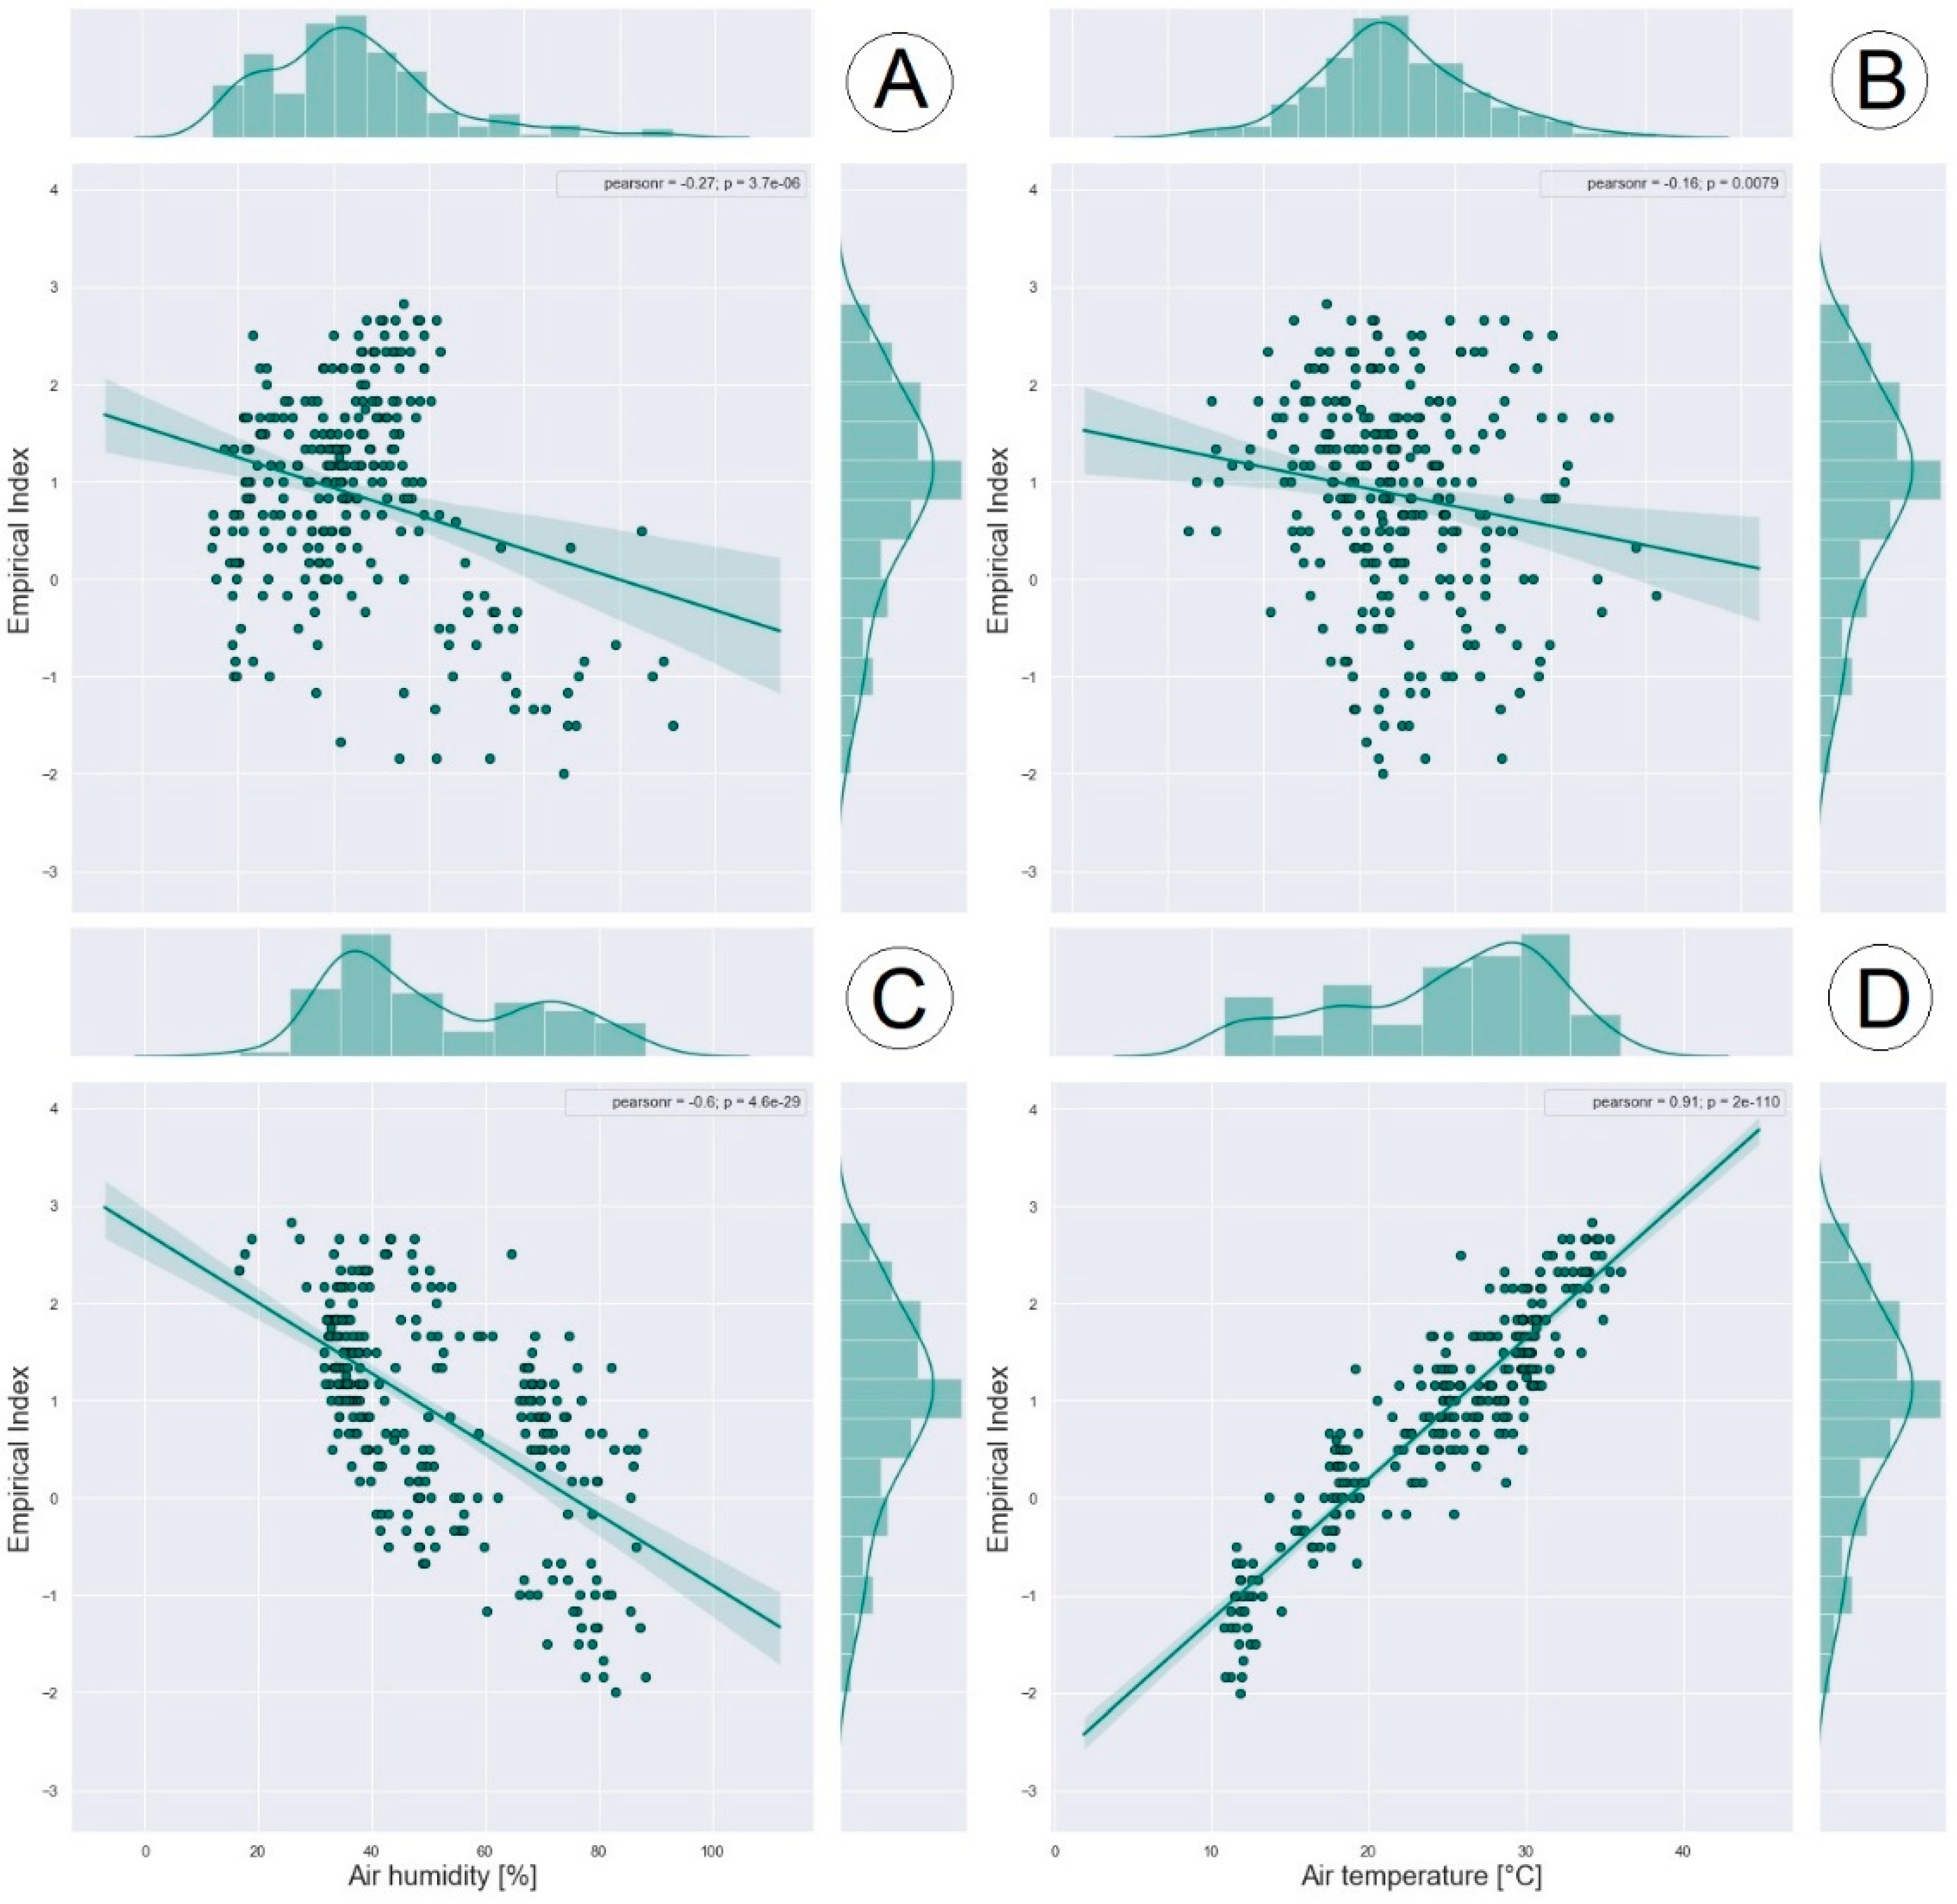
During the execution of the regressions, we tried to evaluate a new proposition of empirical model for two integrated seasonal situations, summer and winter. The correlations between the variables used and the thermal preference of individuals (Empirical Index) are presented on the graph in
Figure 8.
For the described situation, a high positive correlation between the means of the thermal preference votes and the air temperature (Tair), with a value of R 0.91, is observed. The correlation between the Empirical Index and the MRT presented a negative low to moderate R-value of −0.27.
Regarding relative air humidity, the Empirical Index showed a high negative correlation, with R equal to −0.69. The correlation between the Empirical Index and the BMI showed a weak negative correlation, with R equal to −0.16.
Regarding the distribution of the means of the thermal preference votes of the individuals interviewed (Empirical Index) during the period (winter and summer), it was concentrated in two preferred ranges of thermal sensation, −1 to 0 and 2 to 3 (7-point scale [
76]). As well as the means of the thermal preference votes, the average air temperature distribution for this period had two concentration points, between 10 °C and 20 °C and above 30 °C.
The correlation between the air temperature and the relative humidity indicated an R of −0.76, which shows multicollinearity between the variables. In relation to the BMI, the air temperature has a weak negative correlation, with R equal to −0.256, and in relation to the MRT, the correlation with the air temperature is also negative and weak, with R equal to −0.392.
A regression was performed substituting the variable under suspicion for another one that, in theory, would not be affected, but the results of the regression with the absolute humidity variable did not show a significant statistical improvement, and the significance level of the absolute humidity variable (p-value 0.72) is lower than the relative humidity (p-value 0.27).
Thus, the variance inflation factor (VIF) was calculated for the previously selected variables. As stated by Marquardt (1970) [
81], variables characterized by VIF values greater than 10 should be excluded; however, values above the threshold established [
54] are not verified (
Table 3), so it was decided to maintain the relative humidity in the construction of the model.
The relative air humidity presented a positive, but weak, correlation with the BMI, as well as with the MRT, with R equal to 0.0588. The mean relative humidity distribution showed a high concentration, between 40% and 50%, for the analyzed period (January and July), but with a slightly lower concentration between the 65% and 75% ranges.
BMI and MRT presented a weak negative correlation, with R value equal to −0.0992. The distribution of BMI was around 24 and 25, which corresponds to the limit between normal weight and overweight.
Table 4 shows the results of the linear regressions performed for the mean values reached for the situations raised for the general period (summer and winter).
The regression presented high multiple R-squared and adjusted R-squared, 0.928 and 0.925, respectively. The F statistical test, which considers the ratio between the mean squares, presented a high value of 447.6, which confirms that the variables together contribute to the prediction of the independent variable.
Thus, an equation was defined considering the four variables previously presented (Tair, RH, MRT and BMI) correlated for the situations raised and the mean value of perception of thermal sensation verified in each of them (based on the results of the 864 questionnaires applied in January and July 2016). The following equation is proposed:
where
MBCMS = Bioclimatic Model for Subtropical Medium-Sized Cities;
Tair = air temperature (°C);
RH = relative humidity (%);
BMIaverage = average body mass index of respondents;
MRT = mean radiant temperature (°C).
The MBCMS can be defined as a thermal sensation scale based on the average vote of the individuals interviewed during winter and summer, using the 7-point scale (
Table 5).
The model can be applied using temperature values in degrees Celsius (°C), humidity in percent (%) and mean radiant temperature (MRT) in degrees Celsius (°C), as well as the numerical value of BMI given within the scale presented in item 4.1. in which:
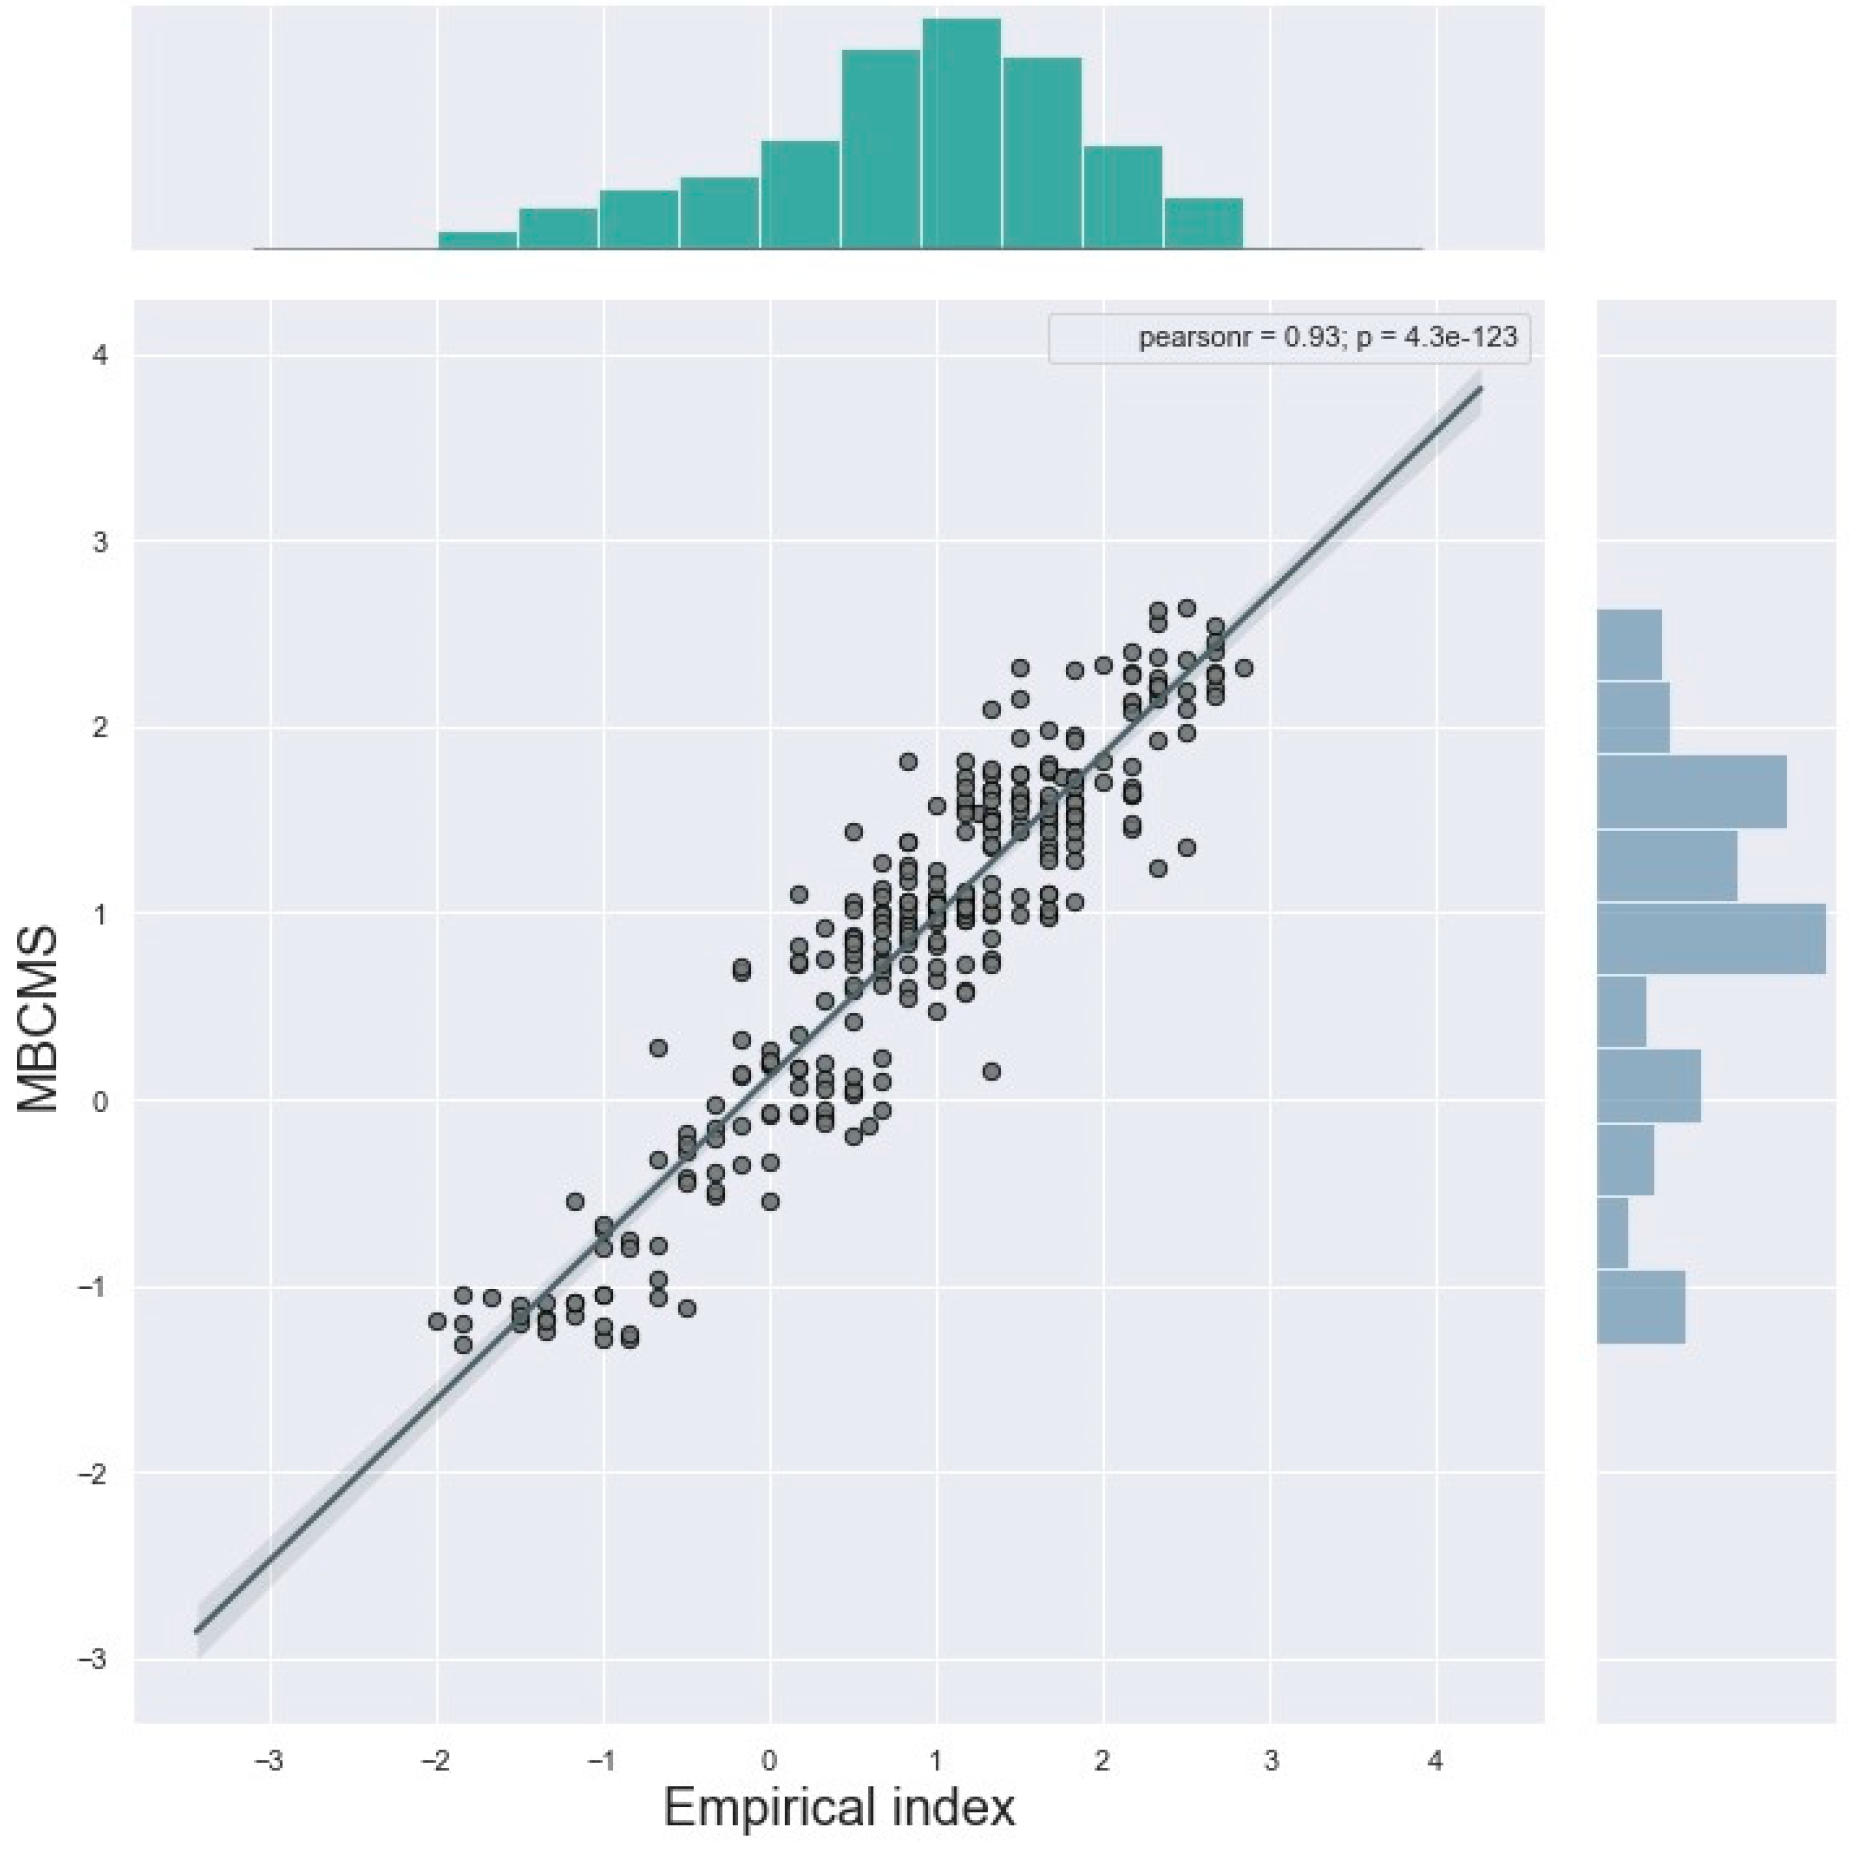
Validation of the Model
After the execution and development of the model previously presented, it is necessary to address their validation process. For such, we used data obtained through the first fieldwork in August 2015.
The correlation between the MBCMS and the thermal sensation responses of the population observed in the field in the period of August 2015 is described in
Figure 9, with R equal to 0.83, showing the efficiency of the model.
The assumptions of linear models, as if the predictors are normally distributed and have equal variances, are verified by Asymmetry, Kurtosis, Heteroscedasticity—obtained by the GVLMA (Global Validation of Linear Model Assumption) package of the R language (
Table 6).
From the approximately 165 thermal indexes developed to date, only 4 (PET, PMV, Universal Thermal Climate Index—UTCI, SET*) are widely used in outdoor thermal perception studies [
82]. Thus, a correlation test was performed between the thermal preference responses (Empirical Index) in the period used for the validation of the MBCMS (August 2015) and the PET [
78], SET* and PMV models calibrated for Santa Maria [
14]. The results are described in
Table 7.
6. Discussion of Results
A very low efficiency of the PET, SET* and PMV models, even when calibrated for the environment in question, was observed when compared to the proposed MBCMS model.
It is important to highlight that the correlations made between the PET, SET* and PMV models and the Empirical Index were only for the validation period of the MBCMS, of August 2015, differently from the period used by Gobo, Galvani and Wollmann (2018) [
14] in the calibration of the mentioned models, in which the whole series of August 2015, January and July 2016 was used.
According to Farajzadeh et al. and Potchter et al. [
13,
82], indexes based on relatively simple formulas presented low correlation with thermo-physiological indexes. The probable reason for this lack of conformity, according to Farajzadeh et al. (2015) [
13], is the lack of radiation factor in the simple equations.
Moreover, in terms of the calculation of these models, PET one is given as the temperature equivalent to the air temperature in which the thermal balance of the human body is maintained, with the core and body temperature. About the situation in question, having the reference climate the average radiant temperature equal to temperature, the air speed equal to 0.1 m/s, partial air water pressure equal to 12 hPa (approximately equivalent to moisture) relative of 50% at TAR = 20 °C). For parameters in the reference environment pet already considers light activity metabolism more 114 W basal metabolism and 0.9 clo thermal resistance [
78].
Finally, in order to calculate the equivalent physiological temperature (PET), calculation of the body thermal conditions (TSK) and body center (TC) temperature through Memi equation systems for a matching of meteorological and individual parameters, as well as inserting skin temperature (TSK) and center body temperature (TC) values in the Memi model, the solar equation system is solved to find air temperature (TAR), and when being found will be the physiological equivalent temperature (PET) [
78].
Such complexity of the PET model is also observed in the calculation of the PMV model, which consists of an estimate of the predicted average vote of an evaluator panel, which is calculated by the method developed by Fanger (1970) [
80] from a heating balance equation for the human body, in which the terms of internal generation and heat exchange with the surrounding environment. The author has established a model of correlation between human subjective perception, expressed by vote in a comfort range from −3 (Very Cold) to +3 (Very Hot), and the difference between generated heat and hot heat human body [
13].
The low efficiency of the PET, SET* and PMV indexes for the analyzed period can be partially explained by the large size of the comfort range of these indexes calibrated by the same authors [
14] for the study area, being 16 °C to 24 °C for PET, 17 °C to 23 °C for SET and −1 to 0.8 for PMV, while [
82], when analyzing the work performed with PET in the Cfa climate type [
67], draws attention to the acceptance of the comfort range of 87% of the case studies between 24 °C and 27 °C and up to 94% of the case studies between 25 °C to 26 °C, which considerably limits the comfort interval for this index.
Using the Spearman correlation coefficient, percentage of correct predictions and cross-tabulation analysis, Golasi et al. [
83] identified the Mediterranean Outdoor Comfort Index (MOCI) as the most suitable index to examine external thermal comfort in the Mediterranean subtropical climate zone, with a total percentage of correct predictions of 35.5%, presenting better performance than PET and PMV.
Golasi et al. (2018) [
59], combining the empirical relationships provided by the existing literature, proposed the Global Outdoor Comfort Index (GOCI), and tested the performance of the index with PMV, PET, MOCI and the Universal Thermal Climate Index (UTCI) [
84], through an experimental field survey conducted in Rome, Italy. The results presented showed a total percentage of 27.8% of correct predictions for GOCI, higher than PMV (27.7%), PET (25.4%) and UTCI (23.0%), but lower than MOCI (32.2%). However, the greater predictive capacity of the latter index is due to the fact that it was specifically aimed at the Mediterranean population.
However, significant results were observed by Ruiz and Correa [
29], in a study conducted in the Metropolitan Region of Mendoza, Argentina, a medium-sized city located in an arid subtropical climate area. The authors point to the fact that none of the indexes analyzed, including PMV and PET, effectively demonstrated what local residents felt. Given these limitations, the authors developed a new model, the “Thermal comfort index for arid zones (IZA)”, which presented a predictive capacity of 73%, very close to that observed in this study for MBCMS, of 83%.
7. Final Considerations
The Bioclimatic Model for Subtropical Medium-Sized Cities (MBCMS), proposed in this research, presented high F-statistic and adjusted R2, showing no pathological behavior that indicated inappropriateness of the chosen model.
The proposed execution of the MBCMS meets a more practical and generalist demand, as it can be used in any season of the year using BMI data, which are easily obtained from the weight and the height of an individual and are not often used in the formulation of empirical models.
The validation of the MBCMS presented relevant results, confirming the high performance of the model, as well as its greater efficiency when compared to the other indexes commonly used in studies for open spaces in the literature. However, the application of this index on a global/regional scale still needs to be tested and better studied, but it opens the way for future studies that promote the improvement and adequacy of this model in order to meet an application demand in subtropical regions.
Thus, like any statistical model, the MBCMS has limitations and, for use in a broader environmental spectrum, calibrating its interpretative ranges is recommended. There is also a need for a larger approach, based on a more comprehensive daily analysis and a wider range of climatic conditions to be tested inside subtropicals climate regions.
More studies are needed on the efficacy of the model introduced in this research for open urban spaces in medium-sized cities in subtropical climate, especially considering more detailed aspects of the characteristics and preferences of the individuals interviewed, such as local demographic distribution, ethnicity, socioeconomic distribution and thermal history, as well as the lifestyle and frequency of air conditioning use, especially in places with well-defined climatic seasons, such as the study area of the present research.

 ,
, 


