Article

The Response of Spring Barley (Hordeum vulgare L.) to Climate Change in Northern Serbia

by
Milena Daničić
1,*,
Vladislav Zekić
1,
Milan Mirosavljević
2,
Branislava Lalić
1,
Marina Putnik-Delić
1,
Ivana Maksimović
1 and
Anna Dalla Marta
3
1
Faculty of Agriculture, University of Novi Sad, Trg Dositeja Obradovica 8, 21000 Novi Sad, Serbia
2
Institute of Field and Vegetable Crops, Maksima Gorkog 30, 21000 Novi Sad, Serbia
3
Department of Agrifood Production and Environmental Sciences, University of Florence, Piazzale delle Cascine 18, 50144 Florence, Italy
*
Author to whom correspondence should be addressed.
Atmosphere 2019, 10(1), 14; https://doi.org/10.3390/atmos10010014
Submission received: 27 September 2018 / Revised: 11 December 2018 / Accepted: 19 December 2018 / Published: 5 January 2019

Abstract

:
The present study assessed the effect of projected climate change on the sowing time, onset, and duration of flowering, the duration of the growing season, and the grain yield of spring barley in Northern Serbia. An AquaCrop simulation covered two climate model integration periods (2001–2030 and 2071–2100) using a dual-step approach (with and without irrigation). After considering the effect of climate change on barley production, the economic benefit of future supplemental irrigation was assessed. The model was calibrated and validated using observed field data (2006–2014), and the simulation’s outcomes for future scenarios were compared to those of the baseline period (1971–2000) that was used for the expected climate analysis. The results showed that the projected features of barley production for the 2001–2030 period did not differ much from current practice in this region. On the contrary, for the 2071–2100 period, barley was expected to be sown earlier, to prolong its vegetation, and to shorten flowering’s duration. Nevertheless, its yield was expected to remain stable. An economic feasibility assessment of irrigation in the future indicated a negative income, which is why spring barley will most likely remain rain-fed under future conditions.

1. Introduction

Global climate change will provoke changes in the agro-ecosystems of Europe in the coming decades [1]. The results from many general circulation models (GCMs) suggest that countries in southeastern Europe, including Serbia, will suffer significant climate change impacts at different spatial and temporal scales in the future [2]. However, the observed frequency of the summer drying issue for the Pannonian lowland region is quite different from the predicted frequency [3]. There are many studies that have confirmed and described climate change in Serbia and its regions through dynamic and statistical downscaling and investigating climate change’s effect on crop yield [4]. Much effort has been put forth to assess climate change’s effect on agriculture on a global scale [5,6]. Nowadays, much more attention is devoted to the impact of climate change on individual regions [7].
The Pannonian lowland covers parts of Austria, Croatia, Hungary, Serbia, and Romania. Northern Serbia (Vojvodina) is of the highest importance for agricultural production in Serbia. In general, the soil and climate characteristics of Vojvodina are favorable for the production of field crops [8]. However, recent studies have indicated this region is significantly vulnerable to the effects of climate change [9]. The climate of northern Serbia is expected to be characterized by droughts, periods of extreme precipitation, and heat waves caused by extreme temperatures [10]. A similar trend is expected in Austria, Hungary, Croatia, and Romania [7,11,12,13]. According to Intergovernmental Panel on Climate Change (IPCC) [14], the intensity of heat waves has significantly increased during the last few decades. Furthermore, in general, climate change is expected to adversely affect all lowland regions with respect to crop yields and alterations in the development and dynamics of growing seasons [4].
Barley (Hordeum vulgare L.) is a secondary small grain crop cultivated in Europe. In Serbia, barley has had an average yield (for the period of the last 10 years) of 3.4 t/ha, which is lower than that in the majority of the region’s countries (3.9 t/ha in Croatia, 3.8 t/ha in Hungary, and 5.1 t/ha in Austria) [15]. According to European Commission (EUROSTAT) [16], barley accounts for 5% of the total cereal production in Serbia, 20% in Austria, 7% in Croatia, and 10% in Hungary and in Romania. However, according to the Gain report [17], the demands for barley as feed and in the brewing industry are constantly increasing, which will affect its market price, especially in Austria, Romania, and Hungary (the countries that import the most barley for the purpose of the brewing industry). Furthermore, the export of barley from Serbia has significantly increased over the past few years [17]. This is the main reason for enlarging the area and potential for barley production in the future.
In most of Europe, spring barley is generally cultivated over a larger area than winter barley. It is well adapted to semi-arid conditions, even though its yield may be severely hindered by dry conditions during the spring and summer months [18,19]. In Northern Serbia, spring barley accounts for approximately 30% of the total barley production, and it is sown on an area of 25,000 ha [20]. According to two climate scenarios (2001–2030 and 2071–2100) that were made for Serbia, spring crops will be more vulnerable to an increased number of crop drying days relative to winter crops. During the spring crop growing season, an increase in the mean annual temperature is expected for 2040 (by 1.1 °C) and 2080 (by 2.3 °C) with respect to the reference period 1985–2005, according to a study by Lalić et al. [21]. Moreover, for the spring crop growing season, the mean annual precipitation in Vojvodina for 2040 and 2080 is predicted to decrease by 540 mm and 528 mm, respectively, relative to the reference period (1985–2005) [21].
Spring barley is grown under rain-fed conditions in Vojvodina. However, concerning the above-mentioned climate scenarios, which predict a decline in precipitation and increases in mean air temperature in the future, a moderate irrigation practice may become favorable among producers and farmers. The extreme weather events that commonly occur during spring barley’s growing season, particularly during the phase of grain filling, are drought and high temperature. These two factors render spring crops more sensitive to cultivation than winter crops [22,23]. Irregular distribution and low precipitation are general markers of regions that strongly depend on precipitation in the winter and spring. They carry high risk and may alter production over different cropping years [21].
With the use of crop simulation models, crop growth and yield may be simulated, which allows farmers and producers to plan and adjust management practices. The crop productivity in rain-dependent agriculture may be low, and depends on the amount and distribution of precipitation. This makes production practices and increases in rain of high importance to productivity [24].
Crop growth models are used to simulate the yield of different plant species [25,26,27]. In addition, the AquaCrop model has been successfully applied to the simulation of yield and other parameters that are related to water (water productivity, fresh biomass) for different crops [24,28,29]: A high accuracy for the model has been reported. The most reliable method for determining water and temperature stress in crops is an evaluation of the dry yield and duration of the growing season of a crop in irrigated and rain-fed conditions [30].
Since air temperature and drought are the main factors that limit agricultural production in Serbia and the entire Pannonian lowland, the FAO (Food and Agriculture Organization) AquaCrop model was selected to simulate the effect of an air temperature change on the growing season’s duration, the time of sowing, the onset and duration of flowering, and the yield for two climate scenarios (2001–2030 and 2071–2100) with respect to the reference period (1971–2000) and observed climatology for the period 2006–2014 in Northern Serbia (Vojvodina).
The simulation was done using a dual-step approach, with and without supplemental irrigation. Since it is often questionable as to whether irrigation is economically justifiable in Serbia, the present research analyzed the economic feasibility of the expenses of the predicted irrigation in two projected scenarios.

2. Methods

2.1. Experimental Design

The results of an eight-year field experiment with barley (2006, 2007, 2008, 2009, 2010, 2011, 2013, and 2014) were used to calibrate and validate the model. During these growing seasons, spring barley was cultivated on the 10 m2 plots with three replications. The experiment was set up in the north of Serbia (Vojvodina) (45°20′ N, 19°50′ E, 84 a.s.l.), which is the most important crop production area of Serbia. The climate is moderate continental with a mean annual temperature of 11.5 °C and mean annual precipitation of 647 mm (for the reference period 1981–2010). Very high temperature and precipitation variations have been recorded, especially during spring. This variability is often expressed through excessive precipitation and an increased intensity of hot and dry periods [4]. The chemical and physical characteristics of the soil in which the barley was grown were described by Stričević et al. [8]. The soil’s hydrological properties are given in Table 1.
Meteorological data were monitored during the eight years of the experiment by the Rimski Šančevi weather station. The maximum (Tmax), minimum (Tmin), and average daily temperature (Tave), the daily relative humidity, and the daily precipitation were used as weather input data in the AquaCrop model’s calibration and validation.
Spring barley (Hordeum vulgare L. cv. Viktor) is a two-rowed malting barley cultivar that is highly appreciated for its tolerance of a lack of moisture in the soil and tolerance of diseases [19]. The average grain yield for the eight years of the experiment was approximately 5.6 t/ha. The optimal air temperature for emergence was 5–6 °C. Optimal temperature for flowering and fertilization was 15–20 °C. Air temperatures below 5 °C and above 25 °C significantly decreased the efficiency of flowering and fertilization [20].

2.2. Climatology Prediction

For the purposes of the simulation, climate data for 2001–2030 and 2071–2100 were obtained from dynamic downscaling of climate simulations that were conducted with the atmospheric general circulation climate model (ECHAM5), coupled with the Max Planck Institute Ocean Model (MPI-OM) [31]. The downscaling of the GCM climate simulations were performed with the coupled regional climate model EBU-POM (Princeton Ocean Model) [2]. Further details about climate change’s expected impact on the Serbian climate and shifts in climate zones can be found in Mihajlović et al. [32]. The complete set of the climate input data that was used in the AquaCrop simulations for one location consisted of daily solar radiation (J/m2) data, daily maximum (Tmax), minimum (Tmin) and average (Tave) temperature data, daily average precipitation (mm) data, vapor pressure (mbar), and wind speed (m/s) data. The projected atmospheric CO2 concentration was pre-defined in AquaCrop (the Mauna Loa default atmospheric CO2 concentration from 1902 to 2099). Prior to the barley growing season and yield analyses, an analysis of future shifts in air temperature was performed for the two future scenarios. To assess the extent of the air temperature changes, the projected scenarios were compared to the baseline climatology for the period 1971–2000. The baseline meteorological data were obtained from the database of the Serbian Republic’s Hydrometeorological Service.

2.3. Model Calibration and Validation

The FAO AquaCrop model version 5.0 (Rome, Italy) [33] was used in the present study to simulate the sowing time, the onset and the duration of flowering, the growing season’s overall duration (from sowing to maturity), and the average yield (kg/ha) of spring barley under two projected climate scenarios (2001–2030 and 2071–2100). The simulation was performed under rain-fed and irrigated conditions. The model contained predefined parameters that were suitable for the simulation of barley growth. Some of these parameters were adjusted to local conditions and the investigated cultivar (Table 2). AquaCrop was initially calibrated using the measured crop growth variables (Table 3). Data related to crop development derived from field experiments (2006–2014) (Table 4). The first three years of experimental data (2006, 2007, and 2008) were used to calibrate the model, while the data for the remaining years (2009, 2010, 2011, 2013, and 2014) were used to validate the model.
The growth stages of spring barley that were used to calibrate the model were expressed by the sowing dates (as recorded in the field). However, in the prediction of future scenarios, barley’s growth stages were expressed by the growing degree-day (GDD), with a minimum 10 °C threshold of average air temperature over three consecutive days. Irrigation was not considered during the calibration and validation (since the eight-year field experiment was conducted under rain-fed conditions), and neither were specific field management practices. A groundwater table was set up to 2 m. The initial soil water content was set to field capacity. A heat stress effect of 35 °C on crop development was also specified in AquaCrop [34].
One of the aims of the present study was to establish whether irrigation in the future can improve the average yield and production of spring barley. Therefore, in the second step of testing the model, net irrigation was set up in the flowering phase, as this phase is considered to be the most sensitive to drought and high temperatures [35]. The need for irrigation was assessed on the bases of the air temperature and water stress that were recorded in the output of the simulation runs. The threshold for adding supplemental water was 60% water stress on the canopy’s expansion and stomata closure, which was usually recorded during the crop’s flowering in the summer months. The average supply of water was calculated for the two projected scenarios.
In addition, an economic evaluation of the irrigation costs was performed. A calculation of the value of barley production was performed on the basis of the average purchase price and the average euro exchange rate over the last 6 years. The calculation of the predicted income provided by the irrigation of barley in the two climate scenarios (2001–2030 and 2071–2100) was done in addition. Variable costs were calculated based on the irrigation rate given by AquaCrop. Furthermore, a potential irrigation system for barley was proposed.
To assess the extent to which the field-observed barley grain yields corresponded to the output of the AquaCrop simulations, three statistical analyses were performed in Microsoft Office Excel: The correlation coefficient (R2), the root mean square error (RMSE), and the mean square error (MSE). In addition, the relative standard deviation (RSD) and the coefficient of variation were calculated for the validation years.

3. Results

3.1. The Model’s Calibration and Validation

By the use of the observed crop data (Table 3 and Table 4), AquaCrop was calibrated for spring barley under rain-fed conditions. The correlation coefficient between the observed and calculated yield that was used for the model’s validation (Table 5) was 0.88. This result was strongly affected by data that were obtained in 2014, in which the simulated yield was 14% higher than observed yield due to heavy rain during May 2014 (barley’s flowering stage) and the fact that crop models commonly are not able to reproduce the full extent of the impact of extreme weather events. The correlation coefficient after the exclusion of the wet year (2014) was 0.94. In addition, the experimental years that were used in the model’s calibration and validation were not typical in terms of meteorological conditions, since extreme drought periods occurred in 2007 and 2011, and heavy rain occurred in 2014. Therefore, the average yield of barley obtained during the experimental years was compared to the average yield of the baseline period (1971–2000), since this historical period was found to be more suitable in terms of describing the typical climatology of the region. Growth stages expressed through the GDD in the 1971–2000 period corresponded more to the sowing dates that were used in the model’s calibration. The average yield for the period 1971–2000 was 9% higher relative to the period 2006–2014. Thus, in further analysis of vegetation dynamics and the average yield, only the baseline period was considered together with the projected scenarios. The obtained RMSE and MSE of the validated values (Table 5), as well as the RSD and coefficient of variation (Table 6), confirmed that the model’s performance in simulating grain yield was very good.

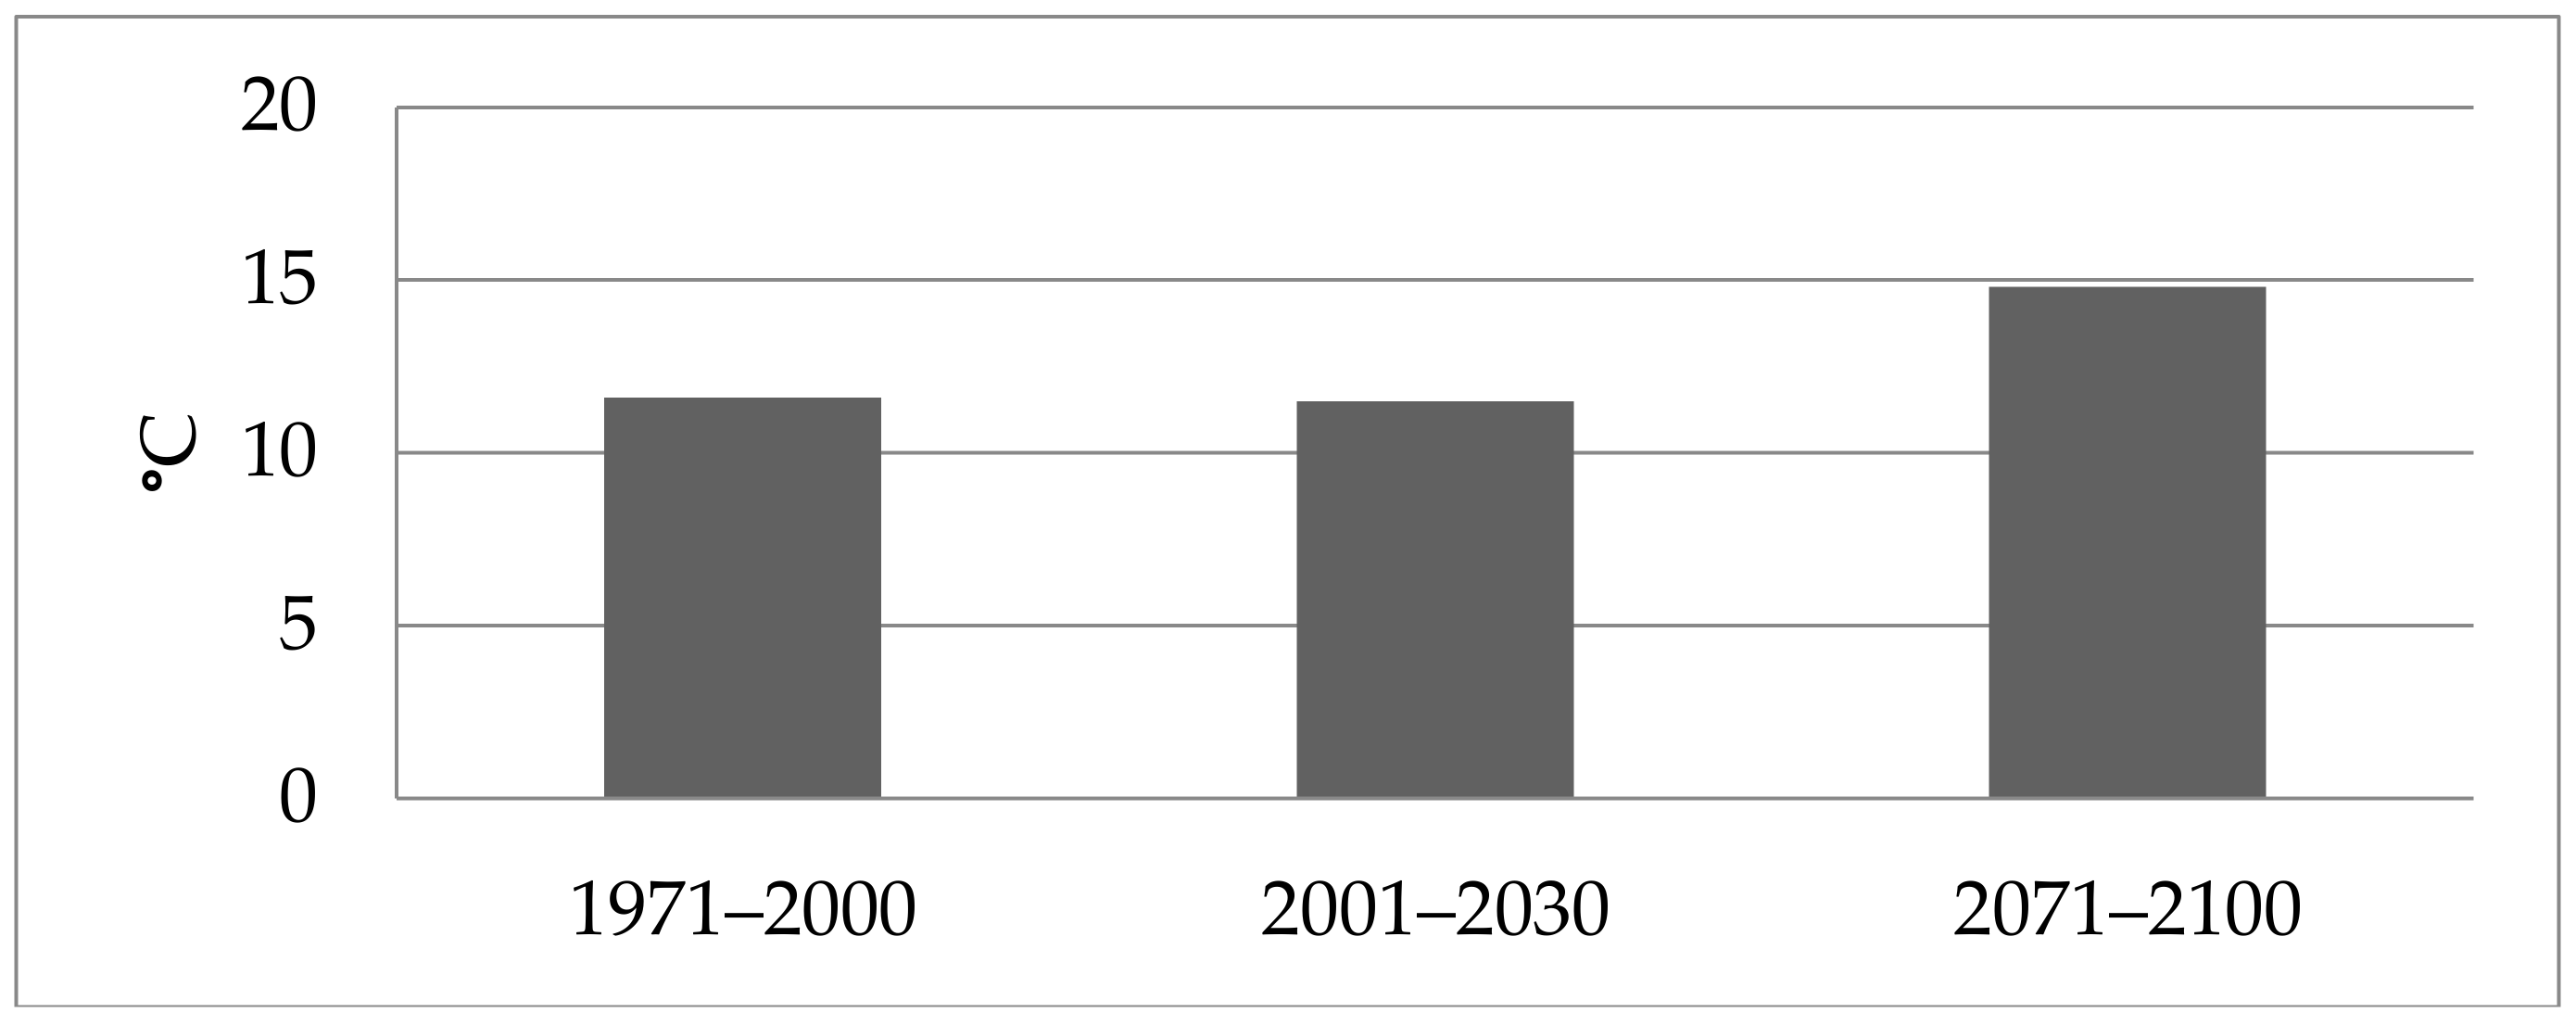
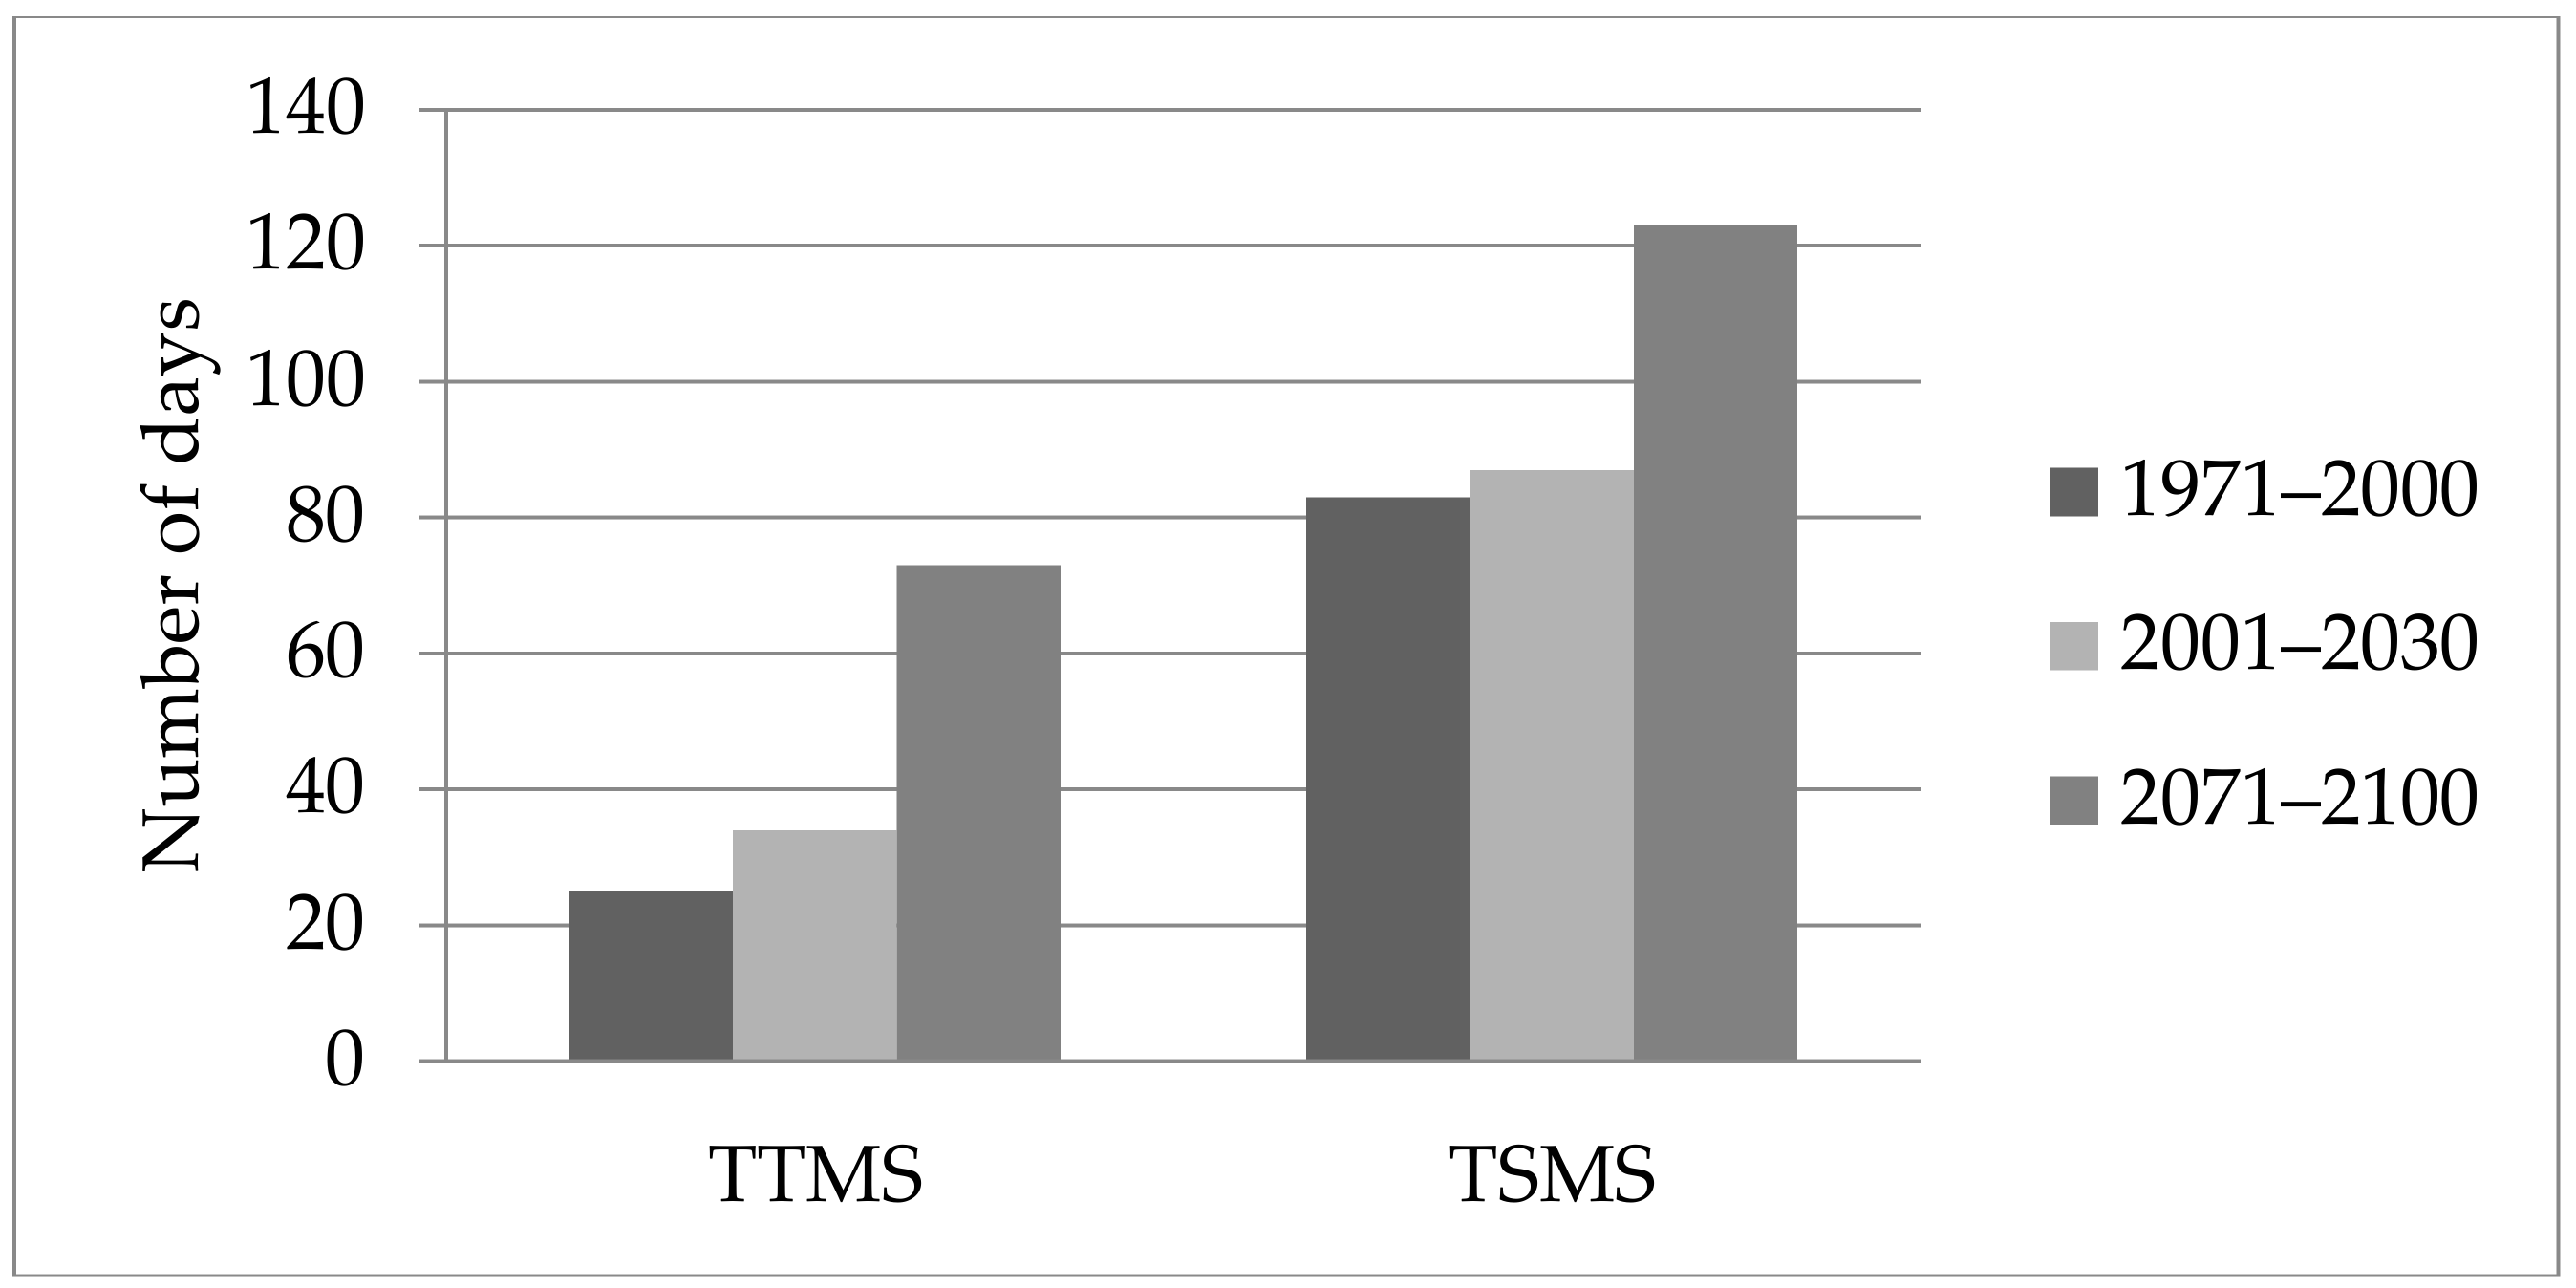
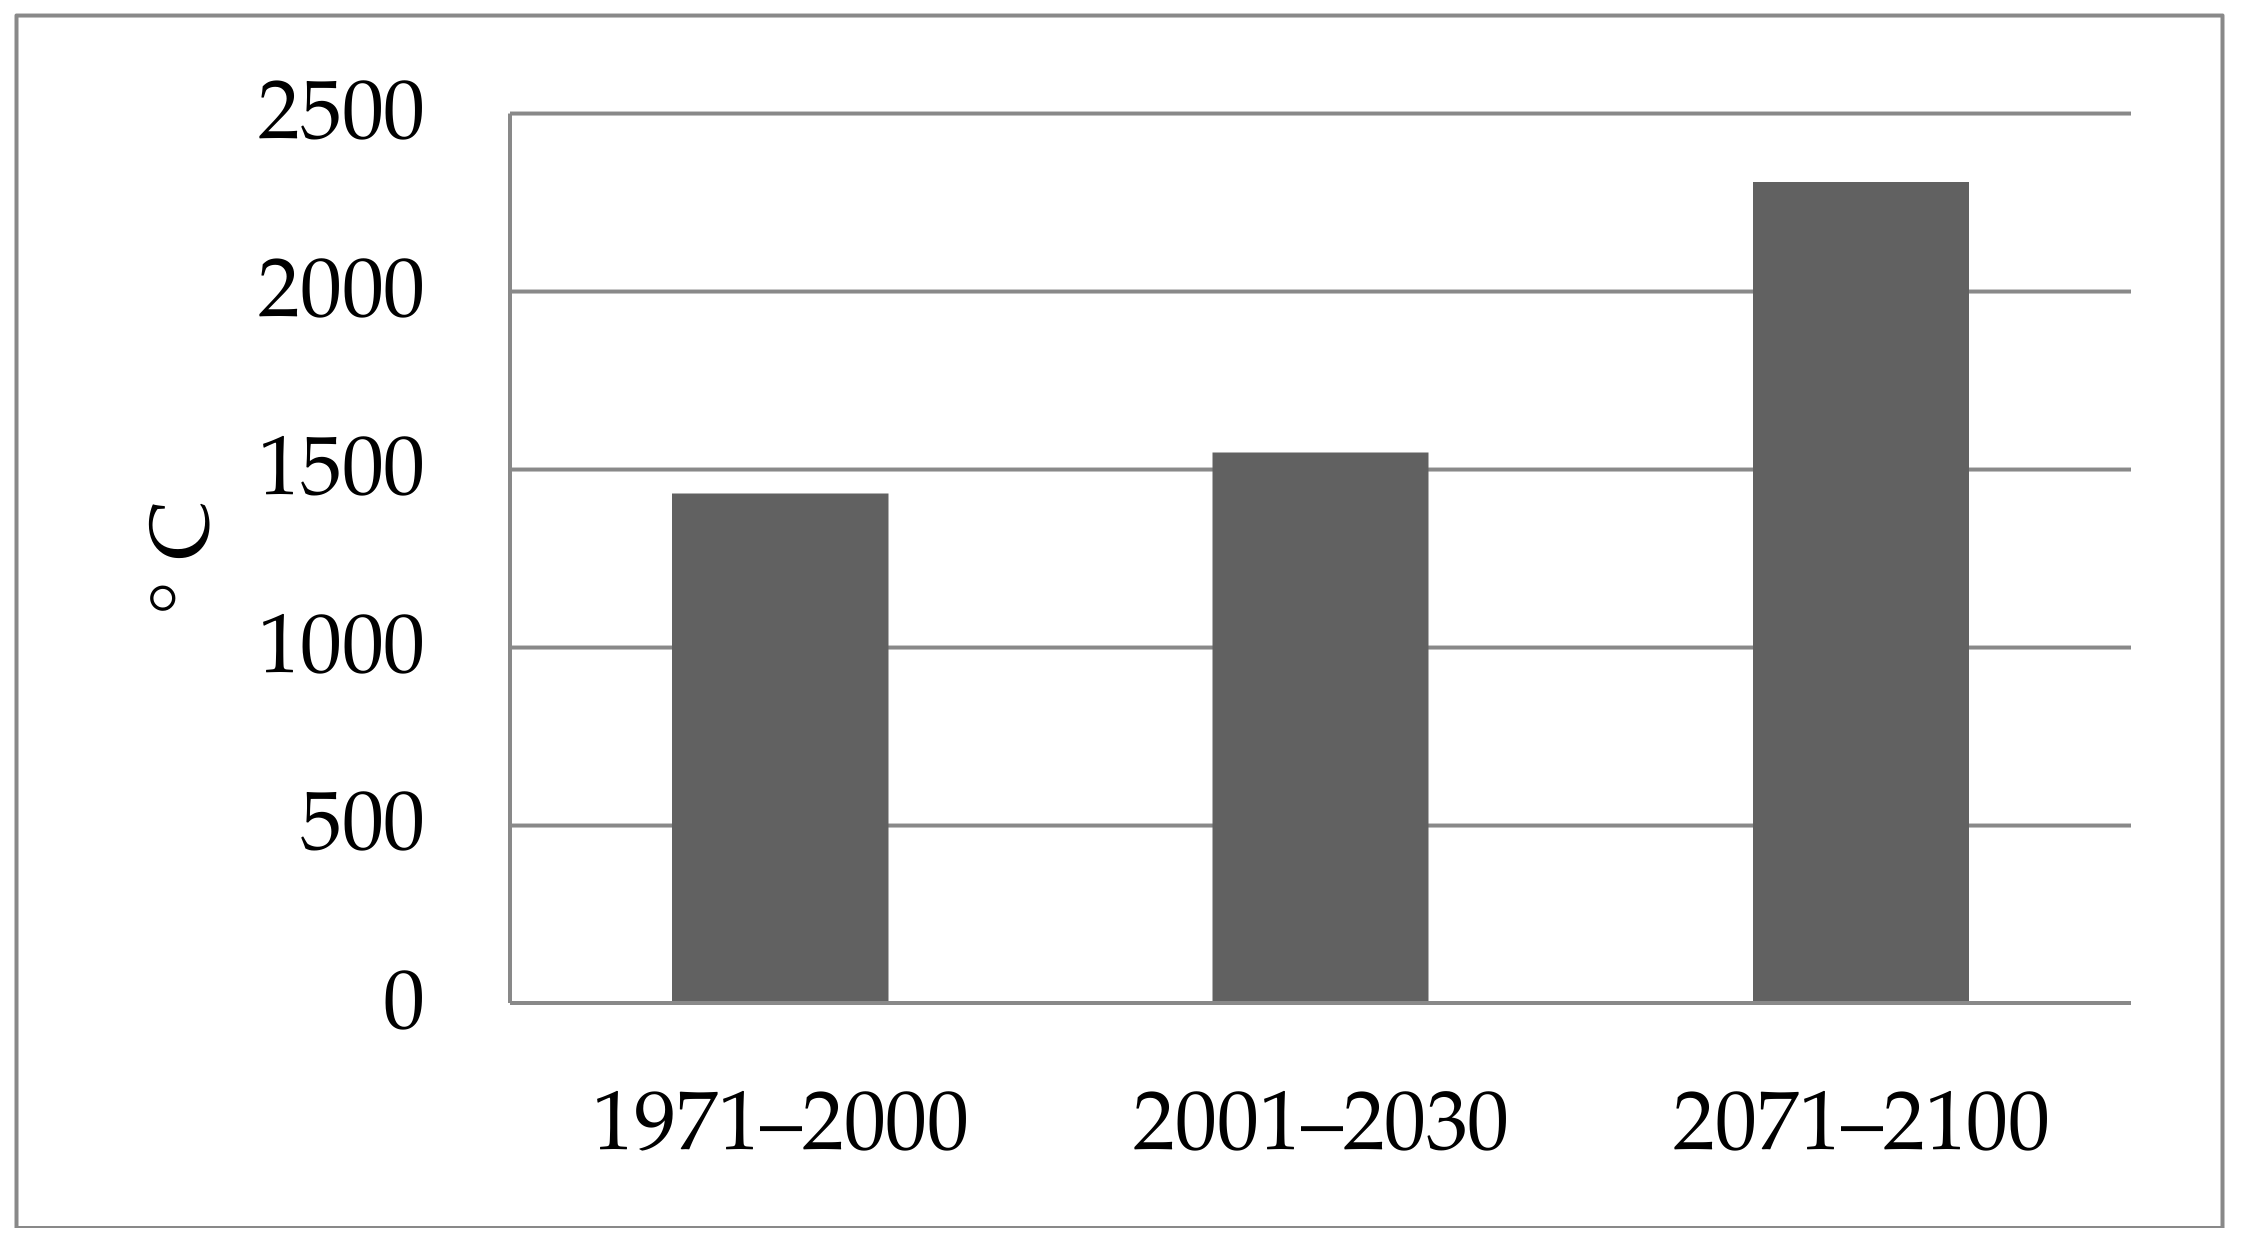
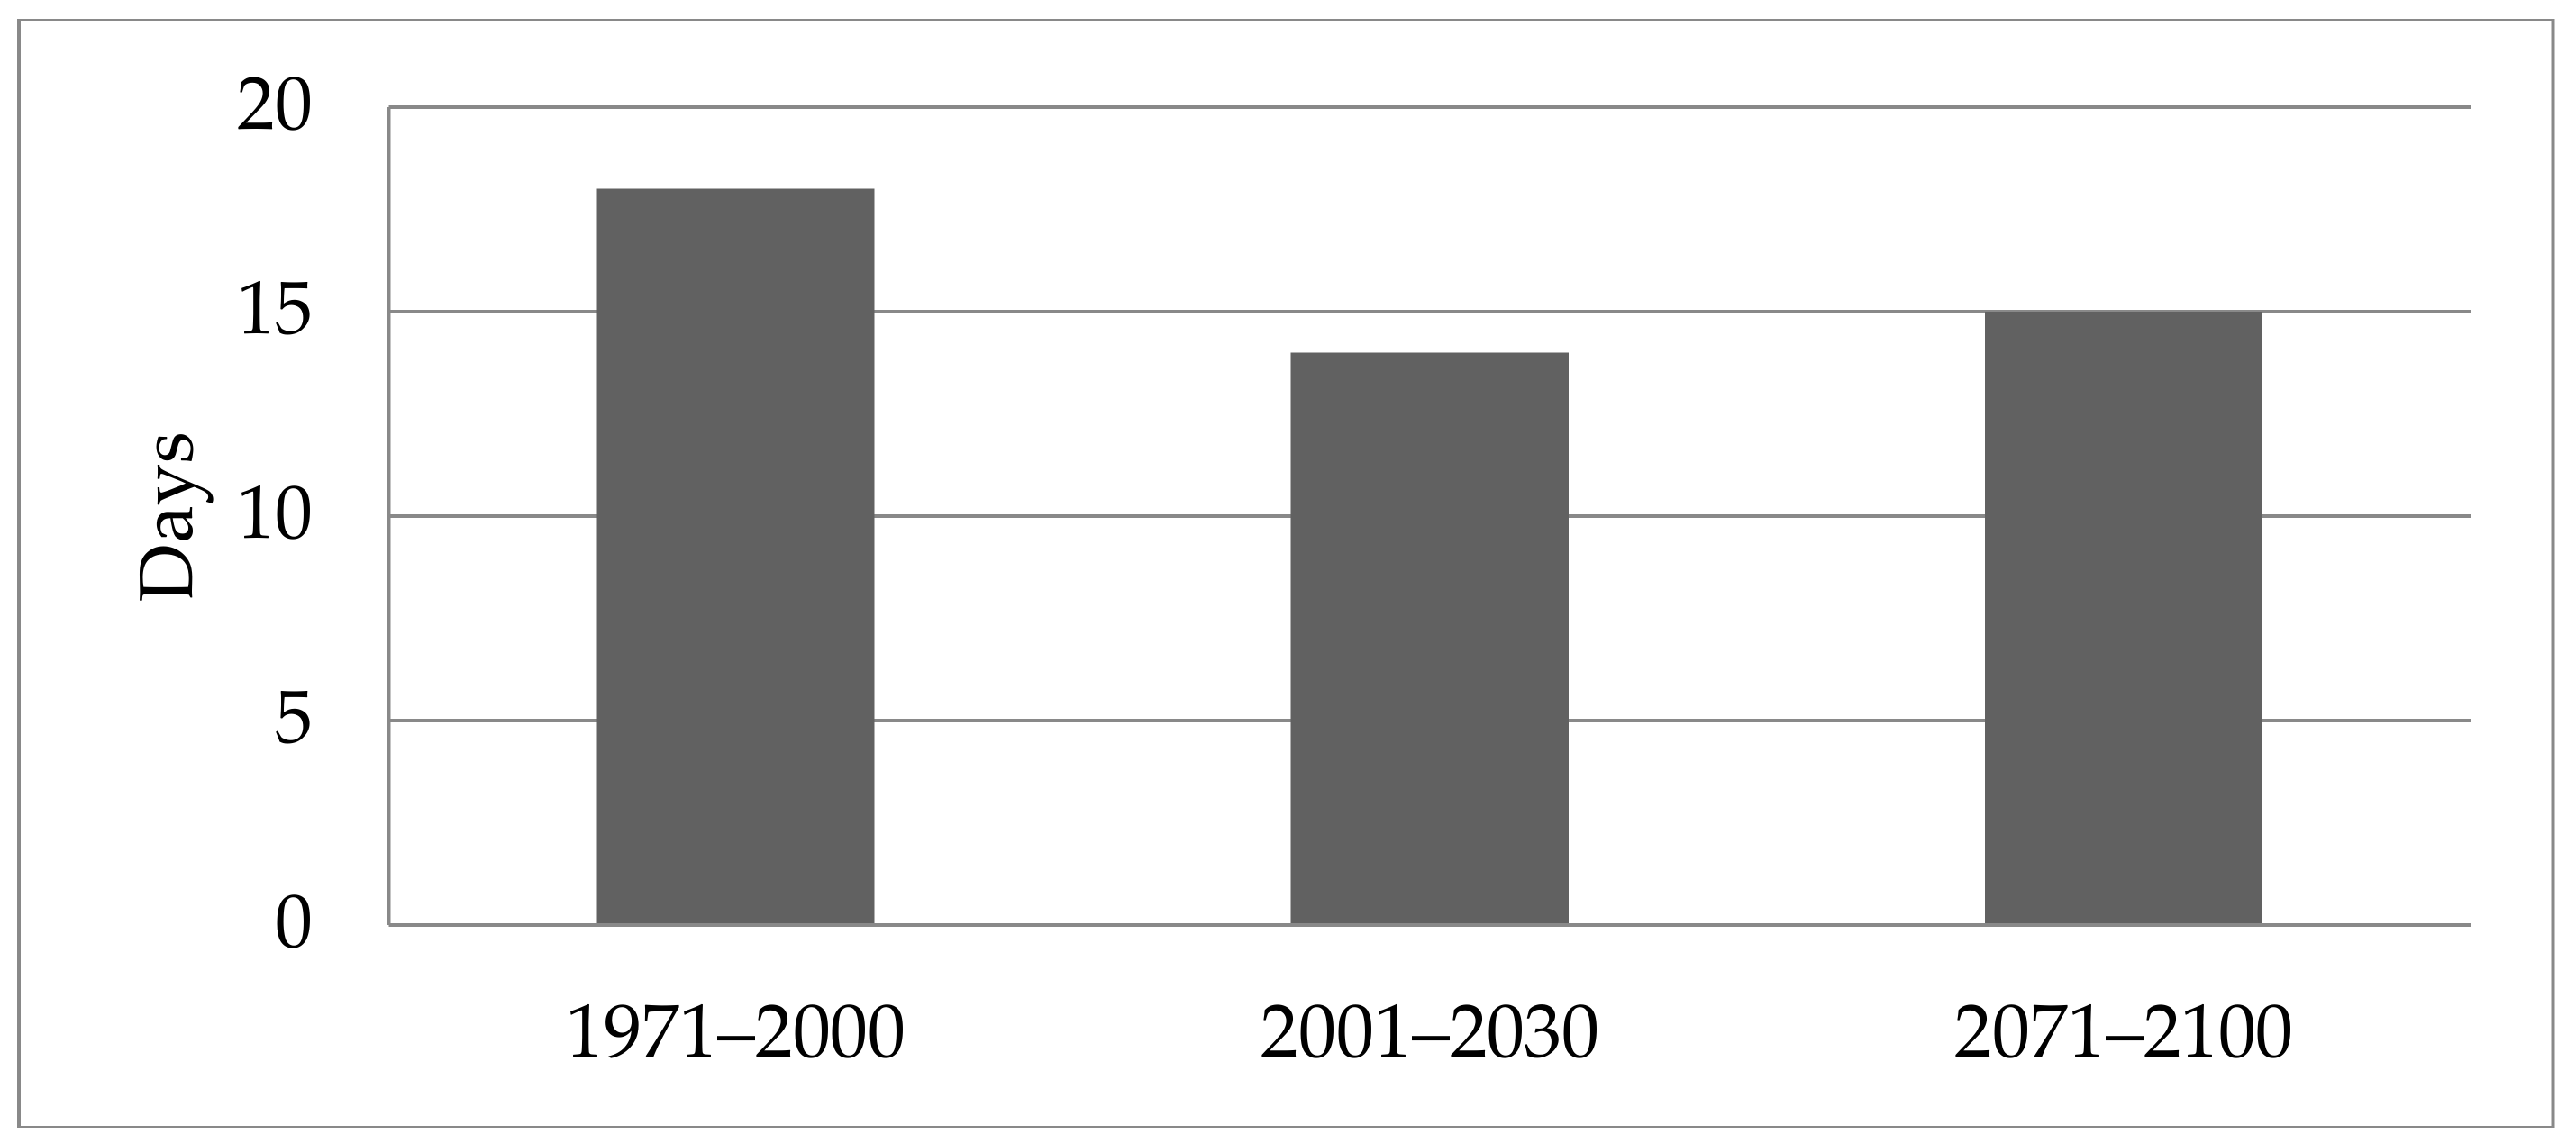
3.2. The Expected Air Temperature Shifts During Spring Barley’s Growing Season

The observed weather data values (for the baseline period) and the ones obtained by downscaling for the future (2001–2030 and 2071–2100) were used to calculate the mean air temperature in months during which barley’s phenological stages are the most sensitive (March, April, and May) (MAM) (°C) in order to assess expected changes in barley’s growing dynamics in the future. Furthermore, the total number of summer days (days in which the air temperature is above 25 °C) (TSMS), the total number of tropical days (days in which the air temperature is above 30 °C) (TTMS), and the sum of air temperatures above 10 °C were selected and calculated as the main indicators of alterations in crop vegetation and yield [36]. Particularly, in May and June, these can be indicators of extreme weather events, such as droughts and heat waves [36].
No significant difference in mean air temperature during MAM between the baseline period and the 2001–2030 period was found (Figure 1). On the contrary, in the 2071–2100 scenario, the mean air temperature was expected to increase by 22% relative to the baseline period.
According to the future climate scenarios, the number of TTMSes and TSMSes were expected to increase significantly with respect to the baseline period. An increase in the total number of tropical and summer days in May was expected by 54% and 30% for 2001–2030 and 66% and 33% at the end of the 21st century, respectively, relative to the baseline period (1971–2000) (Figure 2).
The sum of temperatures above 10 °C was likely to increase in the future over the baseline period (Figure 3). It is significant that, in the 2071–2100 scenario, the estimated increase over the baseline period was above 30%, whereas in 2001–2030 it was 8% relative to the baseline.

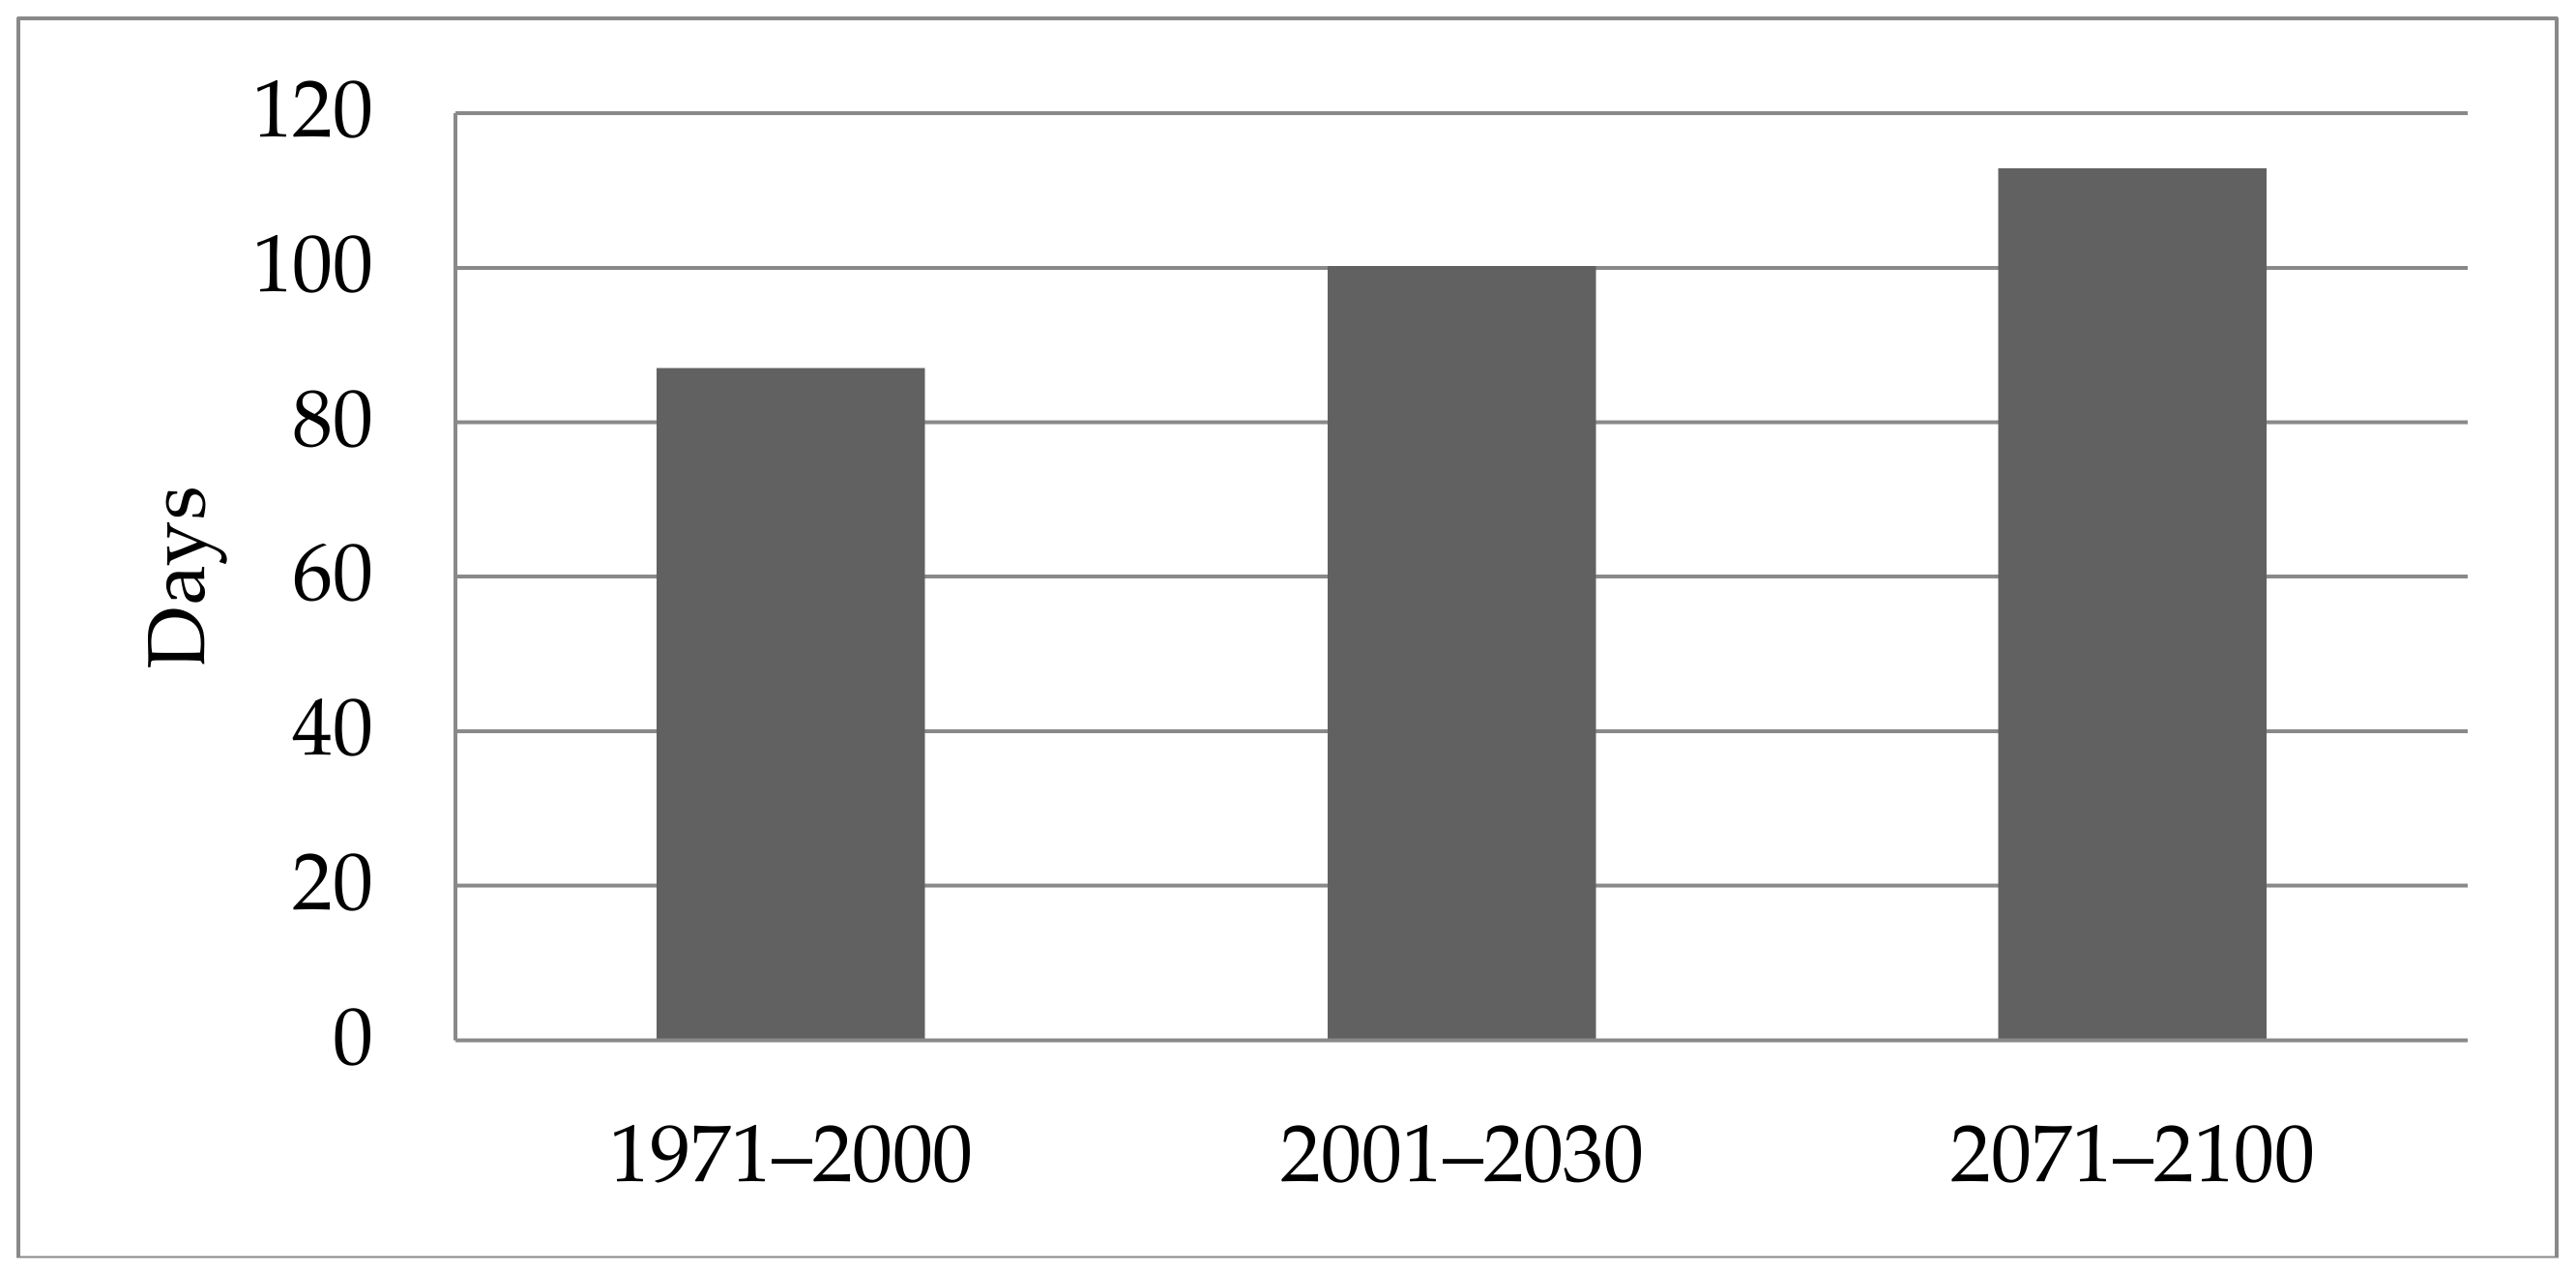
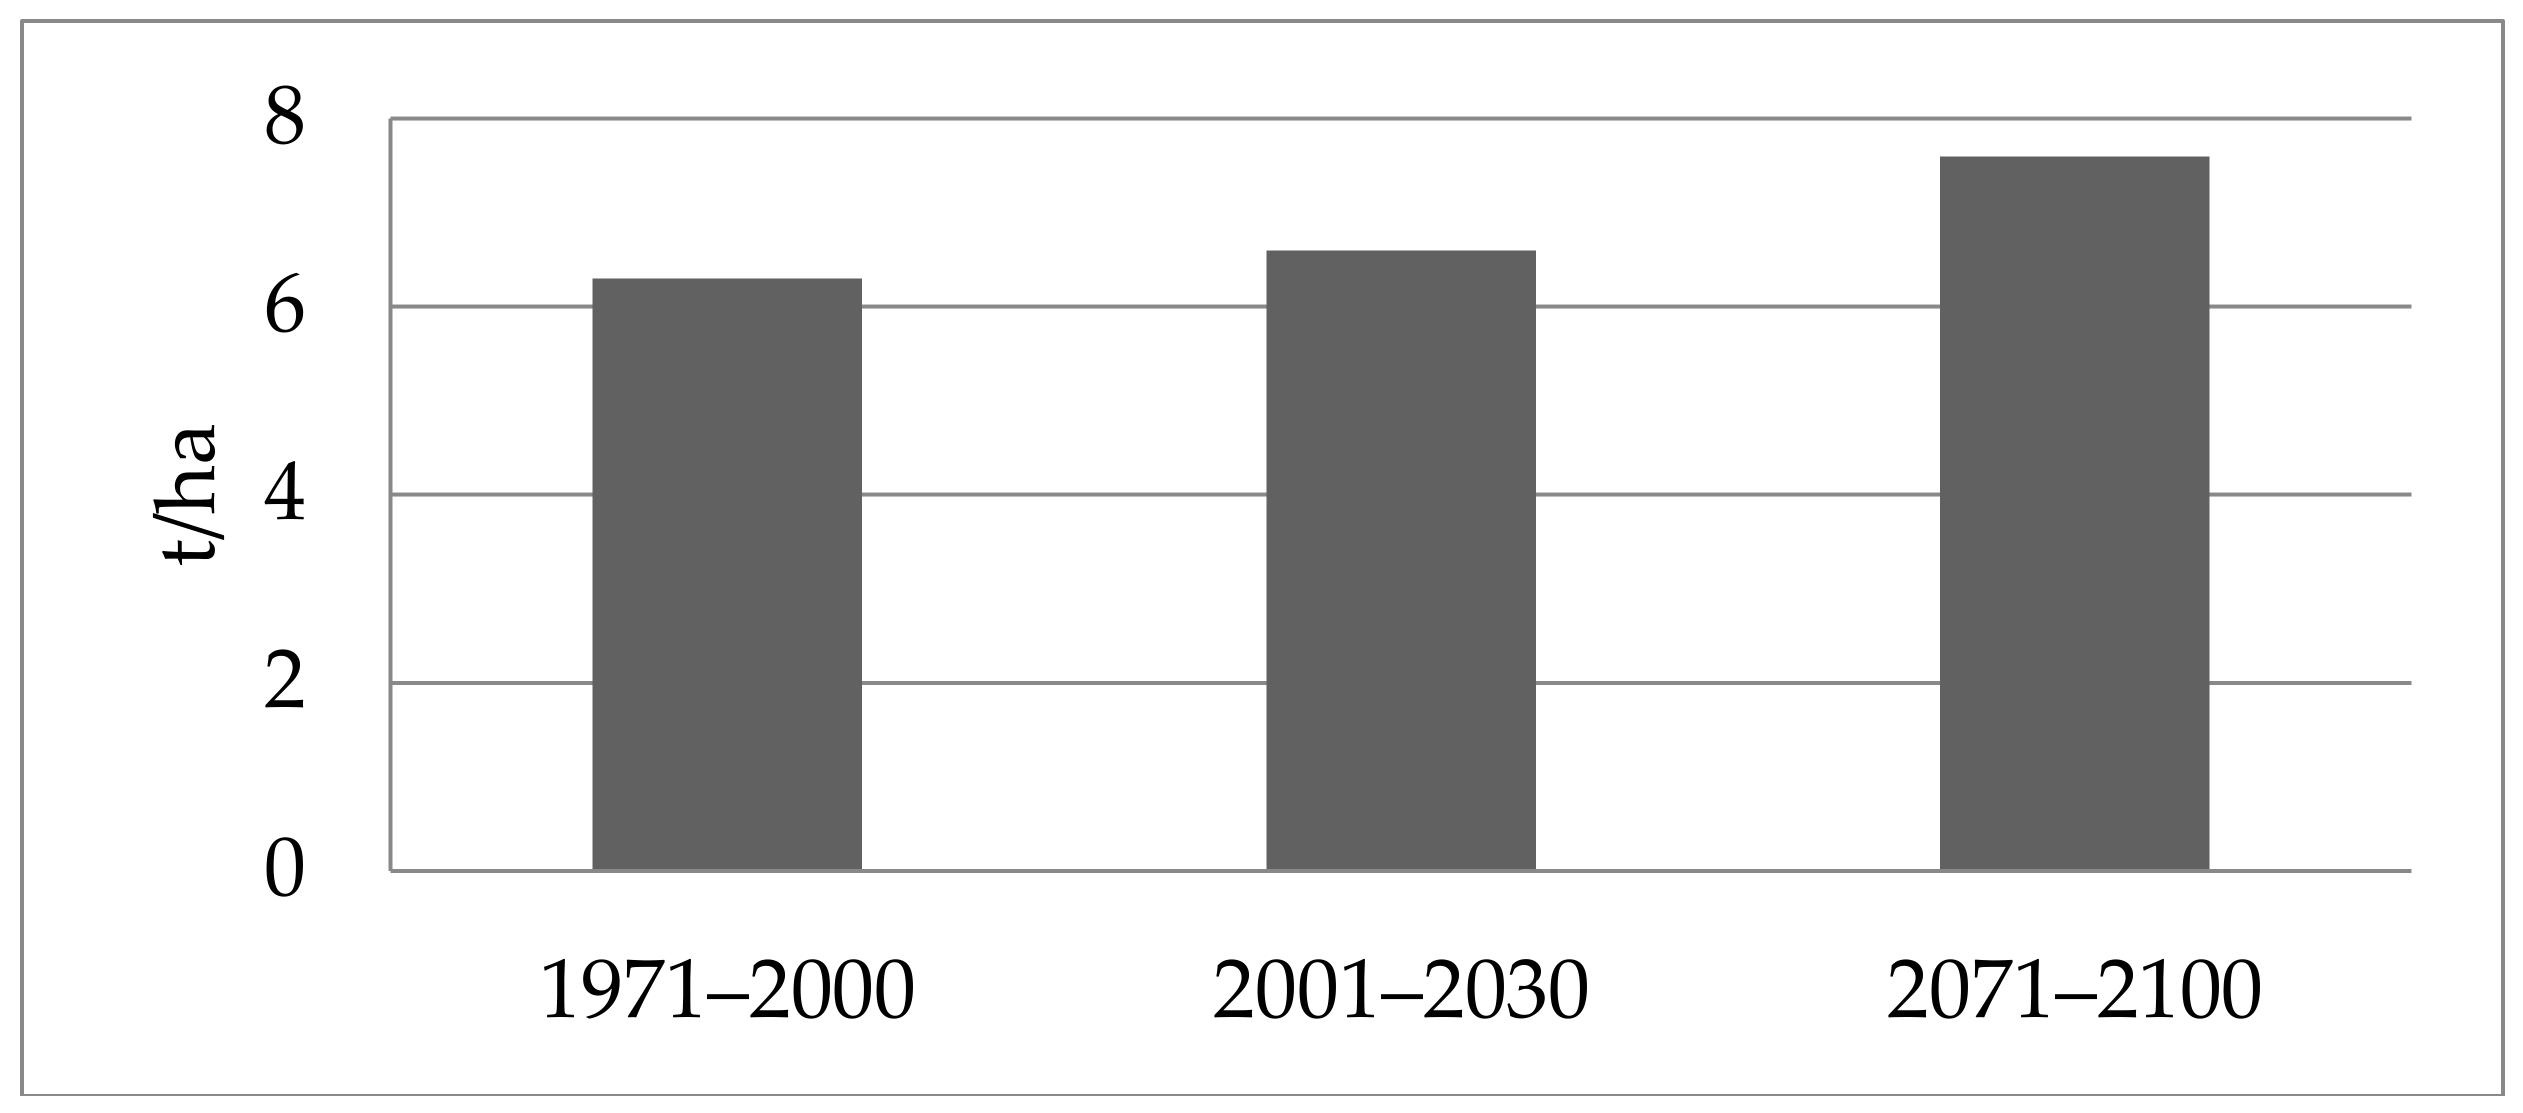
3.3. The Time of Sowing, Onset and Duration of Flowering, Duration of Growing Season, and Yield of Spring Barley Simulations

The projected sowing dates of spring barley for the 2001–2030 period were similar to those for the baseline (1971–2000), where delayed sowing, relative to current practice, was recorded (the end of March and the beginning of April). However, the projected sowing dates for the 2071–2100 period were at the end of January.
Based on the AquaCrop simulations, the start of flowering in 2001–2030 was set up during May. In addition, the onset of flowering was found to be similar to that for the baseline period (1971–2000). However, at the end of the 21st century, flowering was expected to start approximately one month earlier with respect to the time of flowering in general under present conditions: However, the duration of flowering was expected to decrease by around four days relative to the baseline (1971–2000) (Figure 4).
The results of the duration of spring barley’s growing season (from sowing to maturity) (Figure 5) indicated that, in the 2071–2100 scenario, barley was expected to prolong its vegetation by 13 days with respect to the 2001–2030 scenario and 25 days with respect to the baseline period.
Our findings showed an increasing trend of average barley yield over the two climate projections (2001–2030 and 2071–2100) (Figure 6). Despite extreme events with respect to temperature changes during barley’s growing season in 2071–2100 (Figure 3), its mean grain yield was expected to be 13% higher than in the 2001–2030 period and 8% relative to the baseline period.

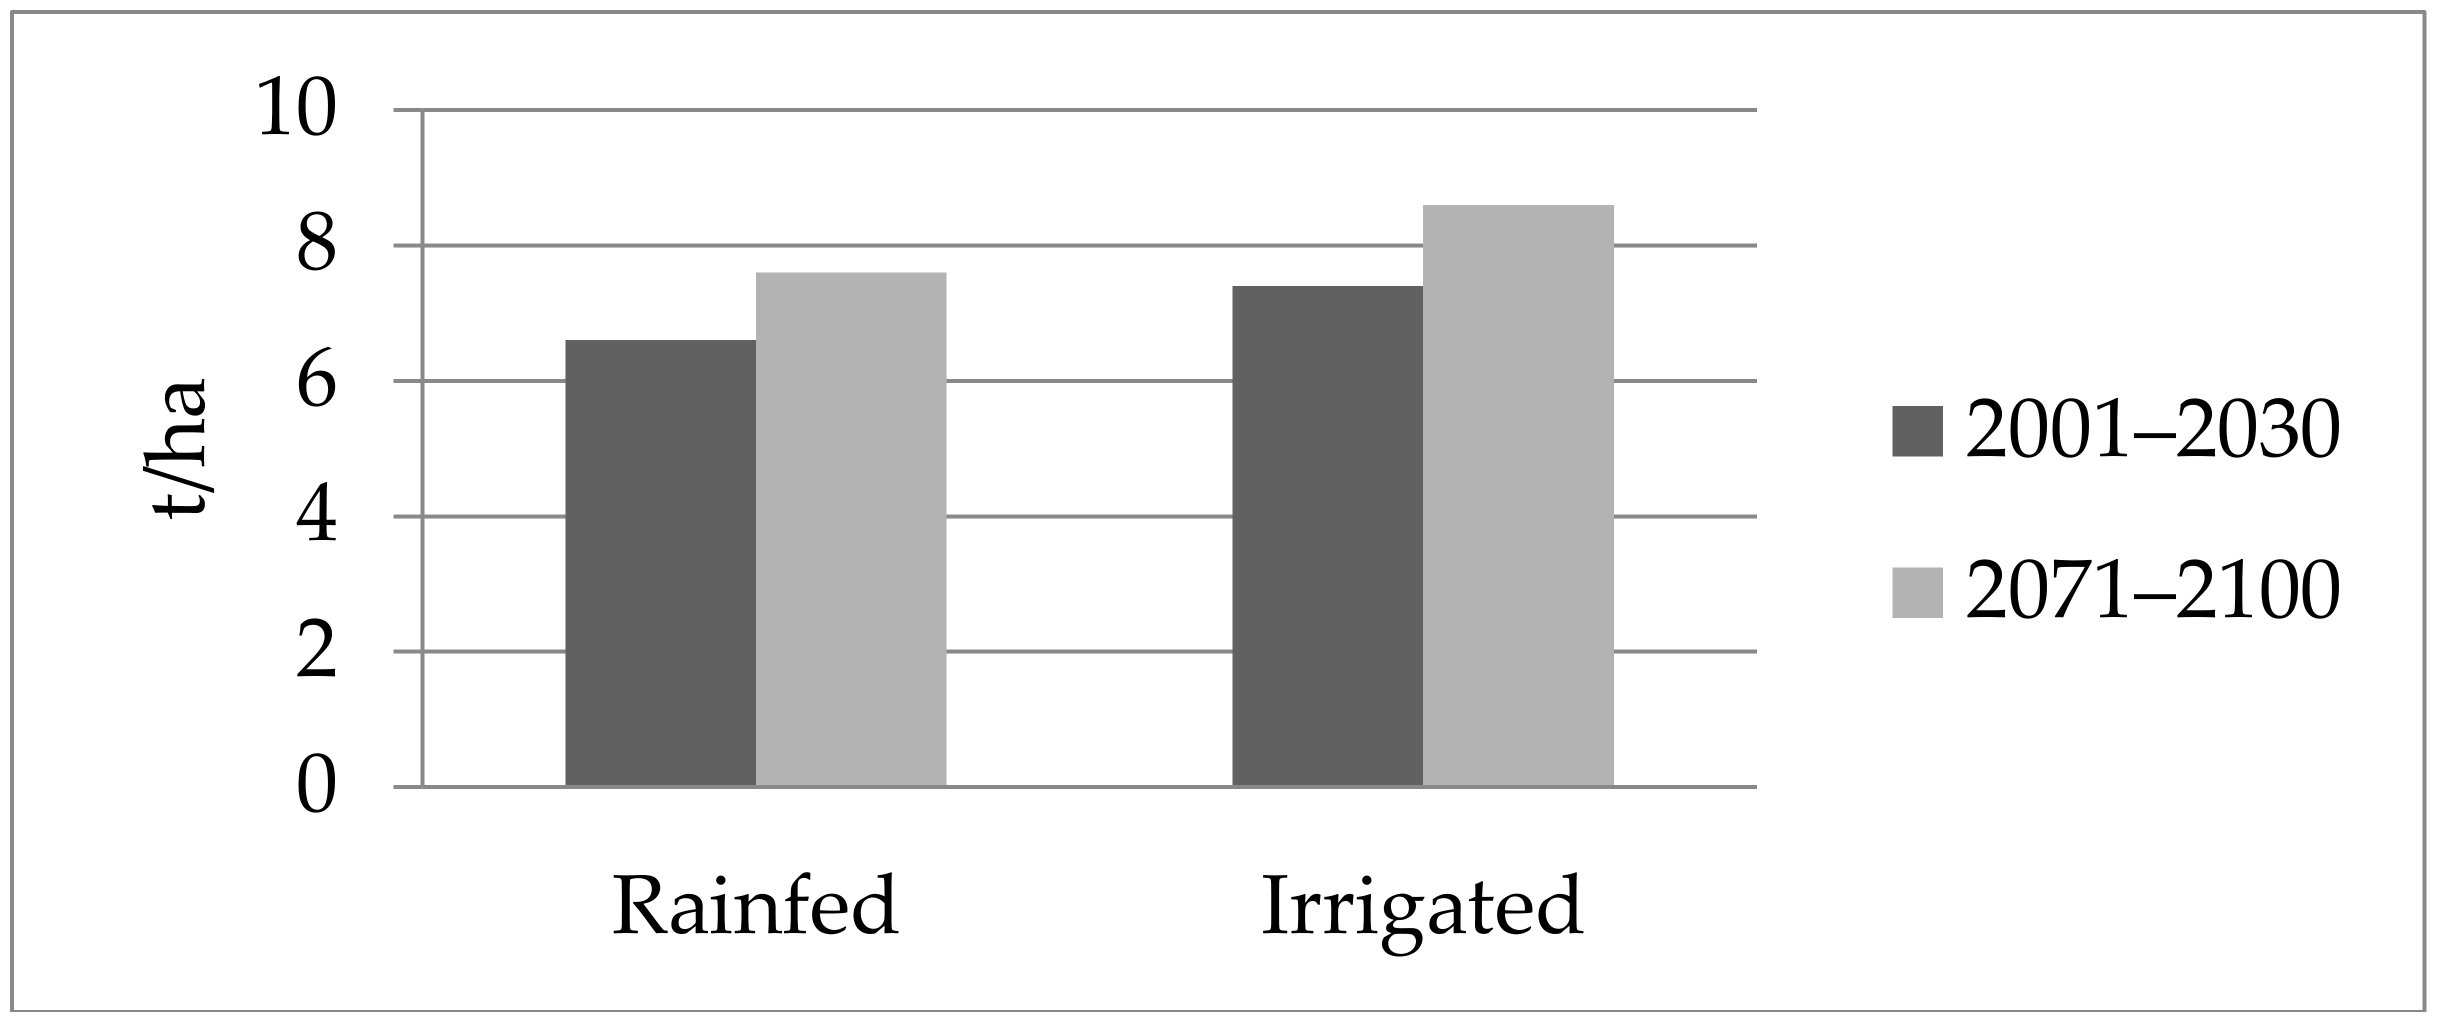
3.4. Changes in Spring Barley Yield Due to Irrigation in the Future and Irrigation’s Economic Feasibility

The results of the present simulation showed that net irrigation may have slightly improved the mean grain yield in the two projected scenarios (2001–2030 and 2071–2100) relative to rain-fed conditions (Figure 7). Irrigation with approximately 50 mm of supplemental water may have improved the grain yield by 0.7 t/ha in the 2001–2030 period, and a higher water supply (60–70 mm) was needed for an approximately 1 t/ha grain yield increase in the 2071–2100 period.
The use of a center-pivot and two linear systems is foreseen for the irrigation of barley. The main advantage of this irrigation system is its constant movement, which removes the need for physical work and increases the area that can be covered by a given irrigation rate. In addition, the irrigation is balanced, and the water losses are not high [37].
The predicted overall economic result of the irrigation of spring barley was found to be negative due to high fixed costs and the low number of years during the analyzed period (due to crop rotation) in which irrigation could substantially contribute to an increase in yield (Table 7). The purchase price of barley in Serbia from 2011 to 2016 is given in Table 8. The fixed, variable, and total costs of the exploitation of one center-pivot and two linear systems are given in Table 9.

4. Discussion

4.1. The Impact of Expected Climate Change on the Growth Dynamics and Mean Yield of Spring Barley

Plant growth and development are highly dependent upon the air temperature surrounding a crop. In the future, air temperature changes are projected to be more common in parts of the Pannonian lowland with similar meteorological characteristics, relative to a recent period [38]. Therefore, in the present study we analyzed the effect of mean air temperature during MAM, TTMS, and TSMS, as well as sums of mean air temperature above 10 °C on growing season dynamics and the yield of spring barley. Extreme events during the spring and summer months will have the most prominent effects on spring crop productivity. However, up to now, little research has been conducted to analyze the effects of the predicted conditions [39].
Alterations in crop yield and growth dynamics, as a consequence of climate change, were considered for the two climate scenarios 2001–2030 and 2071–2100 relative to a baseline. Particular attention was devoted to expected air temperature changes, which predominantly determine crop yield [40]. Extreme temperatures are more important inducers of stress in the spring crop than mean air temperatures [21]. Their frequency and time of occurrence can alter the duration of the growing season and the development of barley, as well as specific phenological stages (such as flowering). For spring barley, the most sensitive periods are flowering and grain filling, which usually occur during May and June.
The sowing dates of small grain crops may vary over time [41]. Generally, in Europe, spring barley is sown at the end of February or at the beginning of March [42]. Indicative sowing dates may be used in the case of a lack of actual data: However, it is difficult to accurately predict sowing dates under future climate change scenarios [43]. Hence, studies focused on the impact of climate change in the future rely on current sowing dates for spring barley [44]. Our finding of delayed sowing times in the baseline period as well as in 2001–2030 could have been a consequence of the occurrence of early frost days in the second half of February. According to Jančić [45], the average number of frost days in February in the 1971–2000 period was 17. In the 2001–2030 period, the average number of frost days in February was expected to be 18, which may have been the reason for delayed sowing. In contrast, the AquaCrop model projected that sowing in the 2071–2100 period would be much earlier (the end of January) because of the projected increase in the temperature during winter at the end of the 21st century, which is considered to be the most important feature of further climate change in Serbia [2]. This could seriously affect field operations related to barley sowing in the future. Furthermore, the early sowing of spring crops may prevent the adverse effect of extreme temperatures during summer months [12,40].
Earlier sowing was followed by an earlier onset of flowering in the 2071–2100 scenario, relative to the 1971–2000 period and the 2001–2030 scenario. The projected increase in air temperature sums during the first months of the year may have caused an early and shortened duration of flowering of spring barley in the future. The early sowing and shortened duration of flowering in 2071–2100 relative to the baseline (Figure 4) may have been a consequence of the expected air temperature increase in the projected future. The implementation of a crop strategy to remain viable and avoid extreme temperature conditions is important since, in the 2071–2100 scenario, the number of TTMSes and TSMSes was expected to be significantly higher with respect to the baseline (Figure 2). This may not alter the biomass production and grain yield: However, the quality of the grain may be adversely affected [46]. Additionally, this may influence the market price of barley in the future. Similar results were obtained by Trnka et al. [47] from the simulation of spring barley production under future climate change in the Czech Republic. Rötter et al. [44] reported that an early sowing of spring barley may occur because a warmer spring may lead to yield increases in most climate scenarios with favorable soils, but not in extreme scenarios and with poor soils.
Barley yield generally varies less under changing weather conditions relative to the other small grains [48]. In accordance with this, our findings indicated that, despite extreme events with respect to temperature changes during the barley growing season that were expected in the 2071–2100 period (Figure 3), its mean grain yield remained unchanged. A combination of early flowering and prolonged vegetation in the future ensured a stable yield of spring barley. Similar results were reported by Rötter et al. [44] in a study of climate change’s effect on spring barley in Finland. In contrast, Nonhebel [49] reported that the yield of spring barley (and other cereals) decreased with an increasing temperature due to a decline in the duration of phenological phases (flowering and grain filling). However, with respect to different cardinal temperature thresholds for different phenological processes, the crop’s response to a high temperature in general depended on the character of the temperature increase as well as the phenological stage of the crop [50].
Projected changes in sowing and harvest dates are particularly important in planning agricultural management and adaptation strategies [51]. In addition, Eitzinger et al. [7] pointed out that farmers have already implemented adaptation measures, such as altered production techniques and the timing of management practices, in Poland [52,53]. Nevertheless, it has to be taken into consideration that the applied model does not consider biotic stresses (pests and diseases), which can affect the yield and growth of crops [8].

4.2. Spring Barley’s Response to Irrigation Under Projected Climate Change

Spring barley generally performs well in semi-arid areas of the world due to its extensive root system [54]. However, its yield and biomass may be hindered by a high temperature and a severe water deficiency [55] if these occur during the flowering and grain-filling phase. Our results indicated a slight improvement in yield in the future scenarios (2001–2030 and 2071–2100) when 50–70 mm of water was applied. Considering the good features of chernozem in most of Northern Serbia in combination with the extensive root system of barley [8], stable yield even under projected higher air temperatures was simulated. Nevertheless, it should be noted that, in the case of different soil types (poor soils) that can be found in different parts of the Pannonian lowland (Hungary, Romania, Croatia, and Austria), a moderate irrigation practice could be beneficial for barley production [7].
Current practice in the studied region generally does not include the irrigation of spring barley (the economics of non-irrigated barley is given in Table 7). However, after obtaining crop response from the simulation outputs, severe water stress was recorded in the phase of flowering. The addition of the least water supply in the flowering phase, which increased grain yield from 0.7–1 t/ha in the future scenarios (according to the model’s output), barley’s irrigation was not proven economically beneficial (the economics of irrigated barley in the future is given in Table 9). The negative economic result for irrigation in our study was supported by Fisher et al. [55] and Nagaz et al. [56], who reported that the grain yield of barley was not significantly improved by irrigation when compared to a corresponding rain-fed treatment. However, Tavakoli et al. [24] showed that, for barley grown in Iran, supplemental irrigation during flowering significantly increased grain yield. This difference with respect to our study may be due to the higher heat stress that was predicted for that area in Iran, relative to our study site.
In the predicted climate scenarios, the irrigation of barley may be economically feasible in the study region only if seed crops and vegetables are included in the crop rotation on at least 50% of the surface and if second crops (e.g., soybean, sunflower, or maize) are grown after the harvest of barley.

5. Conclusions

The present simulation study provides information on the response of spring barley to projected climate change (in the periods 2001–2030 and 2071–2100), but also the response of barley to irrigation during the stress-sensitive phase of its growth. In conclusion, barley is likely to remain a viable rain-fed crop in Northern Serbia under projected climate change, and the same stands for regions where similar climate changes are expected, such as Croatia, Austria, Romania, and Hungary. For both time slices, the average yield of barley increased over the baseline period, with the greatest increase in the 2071–2100 scenario, even though the temperature changes that were expected in this period shortened the duration of flowering and moved the sowing time to the beginning of the year, which deviated from common practice in the experimental region. Irrigation in the present simulation did not prove to be economically efficient. Nevertheless, the introduction of a greater portion of crops that attain higher market prices in crop rotations, together with secondary crops (sown after the harvest of barley), provides an opportunity to economically justify the irrigation of barley.

Author Contributions

M.D. wrote the manuscript with input from all authors; V.Z. conducted the economic analysis of irrigation; M.M. performed field experiments; B.L. analyzed the projected scenarios; M.P.-D. and I.M. contributed to AquaCrop’s calibration and validation and supervised the writing process; A.D.M. participated in simulations by AquaCrop. All authors discussed the results and contributed to the final manuscript.

Funding

This research was funded by the European Union’s Horizon 2020 research and innovation program, grant number 691998.

Conflicts of Interest

The authors declare no conflicts of interest.

References

  1. Arnfield, A.J. Two decades of urban climate research: A review of turbulence, exchanges of energy and water, and the urban heat island. Int. J. Climatol. 2003, 23, 1–26. [Google Scholar] [CrossRef]
  2. Đurđević, V.; Rajković, B. Development of the EBU-POM coupled regional climate model and results from climate change experiments. In Advances in Environmental Modeling and Measurements; Mihajlović, D.T., Lalić, B., Eds.; Nova Science Publishers Inc.: New York, NY, USA, 2012; pp. 23–32. [Google Scholar]
  3. Rowel, D.P.; Jones, R.G. Causes and uncertainty of future summer drying over Europe. Clim. Dynam. 2006, 27, 281–299. [Google Scholar] [CrossRef]
  4. Lalić, B.; Eitzinger, J.; Mihajlović, D.T.; Thaler, S.; Jančić, M. Climate change impacts on winter wheat yield change—Which climatic parameters are crucial in Pannonian lowland. J. Agric. Sci. 2013, 151, 757–774. [Google Scholar] [CrossRef]
  5. Downing, T.E.; Harrison, P.A.; Butterfield, R.E.; Lonsdale, K.G. Climate Change, Climatic Variability and Agriculture in Europe: An Integrated Assessment; Research Report No. 21; Environmental Change Unit, University of Oxford: Oxford, UK, 2000. [Google Scholar]
  6. Parry, M.L.; Canziani, O.F.; Palutikof, J.P.; van der Linden, P.J.; Hanson, C.E. Climate change 2007-Impacts, Adaptation and Vulnerability. In Contribution of Working Group II to the Fourth Assessment Report of the IPCC; Cambridge University Press: Cambridge, UK, 2007. [Google Scholar]
  7. Eitzinger, J.; Trnka, M.; Semerádová, D.; Thaler, S.; Svobodová, E.; Hlavinka, P.; Šiška, B.; Takác, J.; Malatinská, L.; Nováková, M.; et al. Regional climate change impacts on agricultural crop production in Central and Eastern Europe—Hotspots, regional differences and common trends. J. Agric. Sci. 2013, 151, 787–812. [Google Scholar] [CrossRef]
  8. Stričević, Z.; Ćosić, M.; Đurović, N.; Pejić, B.; Maksimović, L. Assessment of FAO AquaCrop model in the simulation of rainfed and supplementaly irrigated maize, sugar beet and sunflower. Agric. Water Manag. 2011, 98, 1615–1621. [Google Scholar] [CrossRef]
  9. Mihajlović, D.T.; Alapaty, K.; Lalić, B.; Arsenić, I.; Rajković, B.; Malinović, S. Turbulent transfer coefficients and calculations of air temperature inside tall grass canopies in land-atmosphere schemes for environmental modeling. J. Appl. Meteorol. 2004, 1498–1512. [Google Scholar] [CrossRef]
  10. Stričević, R.; Đurović, N. Determination of spatiotemporal distribution of Agricultural drought in Central Serbia (Šumadija). Sci. Res. Essays 2013, 8, 438–446. [Google Scholar] [CrossRef]
  11. Pinke, Z.; Lövei, G.L. Increasing temperature cuts back crop yields in Hungary over the last 90 years. Glob. Chang. Biol. 2017, 23, 5426–5435. [Google Scholar] [CrossRef]
  12. Vučetić, V. Modelling of maize production in Croatia: Present and future climate. J. Agric. Sci. 2011, 149, 145–157. [Google Scholar] [CrossRef]
  13. Cuculeanu, V. Climate change impacts in Romania: Vulnerability and adaptation options. GeoJournal 2002, 57, 203–209. [Google Scholar] [CrossRef]
  14. Intergovernmental Panel on Climate Change (IPCC). Anex II: Glossary. In Climate Change 2014: Synthesis Report. Contribution of Working Groups I, II and III to the Fifth Assessment Report of the Intergovernmental Panel on Climate Change; Mach, K.J., Planton, S., von Stechow, C., Eds.; IPCC: Geneva, Switzerland, 2014; pp. 117–130. [Google Scholar]
  15. Food and Agriculture Organization Corporate Statistical Database (FAOSTAT). Available online: http://www.fao.org/faostat/en/#data/RF (accessed on 30 November 2018).
  16. European Commission (EUROSTAT). Available online: https://ec.europa.eu/eurostat/data/database (accessed on 30 November 2018).
  17. Grain and Feed Annual Belgrade Serbia. Available online: https://gain.fas.usda.gov/Recent%20GAIN%20Publications/Grain%20and%20Feed%20Annual_Belgrade_Serbia_4-10-2018.pdf (accessed on 21 September 2018).
  18. Spunar, J.; Blumel, H.; Fouquin, G. Global warming impact—Winter barley as reserve crop for brewing industry in the traditional European countries declaring exclusive or dominant spring malting barley utilization. In Proceedings of the 10th International Barley Genetics Symposium, Alexandria, Egypt, 5–10 April 2008; Ceccarelly, S., Grando, S., Eds.; ICARDA: Aleppo, Syria, 2010; pp. 395–405. [Google Scholar]
  19. Pržulj, N.; Momčilović, V. Novi Sad varieties of malting barley for the growing conditions of Yugoslavia. Genetika 1998, 30, 453–462. [Google Scholar]
  20. PPS Sombor. Godišnji Izveštaj o Atestiranim Količinama Semena i Sadnog Materijala u 2017/2018; PPS: Sombor, Srbija, 2017. [Google Scholar]
  21. Lalić, B.; Mihajlović, D.T.; Podraščanin, Z. Buduće stanje klime u Vojvodini očekivani uticaj na ratarsku proizvodnju. Field Veg. Crop. Res. 2011, 48, 403–418. [Google Scholar]
  22. Olesen, J.E.; Trnka, M.; Kersebaum, K.C.; Skjelvag, A.O.; Seguin, B.; Peltonen-Sainio, P.; Rossi, P.; Kozyra, J.; Micale, F. Impacts and adaptation of European crop production systems to climate change. Eur. J. Agron. 2011, 34, 96–112. [Google Scholar] [CrossRef]
  23. Pettersson, C.G.; Eckersten, H. Prediction of grain protein in spring malting barley grown in nothern Europe. Eur. J. Agron. 2007, 27, 205–214. [Google Scholar] [CrossRef]
  24. Tavakoli, A.R.; Moghadam, M.M.; Sepaskhah, A.R. Evaluation of the AquaCrop model for barley production under deficit irrigation and rainfed condition in Iran. Agric. Water Manag. 2015, 161, 136–146. [Google Scholar] [CrossRef]
  25. Gerik, T.J.; Rosenthal, W.D.; Duncan, R.R. Simulating grain yield and plant development of ratoon grain sorghum over diverse environments. Field Crop. Res. 1988, 19, 63–74. [Google Scholar] [CrossRef]
  26. Van Dam, J.C.; Groenendijk, P.; Henriks, R.F.A.; Kroes, J.G. Advances of modeling water flow in variably saturated soils with SWAP. Vadose Zone J. 2008, 7, 640–653. [Google Scholar] [CrossRef]
  27. Todorović, M.; Albrizio, R.; Životić, L.; Abi Saab, M.T.; Stöckle, C.; Steduto, P. Assessment of AquaCrop CropSyst and WOFOST models in the simulation of sunflower growth under different water regimes. Agron. J. 2009, 101, 509–521. [Google Scholar] [CrossRef]
  28. El Mokh, F.; Vila-Garcia, M.; Nagaz, N.; Fereres, E. Calibration of AquaCrop salinity stress parameters for barley under different irrigation regimes in a dry environment. In Proceedings of the International Conference on Agricultural and Food Engineering, Kuala Lumpur, Malaysia, 23–26 August 2016. [Google Scholar]
  29. Vanuytrecht, E.; Raes, D.; Willems, P.; Semenov, M.A. Comparing climate change impacts on cereals based on CMIP3 and EI-Ensembles climate scenarios. Agric. For. Meteorol. 2014, 151, 1753–1762. [Google Scholar] [CrossRef]
  30. Winter, S.R.; Musick, J.T.; Porter, K.B. Evaluation of screening techniques for breeding drought resistant winter wheat. Crop. Sci. 1988, 28, 512–516. [Google Scholar] [CrossRef]
  31. Jungclaus, J.H.; Botzet, M.; Haak, H.; Keenlyside, N.; Luo, J.J.; Latif, M.; Marotzke, J.; Mikolajevicz, U.; Roeckner, E. Ocean circulation and tropical variability in the coupled model ECHAM5/MPI-OM. J. Clim. 2006, 19, 3952–3972. [Google Scholar] [CrossRef]
  32. Mihajlović, D.T.; Mimić, G.; Arsenić, I. Climate predictions: The chaos and complexity in climate models. Adv. Meteorol. 2014, 2014, 14. [Google Scholar] [CrossRef]
  33. Raes, D.; Steduto, P.; Hsiao, T.C.; Fereres, E. AquaCrop—The FAO Crop Model to Simulate Yield Response to Water Plug in Program Version 5.0 Reference Manual; Food and Agriculture Organization (FAO): Rome, Italy, 2009. [Google Scholar]
  34. Hsiao, T.C.; Heng, L.; Steduto, P.; Rojas-Laura, B.; Raes, D.; Fereres, E. AquaCrop—The FAO crop model to simulate yield response to water: III. Parameterization and testing for maize. Agron. J. 2015, 101, 448–459. [Google Scholar] [CrossRef]
  35. Kandić, V. Ocena Genotipova Ječma na Otpornost Prema Suši u Fazi Nalivanja Zrna. Ph.D. Thesis, Univerzitet u Beogradu, Poljoprivredni Fakultet, Beograd, Serbia, 2015. [Google Scholar]
  36. Mihajlović, D.T. Osnove Meteoroloških Osmatranjai Obrade Podataka; Poljoprivredni Fakultet, Institutza Ratarstvo Povrtarstvo: Novi Sad, Serbia, 1988. [Google Scholar]
  37. Phocaides, A. Handbook on Pressurized Irrigation Techniques, 2nd ed.; Food and Agriculture Organization (FAO): Rome, Italy, 2007; pp. 159–177. ISBN 978-992-5-105817-6. [Google Scholar]
  38. Meehl, G.A.; Stocker, T.F.; Collins, W.D.; Gaye, A.J.; Gregory, J.M.; Kitoh, A.; Knutti, R.; Murphy, J.M.; Noda, A.; Raper, S.C.B.; et al. Global climate change projections. In Climate Change 2007: The Physical Science Basis. Contribution of Working Group I to the Fourth Assessment Report of the Intergovernmental Panel on Climate Change; Solomon, S., Qiu, D., Manning, M., Chen, Z., Marquis, M., Averyt, K.B., Tignor, M., Miller, H.L., Eds.; Cambridge University Press: Cambridge, UK; New York, NY, USA, 2007; pp. 749–844. [Google Scholar]
  39. Kumundini, S.; Andrade, F.H.; Boote, K.J.; Brown, G.A.; Dzotski, K.A.; Edmeades, G.O.; Gocken, T.; Goodwin, M.; Halter, A.L.; Hammer, G.L.; et al. Predicting maize phenology: Intercomparison of functions for developmental response to temperature. Agron. J. 2014, 106, 2087–2097. [Google Scholar] [CrossRef]
  40. Mihajlović, D.T.; Lalić, B.; Drešković, N.; Mimić, G.; Đurđević, V.; Jančić, M. Climate change effects on crop yields in Serbia and related shifts of Köppen climate zones under the SRES-A1B and SRES-A2. Int. J. Clim. 2015, 35, 3320–3334. [Google Scholar] [CrossRef]
  41. Holden, N.M.; Brereton, A.J.; Fealy, R.; Sweeney, J. Possible change in Irish climate and its impact on barley and potato yields. Agric. For. Meteorol. 2003, 116, 181–196. [Google Scholar] [CrossRef] [Green Version]
  42. Pržulj, N.; Mihajlović, V. Spring barley performances in the Pannonian zone. Genetika 2012, 44, 499–512. [Google Scholar] [CrossRef] [Green Version]
  43. Matthews, R.B.; Rivington, M.; Muhammed, S.; Newton, A.C.; Hallet, P.D. Adapting crops and cropping systems to future climates to ensure food security: The role of crop modeling. Glob. Food Secur. 2013, 2, 24–28. [Google Scholar] [CrossRef]
  44. Rötter, R.P.; Palosuo, T.; Pirttioja, N.K.; Dubrovsky, M.; Salo, T.; Fronzek, S.; Aikasalo, R.; Trnka, M.; Ristolainen, A.; Carter, T.R. What would happen to barley production in Finland if global warming exceeded 4 °C? Eur. J. Agron. 2011, 35, 205–214. [Google Scholar] [CrossRef]
  45. Jančić, M. Uticaj Klimatskih Promena na Biljnu Proizvodnju. Ph.D. Thesis, Univerzitet u Novom Sadu, Novi Sad, Serbia, 2015. [Google Scholar]
  46. Croufurd, P.; Wheeler, T. Climate change and the flowering time of annual crops. J. Exp. Bot. 2009, 60, 2529–2539. [Google Scholar] [CrossRef] [Green Version]
  47. Trnka, M.; Dubrovsky, M.; Žalud, Z. Climate change impacts and adaptation strategies in spring barley production in the Czech Republic. Clim. Chang. 2004, 64, 227–255. [Google Scholar] [CrossRef]
  48. Newton, A.C.; Flavell, A.J.; George, T.S.; Leat, P.; Mullholland, B.; Ramsey, I.; Revoredogiha, C.; Russell, J.; Steffenson, B.J.; Swanston, J.S.; et al. Crops that feed the world 4. Barley: A resilient crop? Strengths and weeknesses in the context of food security. Food Secur. 2011, 3, 141–178. [Google Scholar] [CrossRef]
  49. Nonhebel, S. Effects of temperature rise and increase in CO2 concentration on simulated wheat yields in Europe. Clim. Chang. 1996, 34, 73–90. [Google Scholar] [CrossRef]
  50. Porter, J.R.; Gawith, M. Temperatures and the growth development of wheat: A review. Eur. J. Agron. 1999, 10, 23–36. [Google Scholar] [CrossRef]
  51. Kozyra, J. Impact of Projected Air Temperature Change on Winter Cereals Phenology in Poland; Institute of Soil Science and Plant Cultivation State Research Institute: Pulamy, Poland, 2013. [Google Scholar]
  52. Blecharczyk, A.; Sawinska, Z.; Malecka, I.; Sparks, T.H.; Tryjanowski, P. The phenology of winter rye in Poland: An analysis of long term experimental data. Int. J. Biometeorol. 2016, 60, 1341–1346. [Google Scholar] [CrossRef] [PubMed]
  53. Mezghani, A.; Dobler, A.; Haugen, J.E.; Benestad, R.E.; Parding, K.M.; Piniewski, M.; Kardel, I.; Kundzewics, Z.W. CHASE-PL Climate Projection Dataset over Poland-Bias adjustment of EURO-CORDEX simulations. Earth Syst. Sci. Data 2017, 9, 905–925. [Google Scholar] [CrossRef]
  54. Fisher, R.A.; Maurer, R. Drought resistance in spring wheat cultivars I. Grain yield response. Aust. J. Agric. Res. 1978, 29, 897–912. [Google Scholar] [CrossRef]
  55. Araya, A.; Habtu, S.; Hadgu, K.M.; Kebede, A.; Dejene, T. Test of Aquacrop model in simulating biomass and yield of water deficient and irrigated barley (Hordeum vulgare). Agric. Water Manag. 2010, 97, 1838–1846. [Google Scholar] [CrossRef]
  56. Nagaz, K.; Toumi, I.; Masmoudi, M.M.; Mechilia, N.B. Soil salinity and barley production under full and deficit irrigation with saline water in arid conditions of southern Tunisia. Res. J. Agron. 2008, 2, 90–95. [Google Scholar]
Figure 1. The mean air temperature in March, April, and May (MAM) over the baseline period (1971–2000) and in the projected climate scenarios (2001–2030 and 2071–2100).
Atmosphere 10 00014 g001
Figure 2. The total number of tropical (TTMS) and summer days (TSMS) over the baseline period (1971–2000) and in the projected climate scenarios (2001–2030 and 2071–2100).
Atmosphere 10 00014 g002
Figure 3. The sum of daily air temperatures above 10 °C over the baseline period (1971–2000) and the projected climate scenarios (2001–2030 and 2071–2100).
Atmosphere 10 00014 g003
Figure 4. The duration of the flowering of spring barley over the baseline (1971–2000) and in the projected climate scenarios (2001–2030 and 2071–2100).
Atmosphere 10 00014 g004
Figure 5. The duration of the growing season of spring barley over the baseline period (1971–2000) and in the projected climate scenarios (2001–2030 and 2071–2100).
Atmosphere 10 00014 g005
Figure 6. The mean grain yield of rain-fed spring barley over the baseline (1971–2000) and in the projected climate scenarios (2001–2030 and 2071–2100).
Atmosphere 10 00014 g006
Figure 7. The difference in the predicted mean grain yield for the 2001–2030 and 2071–2100 periods under rain-fed and irrigated conditions.
Atmosphere 10 00014 g007
Table 1. The hydrological characteristics of the soil used in the experiment.
LocationDepth (m)Soil TypeTextureField Capacity (%)Wilting Point (%)Pore Space (%)
Rimski Šančevi0–0.30
>0.30
ChernozemLoam33.8
35.8
16.3
20.2
54.9
48.8
Table 2. The input parameters for spring barley that were adjusted for a specific cultivar.
Crop Input ParametersValue
Crop water productivity (WP), g/m220
Initial canopy cover (CCo), %27.48
Harvest index (HIo), %70
Maximum canopy cover (CCx), %57
Reduction of canopy expansion, %24
Average decline in canopy cover, %/day0.08
Crop response for fertility stress, %50
Table 3. The measured crop growth variables that were used for calibration and validation.
YearSowing DateEmergence
Date
Flowering
Date
Maturity
Date
200610.03.28.03.24.05.6.07.
200728.02.17.03.14.05.24.06.
200820.02.5.03.15.05.30.06.
20093.03.23.03.16.05.4.07.
20103.03.26.03.23.05.3.07.
201116.03.28.03.23.05.4.07.
201320.03.8.04.27.05.7.07.
201426.02.7.03.12.05.6.06.
Table 4. The crop input data that derived from the field experiment.
Plant Density (Plants/m2)kg Seed/ha1000 Seed Mass (g)Germination Rate (%)Row Spacing (m)Plant Spacing (m)Canopy Size Seedling (cm2)Initial Canopy Cover (%)
55029551950.410.43527.48
Table 5. The root mean square error (RMSE) and mean square error (MSE) value of the observed and simulated yield.
YearObserved Yield (t/ha)Simulated Yield (t/ha)RMSE (t/ha)MSE
(t/ha)
20068.77.80.90.80
20073.43.50.10.01
20087.57.40.10.01
20095.66.40.80.60
20103.23.30.10.01
20116.46.10.30.09
20133.93.70.20.04
20146.07.11.11.20
Table 6. Validation of the model.
YearObserved Grain Yield (t/ha)Simulated Grain Yield (t/ha)RSD (%)Coefficient of Variation
20095.66.49.40.320
20103.23.44.30.020
20116.46.13.40.045
20133.93.73.70.020
201467.111.80.605
Average5.65.71.09
Table 7. The average costs of the irrigation system’s exploitation.
Cost ElementSum (€)Sum (€/ha)Contribution (%)
Fixed costs90,892.45302.9786.45
Variable costs14,246.2647.9013.55
Total105,138.71350.46100
Table 8. The purchase price of barley.
DescriptionYearAverage
201120122013201420152016
Price (din/kg)18.9522.1020.1817.9616.9516.35
Euro rate103.04101.95113.14117.31120.73123.12
Price (€/kg)0.180.210.170.150.140.130.16
Table 9. The predicted costs of the irrigation of barley and its economic results.
Projected ScenarioMean Fixed CostsMean Variable CostsMean TotalMean Yield Increase (kg/ha)Mean Price (€/kg)Mean Income Increase (€/ha)Economic Result (€/ha)
2001–2030302.9712.08312.27785.600.16131.64−221.17
2071–2100302.979.44312.421032.120.16172.94−139.48

