
Epigenetic Heterogeneity of B-Cell Lymphoma: Chromatin Modifiers

 and
and 
Abstract
:1. Introduction
2. Data and Methods
2.1. Lymphoma Gene Expression Data
2.2. High-Dimensional Data Portraying
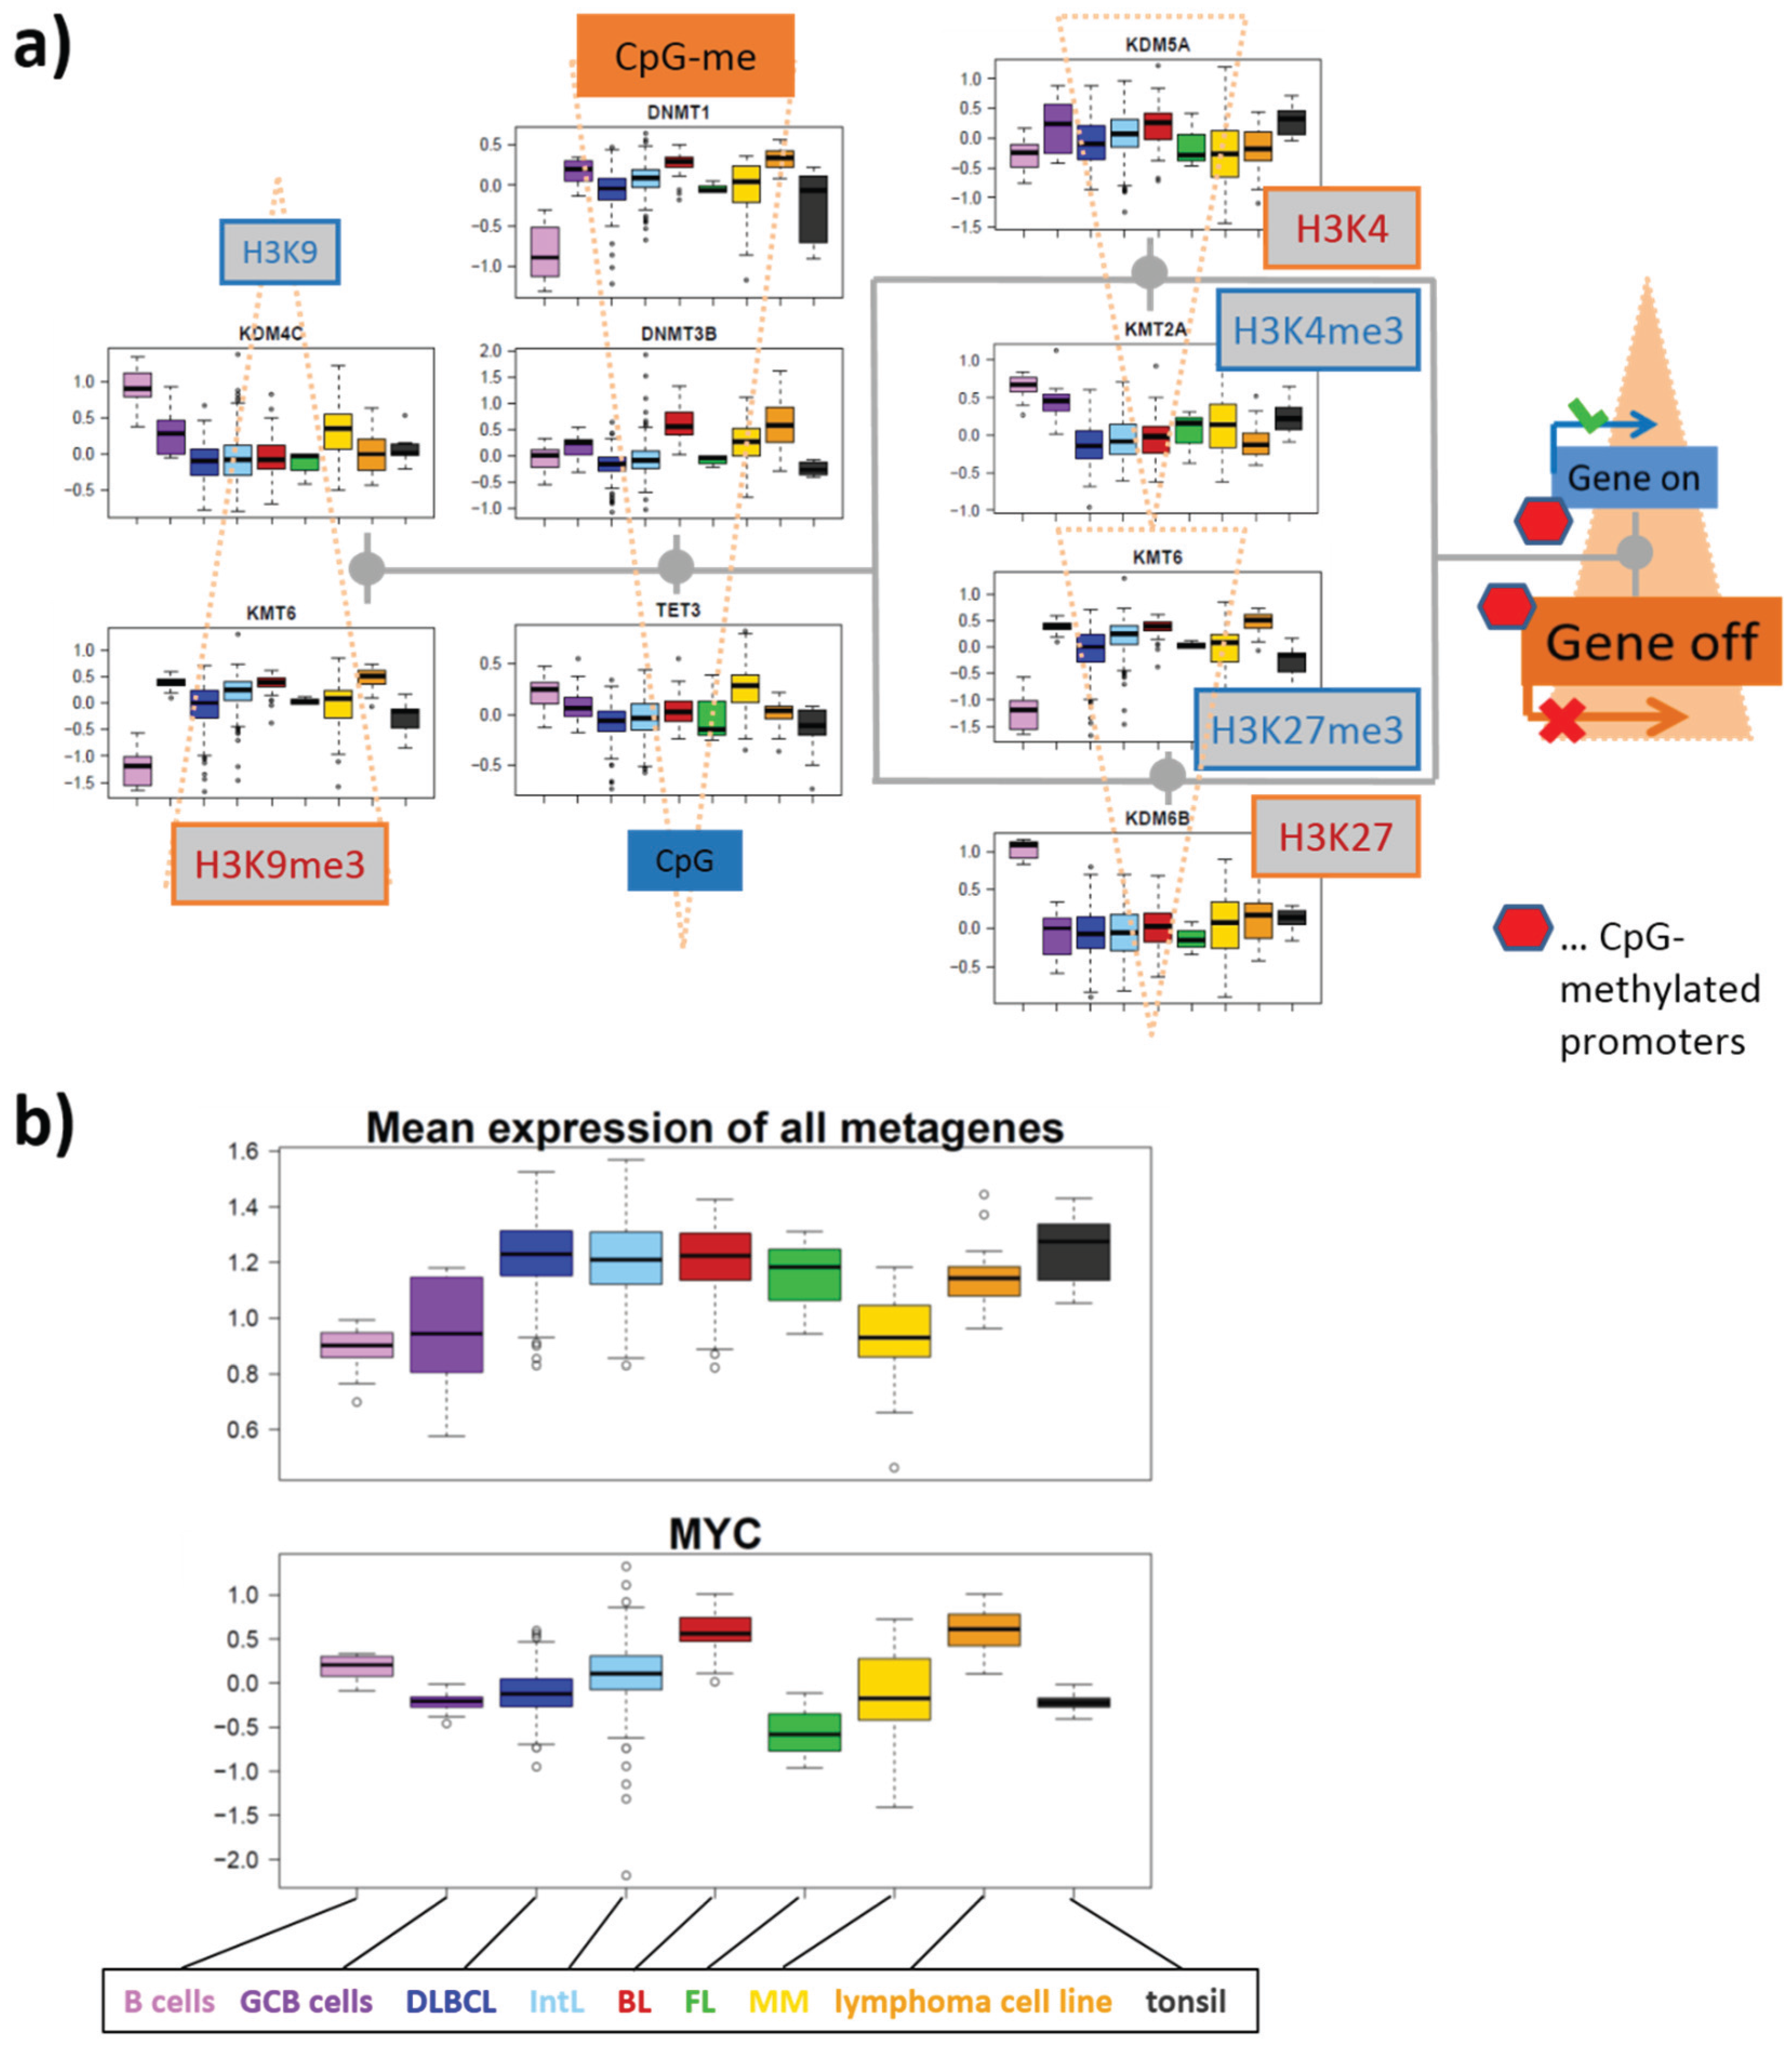
2.3. Pathway Signal Flow (PSF) Analysis
3. Results and Discussion
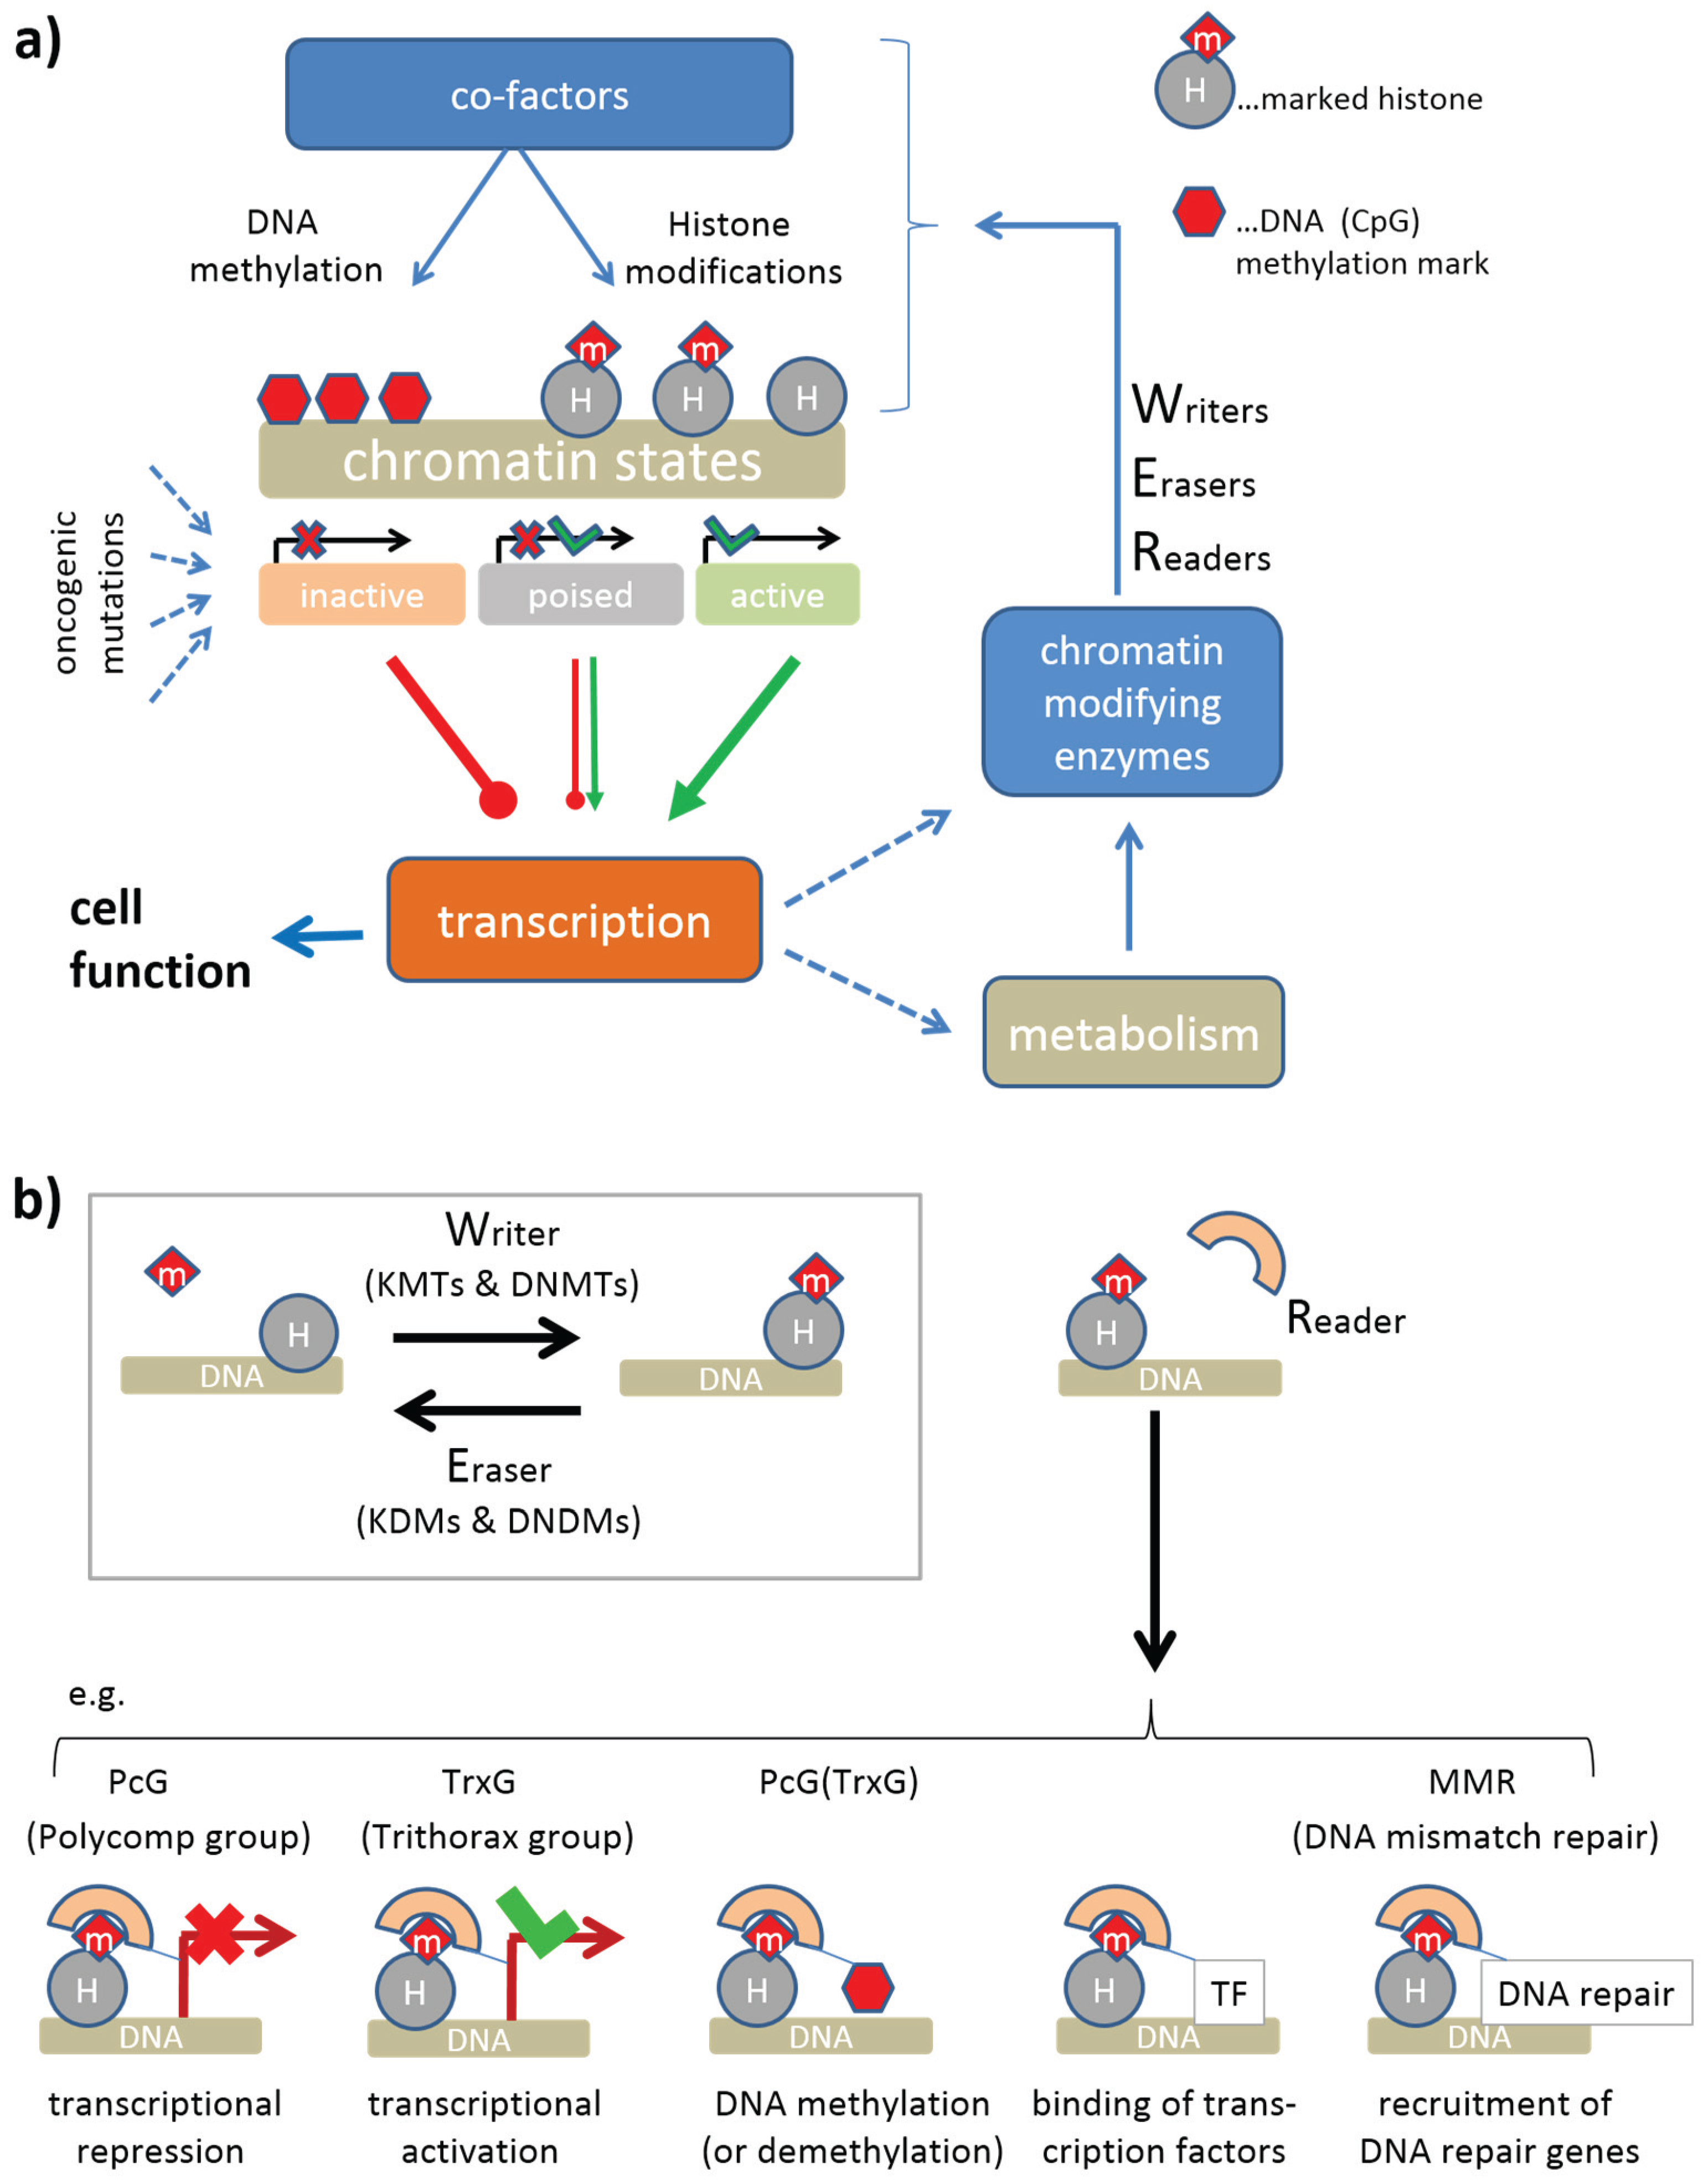
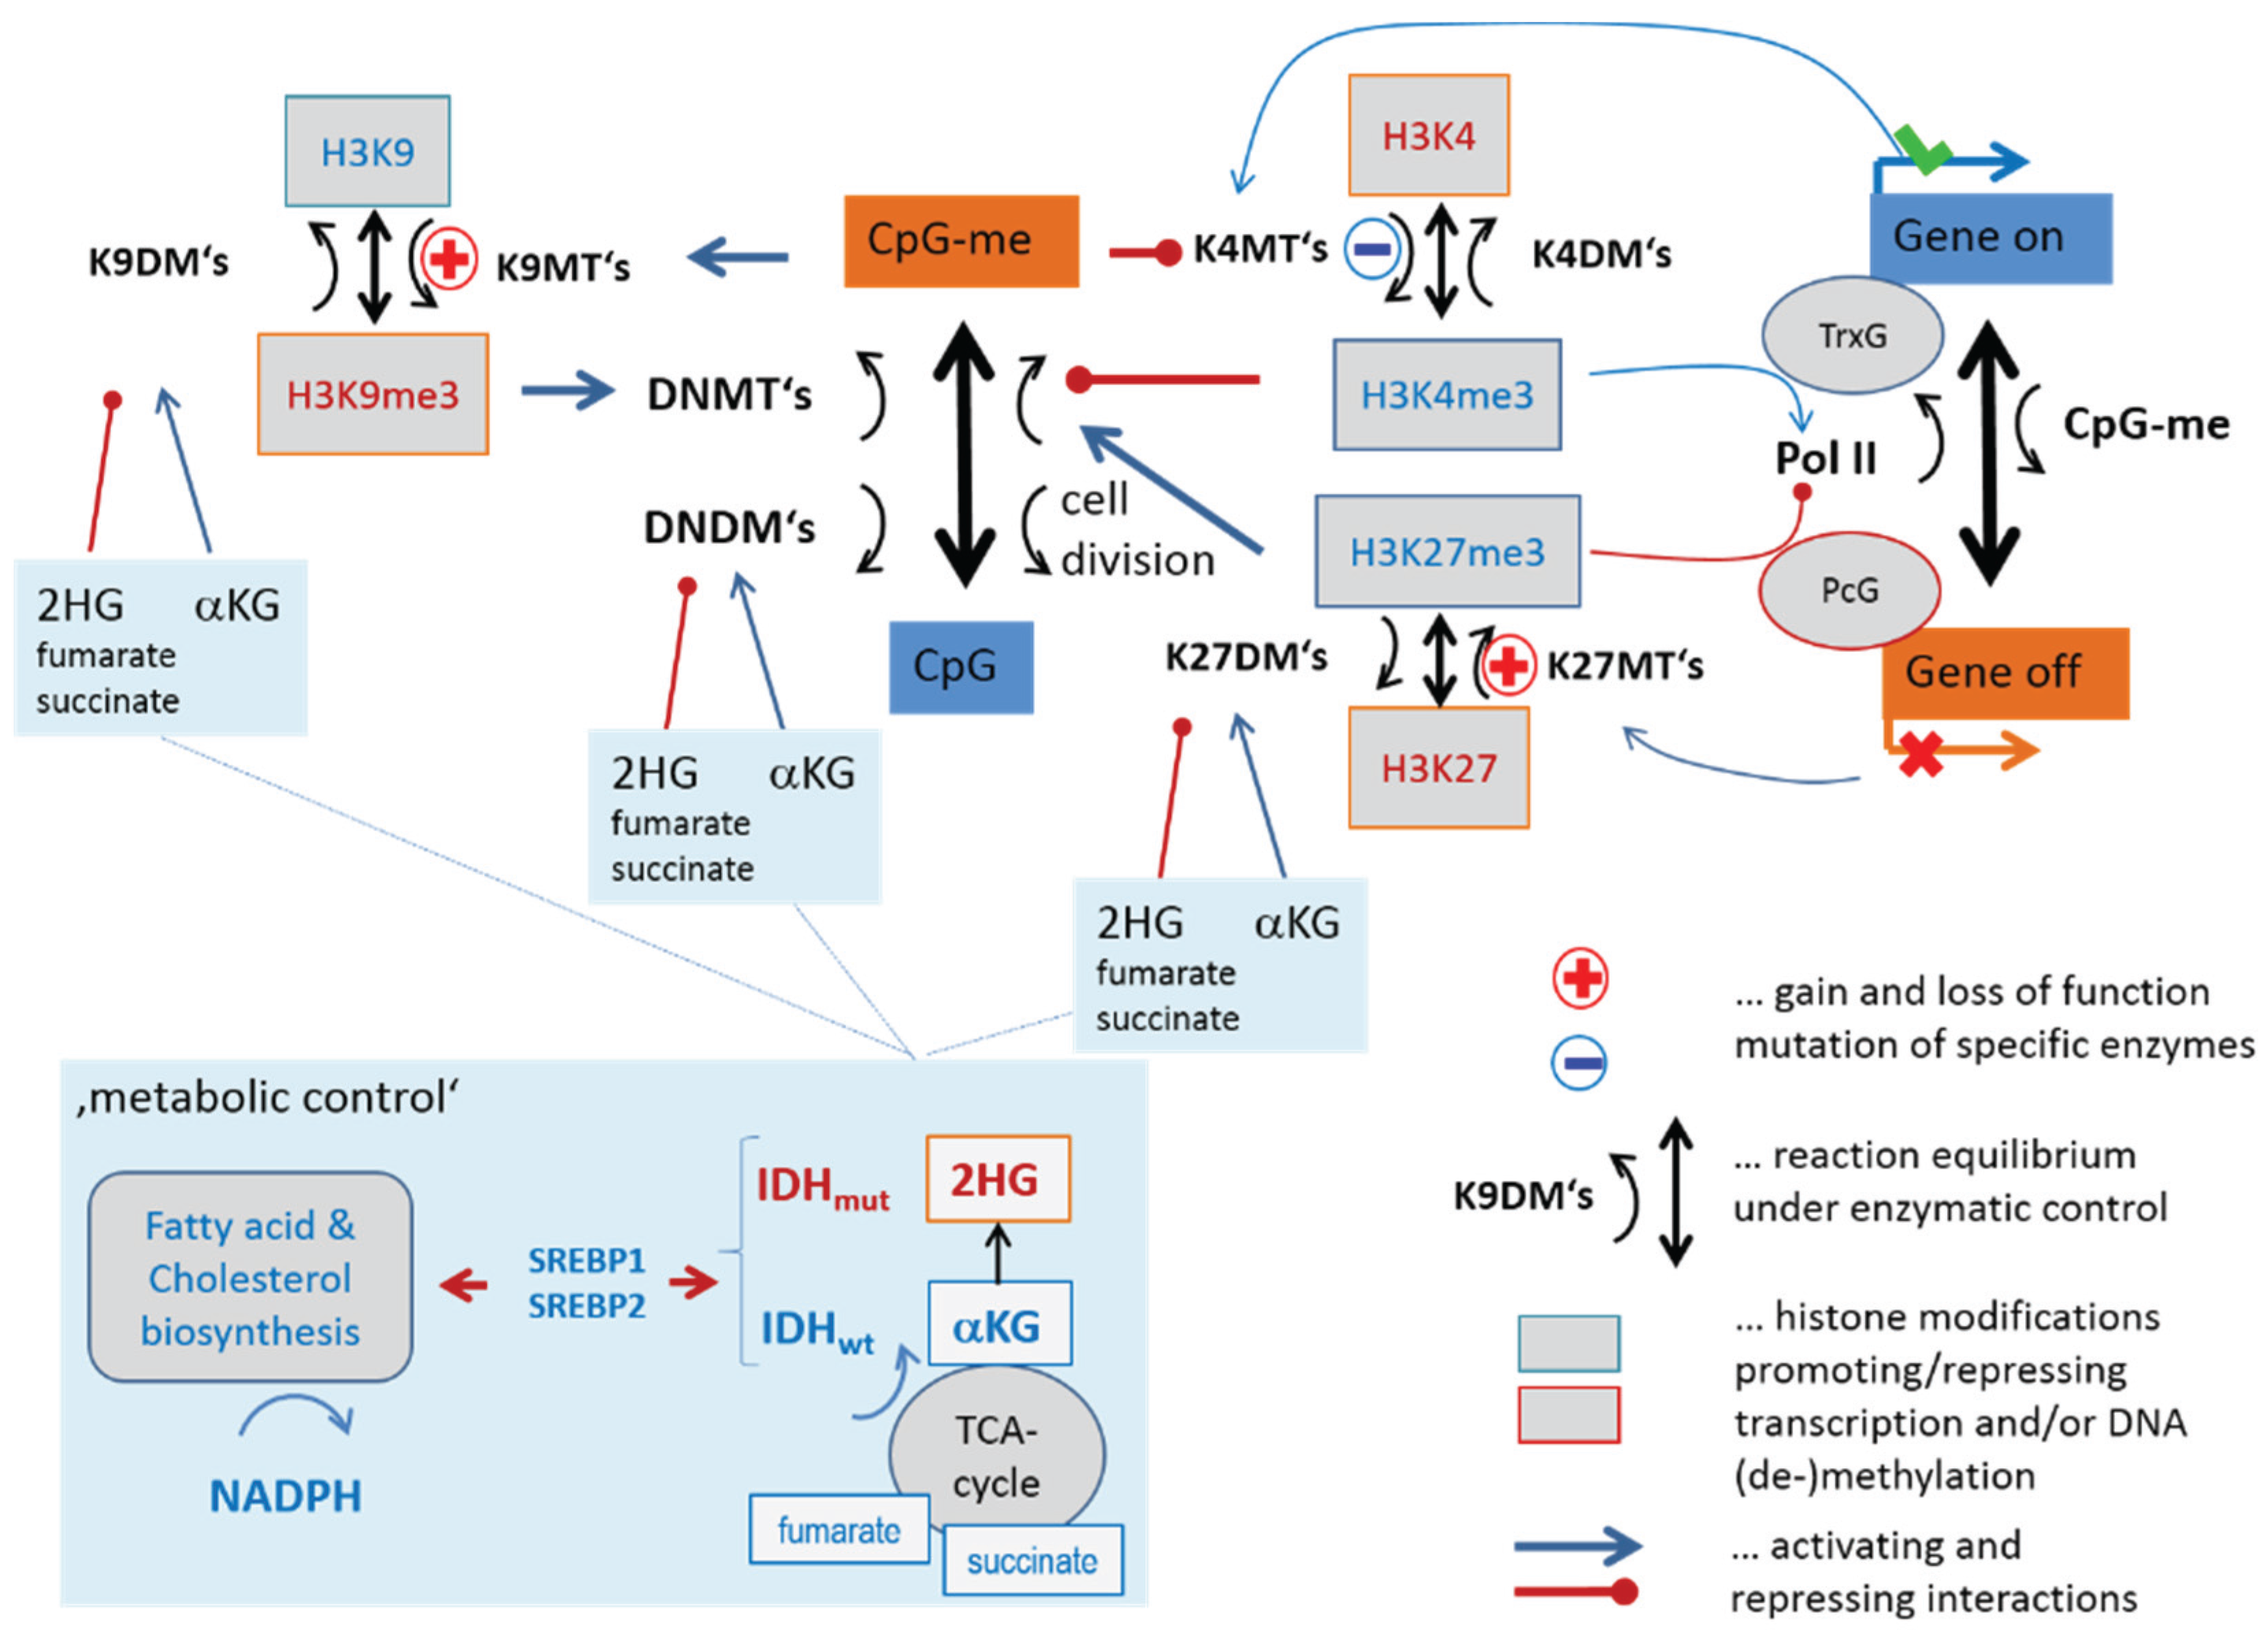
3.1. Transcription and DNA Methylation under the Control of Epigenetic Modifiers
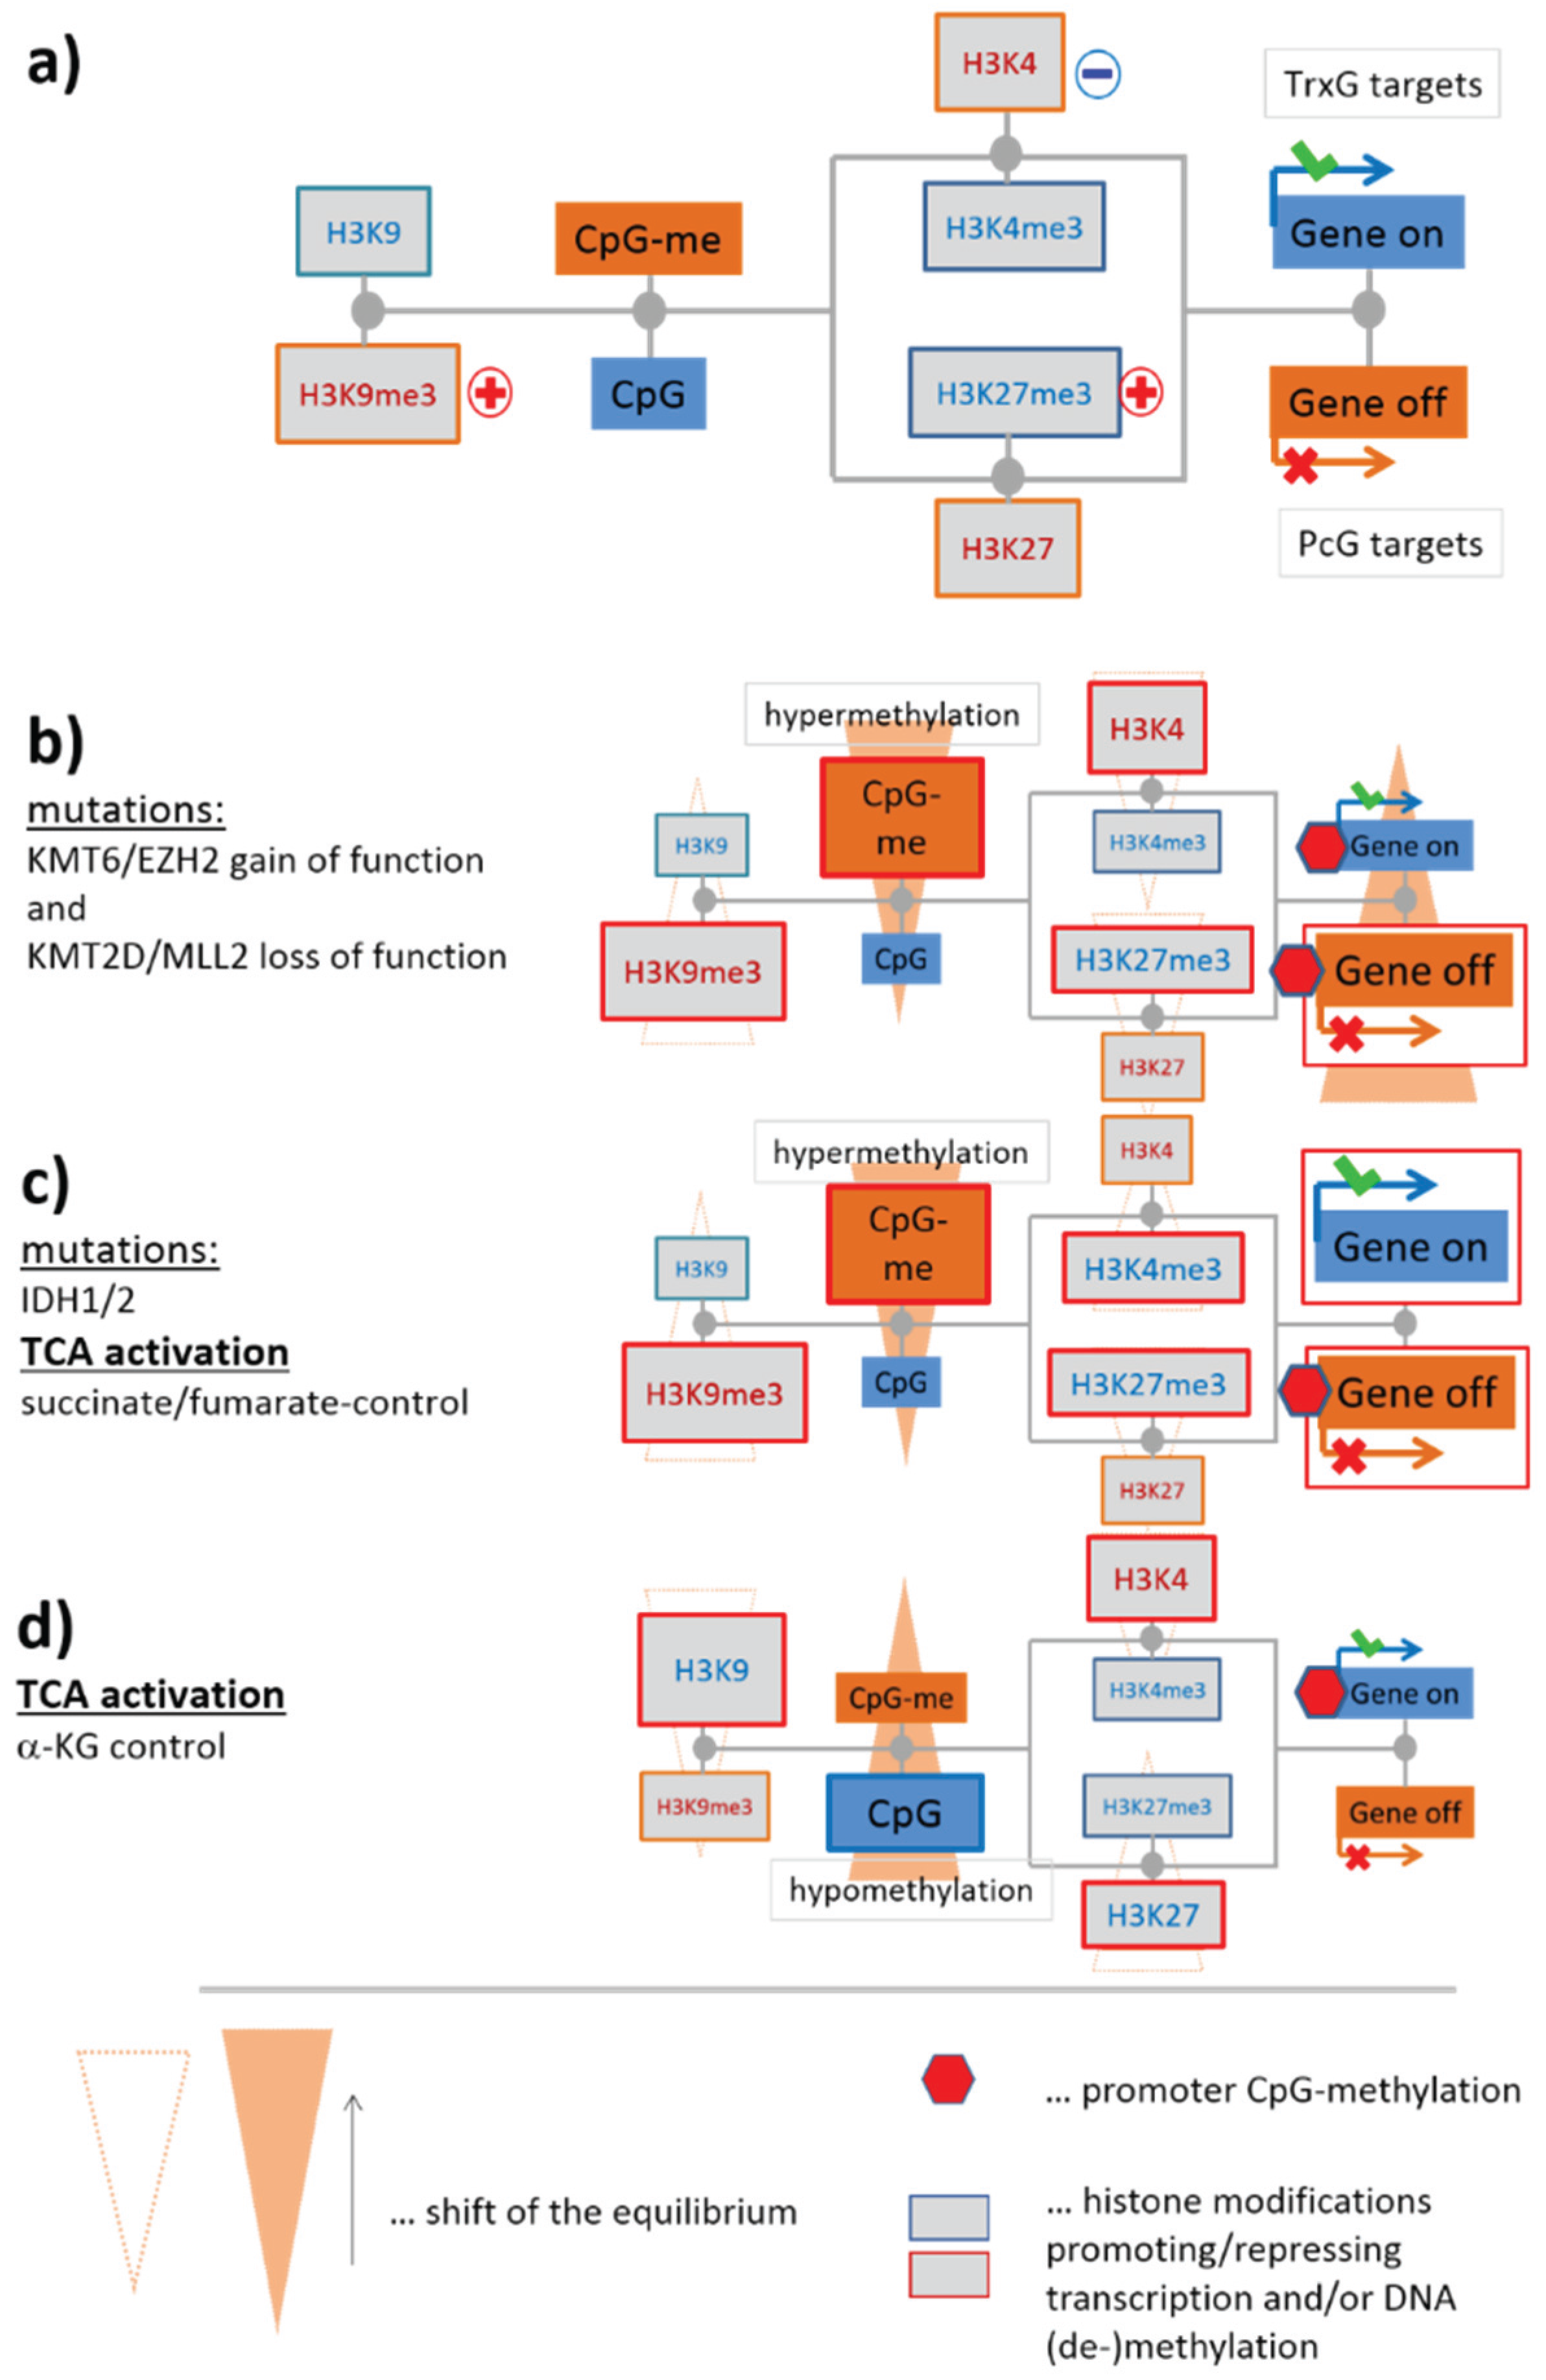
3.1.1. Mutual Coupling of Writer/Eraser Activities
3.1.2. Mutations of EZH2 and MLL2 Potentially Induce Hypermethylation
3.1.3. Epigenetics under Metabolic Control

| Target | Type1 | Enzyme | Alias | Mark | txn2 | mut3 | DEx4 | Spot5 | Comment6 |
|---|---|---|---|---|---|---|---|---|---|
| Writer Eraser Reader | Me | act. repr. | LvsBc4 | ||||||
| H3K4 | W | KMT2A | MLL | act | − | IJ | TrxG:MLL complex | ||
| KMT2B | MLL2, KMT2D | act | x | − | J | loss of function in DLBCL/FL, TrxG:MLL complex | |||
| KMT2F | SETD1A | act | − | (H) | |||||
| KMT2G | SETD1B | Me3 | act | − | H | ||||
| KMT3C * | SMYD2 | Me2/Me3 | act | x | (MM) | ||||
| KMT3E | SMYD3 | Me2/Me3 | act | + | (D) | ||||
| PRDM9 | MSBP3. PFM6 | Me3 | act | − | (I) | ||||
| SETMAR * | METNASE | act | x | B | |||||
| E | KDM1A * | LSD1, AOF2 | Me1/Me2 | rep | + | B | “gene body cleaner” | ||
| KDM5A | JARID1A, RBBP2 | Me2/Me3 | rep | x | (A) | JmjC, “gene body cleaner” | |||
| KDM5B | JARID1B, PLU1 | rep | − | (F) | JmjC | ||||
| KDM5C | JARID1C, SMCX | rep | + | (I) | JmjC | ||||
| H3K9 | W | KMT1C * | EHMT2, G9A | Me1/Me2 | rep | x | (B) | ||
| KMT1D * | EHMT1, GLP | Me1/Me2 | rep | + | (D) | ||||
| KMT1E | SETDB1 | Me3 | rep | x | (I) | ||||
| KMT6(A) * | EZH2 | rep | + | + | D | gain of function in cancer/DLBCL/FL, PRC2 complex | |||
| KMT8 | PRDM2, RIZ | rep | − | (D) | Missense mutation in DLBCL | ||||
| E | KDM1A * | LSD1, AOF2 | act | + | B | ||||
| KDM3A | JMJD1, TSGA | Me1/Me2 | act | − | (IM) | JmjC | |||
| KDM3B | JHDM2B | act | x | (C) | JmjC | ||||
| KDM4A * | JMJD2 | Me3 | act | − | (J) | JmjC | |||
| KDM4B | JHDM3B | Me3 | act | − | J | JmjC | |||
| KDM4C * | JHDM3C | Me3 | act | − | I | JmjC | |||
| KDM4D | JMJD2D | Me2/Me3 | act | x | (B) | JmjC | |||
| KDM7A * | JHDM1D | Me2 | act | − | H | JmjC | |||
| MINA | MDIG, ROX | Me3 | act | + | (B) | ||||
| H3K27 | W | KMT1C * | EHMT2, G9A | rep | x | (B) | |||
| KMT1D * | EHMT1, GLP | rep | + | (D) | |||||
| KMT6(A) * | EZH2 | rep | + | + | D | gain of function in cancer/DLBCL/FL, PRC2 complex | |||
| KMT6B | EZH1 | rep | − | J | PRC2 complex | ||||
| WHSC1 | NSD2, MMSET | rep | + | D | mutated in BL and MCL, opens chromatin | ||||
| E | KDM6A | UTX | Me2/Me3 | act | − | (IM) | |||
| KDM6B | JMJD3 | Me2/Me3 | act | − | J | involved in inflamma-tory response, JmjC | |||
| KDM7A * | JHDM1D | Me2 | act | x | − | H | JmjC | ||
| H3K36 | E | KDM2A | FBXL11, JHDM1A | Me2 | − | (H) | JmjC | ||
| KDM4A * | JMJD2 | Me3 | rep | − | (J) | JmjC | |||
| KDM4C * | JHDM3C | Me3 | rep | − | I | JmjC | |||
| KDM8 | JMJD5 | Me2 | rep | x | (B) | JmjC | |||
| W | KMT2H | ASH1L | act | − | (I) | ||||
| KMT3A | SETD2, SET2 | Me3 | act | − | J | recruits MMR | |||
| KMT3B | NSD1, STO | − | (J) | ||||||
| KMT3C * | SMYD2 | Me2 | act | x | (MM) | ||||
| SETMAR * | METNASE | Me2 | act | x | B | ||||
| H3K79 | W | KMT4 | DOT1L | act | x | x | (MM) | Loss of function in Lymphoma | |
| DNA | W | DNMT1 | rep | + | D | maintenance | |||
| DNMT3A | rep | x | (D) | de novo methylation | |||||
| DNMT3B | rep | + | B | de novo methylation | |||||
| DNMT3L | rep | + | (D) | Induces de novo DNA methylation by recruitment or activation of DNMT3 | |||||
| E | TET3 | act | − | I | |||||
| R, E | MBD2 | act/rep | − | (I) | mediates CpG-methylation signal |
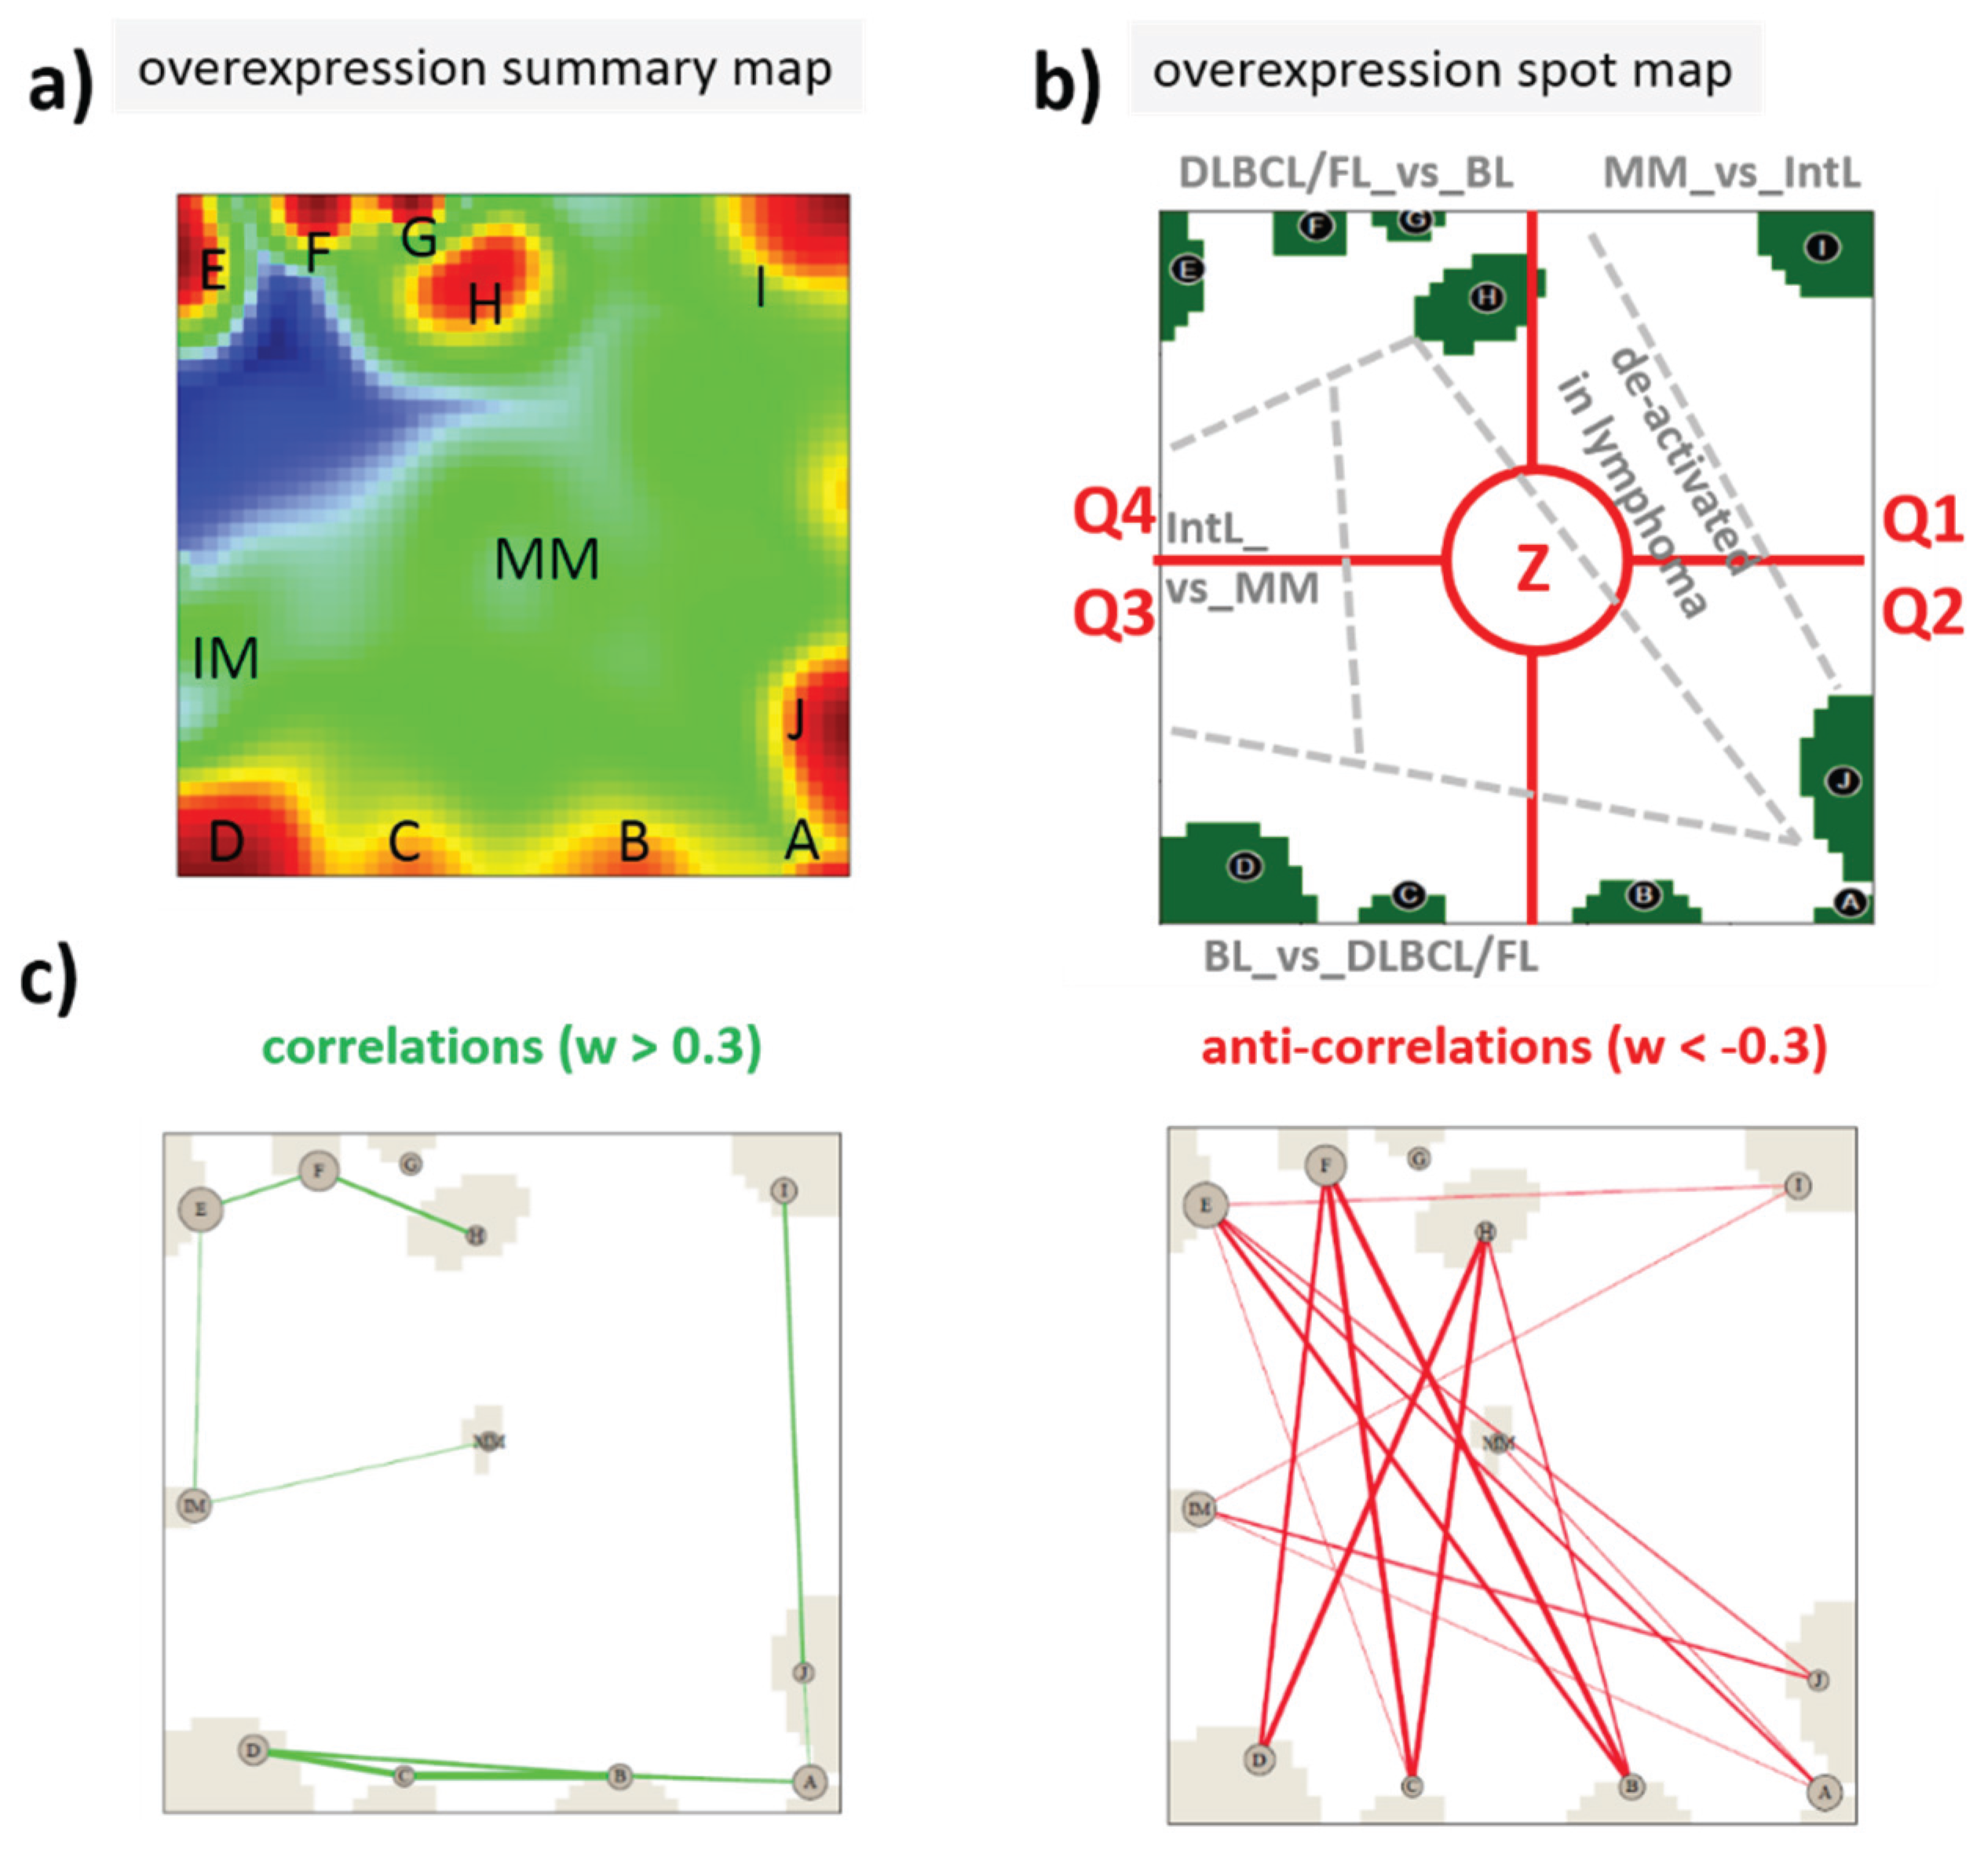
3.2. Expression Cartography of Epigenetic Modifiers
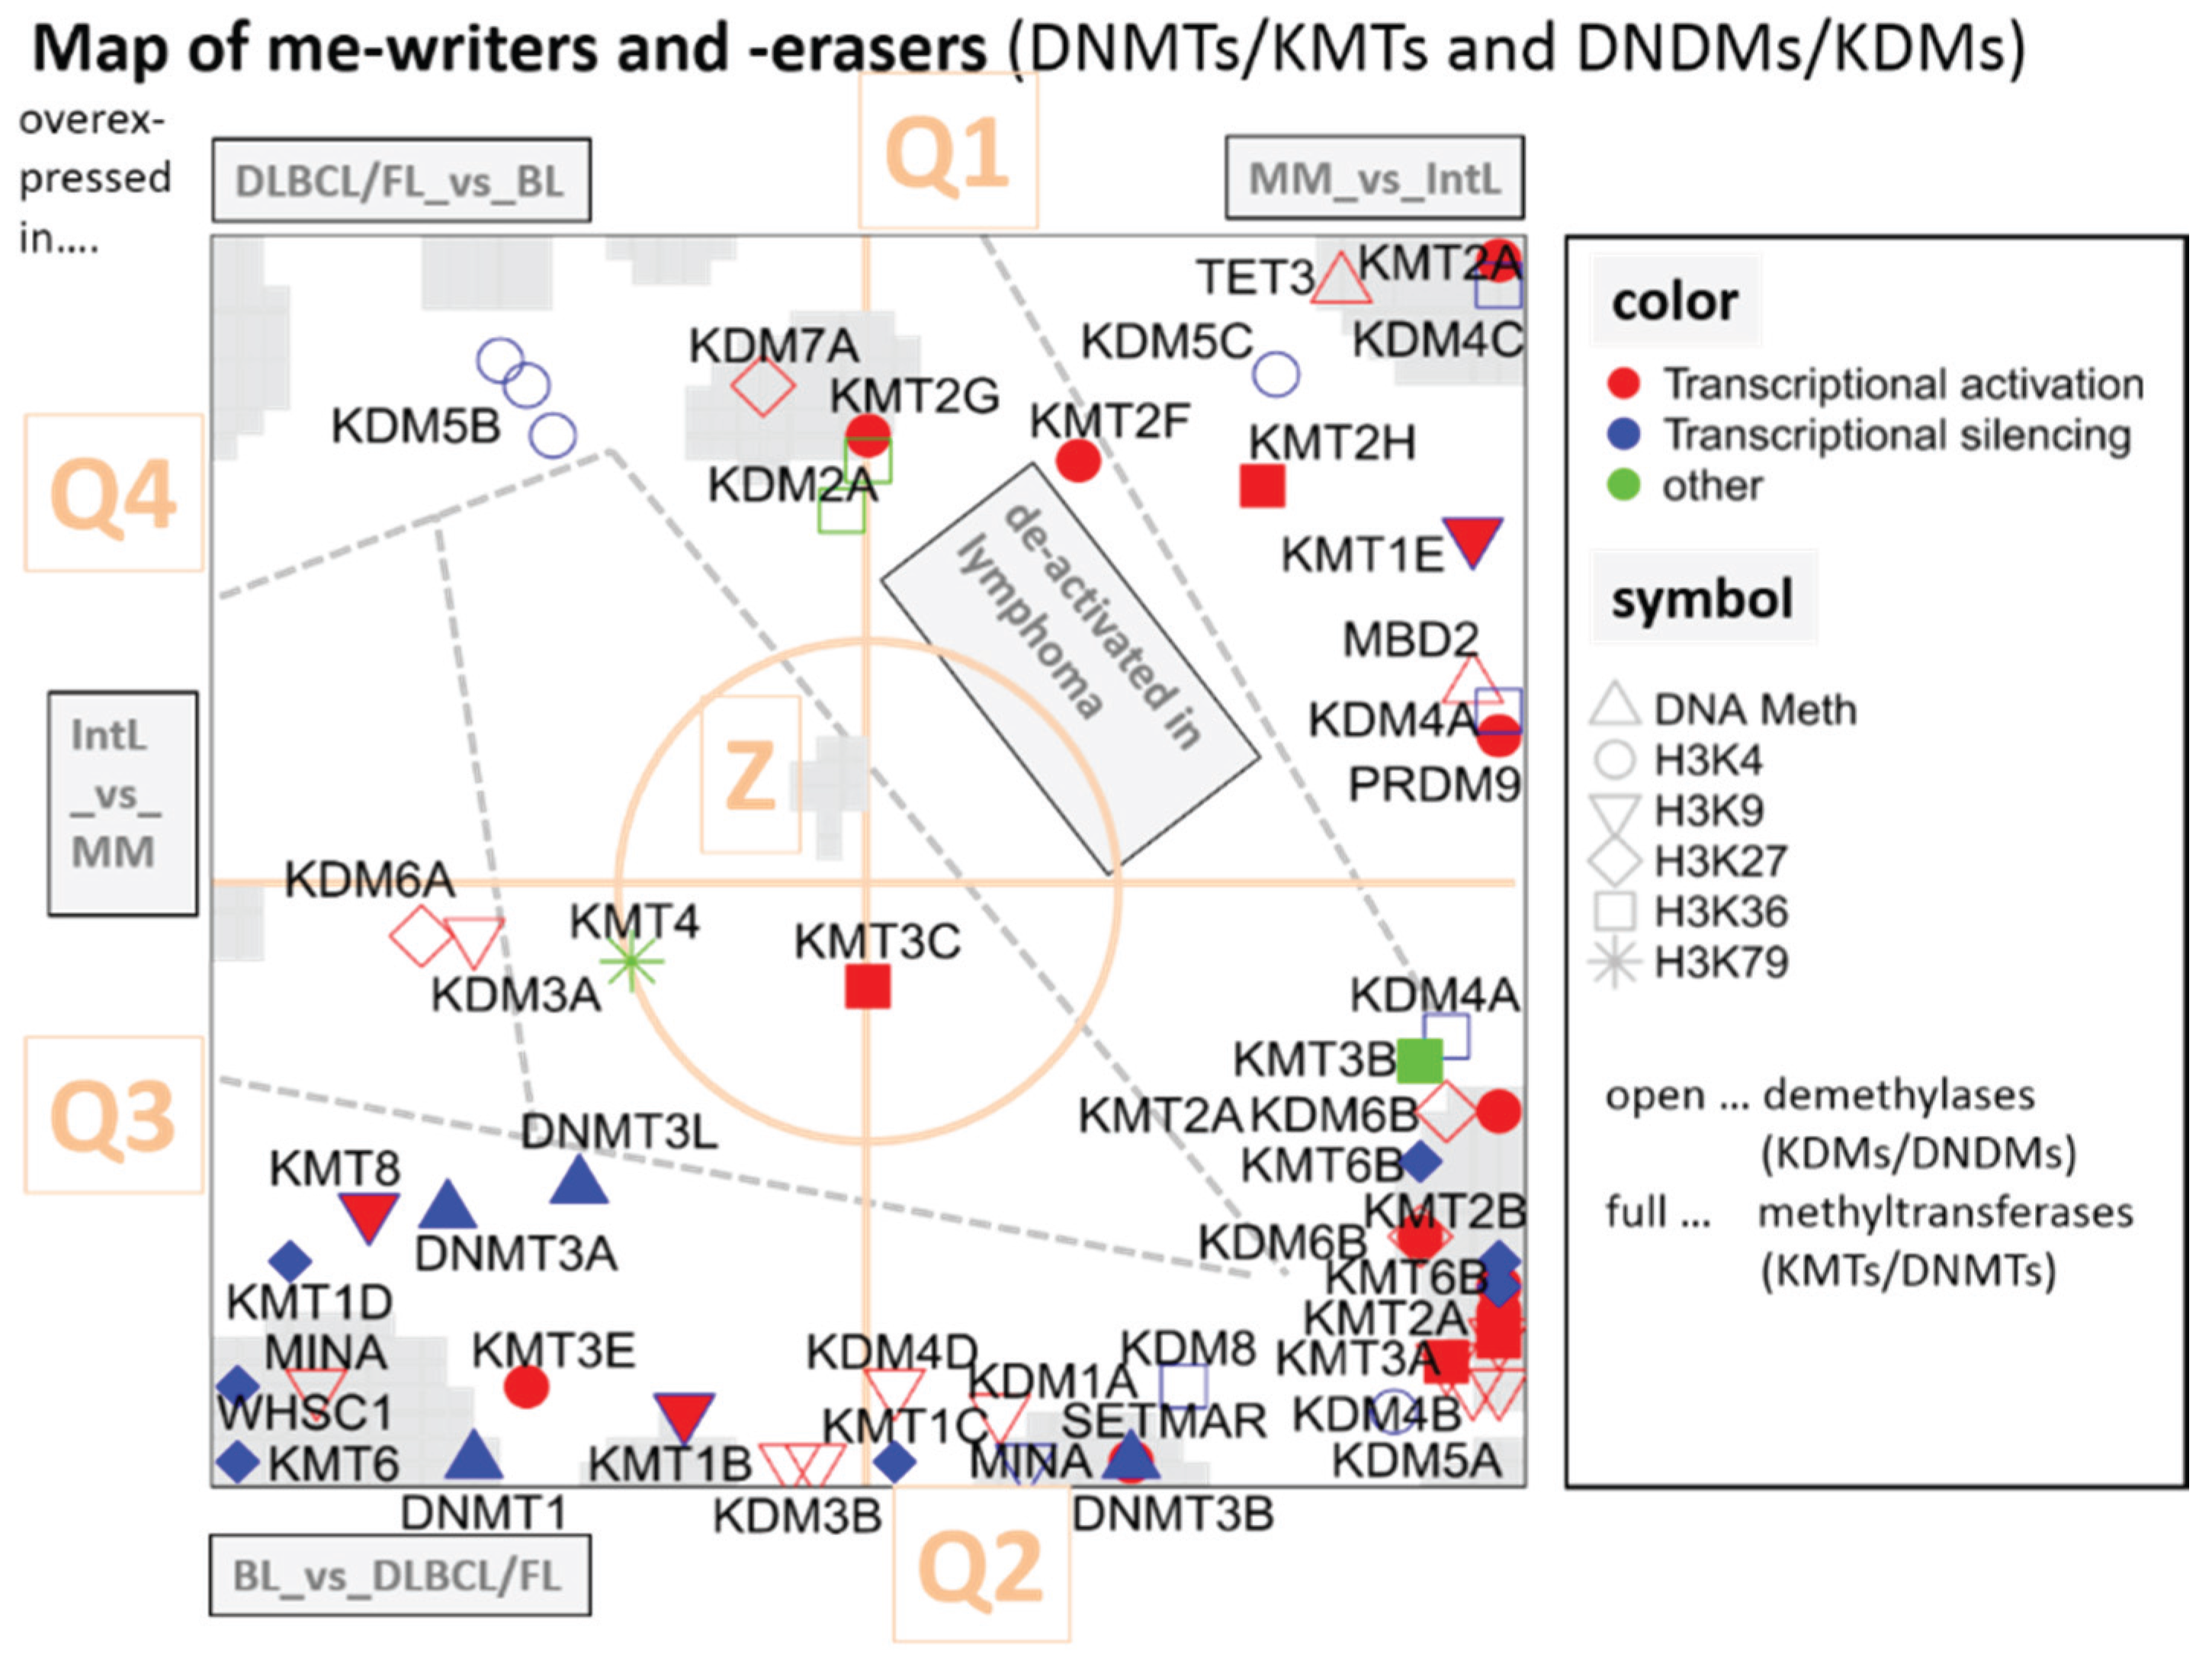
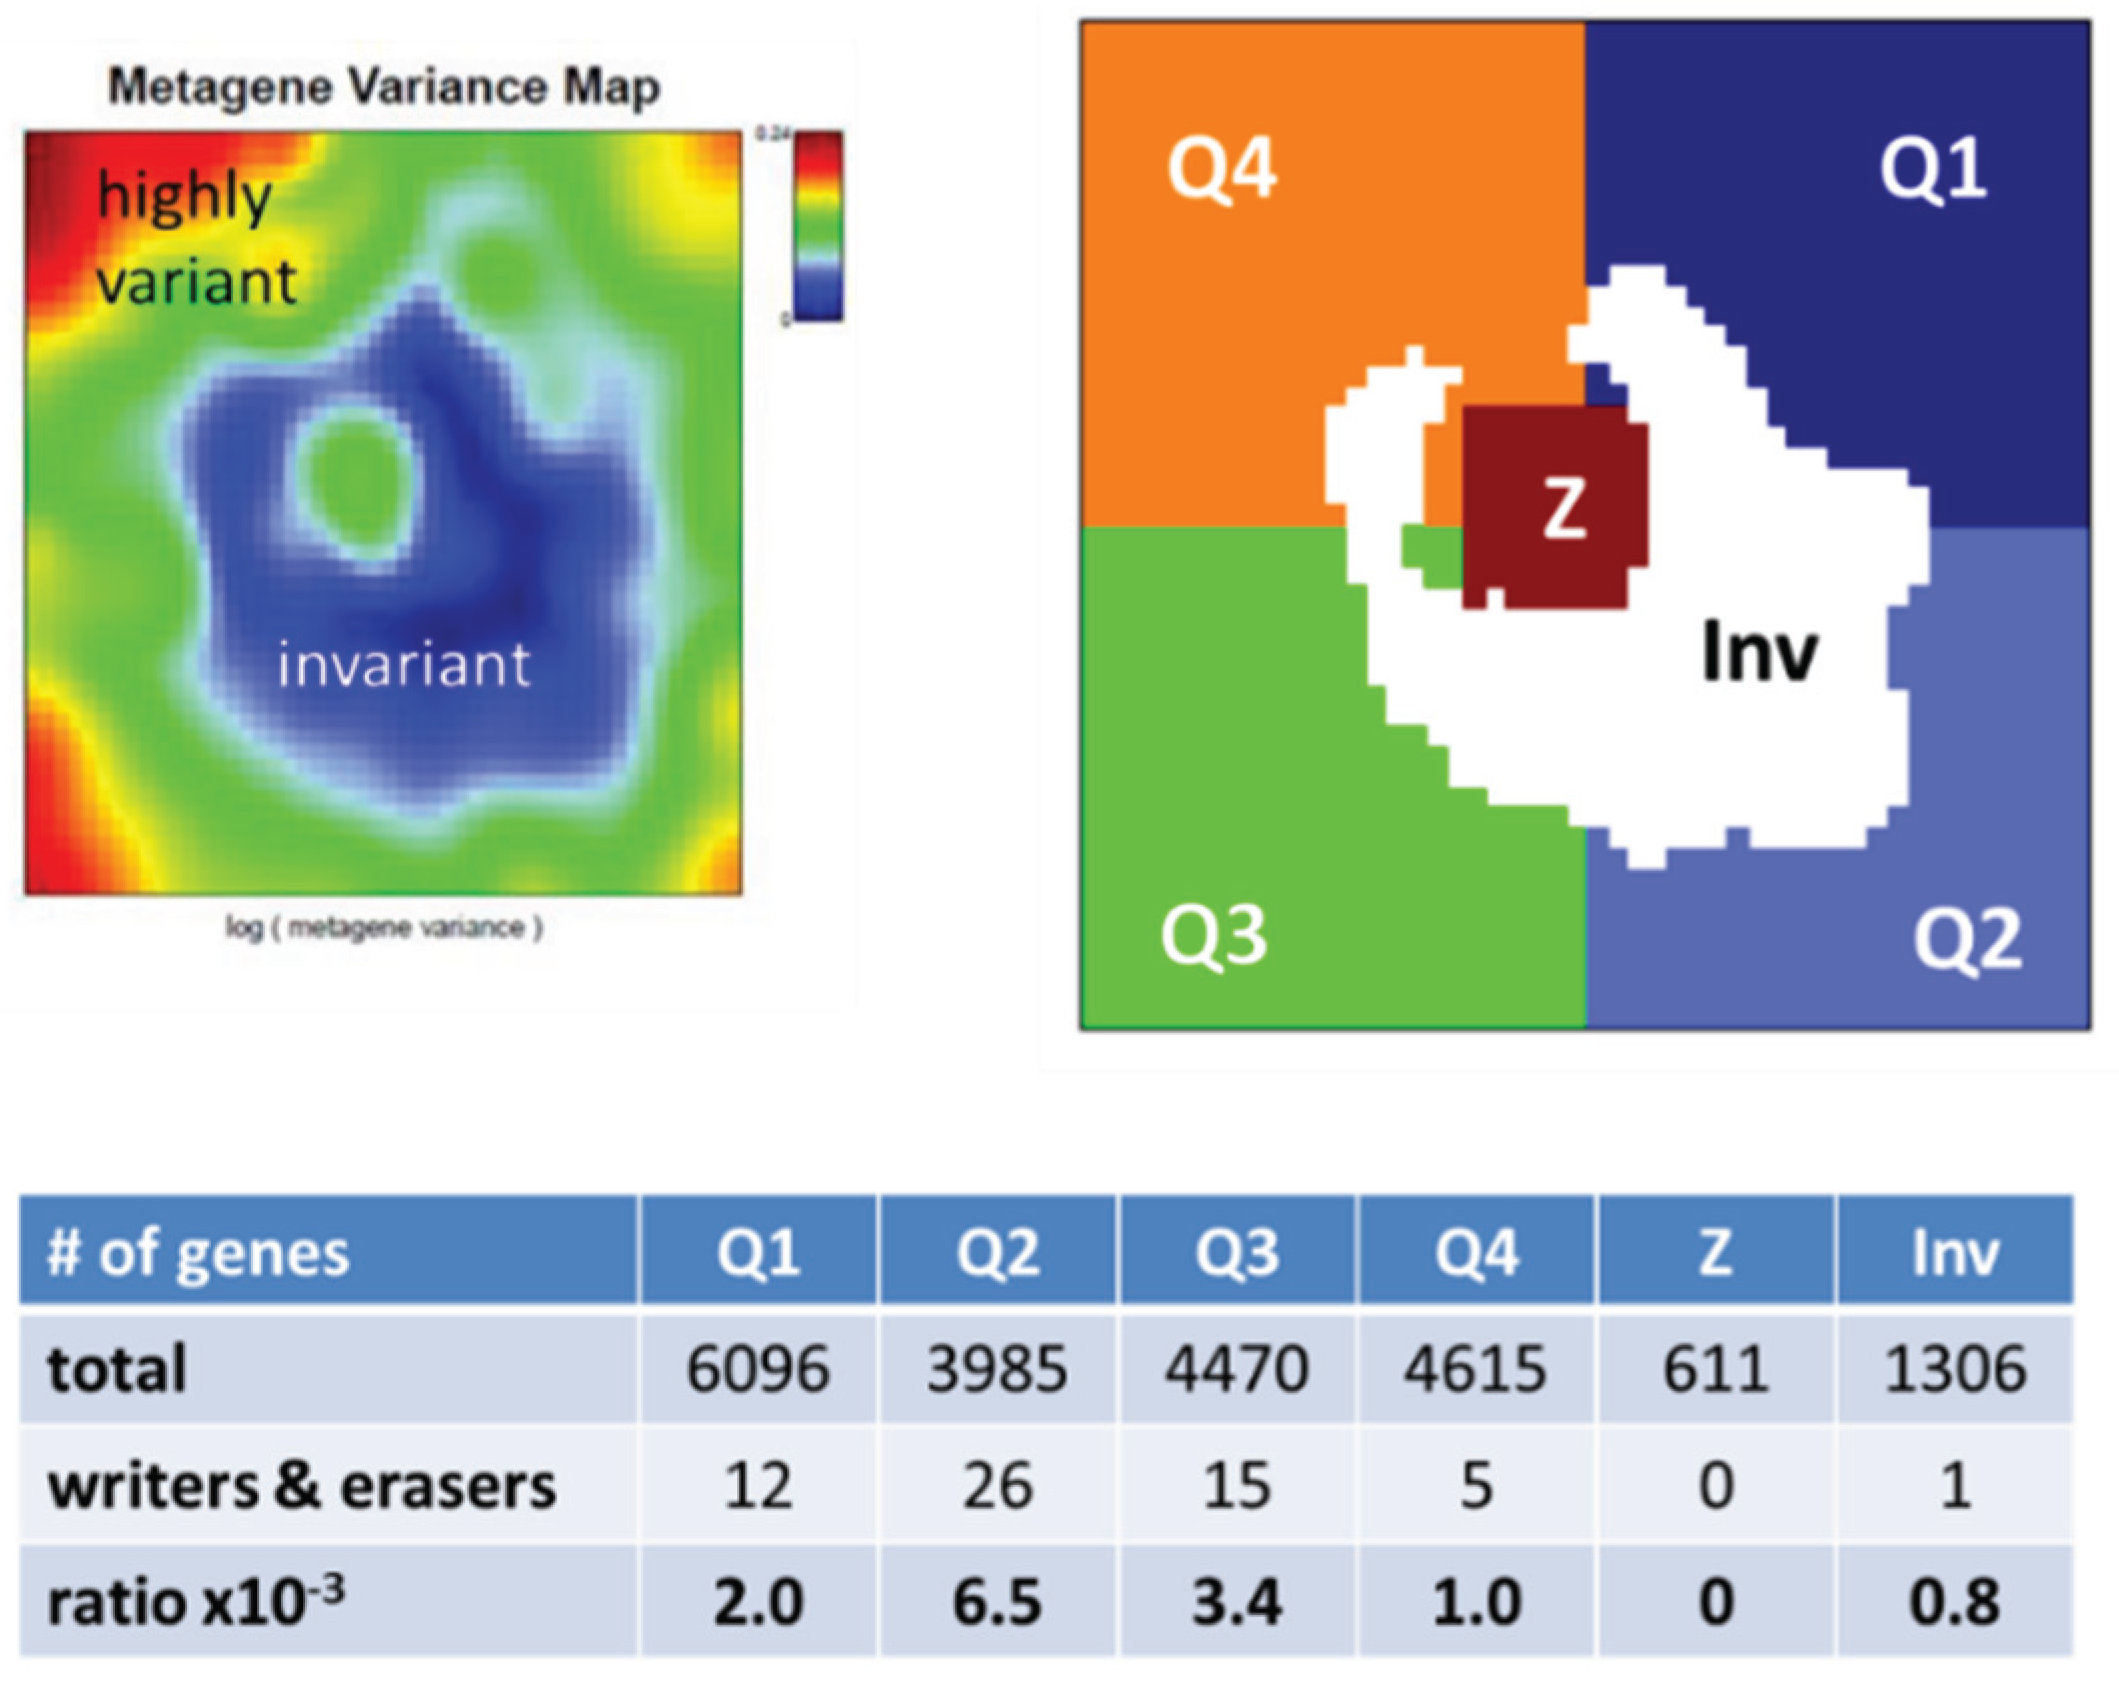
3.2.1. SOM Expression Map of Epigenetic Modifiers

3.2.2. DNA Methylating Enzymes: DNA-MTs and -DMs
3.2.3. Histone K27MTs and DMs
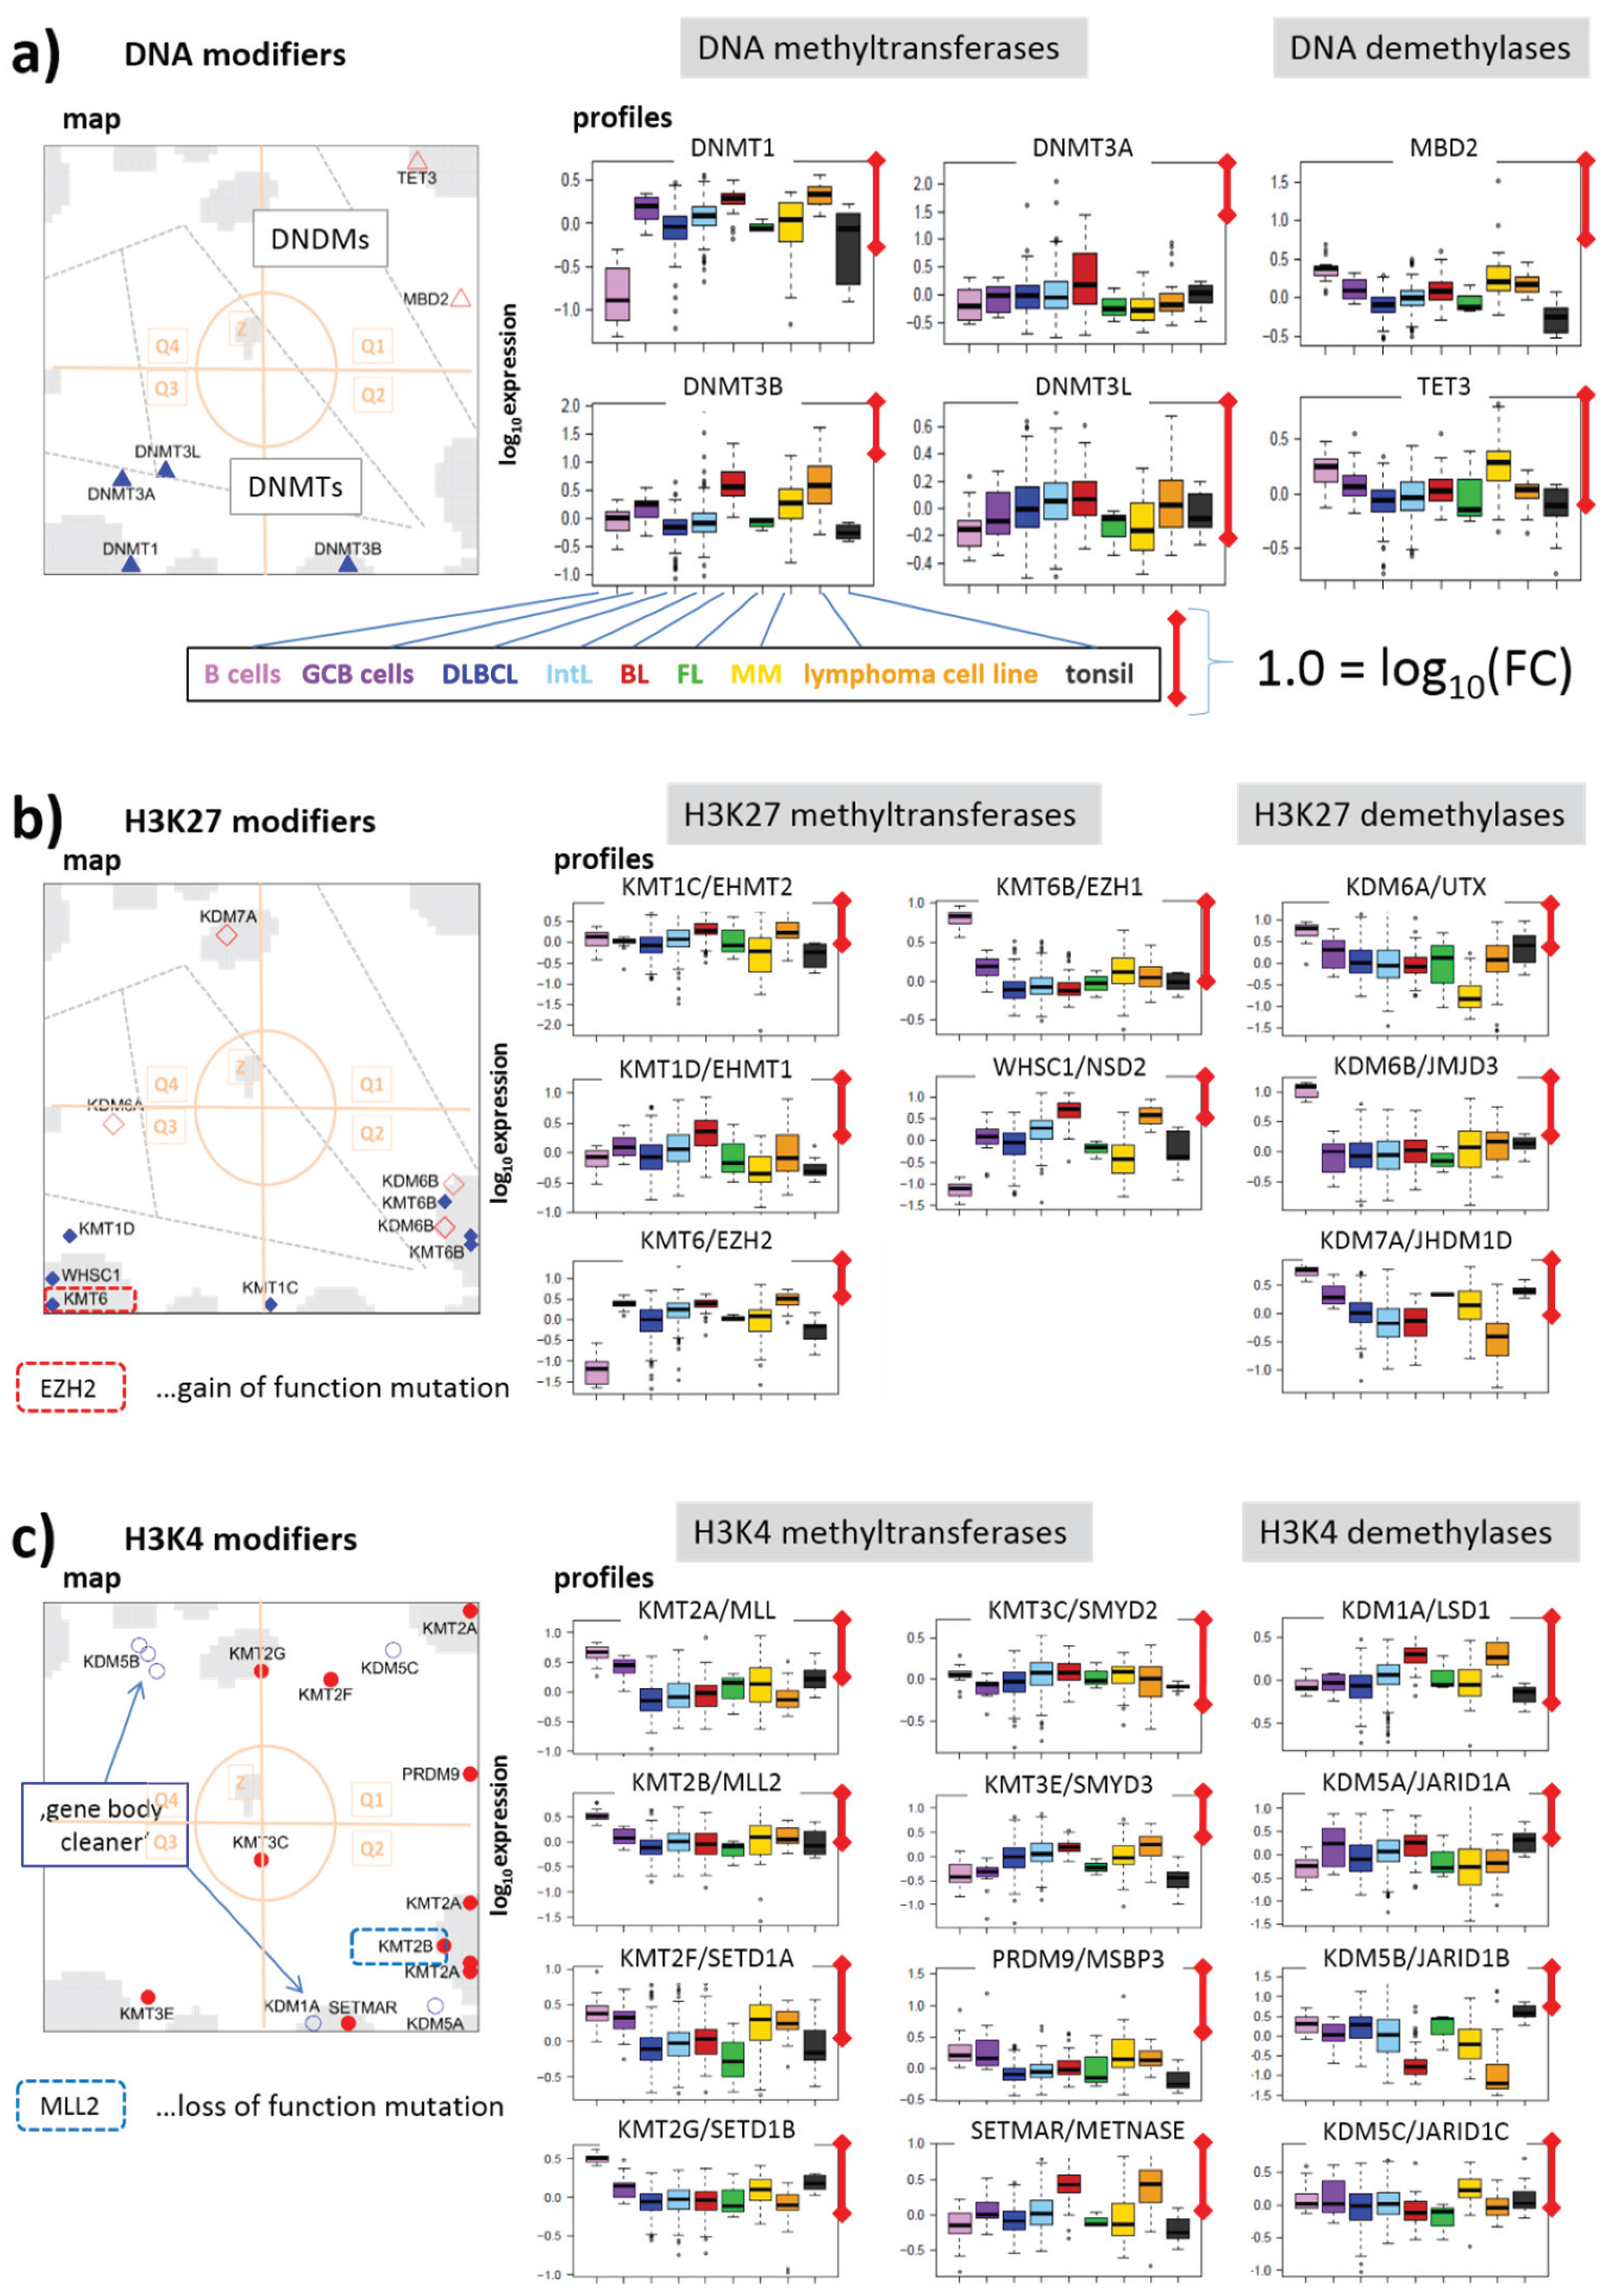

3.2.4. Histone K4MTs and DMs
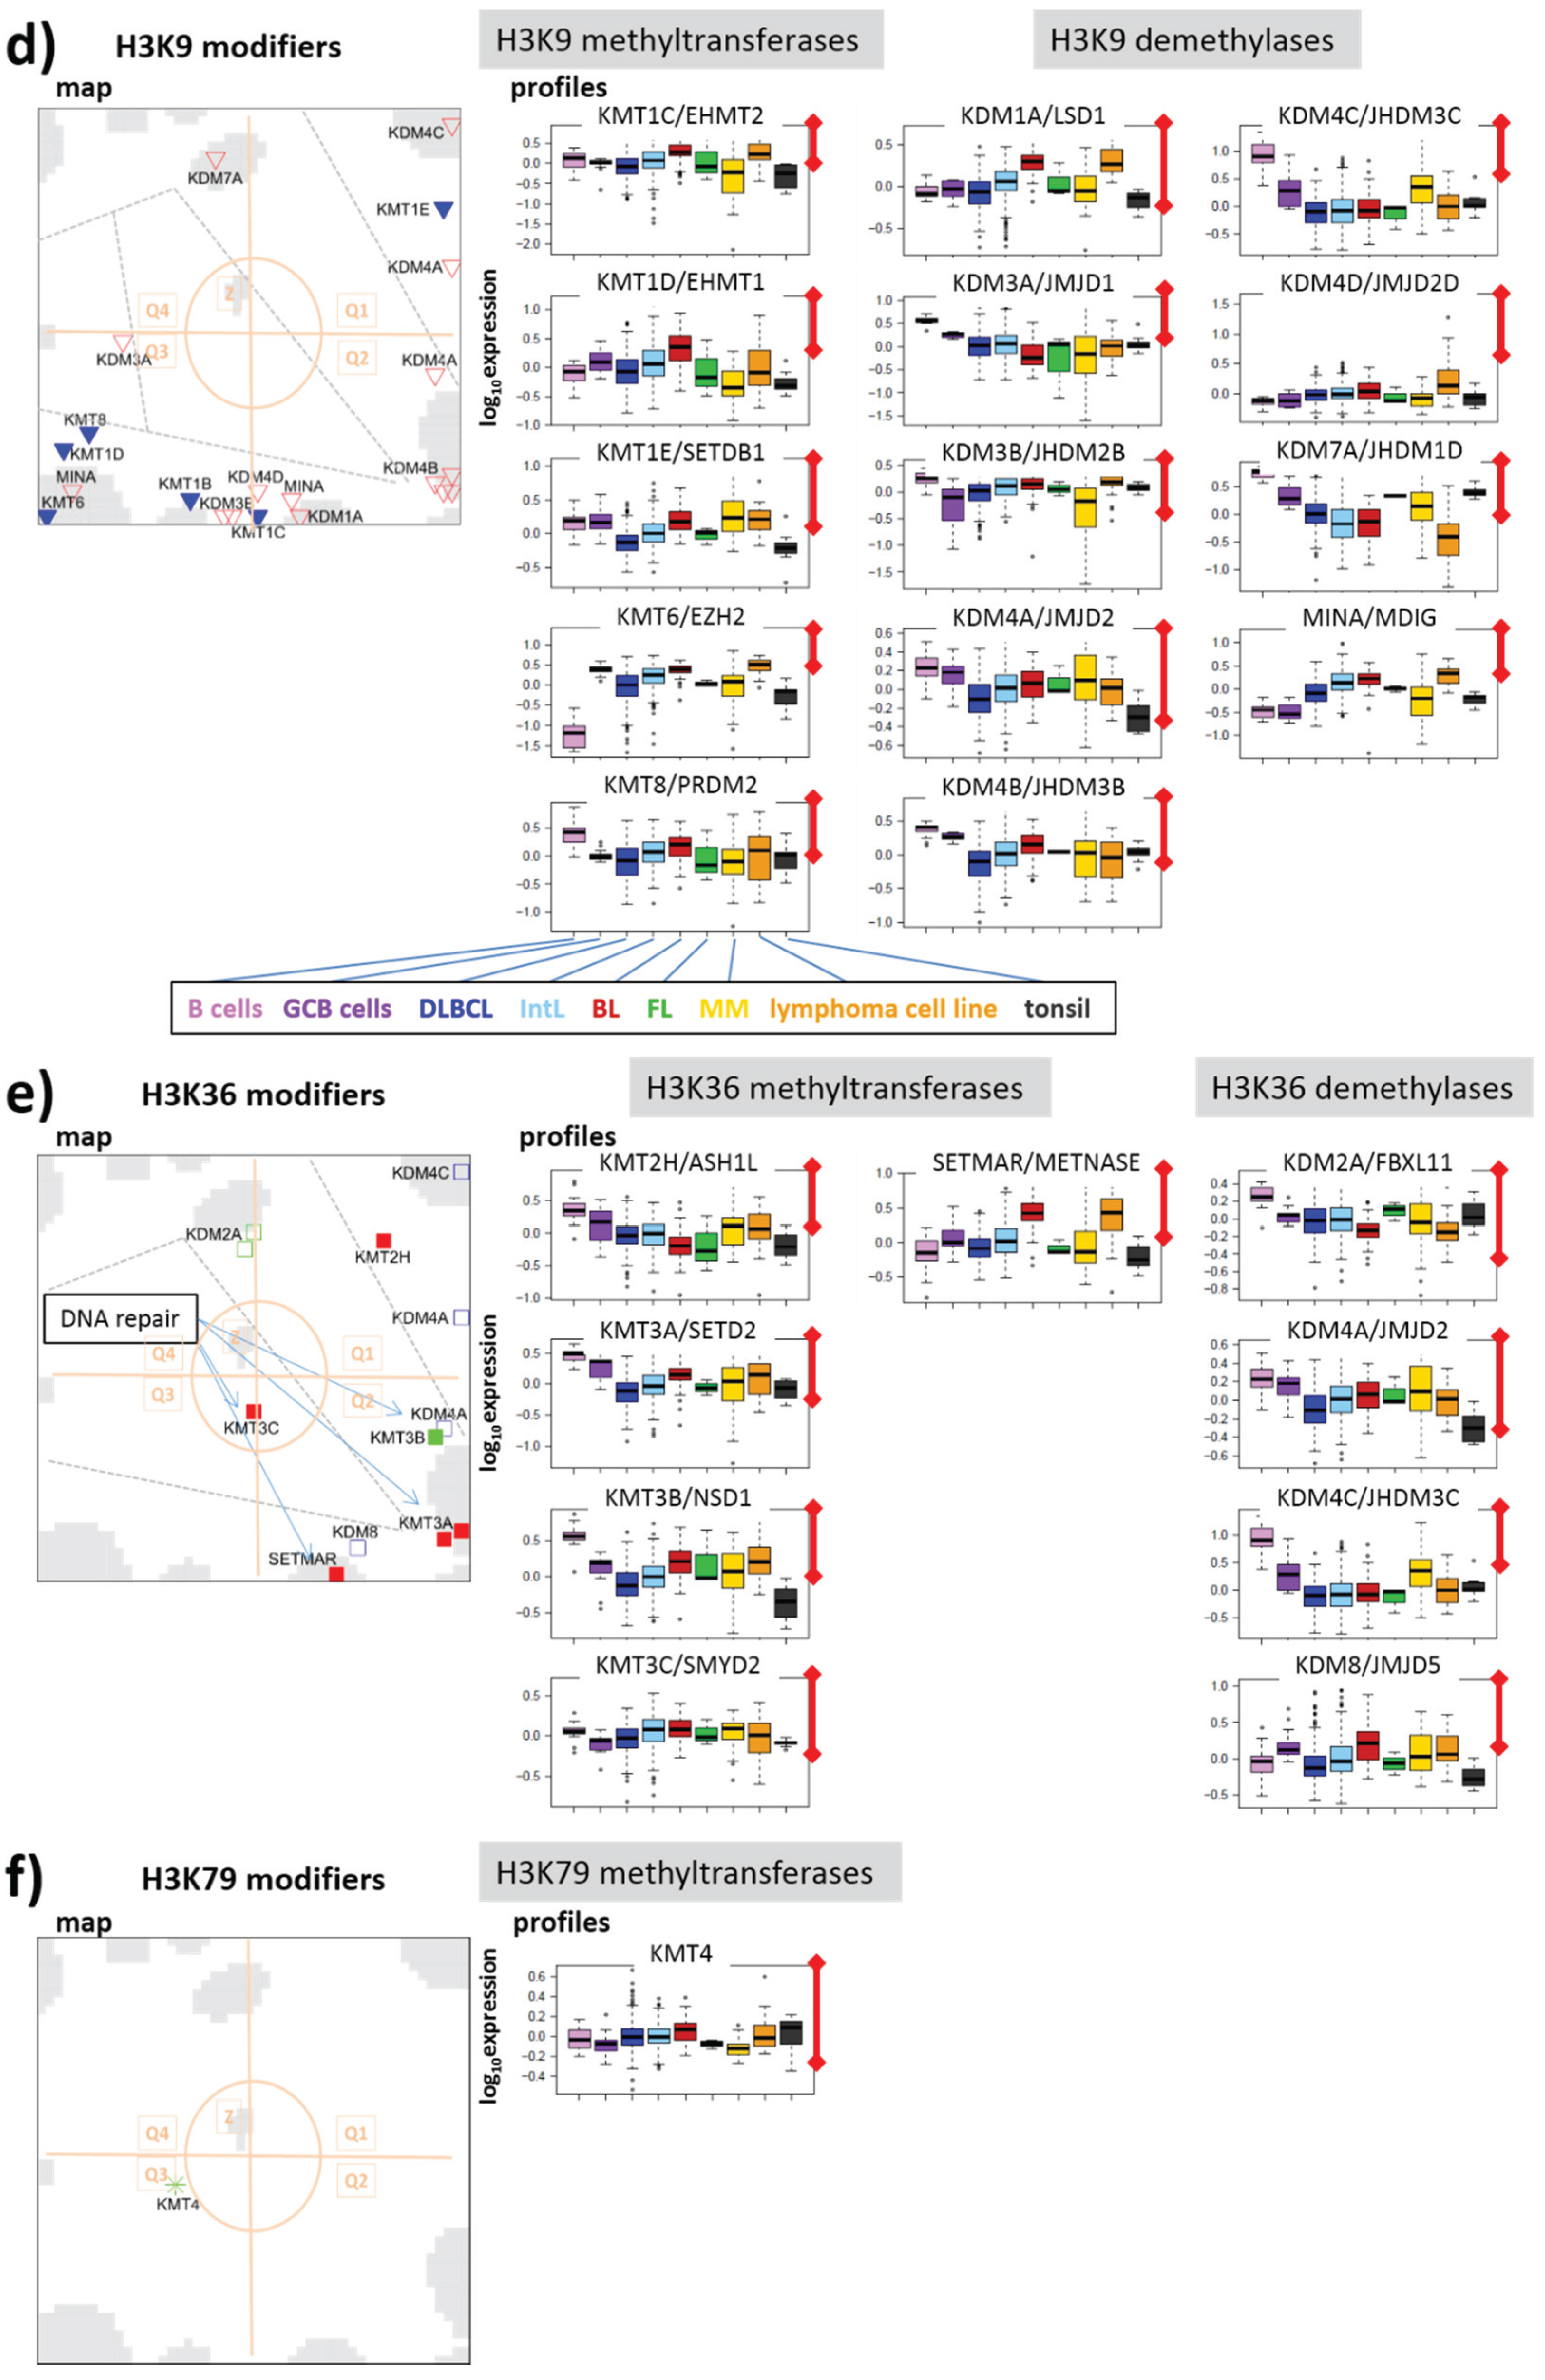
3.2.5. Histone K9MTs and DMs
3.2.6. Histone K36MTs and DMs
3.2.7. Histone K79MT
3.3. Expression Cartography of Chromatin Remodeling Complexes
3.3.1. TrxG/MLL Complex
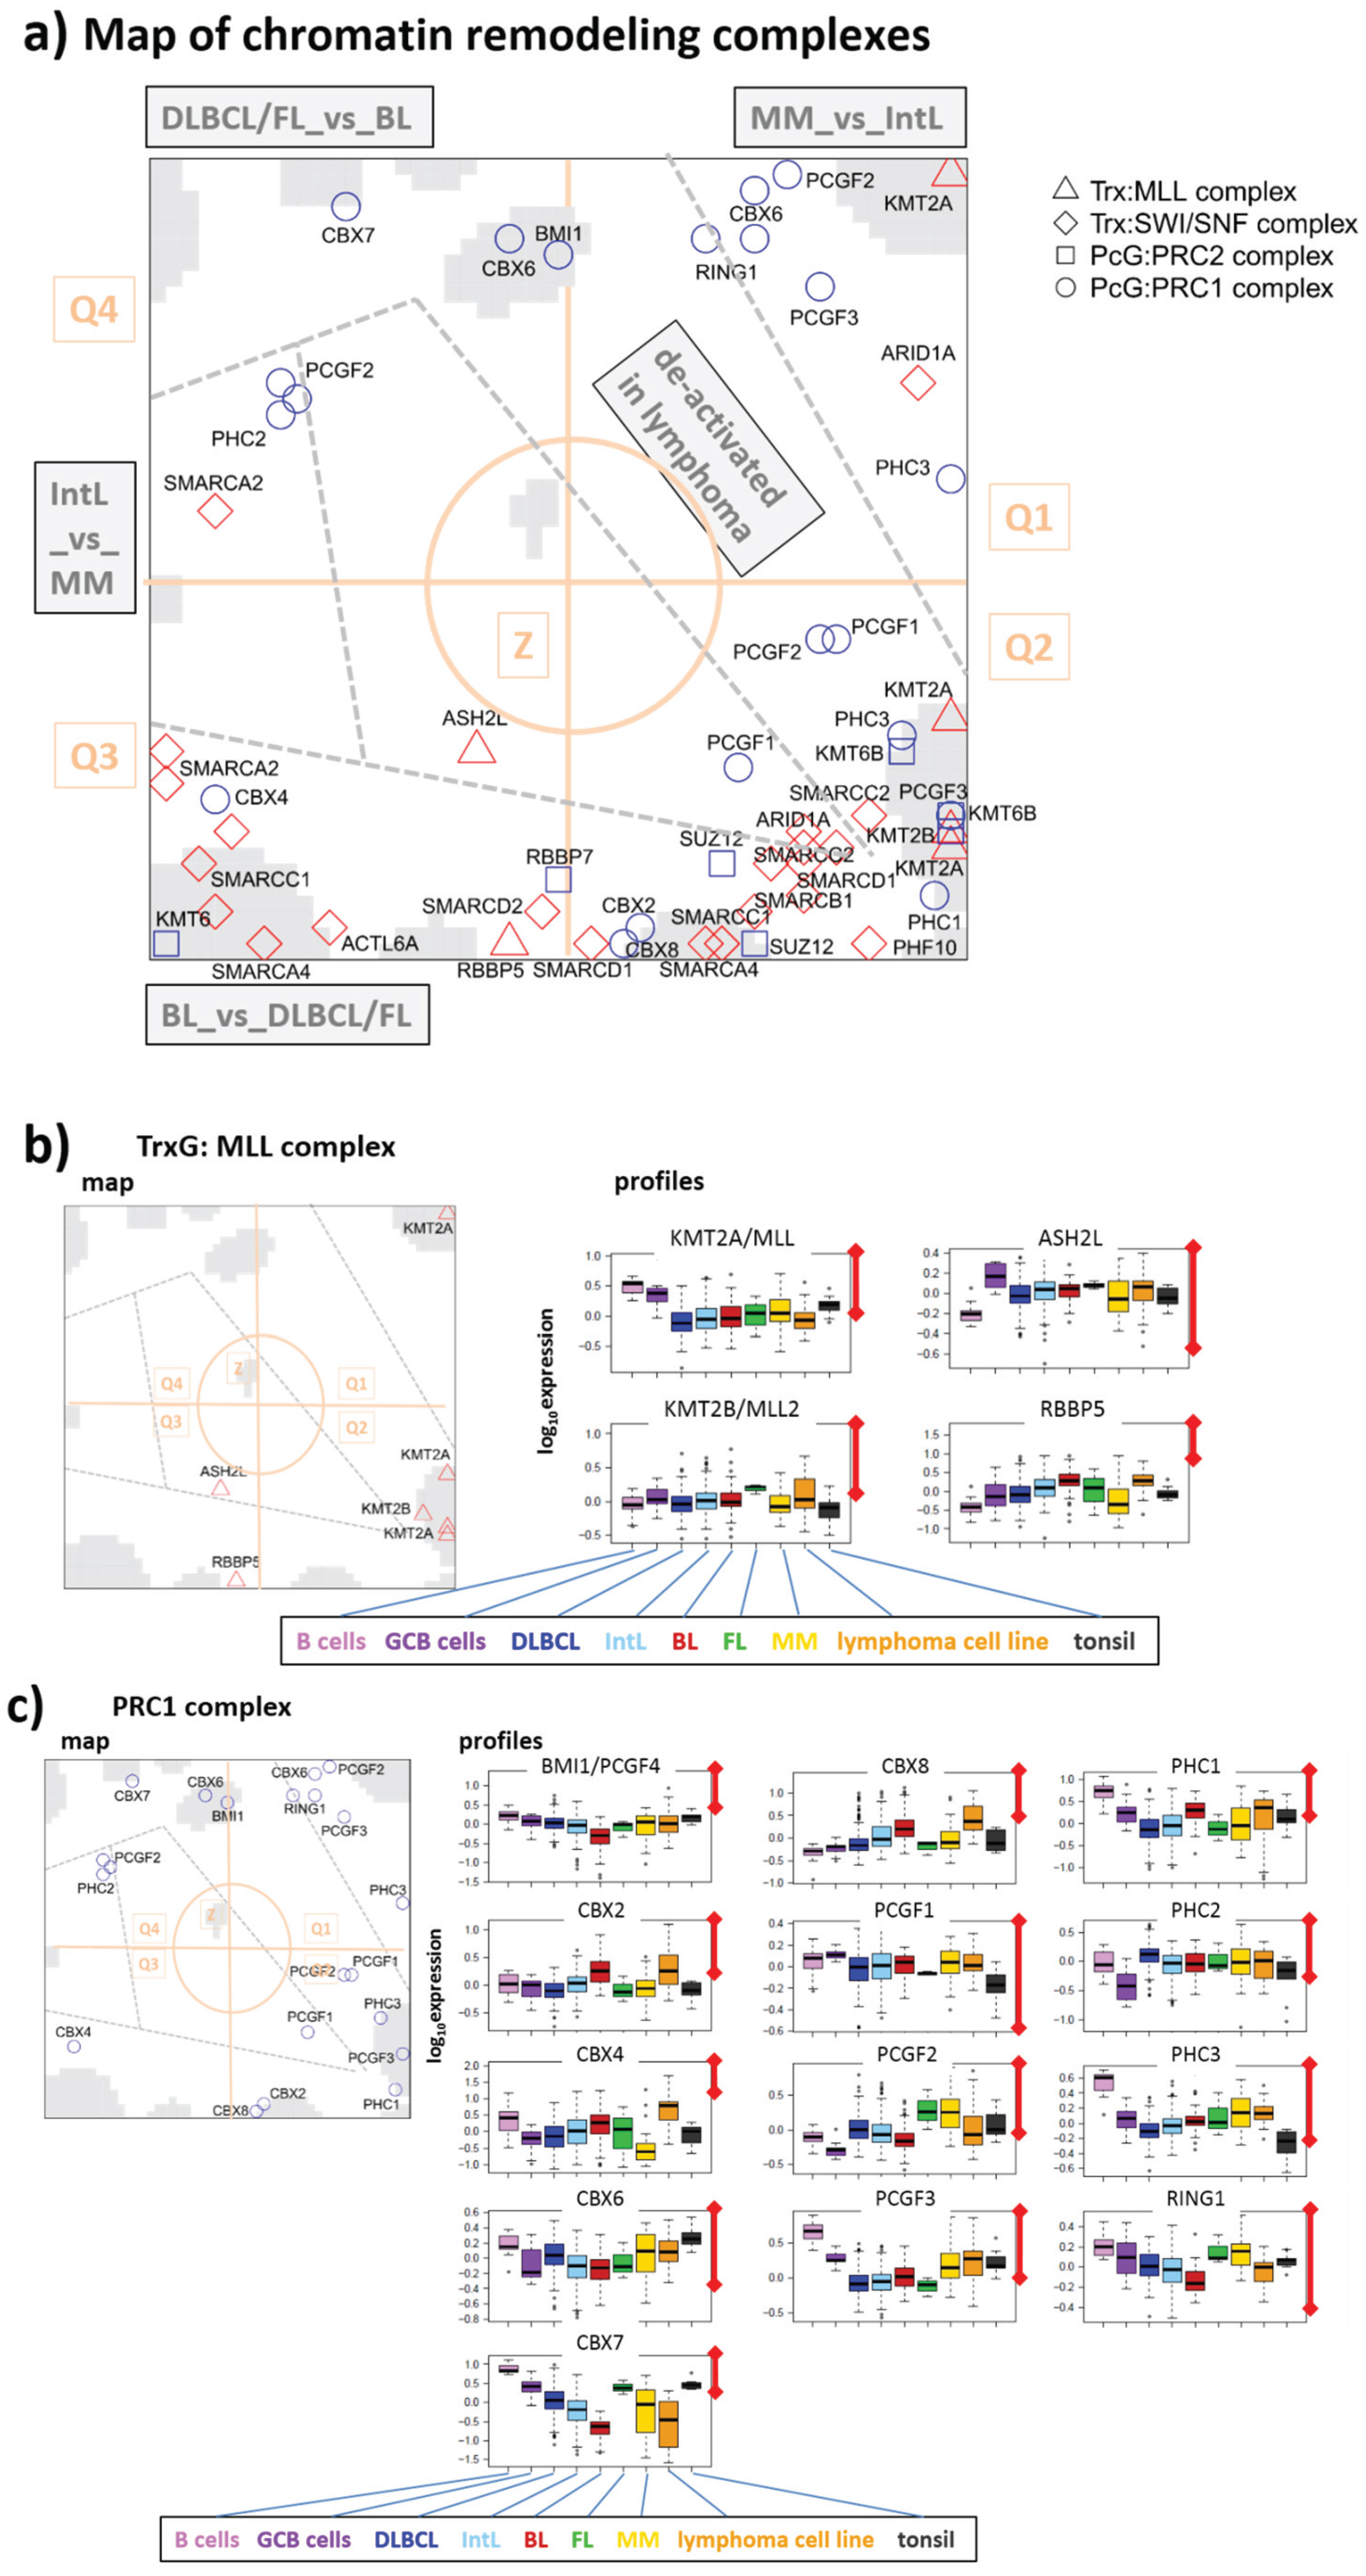
3.3.2. PRC1 Complex
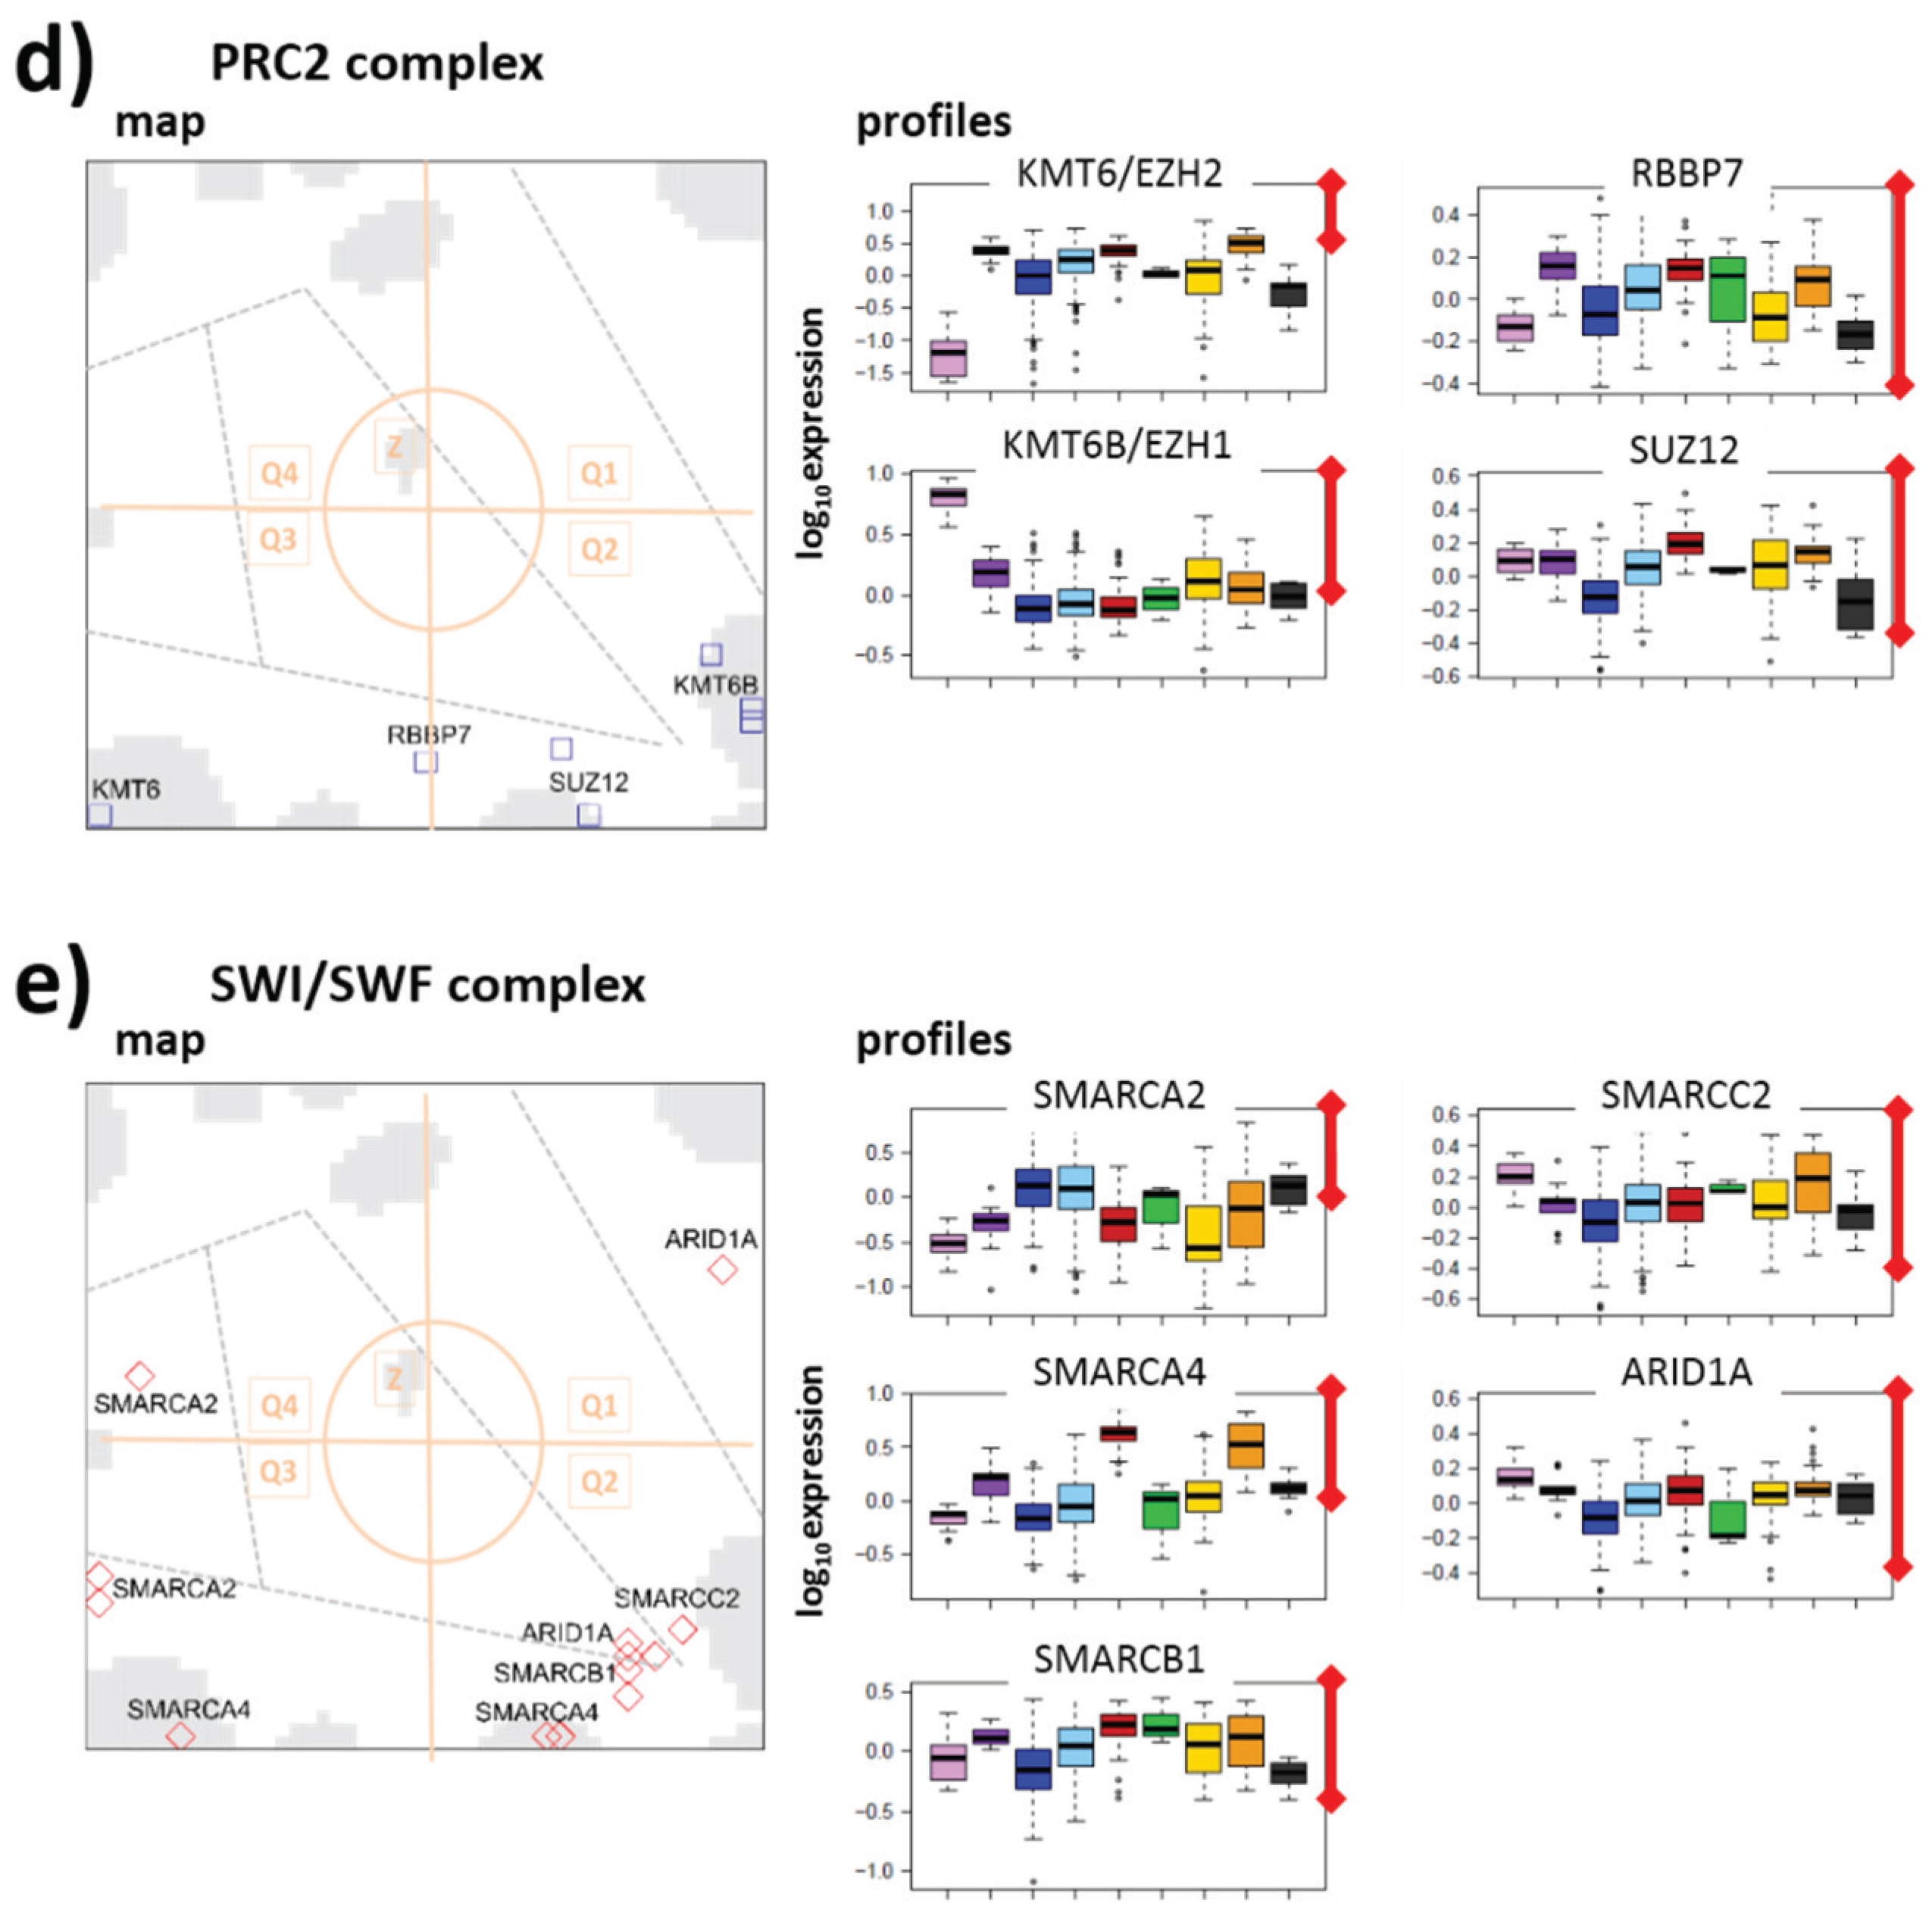
3.3.3. PRC2 Complex
3.3.4. SWI/SWF Complex
3.4. Energy Metabolism Couples with Epigenetics in Lymphoma?
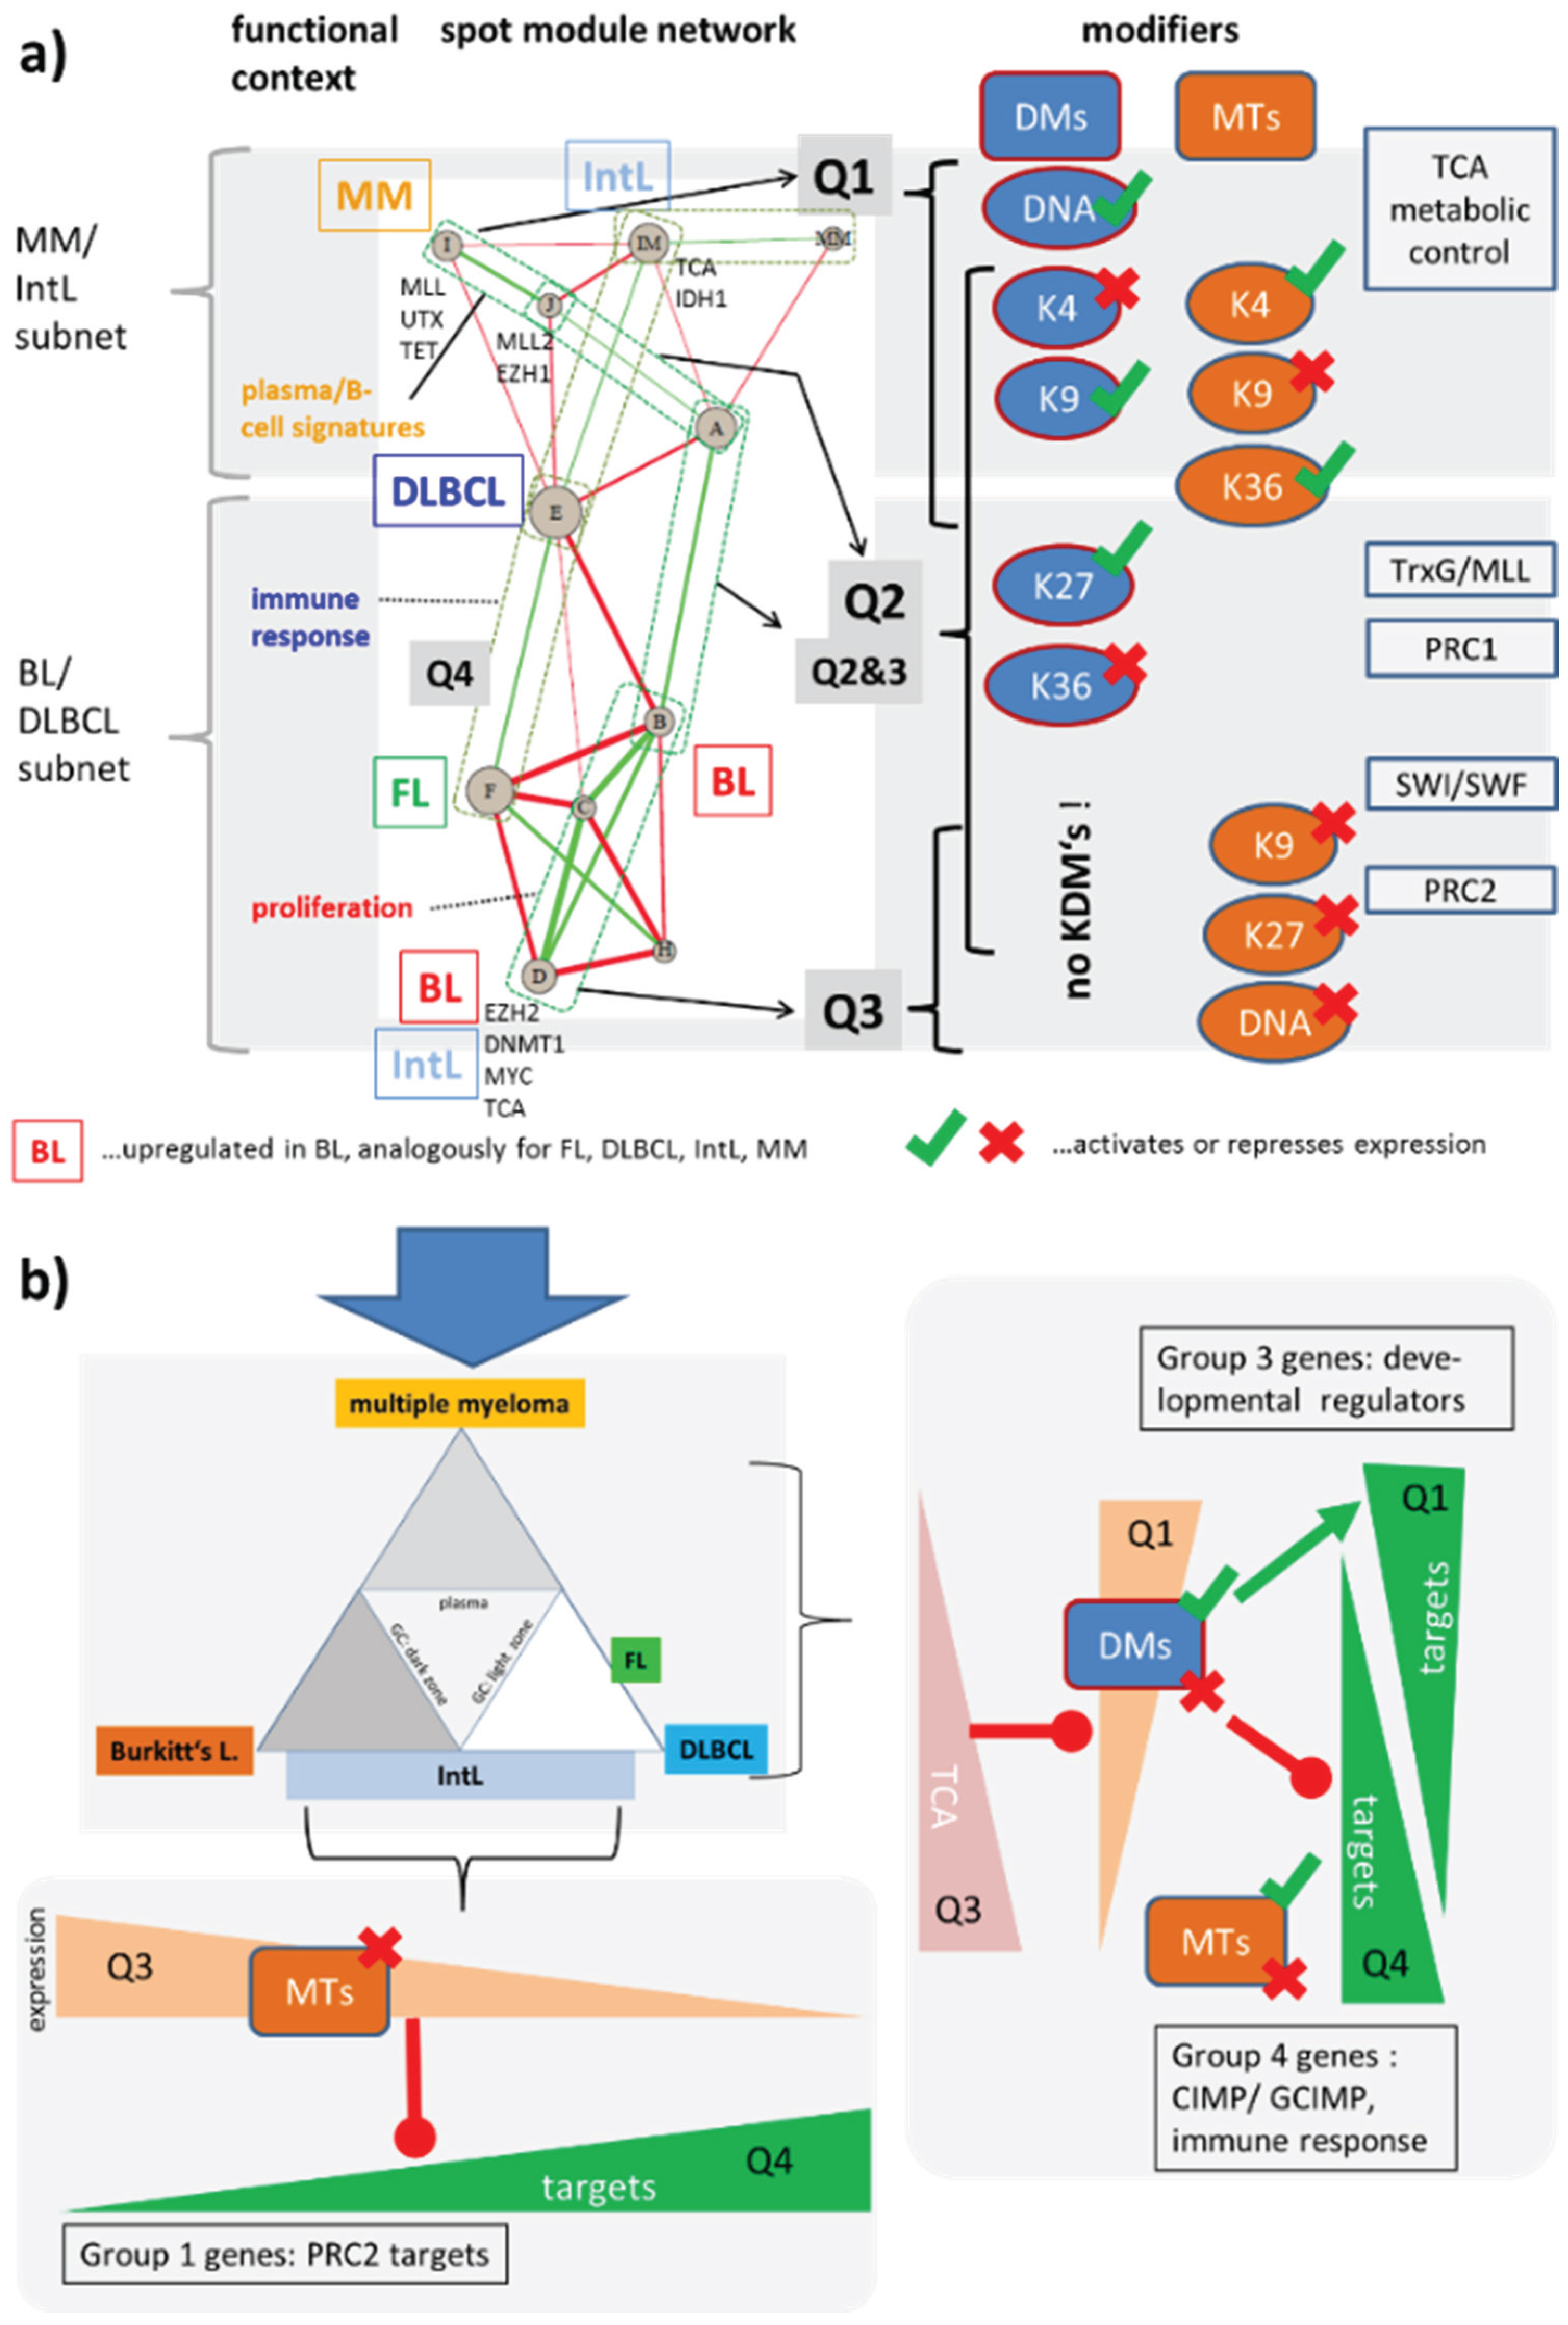
3.5. Deregulation of Epigenetic Modifiers Governs Heterogeneity of Lymphoma
3.5.1. Dysregulation of Epigenetic Writer-Eraser Equilibria Diminish Plasticity of B Cells during Maturation
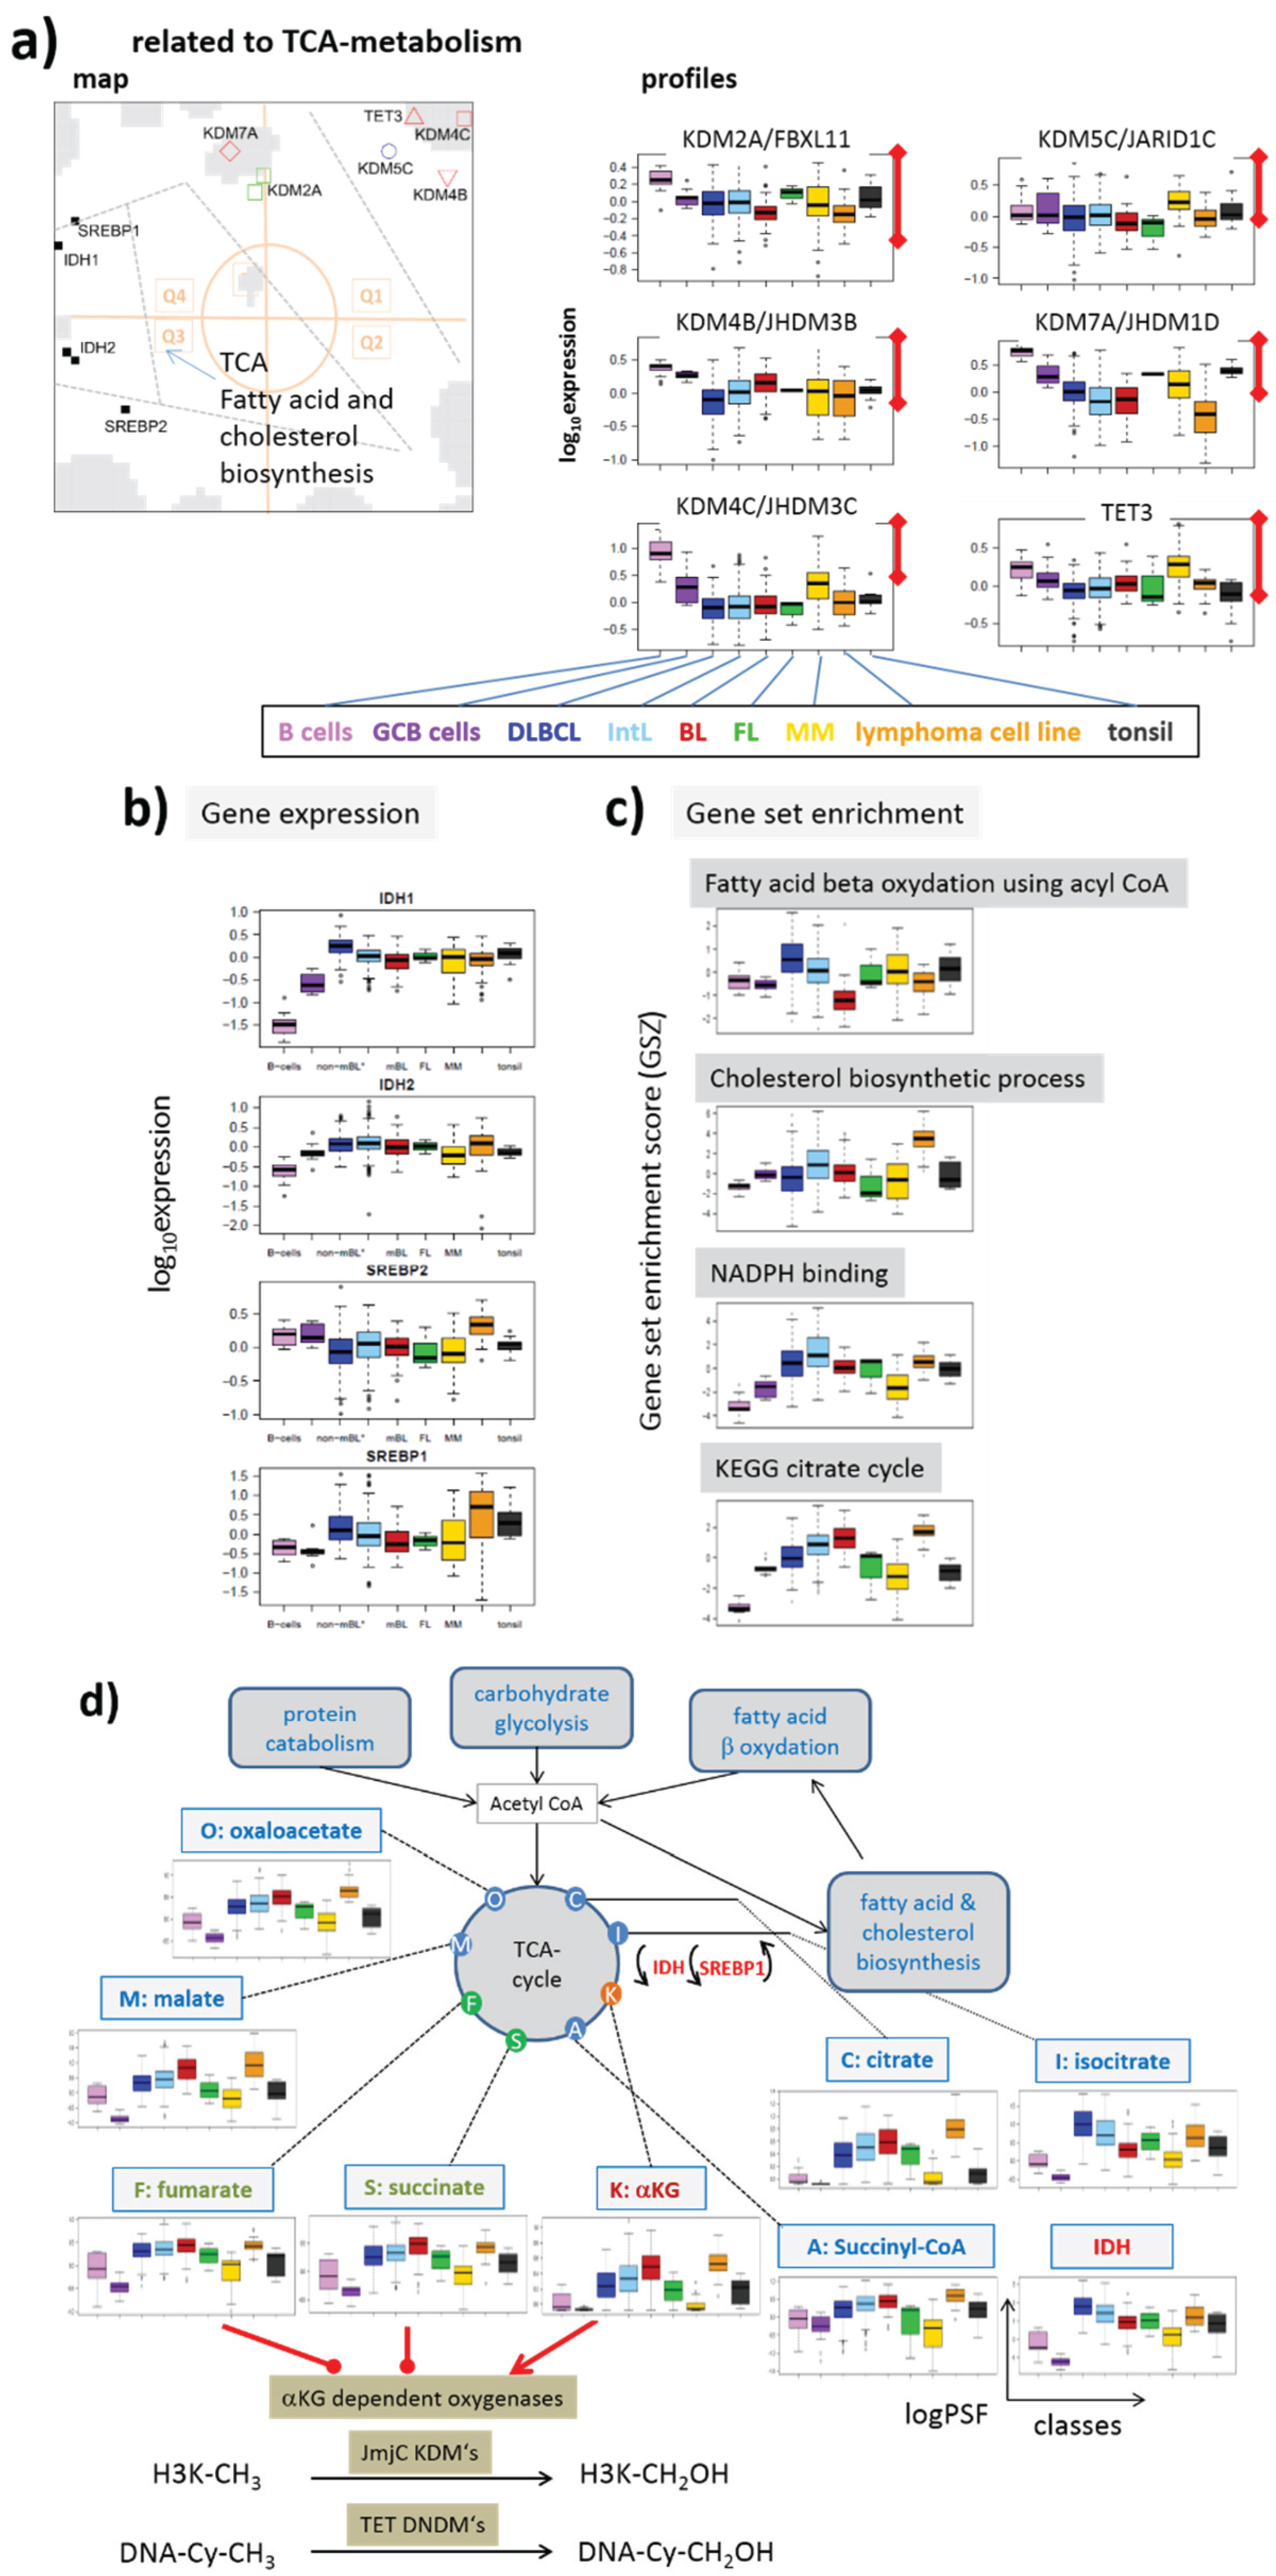
3.5.2. Activation of Gene Expression and of TCA Metabolism in Lymphoma Associates with Epigenetics
3.5.3. Asymmetric Activation of Methyl-Writers and -Erasers
4. Conclusions
Supplementary Files
Supplementary File 1Acknowledgments
Author Contributions
Conflicts of Interest
References
- Varier, R.A.; Timmers, H.T.M. Histone lysine methylation and demethylation pathways in cancer. Biochim. Biophys. Acta 2011, 1815, 75–89. [Google Scholar] [CrossRef] [PubMed]
- Sharma, S.; Kelly, T.K.; Jones, P.A. Epigenetics in cancer. Carcinogenesis 2010, 31, 27–36. [Google Scholar] [CrossRef] [PubMed]
- Noushmehr, H.; Weisenberger, D.J.; Diefes, K.; Phillips, H.S.; Pujara, K.; Berman, B.P.; Aldape, K. Identification of a CpG island methylator phenotype that defines a distinct subgroup of glioma. Cancer Cell 2010, 17, 510–522. [Google Scholar] [CrossRef] [PubMed]
- Chi, P.; Allis, C.D.; Wang, G.G. Covalent histone modifications—Miswritten, misinterpreted and mis-erased in human cancers. Nat. Rev. Cancer 2010, 10, 457–469. [Google Scholar] [CrossRef] [PubMed]
- Shaknovich, R.; Melnick, A. Epigenetics and B-cell Lymphoma. Curr. Opin. Hematol. 2011, 18, 293–299. [Google Scholar] [CrossRef] [PubMed]
- Hopp, L.; Wirth-Loeffler, H.; Binder, H. Epigenetic heterogeneity of B-cell lymphoma: DNA-methylation, gene expression and chromatin states. Genes 2015, 6, 812–840. [Google Scholar] [CrossRef] [PubMed]
- Hummel, M.; Bentink, S.; Berger, H.; Klapper, W.; Wessendorf, S.; Barth, T.F.E. The molecular mechanisms in malignant lymphomas network project of the Deutsche Krebshilfe a biologic definition of Burkitt’s lymphoma from transcriptional and genomic profiling. N. Engl. J. Med. 2006, 354, 2419–2430. [Google Scholar] [CrossRef] [PubMed]
- Martín-Subero, J.I.; Kreuz, M.; Bibikova, M.; Bentink, S.; Ammerpohl, O.; Wickham-Garcia, E.; Siebert, R. New insights into the biology and origin of mature aggressive B-cell lymphomas by combined epigenomic, genomic, and transcriptional profiling. Blood 2009, 113, 2488–2497. [Google Scholar] [CrossRef] [PubMed]
- Wirth, H.; Loeffler, M.; von Bergen, M.; Binder, H. Expression cartography of human tissues using self organizing maps. BMC Bioinform. 2011. [Google Scholar] [CrossRef] [PubMed]
- Hopp, L.; Lembcke, K.; Binder, H.; Wirth, H. Portraying the expression landscapes of B-cell lymphoma––Intuitive detection of outlier samples and of molecular subtypes. Biology 2013, 2, 1411–1437. [Google Scholar] [CrossRef] [PubMed]
- Hopp, L.; Wirth, H.; Fasold, M.; Binder, H. Portraying the expression landscapes of cancer subtypes: A glioblastoma multiforme and prostate cancer case study. Syst. Biomed. 2013, 1, 99–121. [Google Scholar] [CrossRef]
- Wirth-Loeffler, H.; Hopp, L.; Kreuz, M.; Siebert, R.; Loeffler, M.; Binder, H. A holistic view on the expression landscape of Germinal center-derived B-cell lymphomas. Unpublished data. 2015. [Google Scholar]
- Rosolowski, M.; Läuter, J.; Abramov, D.; Drexler, H.G.; Hummel, M.; Klapper, W.; Loeffler, M. Massive transcriptional perturbation in subgroups of diffuse large B-cell lymphomas. PLoS ONE 2013, 8, e76287. [Google Scholar] [CrossRef] [PubMed]
- Wirth-Loeffler, H.; Kalcher, M.; Binder, H. oposSOM: R-package for high-dimensional portraying of genome-wide expression landscapes on Bioconductor. Bioinformatics 2015, 31, 3225–3227. [Google Scholar] [CrossRef] [PubMed]
- Wirth, H.; von Bergen, M.; Binder, H. Mining SOM expression portraits: Feature selection and integrating concepts of molecular function. BioData Mining 2012. [Google Scholar] [CrossRef] [PubMed]
- Arakelyan, A. High-throughput Gene Expression Analysis Concepts and Applications. In Sequence and Genome Analysis II—Bacteria, Viruses and Metabolic Pathways; iConcept Press: Hong Kong, China, 2013. [Google Scholar]
- Arakelyan, A.; Nersisyan, L. KEGGParser: Parsing and editing KEGG pathway maps in Matlab. Bioinformatics 2013, 29, 518–519. [Google Scholar] [PubMed]
- Binder, H.; Wirth, H.; Arakelyan, A.; Lembcke, K.; Tiys, E.S.; Ivanishenko, V.; Larina, I.M. Time-course human urine proteomics in space-flight simulation experiments. BMC Genomics 2014. [Google Scholar] [CrossRef] [PubMed]
- Thomson, J.P.; Skene, P.J.; Selfridge, J.; Clouaire, T.; Guy, J.; Webb, S.; Bird, A. CpG islands influence chromatin structure via the CpG-binding protein Cfp1. Nature 2010, 464, 1082–1086. [Google Scholar] [CrossRef] [PubMed]
- Fujita, N.; Watanabe, S.; Ichimura, T.; Tsuruzoe, S.; Shinkai, Y.; Tachibana, M.; Nakao, M. Methyl-CpG binding domain 1 (MBD1) interacts with the Suv39h1-HP1 heterochromatic complex for DNA methylation-based transcriptional repression. J. Biol. Chem. 2003, 278, 24132–24138. [Google Scholar] [CrossRef] [PubMed]
- Feldman, N.; Gerson, A.; Fang, J.; Li, E.; Zhang, Y.; Shinkai, Y.; Bergman, Y. G9a-mediated irreversible epigenetic inactivation of Oct-3/4 during early embryogenesis. Nat. Cell Biol. 2006, 8, 188–194. [Google Scholar] [CrossRef] [PubMed]
- Ooi, S.K.T.; Qiu, C.; Bernstein, E.; Li, K.; Jia, D.; Yang, Z.; Bestor, T.H. DNMT3L connects unmethylated lysine 4 of histone H3 to de novo methylation of DNA. Nature 2007, 448, 714–717. [Google Scholar] [CrossRef] [PubMed]
- Hagarman, J.A.; Motley, M.P.; Kristjansdottir, K.; Soloway, P.D. Coordinate regulation of DNA methylation and H3K27me3 in mouse embryonic stem cells. PLoS ONE 2013, 8, e53880. [Google Scholar] [CrossRef] [PubMed]
- Liu, H.; Chen, Y.; Lv, J.; Liu, H.; Zhu, R.; Su, J.; Wu, Q. Quantitative epigenetic co-variation in CpG islands and co-regulation of developmental genes. Sci. Rep. 2013. [Google Scholar] [CrossRef] [PubMed]
- Köhler, C.; Villar, C.B.R. Programming of gene expression by Polycomb group proteins. Trends Cell Biol. 2008, 18, 236–243. [Google Scholar] [CrossRef] [PubMed]
- Klose, R.J.; Cooper, S.; Farcas, A.M.; Blackledge, N.P.; Brockdorff, N. Chromatin Sampling—An Emerging Perspective on Targeting Polycomb Repressor Proteins. PLoS Genet 2013, 9, e1003717. [Google Scholar] [CrossRef] [PubMed]
- Jeltsch, A.; Jurkowska, R.Z. New concepts in DNA methylation. Trends Biochem. Sci. 2014, 39, 310–318. [Google Scholar] [CrossRef] [PubMed]
- Schmitz, R.; Young, R.M.; Ceribelli, M.; Jhavar, S.; Xiao, W.; Zhang, M.; Staudt, L.M. Burkitt lymphoma pathogenesis and therapeutic targets from structural and functional genomics. Nature 2012, 490, 116–120. [Google Scholar] [CrossRef] [PubMed]
- Love, C.; Sun, Z.; Jima, D.; Li, G.; Zhang, J.; Miles, R.; Dave, S.S. The genetic landscape of mutations in Burkitt lymphoma. Nat. Genet 2012, 44, 1321–1325. [Google Scholar] [CrossRef] [PubMed]
- Sarris, M.; Nikolaou, K.; Talianidis, I. Context-specific regulation of cancer epigenomes by histone and transcription factor methylation. Oncogene 2014, 33, 1207–1217. [Google Scholar] [CrossRef] [PubMed]
- Shen, H.; Laird, P.W. Interplay between the cancer genome and epigenome. Cell 2013, 153, 38–55. [Google Scholar] [CrossRef] [PubMed]
- Vaqué, J.P.; Martínez, N.; Batlle-López, A.; Pérez, C.; Montes-Moreno, S.; Sánchez-Beato, M.; Piris, M.A. B-Cell Lymphoma Mutations: Improving Diagnostics and Enabling Targeted Therapies. Haematologica 2014, 99, 222–231. [Google Scholar] [CrossRef] [PubMed]
- Chung, Y.; Schatoff, E.; Abdel-Wahab, O. Epigenetic alterations in hematopoietic malignancies. Int. J. Hematol. 2012, 96, 413–427. [Google Scholar] [CrossRef] [PubMed]
- Morin, R.D.; Johnson, N.A.; Severson, T.M.; Mungall, A.J.; An, J.; Goya, R.; Marra, M.A. Somatic mutations altering EZH2 (Tyr641) in follicular and diffuse large B-cell lymphomas of germinal-center origin. Nat. Genet 2010, 42, 181–185. [Google Scholar] [CrossRef] [PubMed]
- Lund, K.; Adams, P.D.; Copland, M. EZH2 in normal and malignant hematopoiesis. Leukemia 2014, 28, 44–49. [Google Scholar] [CrossRef] [PubMed]
- Morin, R.D.; Mendez-Lago, M.; Mungall, A.J.; Goya, R.; Mungall, K.L.; Corbett, R.D.; Marra, M.A. Frequent mutation of histone-modifying genes in non-Hodgkin lymphoma. Nature 2011, 476, 298–303. [Google Scholar] [CrossRef] [PubMed]
- Sneeringer, C.J.; Scott, M.P.; Kuntz, K.W.; Knutson, S.K.; Pollock, R.M.; Richon, V.M.; Copeland, R.A. Coordinated activities of wild-type plus mutant EZH2 drive tumor-associated hypertrimethylation of lysine 27 on histone H3 (H3K27) in human B-cell lymphomas. Proc. Natl. Acad. Sci. USA 2010, 107, 20980–20985. [Google Scholar] [CrossRef] [PubMed]
- Xiao, M.; Yang, H.; Xu, W.; Ma, S.; Lin, H.; Zhu, H.; Guan, K.-L. Inhibition of α-KG-dependent histone and DNA demethylases by fumarate and succinate that are accumulated in mutations of FH and SDH tumor suppressors. Genes Dev. 2012, 26, 1326–1338. [Google Scholar] [CrossRef] [PubMed]
- Xu, W.; Yang, H.; Liu, Y.; Yang, Y.; Wang, P.; Kim, S.-H.; Xiong, Y. Oncometabolite 2-hydroxyglutarate is a competitive inhibitor of α-ketoglutarate-dependent dioxygenases. Cancer Cell 2011, 19, 17–30. [Google Scholar] [CrossRef] [PubMed]
- Shim, E.-H.; Livi, C.B.; Rakheja, D.; Tan, J.; Benson, D.; Parekh, V.; Sudarshan, S. L-2-hydroxyglutarate: An epigenetic modifier and putative oncometabolite in renal cancer. Cancer Discov. 2014, 4, 1290–1298. [Google Scholar] [CrossRef] [PubMed]
- Lu, C.; Ward, P.S.; Kapoor, G.S.; Rohle, D.; Turcan, S.; Abdel-Wahab, O.; Thompson, C.B. IDH mutation impairs histone demethylation and results in a block to cell differentiation. Nature 2012, 483, 474–478. [Google Scholar] [CrossRef] [PubMed]
- Reifenberger, G.; Weber, R.G.; Riehmer, V.; Kaulich, K.; Willscher, E.; Wirth, H.; for the German Glioma Network. Molecular characterization of long-term survivors of glioblastoma using genome- and transcriptome-wide profiling. Int. J. Cancer 2014, 135, 1822–1831. [Google Scholar] [CrossRef] [PubMed]
- Weller, M.; Weber, R.; Willscher, E.; Riehmer, V.; Hentschel, B.; Kreuz, M.; Reifenberger, G. Molecular classification of diffuse cerebral WHO grade II/III gliomas using genome- and transcriptome-wide profiling improves stratification of prognostically distinct patient groups. Acta Neuropathol. 2015, 129, 679–693. [Google Scholar] [CrossRef] [PubMed]
- Losman, J.-A.; Kaelin, W.G. What a difference a hydroxyl makes: Mutant IDH, (R)-2-hydroxyglutarate, and cancer. Genes Dev. 2013, 27, 836–852. [Google Scholar] [CrossRef] [PubMed]
- Zhang, J.; Grubor, V.; Love, C.L.; Banerjee, A.; Richards, K.L.; Mieczkowski, P.A.; Dave, S.S. Genetic heterogeneity of diffuse large B-cell lymphoma. Proc. Natl. Acad. Sci. USA 2013, 110, 1398–1403. [Google Scholar] [CrossRef] [PubMed]
- Yun, J.; Johnson, J.L.; Hanigan, C.L.; Locasale, J.W. Interactions between epigenetics and metabolism in cancers. Front. Oncol. 2012. [Google Scholar] [CrossRef] [PubMed]
- Caro, P.; Kishan, A.U.; Norberg, E.; Stanley, I.A.; Chapuy, B.; Ficarro, S.B.; Polak, K.; Tondera, D.; Gounarides, J.; Yin, H.; et al. Metabolic signatures uncover distinct targets in molecular subsets of diffuse large B cell lymphoma. Cancer Cell 2012, 22, 547–560. [Google Scholar] [CrossRef] [PubMed]
- Jakovcevski, M.; Akbarian, S. Epigenetic mechanisms in neurological disease. Nat. Med. 2012, 18, 1194–1204. [Google Scholar] [CrossRef] [PubMed]
- Shaknovich, R.; Cerchietti, L.; Tsikitas, L.; Kormaksson, M.; De, S.; Figueroa, M.E.; Melnick, A. DNA methyltransferase 1 and DNA methylation patterning contribute to germinal center B-cell differentiation. Blood 2011, 118, 3559–3569. [Google Scholar] [CrossRef] [PubMed]
- Jin, B.; Ernst, J.; Tiedemann, R.L.; Xu, H.; Sureshchandra, S.; Kellis, M.; Dalton, S.; Liu, C.; Choi, J.H.; Robertson, K.D. Linking DNA methyltransferases to epigenetic marks and nucleosome structure genome-wide in human tumor cells. Cell Rep. 2012, 2, 1411–1424. [Google Scholar] [CrossRef] [PubMed]
- Williams, K.; Christensen, J.; Helin, K. DNA methylation: TET proteins—Guardians of CpG islands? EMBO Rep. 2012, 13, 28–35. [Google Scholar] [CrossRef] [PubMed]
- Detich, N.; Theberge, J.; Szyf, M. Promoter-specific activation and demethylation by MBD2/demethylase. J. Biol. Chem. 2002, 277, 35791–35794. [Google Scholar] [CrossRef] [PubMed]
- Wang, G.G.; Konze, K.D.; Tao, J. Polycomb genes, miRNA, and their deregulation in B-cell malignancies. Blood 2015, 125, 1217–1225. [Google Scholar] [CrossRef] [PubMed]
- Caganova, M.; Carrisi, C.; Varano, G.; Mainoldi, F.; Zanardi, F.; Germain, P.-L.; Casola, S. Germinal center dysregulation by histone methyltransferase EZH2 promotes lymphomagenesis. J. Clin. Investig. 2013, 123, 5009–5022. [Google Scholar] [CrossRef] [PubMed]
- Béguelin, W.; Popovic, R.; Teater, M.; Jiang, Y.; Bunting, K.L.; Rosen, M.; Shen, H.; Yang, S.N.; Wang, L.; Ezponda, T.; et al. EZH2 is required for germinal center formation and somatic EZH2 mutations promote lymphoid transformation. Cancer Cell 2013, 23, 677–692. [Google Scholar] [CrossRef] [PubMed]
- Jiang, W.; Wang, J.; Zhang, Y. Histone H3K27me3 demethylases KDM6A and KDM6B modulate definitive endoderm differentiation from human ESCs by regulating WNT signaling pathway. Cell Res. 2013, 23, 122–130. [Google Scholar] [CrossRef] [PubMed]
- Swigut, T.; Wysocka, J. H3K27 Demethylases, at Long Last. Cell 2007, 131, 29–32. [Google Scholar] [CrossRef] [PubMed]
- De Santa, F.; Totaro, M.G.; Prosperini, E.; Notarbartolo, S.; Testa, G.; Natoli, G. The histone H3 lysine-27 demethylase Jmjd3 links inflammation to inhibition of polycomb-mediated gene silencing. Cell 2007, 130, 1083–1094. [Google Scholar] [CrossRef] [PubMed]
- De Santa, F.; Narang, V.; Yap, Z.H.; Tusi, B.K.; Burgold, T.; Austenaa, L.; Natoli, G. Jmjd3 contributes to the control of gene expression in LPS activated macrophages. EMBO J. 2009, 28, 3341–3352. [Google Scholar] [CrossRef] [PubMed]
- Son, J.; Shen, S.S.; Margueron, R.; Reinberg, D. Nucleosome-binding activities within JARID2 and EZH1 regulate the function of PRC2 on chromatin. Genes Dev. 2013, 27, 2663–2677. [Google Scholar] [CrossRef] [PubMed]
- Shen, X.; Liu, Y.; Hsu, Y.-J.; Fujiwara, Y.; Kim, J.; Mao, X.; Orkin, S.H. EZH1 Mediates Methylation on histone H3 Lysine 27 and complements EZH2 in maintaining stem cell identity and executing pluripotency. Mol. Cell 2008, 32, 491–502. [Google Scholar] [CrossRef] [PubMed]
- Margueron, R.; Li, G.; Sarma, K.; Blais, A.; Zavadil, J.; Woodcock, C.L.; Reinberg, D. Ezh1 and Ezh2 maintain repressive chromatin through different mechanisms. Mol. Cell 2008, 32, 503–518. [Google Scholar] [CrossRef] [PubMed]
- Henriquez, B.; Bustos, F.J.; Aguilar, R.; Becerra, A.; Simon, F.; Montecino, M.; van Zundert, B. Ezh1 and Ezh2 differentially regulate PSD-95 gene transcription in developing hippocampal neurons. Mol. Cell. Neurosci. 2013, 57, 130–143. [Google Scholar] [CrossRef] [PubMed]
- Beà, S.; Valdés-Mas, R.; Navarro, A.; Salaverria, I.; Martín-Garcia, D.; Jares, P.; Campo, E. Landscape of somatic mutations and clonal evolution in mantle cell lymphoma. Proc. Natl. Acad. Sci. USA 2013, 110, 18250–18255. [Google Scholar] [CrossRef] [PubMed]
- Zhang, J.; Jima, D.; Moffitt, A.B.; Liu, Q.; Czader, M.; Hsi, E.D.; Dave, S.S. The genomic landscape of mantle cell lymphoma is related to the epigenetically determined chromatin state of normal B cells. Blood 2014, 123, 2988–2996. [Google Scholar] [CrossRef] [PubMed]
- Martinez-Garcia, E.; Popovic, R.; Min, D.-J.; Sweet, S.M.M.; Thomas, P.M.; Zamdborg, L.; Licht, J.D. The MMSET histone methyl transferase switches global histone methylation and alters gene expression in t(4;14) multiple myeloma cells. Blood 2011, 117, 211–220. [Google Scholar] [CrossRef] [PubMed]
- Pasqualucci, L.; Trifonov, V.; Fabbri, G.; Ma, J.; Rossi, D.; Chiarenza, A.; Dalla-Favera, R. Analysis of the coding genome of diffuse large B-cell lymphoma. Nat. Genet 2011, 43, 830–837. [Google Scholar] [CrossRef] [PubMed]
- Gindin, T.; Murty, V.; Alobeid, B.; Bhagat, G. MLL/KMT2A translocations in diffuse large B-cell lymphomas. Hematol. Oncol. 2014. [Google Scholar] [CrossRef] [PubMed]
- Chen, L.-B.; Xu, J.-Y.; Yang, Z.; Wang, G.-B. Silencing SMYD3 in hepatoma demethylates RIZI promoter induces apoptosis and inhibits cell proliferation and migration. World J. Gastroenterol. 2007, 13, 5718–5724. [Google Scholar] [CrossRef] [PubMed]
- Kidder, B.; Hu, G.; Zhao, K. KDM5B focuses H3K4 methylation near promoters and enhancers during embryonic stem cell self-renewal and differentiation. Genome Biol. 2014. [Google Scholar] [CrossRef] [PubMed]
- Wang, G.G.; Song, J.; Wang, Z.; Dormann, H.L.; Casadio, F.; Li, H.; Allis, C.D. Haematopoietic malignancies caused by dysregulation of a chromatin-binding PHD finger. Nature 2009, 459, 847–851. [Google Scholar] [CrossRef] [PubMed]
- Zoabi, M.; Nadar-Ponniah, P.T.; Khoury-Haddad, H.; Usaj, M.; Budowski-Tal, I.; Haran, T.; Ayoub, N. RNA-dependent chromatin localization of KDM4D lysine demethylase promotes H3K9me3 demethylation. Nucl. Acids Res. 2014. [Google Scholar] [CrossRef] [PubMed]
- Berry, W.L.; Janknecht, R. KDM4/JMJD2 histone demethylases: Epigenetic regulators in cancer cells. Cancer Res. 2013, 73, 2936–2942. [Google Scholar] [CrossRef] [PubMed]
- Gregory, B.L.; Cheung, V.G. Natural variation in the histone demethylase, KDM4C, influences expression levels of specific genes including those that affect cell growth. Genome Res. 2014, 24, 52–63. [Google Scholar] [CrossRef] [PubMed]
- Bartke, T.; Vermeulen, M.; Xhemalce, B.; Robson, S.C.; Mann, M.; Kouzarides, T. Nucleosome-interacting proteins regulated by DNA and histone methylation. Cell 2010, 143, 470–484. [Google Scholar] [CrossRef] [PubMed]
- Wagner, E.J.; Carpenter, P.B. Understanding the language of Lys36 methylation at histone H3. Nat. Rev. Mol. Cell Biol. 2012, 13, 115–126. [Google Scholar] [CrossRef] [PubMed]
- Pai, C.-C.; Deegan, R.S.; Subramanian, L.; Gal, C.; Sarkar, S.; Blaikley, E.J.; Humphrey, T.C. A histone H3K36 chromatin switch coordinates DNA double-strand break repair pathway choice. Nat. Commun. 2014. [Google Scholar] [CrossRef] [PubMed]
- Pfister, S.X.; Ahrabi, S.; Zalmas, L.-P.; Sarkar, S.; Aymard, F.; Bachrati, C.Z.; Humphrey, T.C.; Legube, G.; la Thangue, N.B.; Porter, A.C.; et al. SETD2-dependent histone H3K36 trimethylation is required for homologous recombination repair and genome stability. Cell Rep. 2014, 7, 2006–2018. [Google Scholar] [CrossRef] [PubMed]
- Slany, R.K. The molecular biology of mixed lineage leukemia. Haematologica 2009, 94, 984–993. [Google Scholar] [CrossRef] [PubMed]
- Patel, A.; Dharmarajan, V.; Vought, V.E.; Cosgrove, M.S. On the mechanism of multiple lysine methylation by the human mixed lineage leukemia protein-1 (MLL1) core complex. J. Biol. Chem. 2009, 284, 24242–24256. [Google Scholar] [CrossRef] [PubMed]
- Steward, M.M.; Lee, J.-S.; O’Donovan, A.; Wyatt, M.; Bernstein, B.E.; Shilatifard, A. Molecular regulation of H3K4 trimethylation by ASH2L, a shared subunit of MLL complexes. Nat. Struct. Mol. Biol. 2006, 13, 852–854. [Google Scholar] [CrossRef] [PubMed]
- Cao, F.; Chen, Y.; Cierpicki, T.; Liu, Y.; Basrur, V.; Lei, M.; Dou, Y. An Ash2L/RbBP5 heterodimer stimulates the MLL1 methyltransferase activity through coordinated substrate interactions with the MLL1 SET domain. PLoS ONE 2010, 5, e14102. [Google Scholar] [CrossRef] [PubMed]
- Vincenz, C.; Kerppola, T.K. Different polycomb group CBX family proteins associate with distinct regions of chromatin using nonhomologous protein sequences. Proc. Natl. Acad. Sci. USA 2008, 105, 16572–16577. [Google Scholar] [CrossRef] [PubMed]
- Gao, Z.; Zhang, J.; Bonasio, R.; Strino, F.; Sawai, A.; Parisi, F.; Reinberg, D. PCGF homologs, CBX proteins, and RYBP define functionally distinct PRC1 family Complexes. Mol. Cell 2012, 45, 344–356. [Google Scholar] [CrossRef] [PubMed]
- Pasini, D.; Bracken, A.P.; Hansen, J.B.; Capillo, M.; Helin, K. The polycomb group protein Suz12 is required for embryonic stem cell differentiation. Mol. Cell. Biol. 2007, 27, 3769–3779. [Google Scholar] [CrossRef] [PubMed]
- Tang, L.; Nogales, E.; Ciferri, C. Structure and function of SWI/SNF chromatin remodeling complexes and mechanistic implications for transcription. Prog. Biophys. Mol. Biol. 2010, 102, 122–128. [Google Scholar] [CrossRef] [PubMed]
- Hendricks, K.B.; Shanahan, F.; Lees, E. Role for BRG1 in cell cycle control and tumor suppression. Mol. Cell. Biol. 2004, 24, 362–376. [Google Scholar] [CrossRef] [PubMed]
- Espenshade, P.J. SREBPs: Sterol-regulated transcription factors. J. Cell Sci. 2006, 119, 973–976. [Google Scholar] [CrossRef] [PubMed]
- Shechter, I.; Dai, P.; Huo, L.; Guan, G. IDH1 gene transcription is sterol regulated and activated by SREBP-1a and SREBP-2 in human hepatoma HepG2 cells: Evidence that IDH1 may regulate lipogenesis in hepatic cells. J. Lipid Res. 2003, 44, 2169–2180. [Google Scholar] [CrossRef] [PubMed]
- Fragola, G.; Germain, P.-L.; Laise, P.; Cuomo, A.; Blasimme, A.; Gross, F.; Testa, G. Cell reprogramming requires silencing of a core subset of polycomb targets. PLoS Genet. 2013, 9, e1003292. [Google Scholar] [CrossRef] [PubMed]
- Chen, S.; Shi, Y. A new horizon for epigenetic medicine? Cell Res. 2013, 23, 326–328. [Google Scholar] [CrossRef] [PubMed]
- Nie, Z.; Hu, G.; Wei, G.; Cui, K.; Yamane, A.; Resch, W.; Levens, D. c-Myc Is a Universal amplifier of expressed genes in lymphocytes and embryonic stem cells. Cell 2012, 151, 68–79. [Google Scholar] [CrossRef] [PubMed]
- Rahl, P.B.; Lin, C.Y.; Seila, A.C.; Flynn, R.A.; McCuine, S.; Burge, C.B.; Young, R.A. c-Myc regulates transcriptional pause release. Cell 2010, 141, 432–445. [Google Scholar] [CrossRef] [PubMed]
© 2015 by the authors; licensee MDPI, Basel, Switzerland. This article is an open access article distributed under the terms and conditions of the Creative Commons Attribution license (http://creativecommons.org/licenses/by/4.0/).
Share and Cite
Hopp, L.; Nersisyan, L.; Löffler-Wirth, H.; Arakelyan, A.; Binder, H. Epigenetic Heterogeneity of B-Cell Lymphoma: Chromatin Modifiers. Genes 2015, 6, 1076-1112. https://doi.org/10.3390/genes6041076
Hopp L, Nersisyan L, Löffler-Wirth H, Arakelyan A, Binder H. Epigenetic Heterogeneity of B-Cell Lymphoma: Chromatin Modifiers. Genes. 2015; 6(4):1076-1112. https://doi.org/10.3390/genes6041076
Chicago/Turabian StyleHopp, Lydia, Lilit Nersisyan, Henry Löffler-Wirth, Arsen Arakelyan, and Hans Binder. 2015. "Epigenetic Heterogeneity of B-Cell Lymphoma: Chromatin Modifiers" Genes 6, no. 4: 1076-1112. https://doi.org/10.3390/genes6041076
APA StyleHopp, L., Nersisyan, L., Löffler-Wirth, H., Arakelyan, A., & Binder, H. (2015). Epigenetic Heterogeneity of B-Cell Lymphoma: Chromatin Modifiers. Genes, 6(4), 1076-1112. https://doi.org/10.3390/genes6041076